issn no. 2349-7165 foreign direct investment and its ...unnayan.ipsacademy.org/v9/12.pdf · 115...
TRANSCRIPT
115
ISSN No. 2349-7165
UNNAYAN : International Bulletin of Management and EconomicsVolume - IX | July 2018
Foreign Direct Investment and its Growth in BRICS Nations
Aditi TongiaRsearch Scholar,
School of Economics, DAVV, Indore
Kanhaiya AhujaProfessor,
School of Economics, DAVV, Indore
ABSTRACT
BRICS a prominent group of world's emerging countries,propounded by Jim O Neill of Goldman Sachs,
proved itself as most favoured investment destination of World. China and India being leader in
group,then followed by South Africa, Brazil and Russia.FDI's are the major source of financing
developmental projects as well as for rapid economic growth of developing countries. FDI is a type of
non-debt finance for long period which benefits host as well as home nations. The present study focuses
on trends of FDI in BRICS as a combined group and as individual countries, with special consideration of
India during a period of 2000-2015. The study also highlights the sectorial composition of FDI and major
source countries. Pre and post formation period growth of FDI in BRICS is also studied. The study is
based on secondary data collected from official sites of respective countries, UNCTAD, IMF, World Bank
and RBI.
Introduction
A foreign direct investment is one of the major reasons for making India as fastest and promising
economy. Itnot only helped in developing infrastructure but also enhanced the growth rates of Indian
economy. China and South Africa's growth is also driven by robust FDI inflows. As per the World
Investment Report (2011), all the emerging economies attracted more than half of global FDI inflows in
the year 2010 (a phase when whole world was under severe economic recession). For attracting
investments from World, these economies have suitable financial, political and legal environment with
sound macroeconomicinfrastructure. This is the reason why these emerging economies attracted the
interest of whole world. The high and stable growth during the recession as compared to the low growth
of developed nations, it is considered that these emerging economies will exceed developed nations and
will become world new economic powers.
IMF and OECD defines FDI in terms of “Direct investor” and “Direct investment enterprise” A direct
investor may be an individual, an incorporated or unincorporated private or public enterprise, a
government, a group of related individuals, or a group of related incorporated and/or unincorporated
enterprises which have a direct investment enterprise, operating in a country other than the country of
residence of the direct investor. A direct investment enterprise is an incorporated or unincorporated
enterprise in which a foreign investor owns 10 per cent or more of the ordinary shares or voting power of
an incorporated enterprise or the equivalent of an unincorporated enterprise. Direct investment enterprises
may be subsidiaries, associates or branches that could establish in the foreign country

116
ISSN No. 2349-7165
UNNAYAN : International Bulletin of Management and EconomicsVolume - IX | July 2018
Foreign Direct Investment and its Growth in BRICS Nations
Importance of FDI
FDI is important for emerging countries as they normally suffers from lack of capital to finance their
infrastructure projects which foreign investments cover up by getting a non-debt inflow of funds. It
bridges the gap between saving and investment in an economy.Foreign investors gain by increasing their
market base, exploiting untapped resources and lower cost of production. Basically it is an investment
which generates income for their home country.With economic transformation of almost all BRICS and
ease in policies for foreign investments, investor's interests are boosted with support of infrastructure and
positive business spirits.
For the host nation, it improves competition of domestic entrepreneurs, gives higher opportunities for
exports, increase the product base of consumers and generating employment opportunities with higher
compensation to households. Exchange of technological, operational and management skills and
promotion of innovation and R&D in turn improve the human capital and work culture. With all these
factors and economies of large scale production, efficiency improves which leads low cost higher
production. Huge inflow of funds leads to injections as investments in economy, which with multiplier
effect increases the national income.
Due to these reasons, countries offer many incentives to the foreign investors like tariffConcessions, tax
holidays, R&D support, infrastructure improvements, financialsubsidies, low tax rates, special economic
zones, liberalised imports for development of infrastructure and machinery etc.
Review of Literature
A study on FDI in India for period of 2000-2015 byVyas, A.V.(2015) reveals that Mauritius is dominant
FDI contributor of India in mainly service sector because of DTAA (double taxation avoidance
agreement). Considerable FDI is also cited in construction and development field. Paper compared the
pre and post liberalisation phase of India with regard to needs , strengths and weakness of India for
attracting FDI.
Rajeswari, G.R.&Akilandeswari,K.(2012) examines the benefits of FDI in home and host country with
reference to India. India being a developing economy need funds, as domestic savings are not sufficient
for development. After liberalisation (1991) and revision of FDI policy in 2005, India is attracting a lot of
FDI's in almost all sectors. Paper analysed all sectors which attracted FDI from 1991-2014, that reveals
service sector as a major sector getting maximum FDI's. Apart from service sector, after 2005
construction, housing and real estate have escalating flows of FDI's in India.
FDI growth in all four BRICnations during recession is stable whencompared to developed nations as
analysed by Paula, N.(2011). Due to this, it is expected that they will exceed the developed nations and
become new world economic powers. With the data analysis it is seen that during recession period FDI
and GDP growth of developed nations falls steeply whereas of emerging economies doesn't fall much.
FDI inflows in BRIC showed a phenomenal growth even during the recession period. A study made 2001-
2011 on FDI inflows of BRIC, studied the percentage of World's FDI flow to BRICs, sectorial
composition and India's position among other BRIC's. Mathipurani, V. B.(2014) concluded that China
leads the group which is immune to global recession. China outperformed with right pattern of sectorial
flows, especially in manufacturing. Brazil and Russia had a fair growth in different spheres wherein
Brazil's main inflow is in primary sector. Indian FDI inflows are mainly in tertiary sector and some in
manufacturing sector whereas in primary sector it is minimal. To improve FDI inflows, as per the paper
117
ISSN No. 2349-7165
UNNAYAN : International Bulletin of Management and EconomicsVolume - IX | July 2018
Foreign Direct Investment and its Growth in BRICS Nations
India shouldbalance its BOP trade, legal protection, business regulation for foreign investors etc... India
has a better scope to become most favoured destination still it lacks in volume and rate of growth of FDI
inflows.
Baskaran, A.&Muchie, M.(2008) examined the emerging sectors of BRICS for attracting international
R&D (research and development) flows as FDI's in these economies. Paper also examines the external
and internal factors which are responsible for attracting FDI's in R&D, which helps in enhancing national
productive system and maintain competitiveness in globalised world. Especially in India and China, not
only volume of FDI flow as R&D but complexity and higher value added is increased in recent past
which is due to strong NIS (national innovation system). The paper argued that R&D international flows
is directly related with country's NIS. The paper after examining all the instruments and conceptual
aspects concluded that China has strongest NIS hence attracted highest inflow of R&D in FDI. And on
contrast South Africa has weakest NIS and lowest FDI. For India, development of standalone R&D
centres has helped in attracting FDI in this sector.
Indian growth in FDI during 2001-02 to 2013-14 is being analysedby Sood,N.(2015), which confirmed
that the highest contribution is from service sector and dominant source is Mauritius (due to DTAA i.e.
double tax avoidance agreement which accounts 36.25% of total FDI from world during this period).
Government under its “Make in India” project has provided many incentives in different areas such as
insurance, banking, finance, transport, communication, health , tourism, education , IT , management,
engineering, etc.... which led the 46% approximate growth in FDI during the period of 2013-2014 in
service sector. Due to the unique traits of Indian 3D's as discussed in paper, i.e. Democracy, Demography
and Demand , it is able to attract the FDI from rest of the World which has a significant impact on GDP
but insignificant on investments in FII.
An exploratory study based on secondary data, focussed on problems and issues that made India less
attractive destination for FDI inflow as compared to other emerging economies. Bedi, P. &Kharbanda,
E.(2014)studied the recent trends and also recommended many policy reformations for India. Also it is
assessed that FDI inflows in India has changed the composition sector wise as well has country wise.
Service sector has taken a lion's share in total FDI coming to India which is mainly because of superior IT
technology and highly skilled low cost labour. Major share of FDI are coming from Mauritius, Singapore,
Japan, Netherlands and UK. The major problems faced by India for attracting FDI inflows as listed in
paper are – high competition from emerging economies specially China, weak infrastructures (mainly
transport and power facilities), complex tax structure, rigid and restrictive labour laws, red tapism and
corruption. As recommendations in paper adoption of GST as single taxation, liberalising FDI policies,
restructuring labour laws, improvement in infrastructure mainly ports, roads etc ... is suggested.
Jadhav, P.(2012) explored various economic, political and institutional variables which determines FDI
inflows in BRICS countries and their respective weightings. Unit root test and multiple regression model
are applied and it is deduced that economic factors are more important than political and institutional. The
various variables examined are – market size , trade openness, natural resources as economic
determinants and macroeconomic stability (inflation rate), political stability/no violence, government
effectiveness, regulatory quality, control of corruption, voice and accountability, rule of law as potential
institutional and political determinants for FDI , for a period of 10 years (2000-2009).
Narender & Devi (2015) summarised the potential macro economic variables that determine FDI inflows
in developing nations. Developing nations always strive for more foreign direct investments in order to
finance their capital requirements as domestic savings are always deficient. Paper discussed market size (

118
ISSN No. 2349-7165
UNNAYAN : International Bulletin of Management and EconomicsVolume - IX | July 2018
Foreign Direct Investment and its Growth in BRICS Nations
measured by GDP), economic stability and growth, lesser labour cost , better infrastructure, openness in
trade, high gross capital formation and currency value are positively related to FDI inflows in BRICS
countries. Paper recommended that BRICS countries should enhance their bilateral trade like other
trading blocks and pool their resources to compete with developed nations.
Prakash, A.P. & Kumar, S.G. (2017) used econometric models to overview various macroeconomic
variables and their impact on FDI inflows in BRICS countries. It is a descriptive and analytical study
based on secondary data that used FDI inflows in BRICS, market size (measured as market
capitalisation), Gross Domestic product, gross capital formation, labour cost, trade openness, real
effective exchange rate and inflation rate. It is observed that Gross Capital formation and trade openness
have uni-directional casual impact on FDI of BRICS. Market size (based on listed companies), inflation,
gross capital formation, trade openness and labour cost have positive co integration and prominent
indicator of FDI of BRICS nations .The study suggest that market size of BRICS countries should be
increased by listing more companies in international stock exchange market and labour cost should be
rationalized in BRICS nations which are comparatively high.
A study on “Causal Relationship between Foreign Direct Investment and Growth Evidence from BRICS
Countries” by Sridharan,P. ,Vijayakumar, N. &Chandra,K. S. (2009) found that growth leads FDI bi-
directionally for Brazil, Russia and South Africa but FDI leads growth uni-directionally for China and
India. Under this study industrial production index is used to indicate growth, as FDI leads to
development in productivity in host country. It is also mentioned that the characteristics and policy of host
country determines the net FDI flows. The period under the study was till 2007 for all BRICS, starting
from 1996 for Brazil, 1994 for Russia, 1992 India and 1999 for China and South Africa.
Agrawal, G.(2015)examined the co-integration and causality analysis at panel level on secondary data
for a period of 1989-2012. The paper concluded that there exists a positive long run correlation between
economic growth and foreign direct investments. It is further confirmed that there is long run
bidirectional causality between FDI and economic growth, that means FDI is stimulated by economic
growth and economic growth is enhanced by FDI.
Since BRICS nations are absorbing major share of FDI of World's total inflows it attracted the interest of
many scholars for research. After examining various work done on FDI of BRICS nations, it is felt that
study on comparison on FDI inflows in BRICS countries from pre formation BRICS period and post
formation of BRICS period is essential. The present study will emphasis on sectorial composition and
major investing partners of BRICS nations.
Objective
1. To study inward and outward flow of FDI (foreign direct investment) in BRICS countries.
2. To analyze the growth of FDI in pre and post formation period of BRICS.
3. To study the sectorial composition of FDI inflows in BRICS nations.
4. To identify the major investing partners in BRICS nations.
Research methodology
An attempt is made to study the outflow and inflow of FDI in BRICS nations (stock and flow variables).
The sectorial composition of FDI inflows and the source nations of such inflows are also determined.The
119
ISSN No. 2349-7165
UNNAYAN : International Bulletin of Management and EconomicsVolume - IX | July 2018
Foreign Direct Investment and its Growth in BRICS Nations
growth rate is also determined for FDI inflows of individual BRICS nations by calculating Compounded
Average Growth Rate.
The time frame set for the study is 15 years i.e. from 2000 to 2015. The main emphasis is given to period
since when BRICS came into official existence i.e. 2009. The data used is secondary in nature and major
source used are UNCTAD and World Bank databases along with respective nations official data sites. In
this study FDI inwards and outwards of BRICS nations are regressed with time for calculating CAGR
(compounded average growth rate). Then the growth rate in foreign direct investment in pre and post
formation period of BRICS is calculated. Hence, establishment of BRICS i.e.2009is taken as a break
period. PRE formation period is taken from 2002 to 2008 and Post formation period as 2009 to 2014 is
regressed with time for calculating CAGR (compounded average growth rate).
logY = á + â T + µt 1
CAGR = (Antilog â -1) * 1001
Here,
Log Y is dependent variable that is total FDI for BRICS nationt
T represents time
á is intercept
â is annual growth rate or year coefficient1
µ error or residual term
Further in study Compounded Average Growth rate of FDI inflows of all BRICS nations individually is
assessed. Wherein FDI inwards of Brazil, Russia, India, China and South Africa is regressed with time.
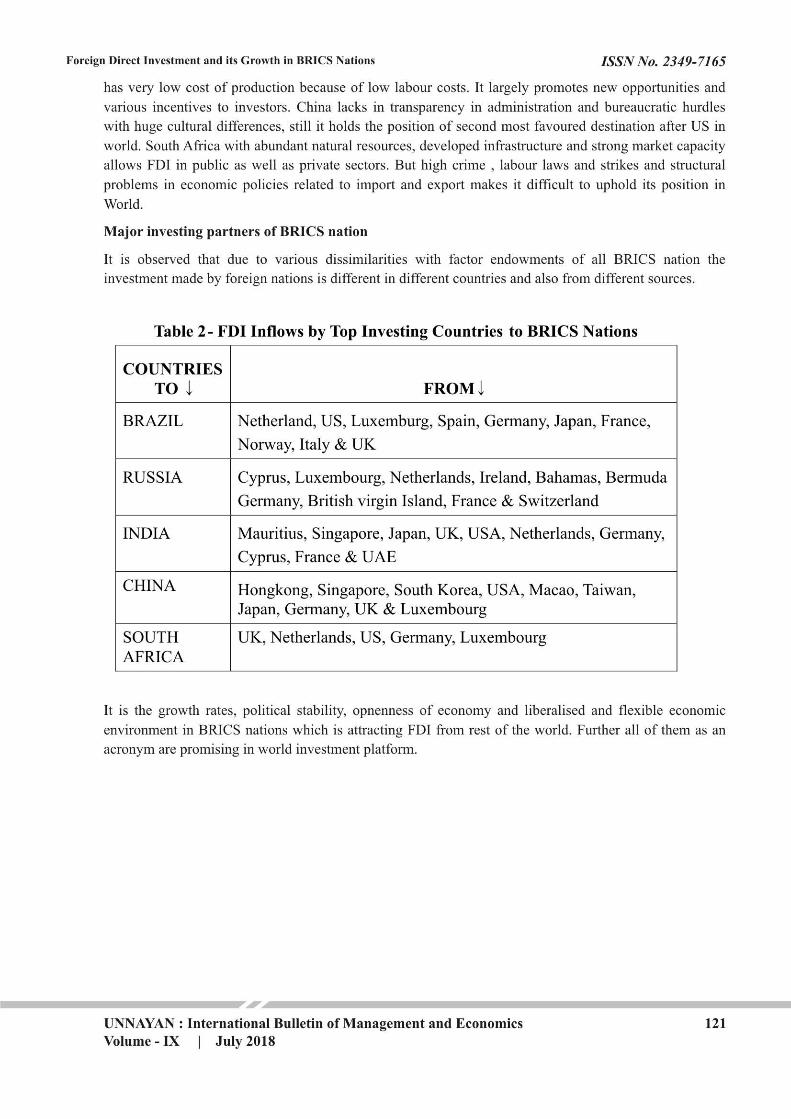
Flow of FDI in BRICS
All the five nations of BRICS have an estimated US$4 trillion as combined foreign reserves. Among these
China is most favoured FDI destination followed by India on second rank as per the recent survey by
UNCTAD. FDI inflows in BRICS countries are most prominent even during recession period, especially
in China. China leads the group and it has maximum FDI inflow in manufacturing sector and moderate in
primary sector. Brazil has prominent primary sector FDI's and considerable tertiary sector. FDI inflow in
Russia is manufacturing based whereas in Indiait is mainly tertiarysector.India has a huge highly skilled
low cost manpower which is a blessing for such MNE's. India has better opportunities but due to its legal
framework and policies it lack in becoming the most favoured destination.
120 UNNAYAN : International Bulletin of Management and EconomicsVolume - IX | July 2018
ISSN No. 2349-7165Foreign Direct Investment and its Growth in BRICS Nations
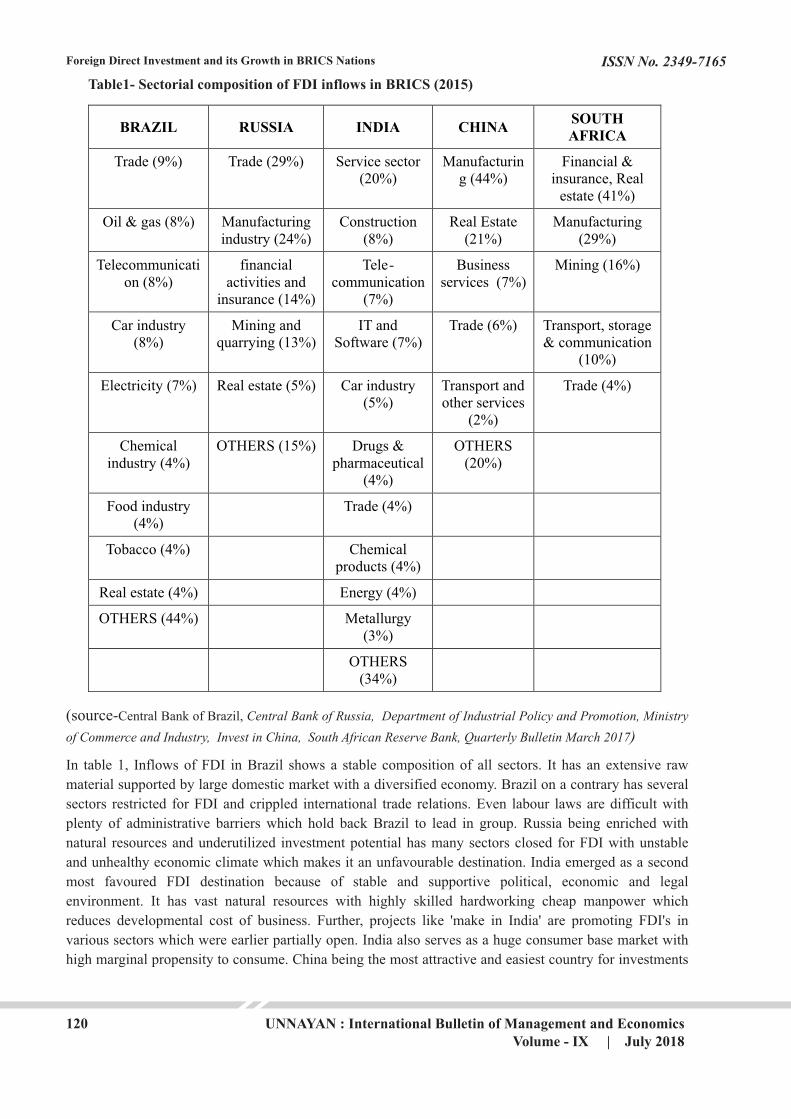
Table1- Sectorial composition of FDI inflows in BRICS (2015)
BRAZIL
RUSSIA
INDIA
CHINA
SOUTH AFRICA
Trade (9%)
Trade (29%)
Service sector (20%)
Manufacturing (44%)
Financial & insurance, Real
estate (41%)
Oil & gas (8%)
Manufacturing industry (24%)
Construction (8%)
Real Estate (21%)
Manufacturing (29%)
Telecommunication (8%)
financial activities and
insurance (14%)
Tele-communication
(7%)
Business services (7%)
Mining (16%)
Car industry (8%)
Mining and quarrying (13%)
IT and Software (7%)
Trade (6%)
Transport, storage & communication
(10%)
Electricity (7%)
Real estate (5%)
Car industry (5%)
Transport and other services
(2%)
Trade (4%)
Chemical industry (4%)
OTHERS (15%)
Drugs & pharmaceutical
(4%)
OTHERS (20%)
Food industry (4%)
Trade (4%)
Tobacco (4%)
Chemical products (4%)
Real estate (4%)
Energy (4%)
OTHERS (44%)
Metallurgy (3%)
OTHERS (34%)
(source-Central Bank of Brazil, Central Bank of Russia, Department of Industrial Policy and Promotion, Ministry
of Commerce and Industry, Invest in China, South African Reserve Bank, Quarterly Bulletin March 2017)
In table 1, Inflows of FDI in Brazil shows a stable composition of all sectors. It has an extensive raw
material supported by large domestic market with a diversified economy. Brazil on a contrary has several
sectors restricted for FDI and crippled international trade relations. Even labour laws are difficult with
plenty of administrative barriers which hold back Brazil to lead in group. Russia being enriched with
natural resources and underutilized investment potential has many sectors closed for FDI with unstable
and unhealthy economic climate which makes it an unfavourable destination. India emerged as a second
most favoured FDI destination because of stable and supportive political, economic and legal
environment. It has vast natural resources with highly skilled hardworking cheap manpower which
reduces developmental cost of business. Further, projects like 'make in India' are promoting FDI's in
various sectors which were earlier partially open. India also serves as a huge consumer base market with
high marginal propensity to consume. China being the most attractive and easiest country for investments
122
ISSN No. 2349-7165
UNNAYAN : International Bulletin of Management and EconomicsVolume - IX | July 2018
Foreign Direct Investment and its Growth in BRICS Nations
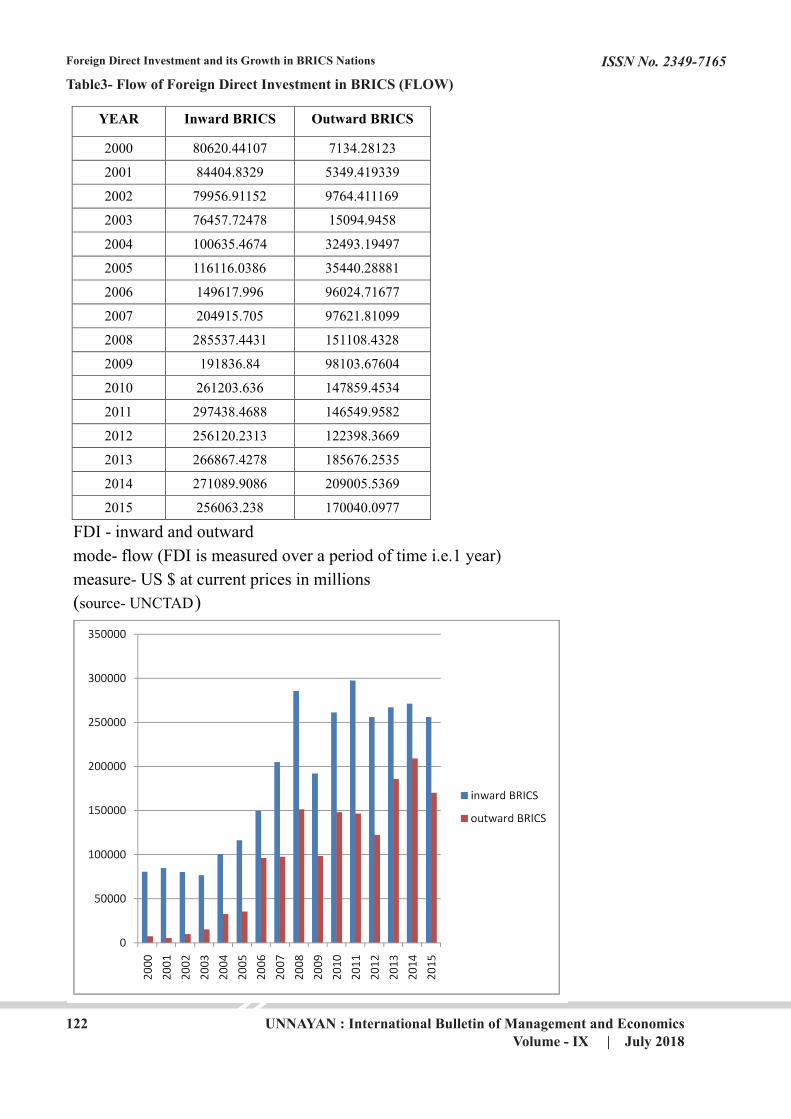
Table3- Flow of Foreign Direct Investment in BRICS (FLOW)
YEAR Inward BRICS Outward BRICS
2000
80620.44107 7134.28123
2001
84404.8329
5349.419339
2002
79956.91152
9764.411169
2003
76457.72478
15094.9458
2004
100635.4674
32493.19497
2005
116116.0386
35440.28881
2006
149617.996
96024.71677
2007
204915.705
97621.81099
2008
285537.4431
151108.4328
2009
191836.84
98103.67604
2010
261203.636
147859.4534
2011
297438.4688
146549.9582
2012 256120.2313 122398.3669
2013 266867.4278 185676.2535
2014 271089.9086 209005.5369
2015 256063.238 170040.0977
FDI - inward and outward mode- flow (FDI is measured over a period of time i.e.1 year) measure- US $ at current prices in millions (source-
UNCTAD)
123
ISSN No. 2349-7165
UNNAYAN : International Bulletin of Management and EconomicsVolume - IX | July 2018
Foreign Direct Investment and its Growth in BRICS Nations
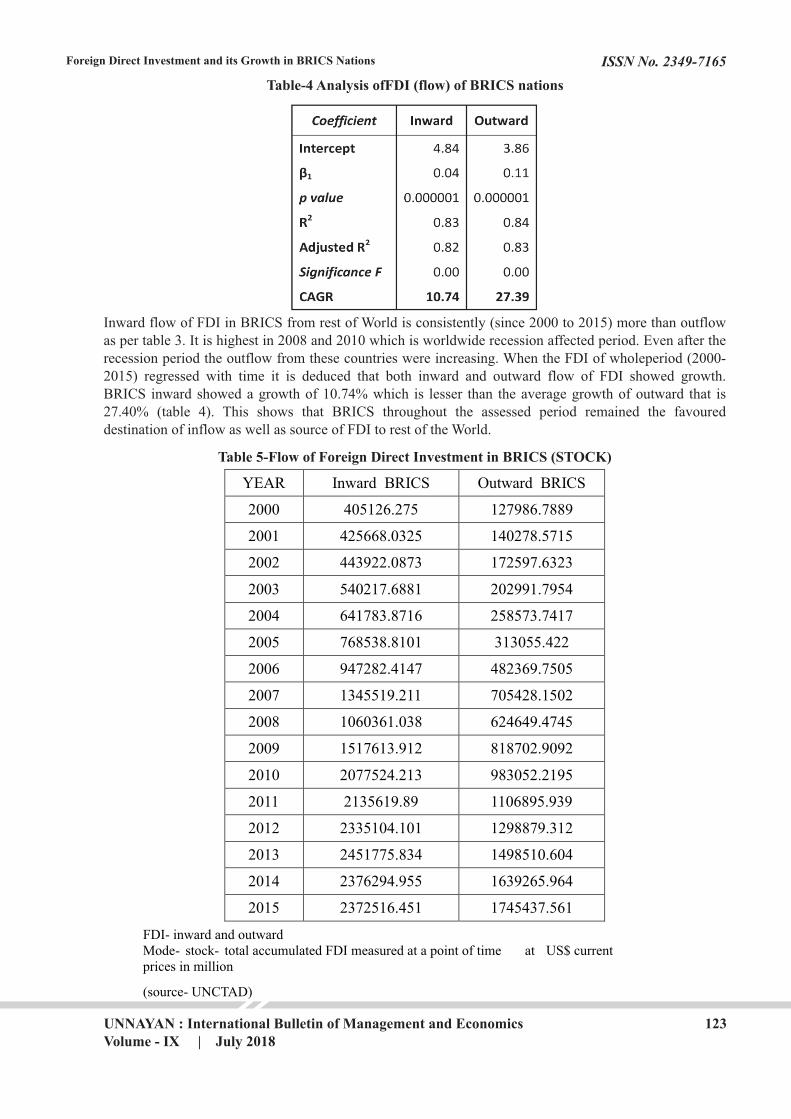
Table-4 Analysis ofFDI (flow) of BRICS nations
Inward flow of FDI in BRICS from rest of World is consistently (since 2000 to 2015) more than outflow as per table 3. It is highest in 2008 and 2010 which is worldwide recession affected period. Even after the recession period the outflow from these countries were increasing. When the FDI of wholeperiod (2000-2015) regressed with time it is deduced that both inward and outward flow of FDI showed growth. BRICS inward showed a growth of 10.74% which is lesser than the average growth of outward that is 27.40% (table 4). This shows that BRICS throughout the assessed period remained the favoured destination of inflow as well as source of FDI to rest of the World.
Table 5-Flow of Foreign Direct Investment in BRICS (STOCK)
YEAR Inward BRICS Outward BRICS
2000 405126.275 127986.7889
2001 425668.0325 140278.5715
2002 443922.0873
172597.6323
2003 540217.6881
202991.7954
2004 641783.8716
258573.7417
2005 768538.8101
313055.422
2006 947282.4147
482369.7505
2007 1345519.211
705428.1502
2008 1060361.038
624649.4745
2009 1517613.912
818702.9092
2010 2077524.213
983052.2195
2011 2135619.89
1106895.939
2012 2335104.101
1298879.312
2013 2451775.834
1498510.604
2014 2376294.955
1639265.964
2015 2372516.451 1745437.561
FDI- inward and outward Mode- stock- total accumulated FDI measured at a point of time at US$ current prices in million
(source- UNCTAD)

124
ISSN No. 2349-7165
UNNAYAN : International Bulletin of Management and EconomicsVolume - IX | July 2018
Foreign Direct Investment and its Growth in BRICS Nations
FDI stock of BRICS nation (table5&6) depicted growth during the period under study with some shocks
at 2008 downturn times. In the above analysis FDI (stock) of BRICS is regressed with time 2000-2015
which showed a growth of 15% Inward FDI stocks and about 21% growth of outward FDI stock. Inward
stock is always higher than outward but the difference as seen in graph is increasing which shows that
FDI inwards is increasing at an increasing rate as compared to outward stock of FDI. Even at the
meltdown period (2008-2009), a slight downfall is seen which is regained in 2010 with a record high
inward FDI's.
Since BRICS came into existence in 2009, it is taken as break period and 7 years from 2002- 2008 (period
before formation of BRICS) and 2009-2015 (period after BRICS) is regressed with time taking FDI
inflows and outflows as dependent variable. The pre and post growth of BRICS outward and inward is
explained in table 7.
125
ISSN No. 2349-7165
UNNAYAN : International Bulletin of Management and EconomicsVolume - IX | July 2018
Foreign Direct Investment and its Growth in BRICS Nations
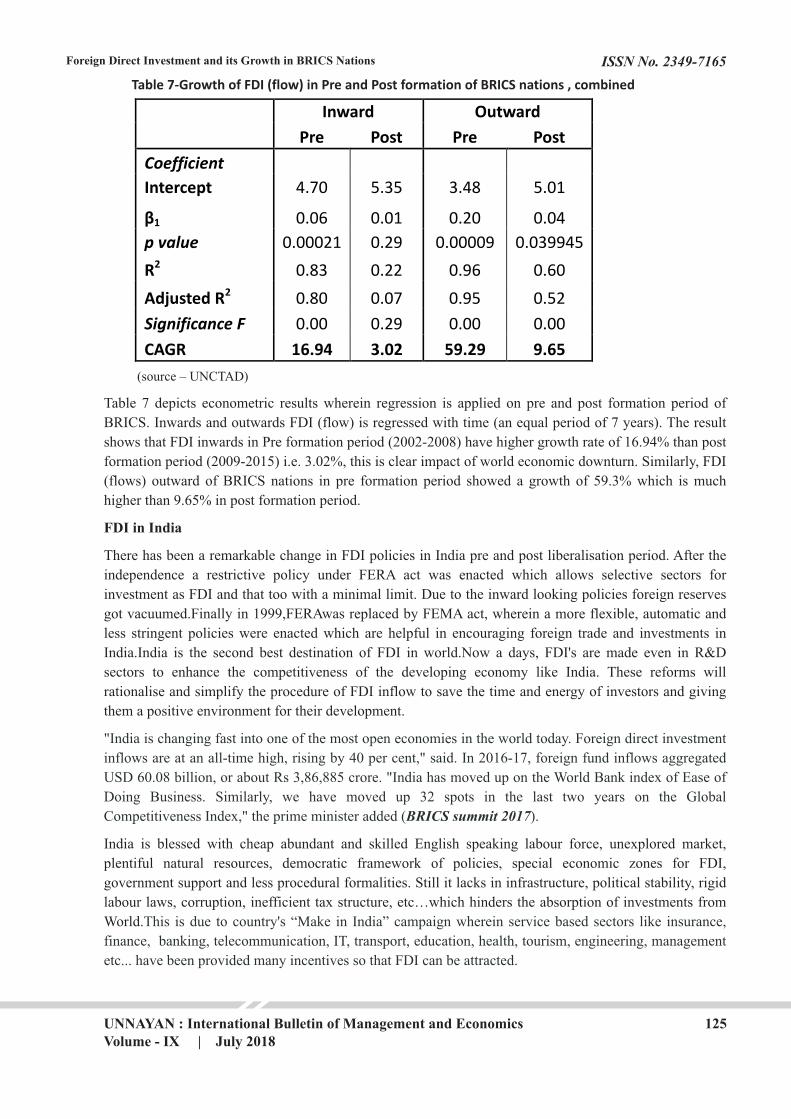
Table 7-Growth of FDI (flow) in Pre and Post formation of BRICS nations , combined
Inward Outward
Pre Post Pre Post
Coefficient Intercept 4.70 5.35 3.48 5.01
â1 0.06 0.01 0.20 0.04
p value 0.00021 0.29 0.00009 0.039945
R2 0.83 0.22 0.96 0.60
Adjusted R2 0.80 0.07 0.95 0.52
Significance F 0.00 0.29 0.00 0.00
CAGR 16.94 3.02 59.29 9.65
(source – UNCTAD)
Table 7 depicts econometric results wherein regression is applied on pre and post formation period of
BRICS. Inwards and outwards FDI (flow) is regressed with time (an equal period of 7 years). The result
shows that FDI inwards in Pre formation period (2002-2008) have higher growth rate of 16.94% than post
formation period (2009-2015) i.e. 3.02%, this is clear impact of world economic downturn. Similarly, FDI
(flows) outward of BRICS nations in pre formation period showed a growth of 59.3% which is much
higher than 9.65% in post formation period.
FDI in India
There has been a remarkable change in FDI policies in India pre and post liberalisation period. After the
independence a restrictive policy under FERA act was enacted which allows selective sectors for
investment as FDI and that too with a minimal limit. Due to the inward looking policies foreign reserves
got vacuumed.Finally in 1999,FERAwas replaced by FEMA act, wherein a more flexible, automatic and
less stringent policies were enacted which are helpful in encouraging foreign trade and investments in
India.India is the second best destination of FDI in world.Now a days, FDI's are made even in R&D
sectors to enhance the competitiveness of the developing economy like India. These reforms will
rationalise and simplify the procedure of FDI inflow to save the time and energy of investors and giving
them a positive environment for their development.
India is blessed with cheap abundant and skilled English speaking labour force, unexplored market,
plentiful natural resources, democratic framework of policies, special economic zones for FDI,
government support and less procedural formalities. Still it lacks in infrastructure, political stability, rigid
labour laws, corruption, inefficient tax structure, etc…which hinders the absorption of investments from
World.
"India is changing fast into one of the most open economies in the world today. Foreign direct investment
inflows are at an all-time high, rising by 40 per cent," said. In 2016-17, foreign fund inflows aggregated
USD 60.08 billion, or about Rs 3,86,885 crore. "India has moved up on the World Bank index of Ease of
Doing Business. Similarly, we have moved up 32 spots in the last two years on the Global
Competitiveness Index," the prime minister added (BRICS summit 2017).
This is due to country's “Make in India” campaign wherein service based sectors like insurance,
finance, banking, telecommunication, IT, transport, education, health, tourism, engineering, management
etc... have been provided many incentives so that FDI can be attracted.
126
ISSN No. 2349-7165
UNNAYAN : International Bulletin of Management and EconomicsVolume - IX | July 2018
Foreign Direct Investment and its Growth in BRICS Nations
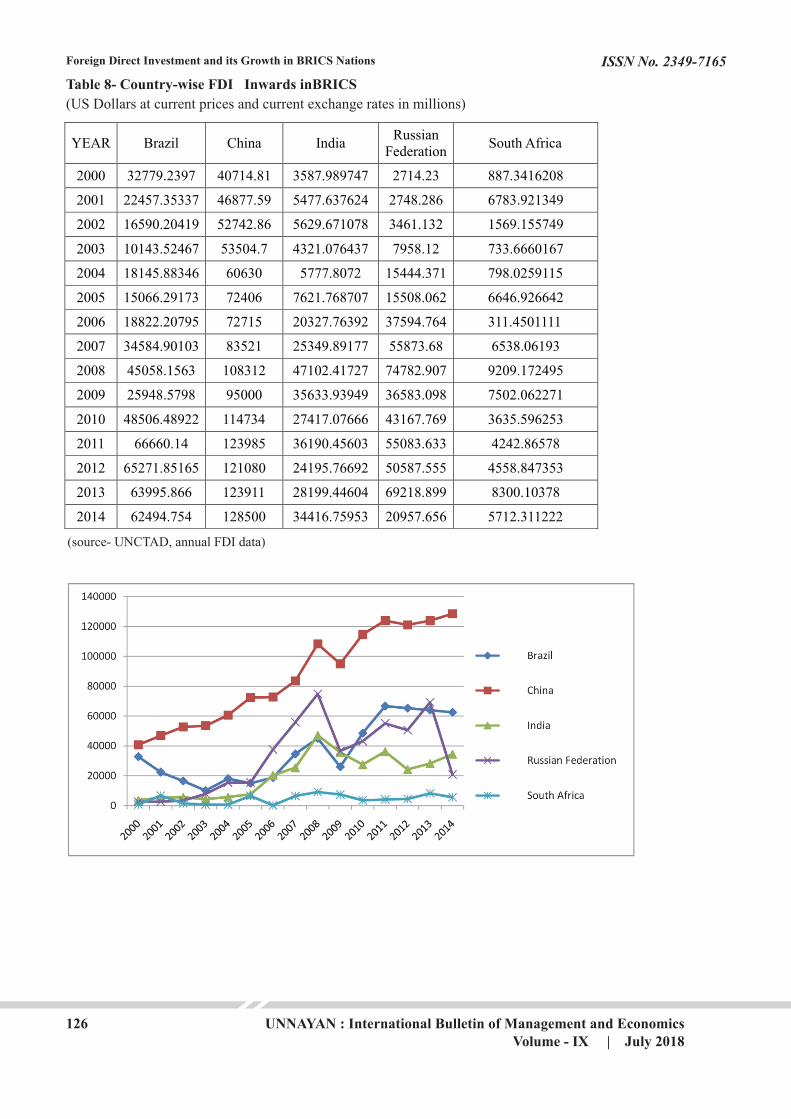
Table 8- Country-wise FDI Inwards inBRICS
(US Dollars at current prices and current exchange rates in millions)
(source- UNCTAD, annual FDI data)
YEAR Brazil China India Russian
Federation South Africa
2000
32779.2397 40714.81
3587.989747
2714.23
887.3416208
2001
22457.35337 46877.59
5477.637624
2748.286
6783.921349
2002
16590.20419 52742.86
5629.671078
3461.132
1569.155749
2003
10143.52467
53504.7
4321.076437
7958.12
733.6660167
2004
18145.88346
60630
5777.8072
15444.371
798.0259115
2005
15066.29173
72406
7621.768707
15508.062
6646.926642
2006
18822.20795
72715
20327.76392
37594.764
311.4501111
2007
34584.90103
83521
25349.89177
55873.68
6538.06193
2008
45058.1563
108312
47102.41727
74782.907
9209.172495
2009
25948.5798
95000
35633.93949
36583.098
7502.062271
2010
48506.48922
114734
27417.07666
43167.769
3635.596253
2011
66660.14
123985
36190.45603
55083.633
4242.86578
2012
65271.85165
121080
24195.76692
50587.555
4558.847353
2013 63995.866 123911 28199.44604 69218.899 8300.10378
2014 62494.754 128500 34416.75953 20957.656 5712.311222

127
ISSN No. 2349-7165
UNNAYAN : International Bulletin of Management and EconomicsVolume - IX | July 2018
Foreign Direct Investment and its Growth in BRICS Nations
Brazilian economy faced a severe decline during 2000-2003, after that a stable movements specifically
increasing trend is experienced till 2008 as seen in graph and table 8. Again during 2008 recession, usual
decline is seen then 2009-2011, a steep increase with stable level of FDIis experienced which is depicted
by growth rate of 11.35% (table 9). When pre formation BRICS period is analysed (table 10), it showed a
compounded average growth of 5.5% in pre formation period as compared to 16.03% in post formation
BRICS period.
Russian inflow showed a drastic rise in pre recession period or Pre formation of BRICS period (2002-
2008) i.e. 64.91% (table 10) and after that it was continuously falling could be seen in above graph as
well as analysis on post formation BRICS period (table 10) i.e. negative annual average growth of 4.07%.
But in initial years from 2000 Russian FDI was steadily increasing due to which the cumulative growth
rate is highest at 24.3% (table 9). Post formation period decreasing growth rate is mainly due to economic
instability in Russia and devaluation of Russian currency.
India's FDI inflows are relatively stable and are increasing throughout, with spectacle shifts in
recessionary phase clearly visible in graph and as per table 8. For the concerned period 2000-2015 it
showed a growth of 19.57% (table 9). But there is remarkable difference in compounded average growth
rates when compared in Pre and post BRICS formation period. In Pre BRICS formation period the growth
rates were 35.05% which made it a prominent part of BRICS but after recession due to world's unstable
economic scenario which happen to be Post formation BRICS period, showed a negative growth of 1.4%
annually on an average.

128
ISSN No. 2349-7165
UNNAYAN : International Bulletin of Management and EconomicsVolume - IX | July 2018
Foreign Direct Investment and its Growth in BRICS Nations
FDI inflows are most prominent factor for the growth and development of emerging economies as it
funds the development process and also generates income in host country. China's robust economic
growth is mainly due to FDI inflows (table 8&9). Since 2000 till 2014 china is main destination for
investment from rest of the world and outperforming from other BRICS. Just a phase of 2008-2010 which
is world's economic downturn showed a unstable and jerky period for it, rest growth rate throughout the
period is stable (9.05%) as seen in analysis table 9 where FDI is regressed with time. Same impact is seen
in table 10 wherein Pre- BRICS formation period (2002-2008) is analysed depicts growth of 12.23 % and
Post BRICS formation period (2009-2014) merely 5.03%.
Due to steady developments of infrastructures in South Africa besides of huge opportunities, the rate of
FDI inflows as compared to other BRICS is quiet subtle and growth is 13.22% (table 9). In pre BRICS
formation period (2002-2008) FDI inflows in South Africa showed a average growth of 12.23% which is
quiet highas compared to 3.45% in post formation BRICS period (2009-2014), table 10. This slow rate of
growth is partial because of recessionary phase of world and rest because of internal restructurings of
economic infrastructures. Post formation FDI inflow growth rate is mainly because of investments made
by China and other BRICS nations, as they have common platform which improved the economic
relations. The growth rates of all the BRICS nations individually are very high throughout the period.
India specially showed a high growth rate along with Russia.
Conclusion
FDI forms the biggest portion of non-debt funding from outside for any nation which can be utilised for
the quick development without any liability. Higher FDI has a significant positive impact on GDP and
growth of an economy. BRICS drew attention of world because even at the time of recession when whole
world specially developed countries were facing trouble in attracting funds, they showed a positive
balance of inward and outward FDI's. The annual growth rate of FDI in pre formation period (2002-2008)
of BRICS is quiet high than post formation period (2009-15), which is mainly as a negative impact of
world's recessionary phase. Of the group China is most prominent economy; having fastest GDP growth
attracted a significant part of FDI and that too mostly in manufacturing sector. Brazil throughout the
period of study has a positive increase in FDI mainly in primary and tertiary sector. After that India
showed a tremendous inflow of FDI mainly in tertiary sector. India is referred as one of the best
destination for FDI from rest of the world after China.
The study shows that the BRICS is attracting a very sound inflow of FDI from various sources in
different sectors. All the BRICS countries have registered a growth of approximate 10% or more, which
provides them ample amount of opportunity for growth and employment generation.
References
1. Vyas A.V. (2015). An analytical study of FDI in India (2000-2015).International Journal of
Scientific and Research Publications, ISSN 2250-3153, vol 5, issue 10
2. Rajeswari G.R.&Akilandeswari K.,(2015). Sector-wise Foreign Direct Investment Inflows into
India. Journal of Business Management & Social Sciences Research (JBM&SSR) ISSN No: 2319-
5614
3. Nistor P. The evolution of Foreign Direct Investment in Brazil, Russsia, India and China
economies (BRIC).Studiauniversitatispetrumaior, series oeconomica, fasciculus 1, anul V, 2011,
ISSN 1843-1127
4. Mathipurani V.B. (2014). A comparative assessment of FDI in BRIC countries with special focus
on India's position. International journal of management and commerce innovations, ISSN 2348-
7585 (online), Vol 2, issue 1, pp (245-254)

129
ISSN No. 2349-7165
UNNAYAN : International Bulletin of Management and EconomicsVolume - IX | July 2018
Foreign Direct Investment and its Growth in BRICS Nations
5. Baskaran A. &Muchie M.,(2008). Foreign Direct Investment and internationalization of
R&D:The Case of BRICS Economics,Development, Innovation and International Political
Economy Research (DIIPER),Aalborg University,Denmark.Working Paper No. 7,ISSN 1902-
8679.
6. Sood N. (2015). Trends of FDI in India: an analytical study of 2001-14. Envision- international
journal of commerce and management, ISSN:0973-5976(P), Vol 9
7. Bedi P. &Kharbanda E.(2014). Analysis of Inflow of Foreign Direct Investment in India –
Problems and Challenges. Global Journal of Finance and Management, ISSN 0975-6477 Vol. 6,
No 7 (2014), pp. 675-684, http://www.ripublication.com
8. Jadhav P. (2012), Determinants of foreign direct investment in BRICS economies: analysis of
economic, institutional and political factor. International conference on emerging economies-
prospects and challenges (ICEE-2012), procedia- social and behavioral sciences 37 (2012)5-14,
1877-0428, institute of international business (SIIB)
9. Narendra& Devi S.,2015. Foreign Direct Investment and Growth in BRICS Countries: A Review.
International Journal of Science and Research (IJSR) ISSN (Online): 2319-7064 Volume 4 Issue
4, April 2015 www.ijsr.net
10. Prakash P.A. & Kumar S.G. (2017). The Effect of Macroeconomic Indicators on Foreign Direct
Investment of BRICS Countries- An Insight into Econometric Models. Journal on management
studies, ISSN: 2395-1664 (online) ICTACT, Feb 2017, Vol: 03, Issue: 01
11. SridharanP., Vijaykumar N & Chandra sekhara Rao K.(2009), Causal Relationship between
Foreign Direct Investment and Growth Evidence from BRICS Countries International business
research, Vol 2 no4
12. Agrawal G., 2015. Foreign Direct Investment and Economic Growth in BRICS Economies: A
Panel Data Analysis. Journal of Economics, Business and Management, Vol. 3, No. 4, April 2015
DOI:10.7763/JOEBM.2015.V3.221
13. http://www.imf.org/external/pubs/ft/weo/2013/01/weodata/weorept.aspx?pr.x=91&pr.y=5&sy=
2011&ey =2018&scsm=1&ssd=1&sort=country&ds=.&br=1&c=223%2C924%2C922%2
C199%2C534&s=NGDPD%2CNGDPDPC%2CPPPGDP%2CPPPPC&grp=0&a=
14. http://www.dnaindia.com/business/report-brics-summit-fdi-inflow-at-all-time-high-global-
ranking-improving-says-pm-modi-2542911
15. Central Bank of Brazil
16. Central Bank of Russia
17. Department of Industrial Policy and Promotion, Ministry of Commerce and Industry
18. Invest in China
19. South African Reserve Bank, Quarterly Bulletin March 2017
20. http://www.dnaindia.com/business/report-brics-summit-fdi-inflow-at-all-time-high-global-
ranking-improving-says-pm-modi-2542911
21. UNCTAD – official site for all data
22. World Bank official site
23. IMF official site