issn : 2349-6592 journal of pediatric critical care october... · vol. 1 - no.4 october - december...
TRANSCRIPT

JOURNAL OF PEDIATRIC CRITICAL CAREaVol. 1 - No.4 October - December 2014
Vol.1 No.4Oct.-Dec. 2014
Journal ofPediatric Critical Care
Of cial Journal of IAP Intensive Care Chapter
Intensive Care ChapterIndian Acqademy of Pediatrics
ISSN : 2349-6592Website : www.journalofpediatriccriticalcare.com
CONTENTSFrom Editors Desk
Original ArticleAlterations of Thyroid Function in Critically Ill Children -Vinayak K Patki; et al
Knowledge of Pediatric Sepsis Among Trainees -Qalab Abbas; et al
Development and Implementation of Pediatric Critical Care Focused Simulation Workshop and Program in India -Utpal S. Bhalala; et al
Special Neurocritical Care Review ArticlePediatric Intracranial Aneurysms and Subarachnoid Hemorrhage: Review-Nitesh Singhal
Case ReportPulmonary Tuberculosis with ARDS and Hemophagocytic Syndrome -A case report -Prabhas Prasun Giri; et al
Symposium: Monitoring in Pediatric Critical CareRespiratory Monitoring in PICU -Vishram B Buche; et al
Hemodynamic Monitoring in PICU -Anand M Patil; et al
Intracranial Pressure and its Monitoring: A review -Suresh Panda; et al
GuidelinesPediatric Brain Death GuidelinesNCPCC 2014 Abstracts (Oral)Critical ReviewJournal Scan
Critical ThinkingPICU Quiz -Praveen Khilnani

JOURNAL OF PEDIATRIC CRITICAL CAREVol. 1 - No.4 October - December 2014 b
To Organize a BPICC in your area, please contact:Dr Madhu Otiv
Chairperson IAP Intensice Care Chapter M: 09822040950 • Email: [email protected]
Dr Rajiv UttamNational Co Convener BPICC
M: 9810055670 • Email: [email protected]
Dr Anil SachdevChair Elect IAP Intensive Care Chapter M: 9810098360 • Email: [email protected]
Regional Conveners:Dr Vikas Taneja (Gurgaon)Dr Anjul Dayal (Hyderabad)
Dr Gnanam (Bengaluru)Dr Parthsarathi Bhattacharya (Kolkotta)
Dr Vinay Joshi (Mumbai)
Manual of Basic Pediatric Intensive Care Course(BPICC Manual)
New3rd Edition, 2015 BPICC Manual Published
Some upcomingBasic Pediatric Intensive Care
Course (BPICC)Courses
Bhubneshwar, Raipur -December 2014PEDICON 2015, Delhi
CRITICARE 2015, Bengaluru

JOURNAL OF PEDIATRIC CRITICAL CARE217Vol. 1 - No.4 October - December 2014
Contents
From Editors Desk 219
Editorial Board 220
2014 Editorial Board 221
Author Instructions 222
Original ArticlesAlterations of Thyroid Function in Critically Ill Children 229Vinayak K Patki, Jennifer V AntinDepartment of pediatrics, Wanless Hospital, Miraj, Dist-Sangli, Maharashtra
Knowledge of Pediatric Sepsis Among Trainees 236Qalab Abbas, Anwar ul Haque, Syed Asad AliDepartment of Pediatrics and Child Health, Aga Khan University Karachi, Pakistan
Development and Implementation of Pediatric Critical Care Focused Simulation Workshop and Program in India
240
Utpal S. Bhalala1, Jesal Sadawarte2, Sameer Sadawarte2, Vishal Baldua2, Swati Garekar2, Rahul Pandit2, Maninder Dhaliwal3, Vinay Joshi4, Preetha Joshi4, Mahesh Mohite5, Chandrahas Deshmukh6, Rakshay Shetty7 and Praveen Khilnani81Johns Hopkins Hospital, Baltimore, MD, 2Fortis Hospital, Bombay, India, 3Medanta Hospital, Delhi, India, 4KD Ambani Hospital, Bombay, India, 5Sai Children’s Hospital, New Panvel, India, 6Seth GS Medical College, Bombay, India, 7Rainbow Children’s Hospital, Vijaywada, India, 8BLK Superspecialty Hospital, New Delhi, India
Special Neurocritical Care Review ArticlePediatric Intracranial Aneurysms and Subarachnoid Hemorrhage: Review 245Nitesh SinghalHospital for Sick Children, Toronto, Canada
Case ReportPulmonary Tuberculosis with ARDS and Hemophagocytic Syndrome -A case report
251
Prabhas Prasun Giri, Priyankar Pal, Nupur Ganguly, Apurba GhoshInstitute of Child Health, Kolkotta
Symposium: Monitoring in Pediatric Critical CareRespiratory Monitoring in PICU 254Vishram B Buche, Anand BhutadaCentral India’s CHILD Hospital and Research Institute, Nagpur

JOURNAL OF PEDIATRIC CRITICAL CAREVol. 1 - No.4 October - December 2014 218
Hemodynamic Monitoring in PICU 267Anand M Patil, Suchitra RanjitApollo Children’s Hospital, Chennai
Intracranial Pressure and its Monitoring: A review 293Suresh Panda, Rakshay ShettyRainbow Childrens Hospital, Hyderabad
GuidelinesPediatric Brain Death Guidelines 302Pediatric Braindeath Guidelines Group 2011
NCPCC 2014 Abstracts (Oral) 306
Critical Review: Journal Scan: International Reviewers 312Comments by International Reviewers
Critical Thinking: PICU Quiz 324Praveen KhilnaniDirector, Pediatric Critical Care and Pulmonology, BLK Superspeciality Hospital, New Delhi

JOURNAL OF PEDIATRIC CRITICAL CARE219Vol. 1 - No.4 October - December 2014
From Editors Desk
Dear Colleagues,
Fourth issue of IAP intensive care chapter journal:Journal of Pediatric Critical care (JPCC) is in your hands. National conference of Pediatric critical care is on in Delhi and abstracts for presentation and posters are published in this issue. As a highlight of this issue, symposium on monitoring in the PICU is presented by various authors from allover the country.
Website www.journalofpediatriccriticalcare.com is now fully functional and all issues of the journal may be downloaded. Please visit the journal page on facebook for comments. Any suggestions are welcome.
Articles from many regions of India as well as other countries have begun to pour in. Original articles from Pakistan, Canada and India are published in this issue.
We do have an ISSN number assigned: ISSN 2349-6592
With a continued regularity and publication of peer reviewed articles we should get indexed in pub med soon.
Thanks for your continued support and efforts to publish original articles as well as review the articles in a timely fashion.
Praveen Khilnani MD FAAP, FCCMEditor in ChiefJournal of Pediatric critical care

JOURNAL OF PEDIATRIC CRITICAL CAREVol. 1 - No.4 October - December 2014 220
Editor-In-Chief:Dr Praveen Khilnani
Senior Editors and Reviewers:Dr (Prof) Sunit Singhi
Dr K ChughDr S UdaniDr S Ranjit
Sr Rajiv UttamDr Anil Sachdev
Dr Madhu OtivDr S Deopujari
Dr Bala RamachandranDr S Soans
Associate Editors:Dr Nameet JarathDr Kundan MittalDr Rakshay ShettyDr BasavarajDr GnanamDr Sandeep Kanwal
Executive Editor:Dr V S V Prasad
Managing Editor:Dr Dhiren Gupta
Executive Members:Dr Arun BansalDr Banani PoddarDr Ebor JacobDr Lokesh TiwariDr Partha BhattacharyaDr Prabhat MaheshwariDr Dinesh ChirlaDr Deveraj RaichurDr KarunakaraDr Mritunjay PaoDr Deepika GandhiDr Bhaskar SaikiaDr Shipra GulatiDr Vikas TanejaDr Indira JayakumarDr Sanjay BafnaDr Sanjay GhorpadeDr Sagar Lad
Biostatistics:Dr M JayshreeDr Jhuma SankarDr Arun Baranwal
Ethics:Dr Urmila JhambDr Rakesh LodhaDr Meera RamakrishnanDr Vinay Joshi
Website:Dr Maninder DhaliwalDr Vinayak PatkiDr Anjul Dayal
Publication:Dr Rachna SharmaDr Pradeep SharmaDr Sanjeev Kumar
International Advisory Board:Dr Niranjan KissoonDr Jerry ZimmermanDr Joseph CarcilloDr Ashok SarnaikDr Peter CoxDr Shekhar VenkataramanDr Vinay NadkarniDr Mohan MysoreDr Utpal BhalalaDr Suneel PooboniDr Rahul BhatiaDr Ravi Samraj
National Advisors:Dr Y AmdekarDr S C AryaDr R N SrivastavaDr C P BansalDr V YewaleDr M P Jain
Journal of Pediatric Critical Care (JPCC)Editorial Board

JOURNAL OF PEDIATRIC CRITICAL CARE221Vol. 1 - No.4 October - December 2014
IAP Intensive Care ChapterExecutive Board 2014
JOURNAL OF PEDIATRIC CRITICAL CAREVol. 1 - No.4 October - December 2014 222
Manuscript submission will be possible using our online submission system shortly. All submissions should be made by e mail until further announcement regarding the online submission details and the journal website: [email protected]
Journal of Pediatric Critical Care is published quarterly (January, April, July and October) by IAP intensive care chapter. Manuscripts are judged by reviewers solely on the basis of their contribution of original data and ideas, and their presentation. All articles will be critically reviewed within 2 months, but longer delays are sometimes unavoidable. All manuscripts must comply with Instructions to Authors.
COPYRIGHT Submissions considered for publication in JOURNAL OF PEDIATRIC CRITICAL CARE are received on the understanding that they have not been accepted for publication elsewhere and that all of the authors agree to the submission. The journal requires approval of manuscript submission by all authors. A cover letter signed by all authors constitutes submission approval. Manuscripts will not receive a nal decision until a completed Copyright Status Form has been received. As soon as the article is published, the author is to have considered transferred his right to the publisher. This transfer will ensure the widest possible dissemination of information. All concepts, ideas, comments, manuscripts, illustrations, and all other materials disclosed or offered to the IAP intensive care chapter on or in connection with this Journal are submitted without any restrictions or expectation of con dentiality. The IAP intensive care chapter shall have no nancial or other obligations to you when you do not submit such information, nor shall you assert any proprietary or moral right of any kind with respect to such submissions. The IAP intensive care chapter shall have the right to use, publish, reproduce, transmit, download, upload post, display or otherwise distribute your submissions in any manner without notice or compensation to you.
ETHICS Investigations on human subjects should conform to accepted ethical standards. Fully informed consent should be obtained and noted in the manuscript. For all manuscripts dealing with experimental work involving human subjects, specify that informed consent was obtained following a full explanation of the procedure (s) undertaken. Patients should be referred to by number; do not use real names or initials. Also the design of special scienti c research in human diseases or of animal experiments should be approved by the ethical committee of the institution or conform to guidelines on animal care and use currently applied in the country of origin.
STYLE OF MANUSCRIPTS All contributions should be written in English. Spelling should be American English. In general, manuscripts should be prepared according to International Committee of Medical Journal Editors. Uniform requirements for manuscripts submitted to biomedical journals. JAMA 1997; 269: 927-934. Manuscript should be as concise and clear as possible. Manuscripts not following Instruction to Authors will be returned to the authors.
LANGUAGE Only English articles will be accepted. Prior to submission, manuscripts prepared by authors whose native language is not English should be edited for proper spelling, grammar, and syntax by a professional editor or colleague uent in English.
MANUSCRIPTS CATEGORIES Materials reviewed for publication in JOURNAL OF PEDIATRIC INTENSIVE CARE include the following:
EditorialsEditorials will present the opinions of leaders in pediatric intensive care
Author InstructionsFor JPCC (Journal of Pediatric Critical Care) Manuscript Submission

JOURNAL OF PEDIATRIC CRITICAL CARE223Vol. 1 - No.4 October - December 2014
Original articlesOriginal clinical or laboratory investigation of clinical subjects should be reported. The material should be presented as concisely as possible.Review articlesReviews should document and synthesize current information on timely subjects.Case reportsA case report should describe a new disease, or con rmation of a rare or new disease; a new insight into pathogenesis, etiology, diagnosis, or treatment; or a new nding associated with a currently known disease.Rapid communicationsThese should be short papers, brief laboratory investigations and preliminary communications, which report new and exciting results requiring rapid publication.LettersThese should be submitted in response to material published in the journal to make small clinical points or to introduce a point of view. Letters do not carry an abstract.Book reviewsReviews of newly published literature of interest.
MANUSCRIPT Manuscript submission should be made by e mail. Manuscripts should be submitted with text and tables, preferably in a recent Word or Word Perfect for Windows format. If article is submitted electronically, there is no need to send a hard copy. The Copyright Status Form should also be sent by e mail or fax or regular mail.Manuscripts should be clearly in double spacing on one side of good quality A4 paper (30 x 21 cm), using 2.5 cm margins. Pages should be numbered consequently in the top right-hand corner, commencing with the Title Page and including those containing Acknowledgements, References, Tables, and Figures.Conventional Manuscript The manuscript should be arranged as follows, with each section beginning on a separate page, except in the category of Rapid communications.Cover letter A cover letter, in which the authors certify that the work submitted to The JOURNAL OF PEDIATRIC CRITICAL CARE has not been published elsewhere, in any form and that it is not being submitted simultaneously to another journal, should accompany the manuscript. A Copyright Status Form (see next page) signed all authors must accompany each manuscript.Title pageThe category of manuscripts (as listed above) should appear on the title page. The title on the title page should contain no more than 80 letters and spaces. A running title of no more than 40 letters and spaces should be supplied. Each author�’s rst and last name as well as middle initial, highest academic degree, name of department(s) and institutions to which the work should be attributed, and address should appear. The author to whom communications will be directed should be designated and his or her telephone and FAX number and E-mail addresses (obligatory for submission) provided.AbstractThe abstract should be no longer than 250 words for full-length articles and commensurately shorter for brief communications and case reports. Abstracts should summarize the problem addressed, investigational approach, results, and relevant conclusions.Key wordsNo more than nine key words that will assist indexer in cross-indexing the article should be supplied. It is recommended that authors consult the medical subject heading from Index Medicus.

JOURNAL OF PEDIATRIC CRITICAL CAREVol. 1 - No.4 October - December 2014 224
Main textThe text of observational and experimental articles is usually divided into sections with headings Materials and Methods, Results and Discussion. Long articles may need subheading within some sections. The purpose of the article and the rational for the study or observation should be summarized in an introductory paragraph.Materials and Methods should be described in suf cient detail to leave the reader in no doubt as to how the results were obtained.Results should be presented in a logical sequence the text.Tables and gures should not include material appropriate to the discussion.
DiscussionThe new and important aspects of the study and the conclusions should be emphasized, without repeating data in detail. This section should consider the implications of the nding and their limitations. Link the conclusions with the goals of the study, and relate the observations to other relevant studies. New hypotheses and recommendations, when appropriate, may be included. Acknowledgement should be made only to persons who have made genuine contributions and who endorse the data and conclusions.
ReferencesReferences must be double-spaced and cited in text by using Arabic numerals in the order in which they appear in the text. Abbreviate titles of the journals according to Index Medicus. Unpublished data and personal communications should be given in round parentheses in the text and not as references. List all authors or editors, but if the number exceeds six, give six followed by et al.References must be listed in Vancouver style: Standard journal articles: [1] Rose ME, Huerbin MB, Melick J, Marion DW, Palmer AM, Schiding JK, et al. Regulation of interstitial excitatory amino acid concentrations after cortical contusion injury. Brain Res 2002;935(1-2):40-6. Books: [2] Murray PR, Rosenthal KS, Kobayashi GS, Pfaller MA. Medical microbiology. 4th ed. St. Louis: Mosby; 2002.[3] Berkow R, Fletcher AJ, editors. The Merck manual of diagnosis and therapy. 16th ed. Rahway (NJ): Merck Research Laboratories; 1992. Chapter in a book:[4] Meltzer PS, Kallioniemi A, Trent JM. Chromosome alterations in human solid tumors. In: Vogelstein B, Kinzler KW, editors. The genetic basis of human cancer. New York: McGrawHill, 2002; p. 93-113. World Wide Web:[5] Autism Speaks. Transition Tool Kit: A guide for families on the journey from adolescence to adulthood, 2011. Available at: http://www.autismspeaks.org/family-services/tool-kits/transition-tool-kit. Accessed October 6, 2012
TablesLimit the number of tables. Data in tables should not be repeated in graphs. Do not use vertical lines to separate information within the table. Tables should be double-spaced and numbered consequently corresponding to in-text citation. A table title and number must be provided at the top. Headings should be concise and use Arabic numbers. Tables should be restricted to one manuscript page unless absolutely necessary. If a table continues past one page, repeat all sequence in heads and the stub (left-hand) column. All non-standard abbreviations should also be explained in the footnotes. Footnotes should be indicated by*, **. Statistical measures such as mean ± SD (standard deviation) should be identi ed in headings.
FiguresNumber gures as Fig. 1, Fig. 2, etc and refer to all of them in the text.Each gure should be provided on a separate sheet. Figures should not be included in the text.
For the le formats of the gures please take the following into account:�• Line art should be have a minimum resolution of 1200 dpi, save as EPS or TIFF- Do not use faint lines and/or lettering and check that all lines and lettering within the gures are legible at nal size

JOURNAL OF PEDIATRIC CRITICAL CARE225Vol. 1 - No.4 October - December 2014
- All lines should be at least 0.1 mm (0.3 pt) wide- Vector graphics containing fonts must have the fonts embedded in the les�• Grayscales (incl photos) should have a minimum resolution of 300 dpi , or 600 dpi for combination art
(lettering and images); save as tiff�• Do not save gures as JPEG, this format may lose information in the process�• Do not use gures taken from the Internet, the resolution will be too low for printing�• Do not use colour in your gures if they are to be printed in black & white, as this will reduce the print
quality (note that in software often the default is colour, you should change the settings)�• For gures that should be printed in colour, please send a CMYK encoded EPS or TIFFFigures should be designed with the format of the page of the journal in mind. They should be of such a size as to allow a reduction of 50%.On maps and other gures where a scale is needed, use bar scales rather than numerical ones, i.e., do not use scales of the type 1:10,000. This avoids problems if the gures need to be reduced.Each gure should have a self-explanatory caption. The captions to all gures should be typed on a separate sheet of the manuscript.Photographs are only acceptable if they have good contrast and intensity.
Units and AbbreviationsManuscript should be in metric units. Standard abbreviations may be used and should be de ned in the Abstract and on the rst mention in the text. In general, a term should not be abbreviated unless it is used repeatedly and the abbreviation is helpful to the reader.
Review and Selection of PapersAll articles will be critically evaluated by at least three reviewers of the editorial board (or known experts in the eld) within 2 months, but longer delays are sometimes unavoidable.
Proofs and ReprintsProofs are sent to the corresponding author, together with a reprint order form approximately 6 weeks prior to the publication. Authors should retain a copy of the original manuscript. Only printer�’s errors may be corrected; no changes in, or additions to, the edited manuscript will be allowed at this stage, unless in reply to speci c editorial queries or requests. Corrected proofs must be returned within 48 hours of receipt, preferably by e mail or fax. If the publisher has not received a reply after 15 days, the assumption will be made that there are no errors to correct, and the article will be published after in-house correction. The reprint order form (with number of reprints requested, invoice and delivery address) should be returned with the corrected proof. Reprints may be ordered prior to publication on the form provided. The designated reviewing author will be responsible for ordering reprints for all authors. Reprints ordered after publication of the journal can be ordered at increased cost by special arrangement.The publisher (IOS press) will provide to authors with a free watermarked PDF le of their article.
CHECK LIST FOR AUTHORSLetter to submission Signed Copyright Status Form Three copies of article Title page Category of manuscript Title of article Running title Name (s), academic degrees, and af liations of author (s) Name, address, telephone and FAX number and e-mail address of corresponding author Abstract including key words (except for Letter to the Editor) Text (double spaced) References (double spaced), on a separate sheet Tables (double spaced), on a separate sheet Figure legends (double spaced), on a separate sheet Figures properly labeled (three sets of glossy prints) Informed consent or certi cate of ethical committee if indicated.

JOURNAL OF PEDIATRIC CRITICAL CAREVol. 1 - No.4 October - December 2014 226
JPCC Copyright Status Form
Manuscript Number: JPCC________ Received Date: _______________ Manuscript Title : _____________
______________________________________________________________________________________
I/We hereby con rm the assignment of all right, title and interest in and on the manuscript named above in all versions, forms and media, now or hereafter known, to the IAP intensive care chapter effective if, and when it is accepted for publication. I/We also con rm that the manuscript contains no material the publication of which violates any copyright or other personal or proprietary right of any person or entity.
I/We shall obtain and include with the manuscript written permission from the respective copyright owners for the use of any textual, illustrative or tabular materials that have been previously published or are otherwise copyrighted and owned by third parties. I/We agree that it is my/our responsibility to pay any frees charged for permissions. I/We af rm that all authors have participated in the study, have been and approved the manuscript, and accept responsibility for the content of the article and its accuracy; that complied with the �“Instructions to authors�”.
To be signed by at least all the authors. Please note: Manuscript cannot be processed for publication until the Editor has received this signed form.
Printed Name ______________________ Printed Name ______________________
Signature ______________________ Signature ______________________
Date ______________________ Date ______________________
Printed Name ______________________ Printed Name ______________________
Signature ______________________ Signature ______________________
Date ______________________ Date ______________________
Printed Name ______________________ Printed Name ______________________
Signature ______________________ Signature ______________________
Date ______________________ Date ______________________

JOURNAL OF PEDIATRIC CRITICAL CARE227Vol. 1 - No.4 October - December 2014
16th National Conference of Pediatric Critical Care 2014Annual Conference of Indian Academy of Pediatric-Intensive Care Chapter
Venue: Hotel Le Meridien, Janpath, New Delhi • Date: 6th to 9th November 2014
Hosted by:IAP Intensive Care Chapter, Delhi & Indian Academy of Pediatrics - Delhi Branch
08.00am - 09.00am Meet The Experts Shekhar Venkataraman, Mohan Mysore Utpal Bhalala, Soonu Udani (Anchor)
Key Note Address
Speaker Chairpersons: Soonu Udani, Madhu Otive, Praveen Khillnani, Anil Sachdev
09.00am - 09.30am Jerry Zimmerman Clinically meaningful outcomes after critical illness
09.30am - 10.00am Joe Carcillo How to assess volume responsiveness in 2014
10.00am - 10.30am Ravi Thiagarajan Failing heart: Support beyond vasopressors
10.30am - 11.00am Vinay Nadkarni Goal directed therapy in critical care
11.00am - 11.30am TEA
Current Sessions
Chairpersons:Satish Deopujari, Nameet Jerath, Shruti Agarwal, Prabhat Maheshwari
Chairpersons:Suneel Pooboni, Uma Ali, Anita Bakshi, N Ravishankar
HALL A HALL B
Speaker Topic Speaker Topic
11.30am - 11.50am Rajiv Uttam Is NIV the fi rst line therapy for acute respiratory failure
Mohan Mysore Albumin infusion in sepsis- When, Why and How
11.50am - 12.10pm Soonu Udani HFOV- Current status in PICU Anil Sachdev VAP- Diagnostic tests for resource-limited countries
12.10pm - 12.30pm Suchitra Ranjit Dopamine in septic shock- Current status
Utpal Bhalala Hypothermia in post cardiac arrest state
12.30pm - 12.50pm Bala Ramachandran Ventilator induced lung injury- How to minimize it
Madhu Otiv Current concepts in the management of severe dengue
Discussion Time 10 minutes Discussion Time 10 minutes
01.00pm - 02.00pm LUNCH
02.00pm - 03.00pm Free Paper Presentation Free Paper Presentation
Judges: Jerry Zimmerman, Rakesh Lodha, Sandeep Kumar Judges: Vinay Nadkarni, Urmila Jhamb, Ebor Jacob
Judges for Poster Presentations: Parvathi Iyer, Jhuma Sankar
Chairpersons:M Jayashree, Dinesh Chirla, Vishal Singh, Sanjay Ghorpade
Chairpersons:Shekhar Venketaraman, Rakshay Shetty, BP Karunakara, Bidari LH
Speaker Speaker
03.00pm - 03.20pm PRO-CON Debate Meera Ramakrishnan/Girish HC
ARDS- Role of corticosteroids VSV Prasad Hypertonic saline as resuscitation fl uid
03.20pm - 03.40pm Akashdeep Arora Role of ECHO in titrating vasopressors
Pro-Con Debate Anjul Dayal/Sachin Shah
Is it worth being a Pediatric Intensivist
03.40pm - 04.00pm Pro-Con Debate Banani Poddar/P Maheshwari
Should I use antipyretics aggressively in critical patient
Dhiren Gupta Chest ultrasonography- A new companion on bedside rounds
04.00pm - 04.20pm Urmila Jhamb Vitamin D in critical care Pro-Con Debate Vinay Joshi/Rashmi Kapoor
Tight glycemic control improves outcome
04.20pm - 05.00pm Panel Discussion Moderator- Krishan Chugh, Panelists-Satish Deopujari, S Kukreja, Meera Ramakrishanan, Kundan Mittal, Gnanam,Jhuma Sankar
Resistant infections in PICU Panel Discussion Moderator- Nirmal Choraria, Panelists- Rakesh Lodha, Arun Baranwal, DP Nakate,Agnishekhar Saha, Basavaraj, Puneet Pooni, Col RK Sanjeev
Critical care delivery in India
05.30pm-06.00pm Inauguration
06.00pm-06.15pm TEA
06.15pm Annual General Body Meeting
07.30pm Onwards Banquet
Day 1: 8th November, 2014

JOURNAL OF PEDIATRIC CRITICAL CAREVol. 1 - No.4 October - December 2014 228
08.00am - 09.00am Meet the Experts: Vinay Nadkarni, Shruti Aggarwal, Suchitra Ranjit, Madhu Otiv (Anchor)
Key note Address
Chairpersons- Vinay Nadkarni, Mohan Mysore, Rajiv Uttam, Vikas Taneja
Speaker Topic
09.00am - 09.30am Shekhar Venkataraman Common myths in clinical practice in PICU
09.30am - 10.00am Praveen Khilnani Pediatric intensive care in India- Past, Present and Future
10.00am - 10.30am Jerry Zimmerman Steroids in critical illness: Where is the Pendulum
10.30am - 11.00am Krishan Chugh Evidence based medicine in PICU- Always practical?
11.00am - 11.30am TEA
HALL A HALL B
Chairpersons:Suchitra Ranjit, Girish HC, Rajiv Chabbra, Devaraj Raichur
Chairpersons:Krishan Chugh, VSV Prasad, Banani Poddar, Mritunjay Pao
Speaker Topic Speaker Topic
11.30am - 11.50am M Jayashree CPP directed therapy in nontraumatic brain insult
Vinay Nadkarni Berlin defi nition of ARDS Relevence for Pediatric Patient
11.50am - 12.10pm Santosh Soans Sedation and muscle relaxants in mechanically ventilated child-
Uma Ali CRRT in sepsis-Timing and outcome
12.10pm - 12.30pm Suneel Pooboni Acute severe respiratory failure-Is ECMO the answer
Ravi Thiagarajan Septic cardiomyopathy
12.30pm - 12.50pm Arun Bansal Pittfalls of ScVO2 and blood Lactate levels in critical illness
Shekhar Venketaraman Bedside measurement of alveolar recruitment
12.50pm - 01.00pm Discussion
01.00pm - 02.00pm LUNCH
02.00pm - 03.00pm Chairpersons:P Bhattacharya, Basavraj, Meera Ramakrishnan, Mahesh Mohite
Chairpersons:Arun Baranwal, Agnisekhar Saha, Col RK Sanjeev, Ebor Jacob
02.00pm - 02.20pm Bala Ramachandran Utility of High Flow Nasal Cannula in PICU
02.00pm - 02.10pmShruti Agarwal
NIRS
02.10pm - 02.20pmDhiren Gupta
Meningococcal infection-What’s new?
02.20pm - 02.40pm BP Karunakara IV Immunoglobulins in severe sepsis
02.20pm - 02.40pm Satish Deopujari
Non-infectious causes of fever in PICU
02.40pm - 03.00pm Pro-Con Debate Rakesh Lodha / Puneet Pooni
Weaning from mechanical ventilation Protocolized vs Clinical Judgement
02.40pm - 02.50pmSanjay Ghorpade
Anti fungal drugs
02.50pm - 3.00pmJ B Fink
Aerosol therapy in PICU
Chairpersons:Anupam Sachdeva, BB Aggarwal, Manish Sharma,Kundan Mittal
Chairperson:Nirmal Choraria, JS Bhasin, Rashmi Kapoor, Dhiren Gupta
03.00pm - 03.20pm Shekhar Venketaraman How to get an article published in a critical care journal
Parvathi Iyer Pediatric cardiac intensive care in India- Challenges, stratergies and rewards
03.20pm - 03.40pm Nameet Jerath Emerging diagnostic methods in sepsis and severe infections
Shruti Agarwal Is there a place for immune-nutrition in PICU
03.40pm - 04.00pm Vikas Taneja Organ transplantation- Role of Intensivist
PRO-CON Debate Anita Bakshi/Parthasarthi Bhattacharyya
End of life care in India- Is it feasible
04.00pm - 04.20pm Ebor Jacob Abdomen-Neglected organ system in ICU
Pro-Con Debate Rajiv Chabbra/Rakshay Shetty
Is daily chest radiograph required in PICU
04.20pm - 05.00pm Panel Discussion Moderator- Rajiv Uttam Panelists- Jesal Seth, Vishal Singh, Vishram Buche, Mahesh Mohite, Sandeep Kumar, Maninder Dhaliwal
Vasoactive drugs in PICU Panel Discussion Moderator- Anil Sachdev Penalists- Vikram Gagneja, Garima, Rachana Sharma, Shipra Gulati, Deepika Singhal, Sanjeev Kumar
How to pass the fellowship examinations
05.00pm - 05.30pm Summing it up! What have you learnt in NCPCC 2014?
Vote of Thanks
Day 2: 9th November, 2014
JOURNAL OF PEDIATRIC CRITICAL CARE229Vol. 1 - No.4 October - December 2014
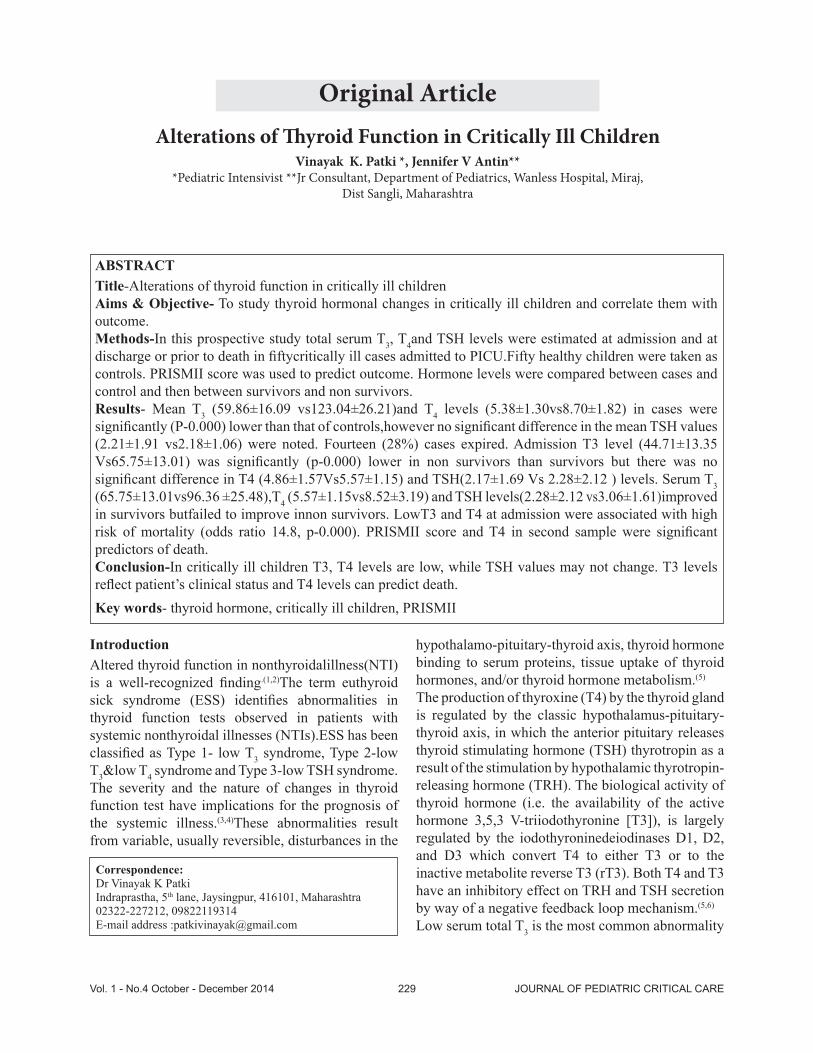
Original ArticleAlterations of ! yroid Function in Critically Ill Children
Vinayak K. Patki *, Jennifer V Antin***Pediatric Intensivist **Jr Consultant, Department of Pediatrics, Wanless Hospital, Miraj,
Dist Sangli, Maharashtra
Correspondence:Dr Vinayak K PatkiIndraprastha, 5th lane, Jaysingpur, 416101, Maharashtra02322-227212, 09822119314E-mail address :[email protected]
IntroductionAltered thyroid function in nonthyroidalillness(NTI) is a well-recognized nding.(1,2)The term euthyroid sick syndrome (ESS) identi es abnormalities in thyroid function tests observed in patients with systemic nonthyroidal illnesses (NTIs).ESS has been classi ed as Type 1- low T3 syndrome, Type 2-low T3&low T4 syndrome and Type 3-low TSH syndrome.The severity and the nature of changes in thyroid function test have implications for the prognosis of the systemic illness.(3,4)These abnormalities result from variable, usually reversible, disturbances in the
ABSTRACTTitle-Alterations of thyroid function in critically ill childrenAims & Objective- To study thyroid hormonal changes in critically ill children and correlate them with outcome.Methods-In this prospective study total serum T3, T4and TSH levels were estimated at admission and at discharge or prior to death in ftycritically ill cases admitted to PICU.Fifty healthy children were taken as controls. PRISMII score was used to predict outcome. Hormone levels were compared between cases and control and then between survivors and non survivors.Results- Mean T3 (59.86±16.09 vs123.04±26.21)and T4 levels (5.38±1.30vs8.70±1.82) in cases were signi cantly (P-0.000) lower than that of controls,however no signi cant difference in the mean TSH values (2.21±1.91 vs2.18±1.06) were noted. Fourteen (28%) cases expired. Admission T3 level (44.71±13.35 Vs65.75±13.01) was signi cantly (p-0.000) lower in non survivors than survivors but there was no signi cant difference in T4 (4.86±1.57Vs5.57±1.15) and TSH(2.17±1.69 Vs 2.28±2.12 ) levels. Serum T3 (65.75±13.01vs96.36 ±25.48),T4 (5.57±1.15vs8.52±3.19) and TSH levels(2.28±2.12 vs3.06±1.61)improved in survivors butfailed to improve innon survivors. LowT3 and T4 at admission were associated with high risk of mortality (odds ratio 14.8, p-0.000). PRISMII score and T4 in second sample were signi cant predictors of death.Conclusion-In critically ill children T3, T4 levels are low, while TSH values may not change. T3 levels re ect patient�’s clinical status and T4 levels can predict death.Key words- thyroid hormone, critically ill children, PRISMII
hypothalamo-pituitary-thyroid axis, thyroid hormone binding to serum proteins, tissue uptake of thyroid hormones, and/or thyroid hormone metabolism.(5)
The production of thyroxine (T4) by the thyroid gland is regulated by the classic hypothalamus-pituitary- thyroid axis, in which the anterior pituitary releases thyroid stimulating hormone (TSH) thyrotropin as a result of the stimulation by hypothalamic thyrotropin-releasing hormone (TRH). The biological activity of thyroid hormone (i.e. the availability of the active hormone 3,5,3 V-triiodothyronine [T3]), is largely regulated by the iodothyroninedeiodinases D1, D2, and D3 which convert T4 to either T3 or to the inactive metabolite reverse T3 (rT3). Both T4 and T3 have an inhibitory effect on TRH and TSH secretion by way of a negative feedback loop mechanism.(5,6)
Low serum total T3 is the most common abnormality
JOURNAL OF PEDIATRIC CRITICAL CAREVol. 1 - No.4 October - December 2014 230
in NTI. It is observed in about 70% of hospitalized patients.(7) Serum total T3 may vary from undetectable to normal in patients with systemic illness.Within a few hours after the onset of disease, plasma T3 decreases and plasma rT3 increases, and the magnitude of these reciprocal changes is related to the severity of the disease.(7-9)Altered expression of thyroid hormone transporters, impairment of 5�’ deiodinaseactivity due to reduced availability of the enzyme co-factorglutathione due to reduced intake of carbohydrates, stress induced elevated steroids and free fatty acids as inhibitor of extra-thyroidal T4 to T3 conversion are some of the postulated mechanisms.(10-13)
T4 decreases as well with T3 in severely ill patientsand both low T4 and low T3 are associated with a poorprognosis.(14-16) Suppression of thyroid releasing hormone (TRH) from hypothalamus due todysregulation or inhibitory action of somatostatin,decreased pituitary response to TRH,decreased pituitary secretion of TSH due to cortisol, growth hormone, dopamine, opiate peptides secreted in response to stress, decreasedresponsiveness of pituitary TSH to low T3 or T4 and reduced plasmabinding of T4 are suggested reasons for low T4.(17-20)
Majority of the studies till date on thyroid function test and its correlation with outcome in critically ill patients are mainly conducted in surgical ICUs especially in adults. There is paucity of data available in pediatrics ICUs, especially in India on this subject. Hence present study was conducted to evaluate the alteration of thyroid hormone function in critically ill children and to assess its correlation with their outcome.
Materials and MethodsIn this prospective study ftycritically ill children admitted in Pediatric intensive care unit (PICU) were studied over a period of 1.5years (august 2010 to february2012). Critical illness was de ned as any condition leading to malfunction of one or more organ system requiring support to maintain vital functions either with mechanical or pharmacological aids.PRISMII score (Pediatric risk of mortality score) was used to predict the outcome in critically ill patients
at 0 and 24 hours. Data was collectedwithin rst hour of admission to pediatric ICU. Data collection pertinent to the analysis included ICU admission diagnosis, categorized by primary physiologic instability and outcome (survival or death). Total serum T3,T4,TSH levels were estimated twice in critically ill patients, rst sample at admission to PICU and second sample at discharge or prior to death (depending on the outcome ofpatient).Fifty age and sex matched healthy children were taken as controls.Admissions for post procedure recovery, cases with maternal or family history of thyroid illness,clinical evidence of thyroid dysfunction, or patients on any thyroid medication or on long term glucocorticoids, patient on drugslike radiographic agents,amidarone and propranolol which affect directly thyroid functionwere also excluded from the study. The data was recorded on standardized sheet and included demographic variables such as age, sex, outcome, T3, T4, TSH levels and 14 physiological variables used in PRISMII score.Estimation of variable parameters was done. Blood pressure was recorded withnoninvasive multipara monitors and oxygen saturation measured with pulse oximeter at admission. The Fio2 required formaintaining oxygen saturation above 90% was noted with oxygen monitor. Radial artery sampling was used for determining Pao2, Paco2 and bicarbonate levels. Standard lab techniques were utilized to measure blood levels of total bilirubin, protein,potassium, calcium, glucose, prothrombin time and partial thromboplastin time. Clinical assessment of heart rate, respiratory rate and pupillary reaction for each patient was made. The children were followed up during the hospital stay and the outcome measures were recorded as deathor survived at the end of hospital stay.Serum total T3, T4 & TSH levels were estimated by solid-phase competitive luminescence immunoassay (CLIA). T3 values less than 60 ng/dl, T4 values less than 4.5 mcg/dl & TSH values less than 0.3 uU/ml was considered as lowT3, T4 & TSH values respectively. Cases were also classi ed as Type I, Type II & Type III Euthyroid sick syndrome (ESS) accordingly. Only low T3 as ESS Type I, both Low T3 & Low T4 as ESS Type II & Low TSH as ESS Type III.
ORIGINAL RESEARCH ARTICLE Alterations of Thyroid Function in Critically Ill Children

JOURNAL OF PEDIATRIC CRITICAL CARE231Vol. 1 - No.4 October - December 2014
The hospital ethics and review board�’s approval and informed consent from relatives was taken before undertaking the study. Statistical analysis of data was done by using IBM SPSS 19.0 Statistics software. Normally distributed continuous variables were compared with Student�’s t-test and categorical variables were compared with Chi-square test or Fisher�’s exact test. Pearson Correlation coef cient was used to study bivariate correlation. After determination of individual factors with mortality by univariate analysis, a binary logistic regression model of signi cant factors associated with mortality was developed. The results of regression model were presented as adjusted odds ratio. Wald�’s chi square value was used to test unique contribution of each predictor. Regression model adequacy was tested by Omnibus test of model coef cients, Negelkerke R square and Hosmer&Lameshow chi square test. Receiver Operating Characteristic Curve analysis was used to nd out the cut-off values for T, T4 and TSH and for PRISM II score to validate predicted probabilities of death.P< 0.05 was considered statistically signi cant.
ResultsMean age of fty critically ill children inthe case group was78.92±40.78 months (range14 to 156 months).There was no signi cant difference in mean values of T3(60.28± 17.69 Vs.57.12 ±12.71ng/dl), T4(5.64±1.05 Vs. 5.41±1.25mcg/dl) and TSH (2.53±1.25Vs2.24±1.61) between males and females. The distribution of cases according to diagnosis is mentioned in Table 2.Mean total protein levels (5.49±1.67 vs.6.01±0.66 gm) were comparable between cases & controls. Fourteen (28%) children died and 36 (72%) survived. The means and SD of thyroid pro le for given sample size and alpha (0.05,2 tailed), power of study was 1.00. The average duration between the rst and second sample in survivors was 7.64 ± 2.08 days and in non survivorscases was 6.29 ± 2.28 days.Mean serum T3 and serum T4 levels were signi cantly lower in cases than that in controls. Howeverserum TSH levels were not signi cantly different betweentwo groups (Table 1). At admission there was no signi cant difference in the serum
levels of T4 and TSH between survivor and non survivors. However serum T3 level was signi cantly lower in non survivors (Table 3). Among survivors T3, T4 and TSH levelsat discharge showed signi cant (p-0.000) rise as compared to their admission levels. However T3, T4 and TSH levelsin the non survivors failed to improve (Table 4). There was no signi cant difference inmean total protein levels (5.78±0.62 Vs 5.38±0.66) between survived and expired children.Table1: Comparativedemography in cases verses controlsParameter Cases (n=50) Controls (n=50) PvalueMale/female 37/13 38/12 0.817Age in months 78.92±40.78 81.02±41.17 0.798Serum proteins 5.49±1.67 6.01±1.66 0.126T3 59.86±16.09 123.04±26.21 0.000T4 5.38±1.30 8.70±1.82 0.000TSH 2.21±1.91 2.18±1.06 0.928
Table 2: Distribution of cases according to diagnosisDiagnosis Cases (n=50) Deaths (n=14)Viral encephalitis 7 (14%) 3 (21.4%)Status epilepticus 3 (6%) 0Congestive cardiac failure 8 (16%) 2 (14.3%)Severe acute asthma 7 (14%) 2 (14.3%)Acute renal failure 3 (6%) 1 (7.14%)gastroenteritis 6 (12%) 1 (7.14%)Septic shock 10 (20%) 3 (21.4%)Trauma 6 (12%) 2 (14.3%)
Table 3: Comparison of thyroid pro le between survivors & non survivors
Parameter Survivors (n=36)
Non survivors (n=14) Pvalue
First T3 65.75±13.01 44.71±13.35 0.000First T4 5.57±1.15 4.86±1.57 0.085First TSH 2.28±2.12 2.17±1.69 0.093Second T3 96.36±25.48 42.57±11.94 0.000Second T4 8.52±3.19 3.58±1.74 0.000Second TSH 3.06±1.61 2.23±1.67 0.113PRISM II at admission 7.17±1.78 8.64±1.73 0.011
PRISM II at 24hrs 7.50±1.75 10.79±1.72 0.000
Serum proteins 5.78±1.62 5.38±1.34 0.416PRISMII: Pediatric Risk of Mortality Score II
ORIGINAL RESEARCH ARTICLE Alterations of Thyroid Function in Critically Ill Children
JOURNAL OF PEDIATRIC CRITICAL CAREVol. 1 - No.4 October - December 2014 232
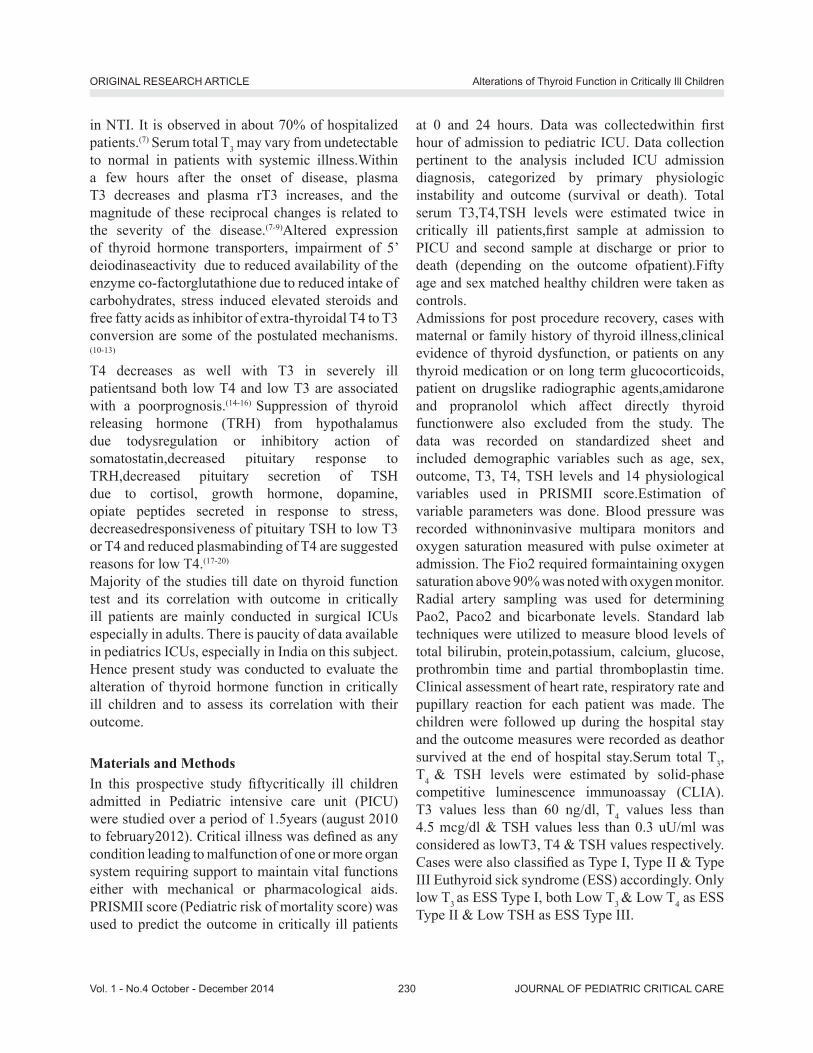
Low T3 alone (type I ESS) was seen in 32 (64%) children, mortality in this group was 37.5% (12 out of 32) (odds ratio 4.1,p=0.056) while a combination of low T3 and T4 (type II ESS) was seen in 13 (26%) cases with mortalityof 69.23% (9 out of 13) in this group and demonstrated almost 15 times more risk of mortality (odds ratio 14.9, p<0.000). Only 3 (6%) cases had isolated low TSH (typeIII ESS) & 2 (4%) had lowT4 alone. There was no death inType III ESS group.
Table 4: Comparison between the thyroid parameters in the rst and second samples
Parameter survivors Pvalue Non survivors
Pvalue
First T3 65.75±13.01 0.000 44.71±13.35 0.000
Second T3 96.36±25.48 42.57±11.94
First T4 5.57±1.15 0.000 4.86±1.57 0.000Second T4 8.52±3.19 3.58±1.74First TSH 2.28±2.12
0.0002.17±1.69 0.065
Second TSH 3.06±1.61 2.23±1.67
PRISMII score at 24 hrs.was signi cantly higher in patients who expired (10.79±1.72 Vs 7.50±1.75,p= 0.000). PRISM score at 24 hours did not correlate with T3, T4 or TSH levels at admission, but had negative correlation with T4 levels of the second sample (Table 5). Age, sex, duration of PICU stay, ventilation and inotropic support did not show any correlation with patient outcome or thyroid hormone pro le.
Table 5: Correlation of Thyroid Pro le with PRISMII score & duration of PICU stayParameter PRISMII at 24hrs PICU stay
r Pvalue r PvalueFirst T3 -0.037 0.953 -0.213 0.138First T4 -0.734 0.068 -0.127 0.379First TSH -0.046 0.931 0.045 0.755Second T3 -0.129 0.806 0.001 0.995Second T4 -0.864 0.038 0.075 0.460Second TSH -0.090 0.864 0.201 0.286
r=correlation coef cient
Table 6: Multivariate analysis of factors associated with mortality by logistic regressionVariable Wald S. E df P
valueOdds ratio
Second T4 5.338 0.252 1 0.021 0.558PRISM II at 24 hrs 4.192 0.290 1 0.041 1.811
constant -0.3186 0.963 1 0.327 0.041PRISMII: Pediatric Risk of Mortality Score II, SE-standard error, df: Degree of freedom
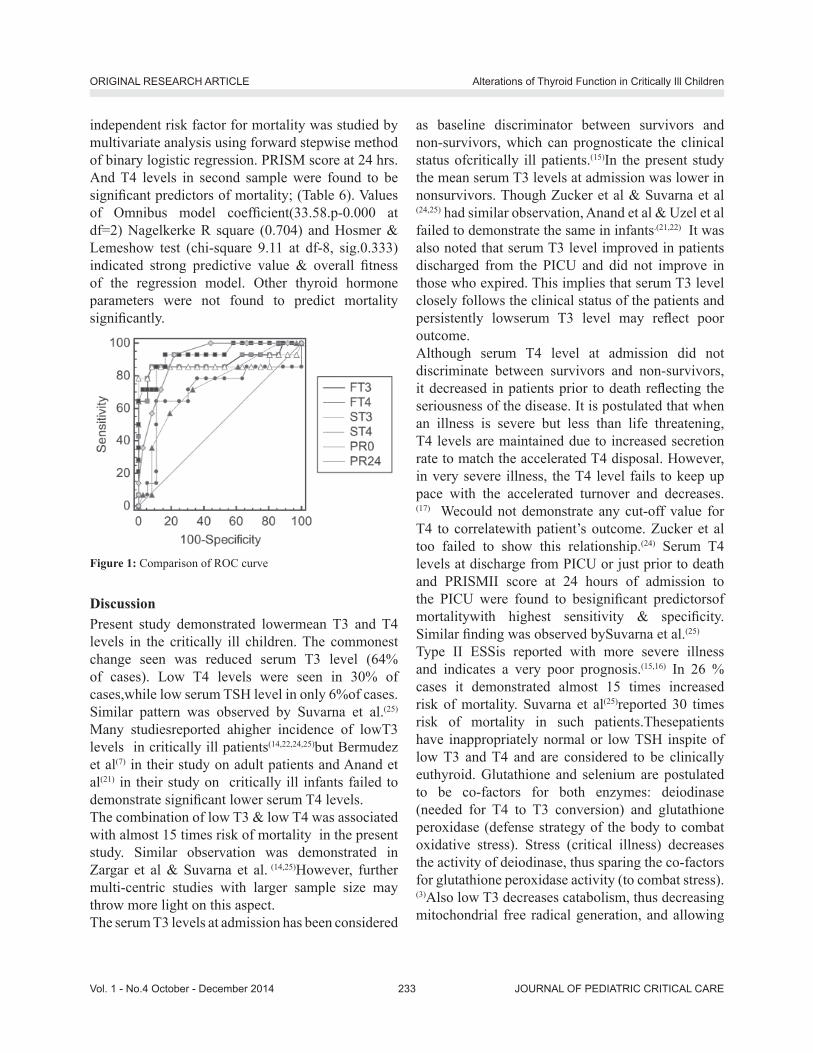
The area under Receiver Operator Characteristic (ROC) curve for the various thyroid hormone parameters, PRISMII score at admission and 24 hrs.with death as classi cation variable, along with the sensitivity and speci city is listed in table 7. The values for Area under curve (AUC) for second T4 (0.932) was comparable for PRISMII score (0.907) [Table 7] [Fig 1]. As AUC for second T4 for had highest sensitivity & speci city closely matching with respective value of PRISMII score, T4 as an
Table 7: ROC curve analysis of factors associated with mortalityVariable AUC SE Pvalue 95%CI sensitivity speci city criterionFirst T3 0.883 0.0724 0.001 0.761to0.956 85.7% 91.7% 51First T4 0.705 0.0986 0.032 0.560 to0.826 64.3% 88.9% 4.45First TSH 0.526 0.0905 0.779 0.380 to 0.669 57.1% 63.9% >1.91Second T3 0.867 0.0873 0.001 0.741 to0.946 78.6% 94.4% 46Second T4 0.932 0.0431 0.000 0.823 to 0.984 92.9 % 83.3% 4.4Second TSH 0.679 0.100 0.742 0.532 to0.804 42.9 % 75.4% >0.91PRISMII admission 0.735 0.0795 0.002 0.591 to 0.850 71.3 % 66.7% > 7PRISMII 24hrs 0.907 0.0401 0.000 0.790 to 0.971 92.9% 77.8% > 8
ROC-receiver operting charateristic, AOC-area under curve, SE-standard error, CI-con dence interval
ORIGINAL RESEARCH ARTICLE Alterations of Thyroid Function in Critically Ill Children
JOURNAL OF PEDIATRIC CRITICAL CARE233Vol. 1 - No.4 October - December 2014
independent risk factor for mortality was studied by multivariate analysis using forward stepwise method of binary logistic regression. PRISM score at 24 hrs. And T4 levels in second sample were found to be signi cant predictors of mortality; (Table 6). Values of Omnibus model coef cient(33.58.p-0.000 at df=2) Nagelkerke R square (0.704) and Hosmer & Lemeshow test (chi-square 9.11 at df-8, sig.0.333) indicated strong predictive value & overall tness of the regression model. Other thyroid hormone parameters were not found to predict mortality signi cantly.
Figure 1: Comparison of ROC curve
DiscussionPresent study demonstrated lowermean T3 and T4 levels in the critically ill children. The commonest change seen was reduced serum T3 level (64% of cases). Low T4 levels were seen in 30% of cases,while low serum TSH level in only 6%of cases. Similar pattern was observed by Suvarna et al.(25)
Many studiesreported ahigher incidence of lowT3 levels in critically ill patients(14,22,24,25)but Bermudez et al(7) in their study on adult patients and Anand et al(21) in their study on critically ill infants failed to demonstrate signi cant lower serum T4 levels.The combination of low T3 & low T4 was associated with almost 15 times risk of mortality in the present study. Similar observation was demonstrated in Zargar et al & Suvarna et al. (14,25)However, further multi-centric studies with larger sample size may throw more light on this aspect.The serum T3 levels at admission has been considered
as baseline discriminator between survivors and non-survivors, which can prognosticate the clinical status ofcritically ill patients.(15)In the present study the mean serum T3 levels at admission was lower in nonsurvivors. Though Zucker et al & Suvarna et al (24,25) had similar observation, Anand et al & Uzel et al failed to demonstrate the same in infants.(21,22) It was also noted that serum T3 level improved in patients discharged from the PICU and did not improve in those who expired. This implies that serum T3 level closely follows the clinical status of the patients and persistently lowserum T3 level may re ect poor outcome. Although serum T4 level at admission did not discriminate between survivors and non-survivors, it decreased in patients prior to death re ecting the seriousness of the disease. It is postulated that when an illness is severe but less than life threatening, T4 levels are maintained due to increased secretion rate to match the accelerated T4 disposal. However, in very severe illness, the T4 level fails to keep up pace with the accelerated turnover and decreases.(17) Wecould not demonstrate any cut-off value for T4 to correlatewith patient�’s outcome. Zucker et al too failed to show this relationship.(24) Serum T4 levels at discharge from PICU or just prior to death and PRISMII score at 24 hours of admission to the PICU were found to besigni cant predictorsof mortalitywith highest sensitivity & speci city. Similar nding was observed bySuvarna et al.(25)
Type II ESSis reported with more severe illness and indicates a very poor prognosis.(15,16) In 26 % cases it demonstrated almost 15 times increased risk of mortality. Suvarna et al(25)reported 30 times risk of mortality in such patients.Thesepatients have inappropriately normal or low TSH inspite of low T3 and T4 and are considered to be clinically euthyroid. Glutathione and selenium are postulated to be co-factors for both enzymes: deiodinase (needed for T4 to T3 conversion) and glutathione peroxidase (defense strategy of the body to combat oxidative stress). Stress (critical illness) decreases the activity of deiodinase, thus sparing the co-factors for glutathione peroxidase activity (to combat stress).(3)Also low T3 decreases catabolism, thus decreasing mitochondrial free radical generation, and allowing
ORIGINAL RESEARCH ARTICLE Alterations of Thyroid Function in Critically Ill Children

JOURNAL OF PEDIATRIC CRITICAL CAREVol. 1 - No.4 October - December 2014 234
energy to be expended for the defense processes. Thus ESS maybe considered as an adaptive process.(7,8,24,29)
We observed that in patients who survived, TSH levels increased signi cantly while it failed to improve in patients who expired. Similar observation was found by Suvarna et al.(25)The transient increase in serum TSH during recovery from NTI suggests that TSH is suppressed in an illness. Pituitary TSH suppression may be related to the stress of an illness, and the resulting elevated cortisol and catecholamine levels and associated caloric deprivation.(4)
Almost in all critical illness,there is a decreasein plasma concentration of proteins that bind thyroid hormone [albumin, thyroid binding pre albumin (TBPA) & thyroid binding globulin (TBG)]. As binding proteinsdecrease, total levels of T4 and to lesser degree of T3 decline.(1,3,5) The free thyroxine index (FT4I) is an estimate of the amount of circulating free thyroxine which doesn�’t get affected by levels of TBG or TBPA and can be used as sensitive indicator to diagnose ESS.(2,3,6) We have not estimated FT4I ,TBPA or TBG in our study due to high cost involved, butas there was no signi cant difference in total serum protein levels of either cases and controls or between survived and expired, we can presume that changes in thyroid pro le were re ecting critical phase of illness and not hypoproteinemia.�‘Is there any role of T3, T4 supplementation in critically ill patients inimproving survival?�’ The improvement of T3 levels in patients who survived and non-improvement in those who expired raises this important question, Most studies perceive low T3 without increased TSH as an adaptive response (metabolically protective) not warranting administration of T3 or T4 in NTI.(20,23,24,28) Moreover decreased deiodinase activity in NTI may hamper peripheral conversion of T4 to T3.(28) T4 therapy may in fact suppress thyroid function normalization during recovery by inhibiting TSH secretion.(28)
Administration of T3 in severe burnsdid not affect survival.(17) However T3 infusion in patients with septic shock showed elevation of systolic blood pressure, reduced vasopressor requirement and improvement in renal function.(28) Recent reports showed cardiac surgery patients with ESS tolerated T3
replacement therapy well and showed hemodynamic improvementsin form of increase in cardiac index, reduced need of for inotropic agents and mechanical device and decreased incidence of myocardial ischemia(27) The therapeutic role of thyroid hormones in the management of NTI is still not very clear and awaits further well controlled randomized trials.
ConclusionsIn critically ill children,mean T3, T4 levels are low,while TSH values may not change. At any given point T3 level re ects the patient�’s clinical status and persistent low serum T3 levels with non-improvement would predictbad prognosis. Low T3 & T4 values at admission are associated with very high risk of mortality. T4 levels independently can predict mortality with high sensitivity & high speci city like PRISMIIscore at 24 hours. Children with combined low T3 and T4 levels need more close observation and aggressivetherapeutic intervention.
Limitations: Confounding bias related to effect of inotropic agents (dopamine, dobutamine) or exogenous steroid used in critical illness on thyroid hormones could not be eliminated. Estimation of rT3 and free T4 was not done in this study which would have given us an additional thyroid indicator of prognostic value.The thyroid hormone pro le was done only twice i.e. at admission and at recovery or death in this study. More frequent estimation to assess the trend of changes in the thyroid hormone pro le in the sick children can give us better information and help us to identify seriously ill patients much earlier. Con ict of Interest: NoneRole of Funding Source: NoneAcknowledgement- Dr NathanealSase, Director, Wanless Hospital, Miraj
References:1. Peeters RP, Debaveye Y, Fliers E, Visser TJ. Changes within
the thyroid axis during critical illness. Crit care clin 2006; 22:41-55.
2. Peeters RP, Geyten S, Wouters PJ, Darras VM, Toor H et al. Tissue thyroid hormone in critical illness. J ClinEndocrinolMetab 2005; 90: 6498-6507
ORIGINAL RESEARCH ARTICLE Alterations of Thyroid Function in Critically Ill Children

JOURNAL OF PEDIATRIC CRITICAL CARE235Vol. 1 - No.4 October - December 2014
3. Bayarri VM, Sancho S, Campos C, Faus R, Simon JM, Porcar E et al.Theeuthyroid sick syndrome in severe acute illness.Presse Med 2007; 36: 1550-1556.
4. Chopra IJ. Euthyroid sick syndrome:Is it a misnomer? JClinEndocrinolMetab1997;82:329-334.
5. Chopra IJ, Hershman JM, Pardridge WM, NicoloffJT.Thyroid function in nonthyroidal illness. Ann Intern Med 1983; 98: 946-957.
6. Peeters RP, Wouters PJ, Kaptein E, Toor H, Visser TJ et al. Reduced activation and increased inactivation of thyroid hormone in tissues of critically ill patients. J ClinEndocrinol Metab 2003; 88: 3202-11
7. Bermudez F, Surks MI, Oppenheimer JH. High incidence of decreased serum triiodothyronine concentration in patients with non-thyroidal disease. J ClinEndocrinol Metab 1975; 41:27-40.
8. Chopra IJ, Chopra U, Smith SR, Reza M, Solomon DH.Reciprocal changes in serum concentrations of 3, 3, 5-triiodothyronine (T3) in systemic illness. J ClinEndocrinol Metab1975; 41: 1043-1049.
9. Huang SA, BiancoAC. Reawakened interest in type III iodothyroninedeiodinase in critical illness and injury.NatClinPractEndocrinol Metab. 2008; 4(3): 148�–155.
10. MebisL, Paletta D, Debaveye Y, Ellger B, Langouche L et al. Expression of thyroid hormone transporters during critical illness. Eur J Endocrinol2009; 161: 243-250.
11. Sahana PK, Ghosh A, Mukhopadhyay P, Pandit K, Chowdhury BK, Chowdhury S. A study on endocrine changes in patients in intensive care unit. J Indian Med Assoc2008; 106: 362-364.
12. Gamstedt A, Jarnerot G, Kagedal B, Soderholm B. Corticosteroids and thyroid function. Acta Med Scand 1979; 205: 379-383
13. Chopra IJ, Huang T, Beredo A et al. Evidence for an inhibitor of extrathyroidalconversión of thyroxine to 3,5,3�’- triiodothyronine in sera of patients with nonthyroidal illness. J ClinEndocrinolMetab1985; 60: 666-672.
14. Zargar AH, Ganie MA, Masoodi SR, Laway BA, Bashir MI et al. Prevalence and pattern of sick euthyroid syndrome in acute and chronic non-thyroidal illness- Its relationship with severity and outcome of the disorder. JAPI 2004; 52:27-31
15. Kaptein EM, Weiner JM, Robinson WJ, Wheeler WS, Nicoloff JT. Relationship of altered thyroid hormone indices to survival in non-thyroidal illness. ClinEndocrinol 1982; 16: 565-574
16. Slag MF, Morley JE, Elson MK, Crowson TW, Nuttall FQ, Shafer RB. Hypothyroxinemia in critically ill patients as a predictor of high mortality. J Am Med Assoc1981; 245: 43-45
17. Wehmann RE, Gregerman RI, Burns WH, Saral R, Santos GW.Suppression of thyrotropin in the low thyroxine state severe nonthyroidalillness. NEngl J Med 1985; 312: 546-552.
18. Sumita S, Ujike Y, Namiki A et al. Suppression of the thyrotropin response to thyrotropin releasing hormone and its association with the severity of critical illness. CritCareMed1994; 10: 870-875.
19. Romijn JA, Wiersinga WM. Decreased nocturnal surge of thyrotropin in nonthyroidal illness. J ClinEndocrinolMetab 1990; 70: 35-42.
20. Kaptein EM, Grieb DA, Spencer CA, Wheeler WS, Nicoloff JT. Thyroxine metabolism in the low thyroxine state of critical nonthyroidal illness. J ClinEndocrinol Metab 1981; 53:764-770.
21. Anand NK, Chandra V, Sinha RSK, Chellani H. Evaluation of thyroid functions in critically ill infants. Indian Pediatr 1993; 31: 1233-1237.
22. Uzel N, Neyzi O. Thyroid function in critically ill infants with infection. Pediatr Infect Dis 1986; 5: 516-519.
23. Lim DJ, Herring MK, Leef KH, Getchell J, Bartoshesky LE, Paul DA. Hypothyroxinemia in mechanically ventilated term infants is associated with increased use of rescue therapy. Pediatrics 2005; 115: 406-410
24. Zucker AR, Chernow B, Fields AI, Hung W, BurmanKD.Thyroid function in critically ill children. J.Pediatrics 1985; 107: 552-554.
25. SuvarnaJC,FandeCN.Serum thyroid hormone pro le in critically ill children. Indian J Pediatr 2009; 76(12): 1217-1221.574.
26. Vasa FR, Molitch ME. Endocrine problems in the chronically ill patient.Clin Chest Med 2001; 22: 193-208.
27. Haas NA, Camphausen CK, Kececioglu D. Clinical review: Thyroid hormone replacement in children after cardiac surgery: is it worth a try? Crit Care 2006; 10: 213.
28. Brent GA, Hershman JM. Thyroxine therapy in patients with severe non thyroid illnesses and low serum thyroxineconcentration. J ClinEndocrinolMetabol 1986; 63: 1-8.
29. Cartner JN, Eastman CJ, Corcoran JM, Lazarus L. Effect of severe, chronic illness on thyroid function.Lancet1974; 26:971-974.
ORIGINAL RESEARCH ARTICLE Alterations of Thyroid Function in Critically Ill Children
JOURNAL OF PEDIATRIC CRITICAL CAREVol. 1 - No.4 October - December 2014 236
Knowledge of Pediatric Sepsis among TraineesQalab Abbas, Anwar ul Haque, Syed Asad Ali
Department of Pediatrics and Child Health, Aga Khan University, Karachi, Pakistan
Correspondence:Anwar-ul-HaqueAssociate Professor Department of Pediatrics & Child HealthAga Khan University, Karachi. PakistanTel: +922134864729; Email: [email protected]
Introduction:Sepsis is one of the leading causes of childhood deathsglobally. Its incidence and mortality is particularlyhigh in developing world, where 60 - 80% of under- ve year mortality is attributed to sepsis-related illness1. Recent advances over the last three decades reveal that sepsis is a dynamic process of continuum when shock, which isnot reversed in early stages, progresses to multi-organ dysfunction syndrome, andwhich results in high mortality rate2. Previous published reports show that the mortality in children from septic shock in pediatric intensive
AbstractIntroduction: Sepsis is one of the leading causes of death in children inthe developing world. Several studies have shown that the knowledge and implementation of current American College of Critical Care Medicine-Pediatric Advance Life Support (ACCM-PALS) guidelines on recognition and initial management of sepsis in children leads to signi cant improvement in outcomes. There is little known about the knowledge of current guidelines on recognition and initial management of pediatric sepsis among healthcare providers in Pakistan.Objectives: To assess the retention of knowledge among trainees of pediatrics after a 30 minutes didactic session on recognition and initial management of pediatric severe sepsis and septic shock.Materials and Methods: We conducted 1-hr educational session, which consisted of 30-min lecture, 20-min for assessment through 20 single best multiple choice questions and 10-min ofdebrie ng for pediatric residents at seven academic institutions in Pakistan. The key components of this exercise were recognition, initial ve-minute management, uid resuscitation, inotrope, antibiotics and steroid. Results: Of the 222 residents who participated, 42% (91/222) correctly answered >60% of questions with a median score of 10/20 and IQR of 18. Recognition was done correctly by 41.2% (93/222); 54% (121/222) knew about uid resuscitation, and 27.7% (62/222) about inotropic support. Eighty % (177/222) and 70.8% (158/222) had knowledge of steroid and antibiotic use respectively.Conclusion: The knowledge of the recognition and initial management of sepsis in children among pediatric residents is suboptimal, even after a 30 minutes didactic session on the subject.Key Words:Sepsis, Septic shock, Knowledge, Residents, Mortality
care units of developing countries is about 50%3-7. The American College of Critical Care Medicine-Pediatric Advanced Life Support (ACCM-PALS) published time-sensitive, goal-directed and step-wise clinical practice guidelines for recognition and initial management of severe sepsis and septic shock in children in 2002 and revised in 20078,9. Use of these recommendations resulted in signi cant reduction in mortality in children with such conditions from various countries10,11. These guidelines were published in Journal of Critical Care Medicine which is not freely available12. Khilnani et al published guidelines for resource-limited countries13. Therefore, many pediatricians are not aware of these guidelines in developing countries, which results in delayed recognition and treatment of sepsis and areassociated with high mortality rates. In Pakistan, little is known about knowledge
JOURNAL OF PEDIATRIC CRITICAL CARE237Vol. 1 - No.4 October - December 2014
of current guidelines on recognition and initial management of severe sepsis and septic shock in children among healthcare providers. Post graduate trainees (residents) are generally the front-line physicians in the early care of sick children in Pakistan. Several studies have shown positive impact of educational intervention in recognition and treatment of sepsis both in adult and pediatric clinical practices globally10, 11, 13-15. In this study, we aim to determine the effectiveness of a brief educational intervention aimed towardspediatrics resident physicians in Pakistan in improving their knowledge about the recognition and initial management of pediatric severe sepsis and septic shock.
Materials and Methods:Pediatric residents from seven teaching institutions participated in this program. The educational sessions were conducted at seven teaching institutions where pediatric residency program is recognized by the College of Physicians and Surgeons of Pakistan. All pediatrics residents of these institutions were eligible for participation.Each educational session was of one hour, and consisted of three parts:a. A 30-minutes didactic power point presentation
on the recognition and management of pediatric sepsis based on ACCM-PALS 2007 guidelinesand Pediatric Sepsis guidelines for resource-limited country delivered by a trained pediatric intensive care physician8,13.
b. 20-minutes for knowledge assessment of participants through a multiple choice questionnaire. The assessment included ve questions covering the domain of sepsis recognition, three questions covering vascular access and respiratory management, six questions covering uid therapy, four questions covering inotropes and vasopressors and one question each covering antibiotics and corticosteroid use.
c. 10-min for debrie ng.The half hour talk was delivered emphasizing the recognition and initial management of severe sepsis and septic shock in children based on ACCM-PALS guidelines. Following the talk, all participants were
asked to answer 20 MCQ questions in 20 minutes. Each correct answer was given one score and the overall score was expressed from 0 to maximum of 20. Data was analyzed on SPSS V 19, along with the median, mean and IQR score, frequency and percentages of total correct answers as well as correct answers in each domain is reported.
Results:A total of 222 pediatric residents participated in this program. Out of 7 teaching institutions, two belonged to private sector while the rest were in public sector. Median number of participants in these sessions was 25 (IQR 46). The median test score on the knowledge of pediatric sepsis was 10 out of 20, with IQR of 18. Half of the residents answered fewer than half of the questions correctly and 42% (91/222) were able to correctly respond to >60% of questionnaires. The performance of residents on speci c test items is shown in gure 1. The components of systemic in ammatory response syndrome (SIRS) were correctly recognized by 47.3% (105/222). The de nition of severe sepsis and septic shock was identi ed correctly by 46% (102/222) and 32% (71/222) respectively. The overall response rate of recognition of sepsis was 41.8% (93/222). The correct response about initial management of sepsis in rst ve-minutes was 48% (106/222). Fifty-four percent (121/222) residents responded correctly for the uid-resuscitation management. Twenty eight percent (62/222) correctly answered the questions regarding the use of inotropes. Question about steroids use was correctly answered by 80% of the responders (177/222) while 70.8% (158/222) of the participants correctly answered regarding the use of antibiotics.
Discussion:Our study demonstrates that pediatric residents have suboptimal knowledge about diagnosis of sepsis and its immediate management, even after a thirty minutes didactic session on the subject. Published literature has reported few studies on the knowledge about sepsis among physicians and nurses16-21. Most of the
ORIGINAL ARTICLE Knowledge of Pediatric Sepsis among Trainees

JOURNAL OF PEDIATRIC CRITICAL CAREVol. 1 - No.4 October - December 2014 238
studies have similar results. Zilgam et al showed that 48% and 67% of young doctors correctly identi ed severe sepsis and septic shock in their reports16. We found that 46% and 32% of our pediatric trainees correctly identi ed severe sepsis and septic shock respectively. Assuncao et al also found inadequate physicians�’ knowledge of severe sepsis (56.7%) 18. Fernandez et al showed that only 31.4 %were able to identify SIRS in study of physician�’s knowledge in Surviving Sepsis Campaign22. This is close to our study, in which 47.3% participants correctly identi ed SIRS. We found a particular de ciency in knowledge of correct use of inotropes in pediatric septic shock (27.7%) in our participants. This study highlights very low level of knowledge of pediatric sepsis recognition and management from a developing country like Pakistan where sepsis-related death rate is still very high. Even though our 30 minute didactic session did not lead to optimal knowledge in the residents, Larsen et al and Cruz et al have shown that implementation of an educational program based on ACCM-PALS guidelines improves the survival of children with severe sepsis and septic shock.Perhaps a longer and more intense training workshop than the current 30 minute didactic session is needed to improve the knowledge related to pediatric sepsis in our trainee physicians. Our study has few particular strengths and limitations. Limitations include that we did not perform a pre-educational intervention assessment of knowledge, which would have allowed us to determine the impact of our educational intervention more robustly. Secondly, the number of questions to check a particular domain was small, which could lead to lower precision of our assessment of knowledge of our participants. The strengths of the study include that this is the rst study from Pakistan which highlights lack of critical, life-saving knowledge regarding pediatric sepsis management in the trainee physicians of Pakistan. We also show that justa brief 30 minutes didactic session is not enough to raise the awareness of the ACCM-PALS guidelines, and more robust workshops and training sessions are required, which should be conducted on regular basis.
Conclusion: The knowledge of the recognition and initial management of sepsis in children among pediatric residents is suboptimal in Pakistan. Residency programs should emphasize evidence-based learning objectives to improve the recognition and initial management of pediatric sepsis to decrease the mortality ratein children from sepsis.
Figure1. Score Performance on Knowledge Assessment of Pediatric Trainees on Management of Sepsis
References:1. Kissoon N, Carcillo JA, Espinosa V, Argent A, Devictor D,
Madden M, et al. World Federation of Pediatric Intensive Care and Critical Care Societies: Global Sepsis Initiative. Pediatr Crit Care Med. 2011; 12(5):494-503..
2. Carcillo JA. Pediatric septic shock and multiple organ failure. Crit Care Clin. 2003;19(3):413-40.
3. Jat KR, Jhamb U, Gupta VK. Serum lactate levels as the predictor of outcome in pediatric septic shock. Indian J Crit Care Med. 2011;15(2):102-7.
4. Inwald DP, Tasker RC, Peters MJ, Nadel S. Emergency management of children with severe sepsis in the United Kingdom: the results of the Paediatric Intensive Care Society sepsis audit. Arch Dis Child. 2009;94(5):348-53.
5. Sarthi M, Lodha R, Vivekanandhan S, Arora NK. Adrenal status in children with septic shock using low-dose stimulation test. Pediatr Crit Care Med. 2007; 8(1):23-8.
6. Branco RG, Garcia PC, Piva JP, Casartelli CH, Seibel V, Tasker RC. Glucose level and risk of mortality in pediatric septic shock. Pediatr Crit Care Med. 2005; 6(4):470-2.
7. Carcillo JA, Fields AI. Clinical practice parameters for hemodynamic support of pediatric and neonatal patients in septic shock. Crit Care Med. 2002;30(6):1365-78.
8. Brierley J, Carcillo JA, Choong K, Cornell T, Decaen A, Deymann A, et al. Clinical practice parameters for hemodynamic support of pediatric and neonatal septic shock: 2007 update from the American College of Critical Care
ORIGINAL ARTICLE Knowledge of Pediatric Sepsis among Trainees

JOURNAL OF PEDIATRIC CRITICAL CARE239Vol. 1 - No.4 October - December 2014
Medicine. Crit Care Med. 2009; 37(2): 666-88.9. de Oliveira CF, de Oliveira DS, Gottschald AF, Moura JD,
Costa GA, Ventura AC, et al. ACCM/PALS haemodynamic support guidelines for paediatric septic shock: an outcomes comparison with and without monitoring central venous oxygen saturation. Intensive Care Med. 2008;34(6):1065-75.
10. Cruz AT, Perry AM, Williams EA, Graf JM, Wuestner ER, Patel B. Implementation of goal-directed therapy for children with suspected sepsis in the emergency department. Pediatrics. 2011; 127(3):e758-66.
11. Larsen GY, Mecham N, Greenberg R. An emergency department septic shock protocol and care guideline for children initiated at triage. Pediatrics. 2011; 127(6): e1585-92.
12. Kissoon N, Orr RA, Carcillo JA. Updated American College of Critical Care Medicine--pediatric advanced life support guidelines for management of pediatric and neonatal septic shock: relevance to the emergency care clinician. Pediatr Emerg Care. 2010; 26(11):867-9.
13. Khilnani P, Singhi S, Lodha R, Santhanam I, Sachdev A, Chugh K, et al. Pediatric Sepsis Guidelines: Summary for resource-limited countries. Indian J Crit Care Med. 2010; 14(1): 41-52.
14. Ferrer R, Artigas A, Levy MM, Blanco J, Gonzalez-Diaz G, Garnacho-Montero J, et al. Improvement in process of care and outcome after a multicenter severe sepsis educational program in Spain. JAMA. 2008;299(19):2294-303.
15. Trzeciak S, Dellinger RP, Abate NL, Cowan RM, Stauss M, Kilgannon JH, et al. Translating research to clinical practice: a 1-year experience with implementing early goal-directed therapy for septic shock in the emergency department. Chest.
2006; 129(2): 225-32.16. Paul R, Neuman MI, Monuteaux MC, Melendez E.
Adherence to PALS Sepsis Guidelines and Hospital Length of Stay. Pediatrics. 2012;130(2):e273-80.
17. Ziglam HM, Morales D, Webb K, Nathwani D. Knowledge about sepsis among training-grade doctors. J Antimicrob Chemother. 2006;57(5):963-5.
18. Poeze M, Ramsay G, Gerlach H, Rubulotta F, Levy M. An international sepsis survey: a study of doctors�’ knowledge and perception about sepsis. Crit Care. 2004;8(6):R409-13.
19. Assuncao M, Akamine N, Cardoso GS, Mello PV, Teles JM, Nunes AL, et al. Survey on physicians�’ knowledge of sepsis: do they recognize it promptly? J Crit Care. 2010; 25(4): 545-52.
20. Tromp M, Bleeker-Rovers CP, van Achterberg T, Kullberg BJ, Hulscher M, Pickkers P. Internal medicine residents�’ knowledge about sepsis: effects of a teaching intervention. Neth J Med. 2009 ;67(9):312-5.
21. Santhanam I, Kissoon N, Kamath SR, Ranjit S, Ramesh J, Shankar J. GAP between knowledge and skills for the implementation of the ACCM/PALS septic shock guidelines in India: is the bridge too far? Indian J Crit Care Med. 2009;13(2):54-8.
22. Robson W, Beavis S, Spittle N. An audit of ward nurses�’ knowledge of sepsis. Nurs Crit Care. 2007;12(2):86-92.
23. Fernandez R, Boque M, rodriguez W, Torres-Palacios A, Rodriguez-Vega G, Rive-Mera E. Sepsis: a study of physicians knowledge about the surviving sepsis campaign Crit Care Med 2005; 33 (Suppl): A160
ORIGINAL ARTICLE Knowledge of Pediatric Sepsis among Trainees
Journal of Pediatric Critical CareSubscription Information For Individuals ` 500.00 per year (four issues)For IAP Intensive Care Chapter Members (included complementary as member benefi t)For Institutions/Libraries ` 1000 per year (four issues)
Advertisement Tariff (Per Advertisement)Full Page (black and white) ` 10000; Full page (color) ` 15000Half Page (black and white) ` 7000; Half page (color) ` 12000Front Inside Cover (color) ` 20000Back Inside Cover (color) ` 20000Back Cover (color) ` 25000
• All cheques payable to “IAP Intensive Care Chapter”• IAP Intensive Care Chapter Offi ce
Dr Anil Sachdev, Sir Ganga Ram Hospital, New Delhi.Tel.: 9810098360email: [email protected]; [email protected]

JOURNAL OF PEDIATRIC CRITICAL CAREVol. 1 - No.4 October - December 2014 240
Development and Implementation of Pediatric Critical Care Focused Simulation Workshop and Program in India
Utpal S. Bhalala1, Jesal Sadawarte2, Sameer Sadawarte2, Vishal Baldua2, Swati Garekar2, Rahul Pandit2, Maninder Dhaliwal3, Vinay Joshi4, Preetha Joshi4, Mahesh Mohite5, Chandrahas Deshmukh6, Rakshay Shetty7
and Praveen Khilnani8
1Johns Hopkins Hospital, Baltimore, MD, 2Fortis Hospital, Bombay, India, 3Medanta Hospital, Delhi, India, 4KD Ambani Hospital, Bombay, India, 5Sai Children’s Hospital, New Panvel, India, 6Seth GS Medical College, Bombay,
India, 7Rainbow Children’s Hospital, Vijaywada, India, 8BLK Superspecialty Hospital, New Delhi, India
Correspondence:Utpal S Bhalala, MD, FAAPAssistant Professor of Anesthesiology Critical Care Medicine and Pediatrics; The Johns Hopkins University School of Medicine; Simulation Facilitator, Johns Hopkins Medicine Simulation Center, Baltimore, MD, USAChair In-Training Section of Society of Critical Care, Medicine, USAThe Johns Hopkins Hospital, Bloomberg Children�’s Center, 1800 Orleans Street, Suite 6349B, Baltimore, MD 21287, USATel: (410) 955-6412; Email: [email protected]
Introduction:Simulation training incorporates didactics, case-based learning and hands-on skill training.1 Simulation based training programs geared towards pediatric critical care medicine have been successfully developed and implemented in western world2. But, simulation based training of pediatric healthcare providers is underutilized in developing countries like India. Also, simulation-based, Pediatric Critical Care Medicine (PCCM) courses must focus on basic and advanced PCCM training in keeping with some of the known
Abstract:Simulation-based learning has become a part of residency and fellowship training in many training programs in the United States. But, it has not been incorporated into the pediatric critical care medicine training in the developing countries like India. Simulation-based training allows rapid and repetitive learning of skills necessary to provide a high quality and safe care to critically ill children. There is a need to explore simulation as a tool to train pediatric and pediatric critical care medicine practitioners in the developing world. This is particularly pertinent to Indian subcontinent in which pediatric critical care medicine has grown by leaps and bounds over last decade. We hereby present one of the earliest reports of development and implementation of pediatric critical care focused simulation workshop and program in India.Key Words: Simulation, Critical Care, Child, Training, IndiaThis abstract was presented as a poster at American Academy of Pediatrics, National Conference & Exhibition, San Diego, California, USA, 2014.
challenges of delivery of critical care unique to the developing world. The challenges involved with care of critically ill children in the developing world are limitation of resources, fulminant infections unique to the developing world, transportation of critically ill children to higher level of care and teamwork and communication. We sought to evaluate development and implementation of one of the earliest PCCM focused simulation workshop and program in India. We hereby describe one of the rst PCCM simulation workshops which was successful in providing training in basic and advanced PCCM including fulminant infectious cases pertinent to Indian subcontinent.
Objectives:To develop and implement a PCCM focused simulation workshop and program in India.
Methods:A group of pediatricians and pediatric intensivists

JOURNAL OF PEDIATRIC CRITICAL CARE241Vol. 1 - No.4 October - December 2014
from different institutions of India collaborated with a simulation expert and pediatric intensivist of USA to develop and implement a PCCM simulation workshop and program in India. Need Assessment: The group rst performed an informal need assessment. Since pediatric critical care medicine is often practiced by general pediatricians not formally trained in pediatric critical care medicine, a need assessment was crucial to determine overall structure of the workshop. Also, it was important to assess the needs to characterize the cases, the objectives of the cases, design and on-site resources. Planning: Since one of the major regional suppliers of the simulation equipment was Laerdal Medical India Private Limited, the US-based faculty reached out to them and discussed about the workshop program, their willingness to participate and provide simulation resources (mannequins, simulation technicians and simulation software to run the scenario). The subsequent step was to design the workshop program and prepare the cases with the objectives geared towards the participant needs in keeping with the common critical care scenarios and the key challenges of the practice of critical care medicine in India. While designing the workshop, the organizers discussed about 1) The balance of didactic sessions, hands-on sessions and cases scenarios, 2) The objectives of Pediatric Advanced Life Support (PALS) scenarios, 3) The time allotment for each session, each case and time allotment for debrie ng of each case. Since most the participants were anticipated to be PALS trained, the objectives of the PALS scenarios for the workshop were directed towards high-quality CPR, teamwork and communication. During the workshop planning phase, the organizers, faculty and members of Laerdal Medical India Pvt. Ltd. communicated on a frequent basis via email, teleconference and smart phone messenger (WhatsApp Inc, Mountain View, California, USA). The workshop faculty collected the latest guidelines on common critical care scenarios like dif cult airway management guidelines, traumatic brain injury guidelines and circulated amongst the participants. The US-based simulation expert provided just-in-time �“training of the trainer�” course to the workshop faculty with
dry runs of the case scenarios. The team utilized simulation resources and hospital-based resources to run the workshop. The team also designed skill stations for hands-on skill training in PCCM. The team evaluated the workshop and program through a just-in-time debrie ng and post-session survey of the workshop participants.
Results:The collaboration of pediatricians and pediatric intensivists from different parts of India with simulation expert from USA led to the development and implementation of a successful 2-day simulation-based PCCM workshop. A total of 12 Indian faculties and 1 US faculty participated in the workshop as simulation facilitators. The years of experience of pediatric practice beyond the basic pediatric training among the faculty ranged from 5-20 years. The entire faculty had in-depth knowledge and experience of PCCM and 10 out of 12 Indian faculties had PCCM training at centers of excellence abroad.
Figure 1. Faculty, nurses and hospital administrator at the inauguration of PCCM simulation workshop at Fortis Hospital, Mumbai, India.From left to right (in front)�– Preeti (PICU charge nurse, Fortis Hospital, Mumbai), Vishal Baldua, MD (Pediatric Intensivist, Fortis Hospital, Mumbai), Jesal Sheth, MD (Pediatric Intensivist, Fortis Hospital, Mumbai), Utpal Bhalala, MD, FAAP (Assistant Professor and Simulation Faculty, Johns Hopkins Hospital, Baltimore, Maryland, USA), ArunaBhoy, MD (Director, Fortis Hospital, Mumbai), Praveen Khilnani, MD, FAAP (Chief Pediatric Intensivist, BLK Hospital, Delhi), Mahesh Mohite, MD (Pediatric Intensivist, Sai Children�’s Hospital, New Panvel), Chandrahas Deshmukh, MD (Head of Pediatrics, KEM Hospital, Mumbai), Preetha Joshi, MD (Pediatric Intensivist, KDA Hospital, Mumbai); From left to right (in the back) �– Maninder Dhaliwal, MD (Medanta Hospital, Gurgaon), Sameer Sadawarte, MD (Pediatric Intensivist, Fortis Hospital, Mumbai); Not in picture �– Rakshay Shetty, MD (Pediatric Intensivist,
ORIGINAL ARTICLE Development and Implementation of Pediatric Critical Care Focused Simulation Workshop and Program in India

JOURNAL OF PEDIATRIC CRITICAL CAREVol. 1 - No.4 October - December 2014 242
Rainbow Children�’s Hospital, Vijaywada), Swati Garekar, MD (PediaricCardiologist, Fortis Hospital, Mumbai), Vinay Joshi, MD (Pediatric Intensivist, KDA Hospital, Mumbai), Rahul Pandit, MD (Senior Intensivist, Fortis Hospital, Mumbai).
Based on the needs assessment, the organizers were able to design the workshop program, the cases, the objectives of the cases in keeping with the day-to-day critical care scenarios and challenges unique to the practice of critical care medicine in India. The didactics were restricted to 3 lectures - Simulation in healthcare, Cardiac Arrest and quality of CPR and Role of simulation in PCCM. A signi cant proportion of the workshop time was allotted to the case scenarios, bedside debrie ng and hands-on training.
Figure 2. Utpal Bhalala, MD, FAAP (USA faculty) going over the hands-on training on the use of glidescope in dif cult airway cases.
The rst case scenario enacted by the faculty in front of the participants and displayed on the screen through a live video was aimed at highlighting the importance of the teamwork and communication in management of critically ill child. The remaining case scenarios for the participants were spread evenly over 2 days and intermixed with hands-on sessions to avoid monotony. There were 16 case scenarios run over 2 days and they comprised of rapid sequence intubation, dif cult airway cases, septic shock, dengue hemorrhagic shock, Dengue with abdominal compartment syndrome, acute meningitis, acute myocarditis, ARDS, status epilepticus, cardiac triage, transport of critically ill child, polytrauma, cardiac tamponade, Pulseless Electrical Activity (PEA), Supraventricular Tachycardia (SVT) and Ventricular Fibrillation (VF).
Figure 3. Faculty showing effective bag-mask ventilation during resuscitation case scenario.There were 4 simulation technicians who followed the instructions for running the case scenarios using structured case les which were prepared, revised and nalized by the faculties before the workshop. For running the cases, the workshop used 1 sim junior, 1 sim man 3G, 1 resuscitation baby with CPR feedback, 1 adult resuscitation simulator with CPR feedbackand rhythm generating system; for hands-on training, the workshop used airway trainer,Ultrasound machine and intravenous line tissue blocks.The critical care ultrasound experts rst went over the basic knobology. The hands-on training on use of critical care ultrasound for 4-view cardiac echocardiography, evaluation of inferior vena cava, evaluation of vessels for arterial and venous line placement and lung assessment was provided on a volunteer subject. Additional hands-on training on use of critical care ultrasound for peripheral intravenous line placement was provided on IV task trainer. Of the 34 workshop participants, 11 were pediatric residents/pediatricians, 2 anesthesia trainees, 2 emergency medicine trainees and 19 nurses with interest in PCCM. The workshop cases focused on the learning objectives of teamwork and communication skills. The pediatric advanced life support cases focused on delivering high-quality resuscitation training. The program evaluation and debrie ng at the end of the workshop revealed very high participant satisfaction with comments like �– �“Dedicated and knowledgeable faculty, Case based practical approach, Interactive format, Every Query answered, Excellent quality of the dummies, Hands on experience�”.
ORIGINAL ARTICLE Development and Implementation of Pediatric Critical Care Focused Simulation Workshop and Program in India

JOURNAL OF PEDIATRIC CRITICAL CARE243Vol. 1 - No.4 October - December 2014
Figure 4. Faculty debrie ng about case scenario at the PCCM simulation workshop.
Discussion:Simulation-based training is rapidly becoming a standard of medical training in the western part of the globe. In 2011, a survey conducted by American Academy of Medical Colleges (AAMC) reported that all 90 medical schools and 64 teaching hospitals that responded to the survey indicated that they use simulation during medical school3. There are well established institutional, regional and national simulation programs and training courses in the US.In the developing world, the simulation in health care is in its developing phase.4Over last 5-7 years, a handful of centers have begun simulation-based medical training in India - a few notable names being - TACT (The Academy for Clinical Training), The Apollo Learning and Medical Simulation Center andSRM/STRATUS Centre for Medical Simulation. A group of physicians have been successful in introducing simulation-based training in emergency medicine in India.5 Also, inception of Pediatric Simulation Society of India(pediSTARS India) has marked the introduction of simulation training in pediatric medicine.Pediatric critical care training programs in north-east region of the US have successfully established a rigorous, two day, multi-institutional, high- delity simulation-based �“boot camp�” for junior and senior level pediatric intensive care fellows.6Unfortunately, the applications of simulationfortraining focused towards common challenges of management of critically ill children in India are far and few.The hi- delity mannequins enhance the realism of medical scenarios and promote the concept of �“suspension of disbelief.�”7The concept is to create a learning
mechanism to improve patient care without risk to an actual patient.8-11PCCM has grown by leaps and bounds in India over last decade. Many children�’s centers of excellence have been established under banners of large tertiary care hospitals or healthcare systems. Also, most of the advanced PCCM centers have started formal PCCM training programs. It is about time for growing awareness of the advanced simulation-based learning technology within PCCM community of India. In a developing country like India, the sheer numbers of patients attending the acute care settings like emergency room and PICU makes the work of PICU physicians extremely stressful. Adequate training of these physicians in such real-life scenarios is important to improve the quality of patient care. In this regard, hi- delity simulation technology can become an integral part of PCCM training. The concept of the workshop was not only to give speci c training of PCCM scenarios to the physicians, but also to introduce them to the concept of PCCM training through hi- delity simulators.Our workshop was one of the earliest PCCM workshops in India which combined the high- delity technology to common critical care scenarios and critical care challenges of India.
Conclusions:A successful PCCM focused simulation training workshop and program were developed and implemented through collaboration of faculty from different parts of India under guidance of simulation expert from US. Simulation has a huge potential for improving PCCM training in developing countries like India.
Acknowledgements:We are thankful to the administrators of Fortis Hospital, Mulund, Mumbai for providing us the necessary support for the workshop and Laerdal Medical India Pvt. Ltd. for providing simulation resources for the workshop at no cost.
References:1. Bradley P. The history of simulation in medical education and
possible future directions. Med Educ. 2006; 40:254-62.
ORIGINAL ARTICLE Development and Implementation of Pediatric Critical Care Focused Simulation Workshop and Program in India

JOURNAL OF PEDIATRIC CRITICAL CAREVol. 1 - No.4 October - December 2014 244
2. Cheng A, Hunt EA, Donoghue A, et al. Examining pediatric resuscitation education using simulation and scripted debrie ng: a multicenter randomized trial. JAMA Pediatr. 2013 Jun; 167(6):528-36.
3. Gabriel BA. Prepping for Performance: The Value of Simulation in Medical Education. AAMC Reporter 2012; Available from: https://www.aamc.org/newsroom/reporter/june2012/285322/simulation.html
4. Clinical Training. Available from:http://www.ccm.pitt.edu/clinical-training
5. Oak SN. Medical simulation: A virtual world at your doorstep. J Postgrad Med 2014;60:171-4.
6. Gupta A, Peckler B, Schoken D. Introduction of hi- delity simulation techniques as an ideal teaching tool for upcoming emergency medicine and trauma residency programs in India. J Emerg Trauma Shock. 2008 Jan-Jun; 1(1): 15�–18.
7. Ogden PE, Cobbs LS, Howell MR, Sibbitt SJ, DiPette DJ. Clinical simulation: importance to the internal medicine educational mission. Am J Med. 2007 Sep; 120(9):820-4.
8. Leach DC. Simulation: It�’s about respect. ACGME Bulletin. 2005. Dec, pp. 2�–3. Available from: http://www.acgme.org/acWebsite/bulletin/bu_indexasp
9. Gordon JA, Wilkerson WM, Shaffer DW, Armstrong EG. �“Practicing�” medicine without risk: Students�’ and Educators�’ responses to high- delity patient simulation. Acad Med. 2001; 76:469�–7.
10. Ziv A, Wolpe PR, Small SD, Glick S. Simulation-based medical education: An ethical imperative. Acad Med. 2003; 78:783-8.
11. Sachdeva AK. Acquisition and maintenance of surgical competence. SeminVasc Surg. 2002;15:182-90.
ORIGINAL ARTICLE Development and Implementation of Pediatric Critical Care Focused Simulation Workshop and Program in India

JOURNAL OF PEDIATRIC CRITICAL CARE245Vol. 1 - No.4 October - December 2014
Special Neurocritical Care Review ArticlePediatric Intracranial Aneurysms and Subarachnoid Hemorrhage: Review
Nitesh SinghalPediatric Neurocritical Care Fellow, Department of Critical Care Medicine, ! e Hospital For Sick Children,
555 University Avenue, M5G 1X8, Toronto, CanadaEmail: [email protected]
IntroductionIntracranial aneurysms (ICA) are rare in the pediatric population (age< 18 years). German pathologist Eppinger rst reported a case of childhood aneurysm in a 15-year-old boy who collapsed during strenuous gymnastics. His postmortem examination revealed a ruptured saccular aneurysm of the right anterior cerebral artery1.After several years Edward Bull described the rst ante mortem casein a 17-year-old girl who presented with severe headache and her diagnosis of a ruptured posterior communicating artery aneurysm was subsequently con rmed on autopsy2.In the current era, modern neuro - imaging techniques and availability of angiography has greatly enhanced the ability of physicians to diagnose cerebral aneurysms. However, even today timely diagnosis of a pediatric aneurysm and aneurysmal subarachnoidhemorrhage continues to be challenging.
IncidenceIntracranial aneurysms are extremely uncommon in the pediatric population with a reported prevalence ranging from 0.5% to 4.6%. There is an overall male predominance (male: female ratio 1.75:1)3.
Location of Intracranial AneurysmsMore than 80% of the pediatric ICA are located in the anterior circulation while about 15% are located in the posterior circulation. The most common site in the anterior circulation is the internal carotid artery bifurcation (26%), followed by the anterior communicating artery complex (19%) and middle cerebral artery bifurcation (17%)3. Multiple aneurysms in children are uncommon and seen in less than 5% of all pediatric cases.
Etiology/PathophysiologyThe ICA can be congenital or acquired. The congenital
(also known as berry or saccular) aneurysms are found in about 30% of cases4. The exact pathophysiology of congenital ICA is debatable. It is likely due to a combination of congenital and degenerative factors. The pathological specimens show an absence of internal elastic lamina and tunica media at the site of aneurysm formation. The consensus view is that the transition zone from normal vessel into the aneurysmal sac is characterized by a congenital defect of the internal elastic lamina and tunica media. This site undergoes additional degenerative changes throughout life and turbulent blood ow can cause a saccular out pouching at the area of defect. This combined effect of underlying congenital defect in the vessel wall along with additional degenerative factors is responsible for the rarity of aneurysms in children and their increasing incidence in adulthood3.Acquired causes of ICA in children include trauma, infection and dissection. According to Krings et al. dissecting aneurysms are the most often encountered pediatric aneurysm and may account for up to 50% of all aneurysms in this age group4. Traumatic aneurysms account for 14 to 39% of all pediatric aneurysms in different case series, and may occur after both penetrating and nonpenetrating trauma. Infectious aneurysms account for up to 2 to 10% of all pediatric aneurysms. They are most often of bacterial origin and are rarely caused by fungal infections. The most common organism is staphylococcal aureus, followed by streptococcus viridians and other gram-negative organisms.Other conditions associated with increased risk of ICA are polycystic kidney disease, coarctation of aorta, sickle cell anemia, Ehlers-Danlos syndrome type 4, collagenopathy, and pseudoxanthoma elasticum.
Clinical PresentationThe most common presentation of ICA in children is an acute aneurysmal rupture with subarachnoid
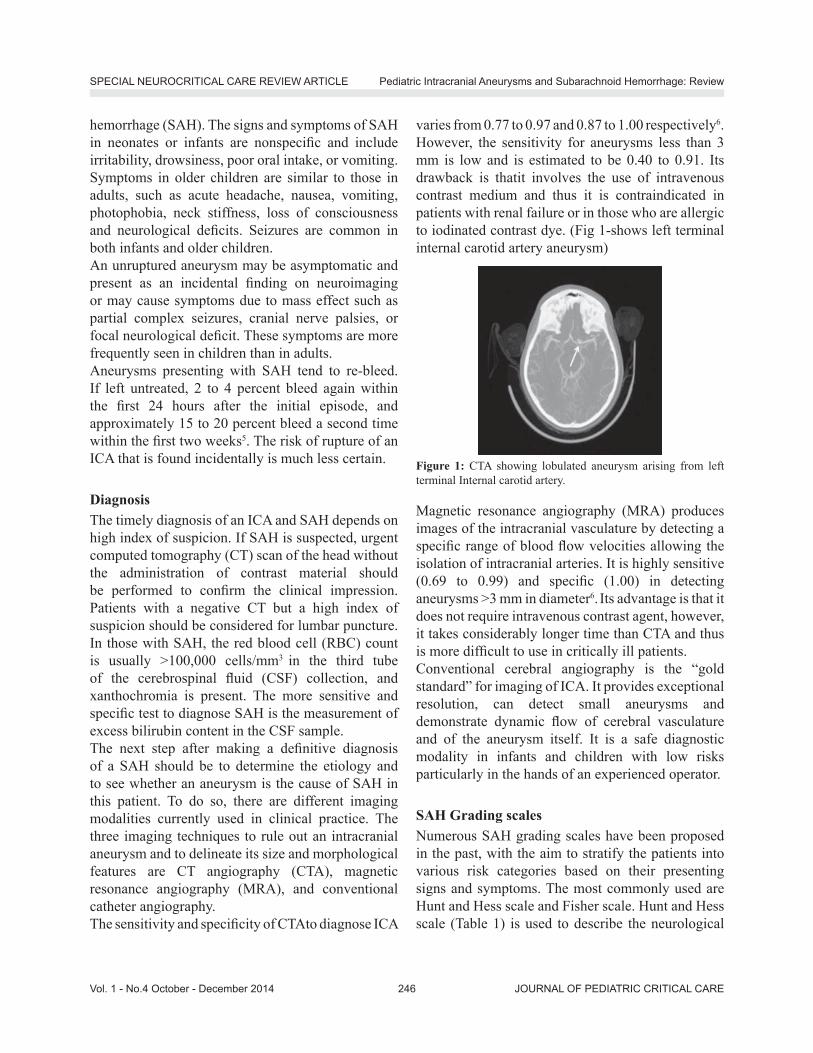
JOURNAL OF PEDIATRIC CRITICAL CAREVol. 1 - No.4 October - December 2014 246
hemorrhage (SAH). The signs and symptoms of SAH in neonates or infants are nonspeci c and include irritability, drowsiness, poor oral intake, or vomiting. Symptoms in older children are similar to those in adults, such as acute headache, nausea, vomiting, photophobia, neck stiffness, loss of consciousness and neurological de cits. Seizures are common in both infants and older children.An unruptured aneurysm may be asymptomatic and present as an incidental nding on neuroimaging or may cause symptoms due to mass effect such as partial complex seizures, cranial nerve palsies, or focal neurological de cit. These symptoms are more frequently seen in children than in adults.Aneurysms presenting with SAH tend to re-bleed. If left untreated, 2 to 4 percent bleed again within the rst 24 hours after the initial episode, and approximately 15 to 20 percent bleed a second time within the rst two weeks5. The risk of rupture of an ICA that is found incidentally is much less certain.
DiagnosisThe timely diagnosis of an ICA and SAH depends on high index of suspicion. If SAH is suspected, urgent computed tomography (CT) scan of the head without the administration of contrast material should be performed to con rm the clinical impression. Patients with a negative CT but a high index of suspicion should be considered for lumbar puncture. In those with SAH, the red blood cell (RBC) count is usually >100,000 cells/mm3 in the third tube of the cerebrospinal uid (CSF) collection, and xanthochromia is present. The more sensitive and speci c test to diagnose SAH is the measurement of excess bilirubin content in the CSF sample.The next step after making a de nitive diagnosis of a SAH should be to determine the etiology and to see whether an aneurysm is the cause of SAH in this patient. To do so, there are different imaging modalities currently used in clinical practice. The three imaging techniques to rule out an intracranial aneurysm and to delineate its size and morphological features are CT angiography (CTA), magnetic resonance angiography (MRA), and conventional catheter angiography.The sensitivity and speci city of CTAto diagnose ICA
varies from 0.77 to 0.97 and 0.87 to 1.00 respectively6. However, the sensitivity for aneurysms less than 3 mm is low and is estimated to be 0.40 to 0.91. Its drawback is thatit involves the use of intravenous contrast medium and thus it is contraindicated in patients with renal failure or in those who are allergic to iodinated contrast dye. (Fig 1-shows left terminal internal carotid artery aneurysm)
Figure 1: CTA showing lobulated aneurysm arising from left terminal Internal carotid artery.
Magnetic resonance angiography (MRA) produces images of the intracranial vasculature by detecting a speci c range of blood ow velocities allowing the isolation of intracranial arteries. It is highly sensitive (0.69 to 0.99) and speci c (1.00) in detecting aneurysms >3 mm in diameter6. Its advantage is that it does not require intravenous contrast agent, however, it takes considerably longer time than CTA and thus is more dif cult to use in critically ill patients.Conventional cerebral angiography is the �“gold standard�” for imaging of ICA. It provides exceptional resolution, can detect small aneurysms and demonstrate dynamic ow of cerebral vasculature and of the aneurysm itself. It is a safe diagnostic modality in infants and children with low risks particularly in the hands of an experienced operator.
SAH Grading scalesNumerous SAH grading scales have been proposed in the past, with the aim to stratify the patients into various risk categories based on their presenting signs and symptoms. The most commonly used are Hunt and Hess scale and Fisher scale. Hunt and Hess scale (Table 1) is used to describe the neurological
SPECIAL NEUROCRITICAL CARE REVIEW ARTICLE Pediatric Intracranial Aneurysms and Subarachnoid Hemorrhage: Review

JOURNAL OF PEDIATRIC CRITICAL CARE247Vol. 1 - No.4 October - December 2014
condition on admission and is considered a good predictor of ultimate outcome7. The Fisher grade (Table 2) uses a four-point scale to describe the amount of blood on non-contrast-enhanced CT of the head and has been shown to correlate with the development of vasospasm8.
Table 1: Hunt and Hess grading system for patients with SAHGrade Neurological status Percent risk
of death as reported originally
1 Asymptomatic or mild headache and slight nuchal rigidity
11
2 Severe headache, stiff neck, no neurological de cit except cranial nerve palsy
26
3 Drowsy or confused, mild focal neurological de cit
37
4 Stuporous, moderate or severe hemiparesis
71
5 Coma, decerebrate posturing 100
Table 2: Fisher grade of cerebral vasospasm risk in SAHGroup Subarachnoid blood distribution1 None2 Thin distribution with vertical layers < 1mm3 Thick localized clots or vertical layers > 1mm4 Diffuse or no SAH, but with intracerebral or
intraventricular hemorrhage
ManagementA multidisciplinary team including neurosurgeon, interventional neuroradiologist, neurologist and pediatric intensivist best managepediatric ICA. Theinitial treatment of a child with ruptured ICA focuses on maintenance of adequate ventilation, hemodynamic stabilization, maintenance of cerebral perfusion, preventing intracranial hypertension and minimizing the risk of re-bleeding. The unconscious patients or those with a falling Glasgow Coma Scale (GCS) should be intubated and ventilated. Prior to securing the aneurysm, blood pressure should be adequately maintained, as hypertension increases the risk of re-bleeding while excessive fall in blood pressure increases risk of cerebral ischemia. Some of the patients may develop hydrocephalus as a result of
aneurysmal SAH and may need external ventricular drain placed for initial stabilization before aneurysm obliteration. The ruptured ICA should be secured as soon as possible after initial stabilization as the greatest risk of re-bleeding occurs within the rst 24 hours.
Securing the aneurysm:There are three options for treating ICA: observation, clipping and endovascular coiling. The management of unruptured aneurysms that are discovered incidentally depends on the patient�’s clinical condition, and size and locationof the aneurysm. Depending upon their size and location, they can be either observed with routine periodic follow-up imaging or treated electively. All ruptured aneurysms should be secured as early as possible by either clipping or coiling.Clipping of aneurysms requires craniotomy and placement of MRI compatible permanent clips across the neck of the aneurysm, excluding it from the circulation (Fig 2 A). During the last decade endovascular procedures have been increasingly used to treat ICA. An interventional neuroradiologist usually performs endovascular coiling. With the use of angiographic techniques, a microcatheter is advanced into the aneurysm, and detachable coils of various sizes are deployed to decrease the amount of blood or to stop blood from lling the aneurysm (Fig 2 B).
Figure 2 (A): Microsurgical Clipping of an Aneurysm.
SPECIAL NEUROCRITICAL CARE REVIEW ARTICLE Pediatric Intracranial Aneurysms and Subarachnoid Hemorrhage: Review

JOURNAL OF PEDIATRIC CRITICAL CAREVol. 1 - No.4 October - December 2014 248
Figure 2 (B): Endovascular Occlusion of an Aneurysm. Adapted from N Engl J Med 2006; 354:387- 396
Clipping or CoilingBoth the techniques have their own advantages and disadvantages. Though successful clipping is generally associated with de nitive protection against re-rupture, it has risks associated with craniotomy. Endovascular coiling does not need craniotomy but aneurysms treated with coiling may reoccur and there is a risk of rupture of the aneurysm during catheter advancement into the aneurysm or during coil placement.The International Subarachnoid Aneurysm Trial (ISAT) was a large, multicenter prospective study in adults comparing endovascular and surgical techniques for aneurysms presenting with SAH. Though the trial was criticized for many reasons, it showed an improvement in early survival in selected patients receiving endovascular therapy9. There are very few pediatric studies comparing both modalities of treatment. In the study by Agid et al, 77% of the patients in the endovascular group had good recovery as compared to 45% of the patients in surgical group10. In their study Sanai et al, had shown that patients treated with clipping had more complete obliteration of their aneurysm and signi cantly lower recurrence risk as compared to patients in coiling group11. Stiefel et al, found no difference in outcome of patients treated with either clipping or coiling12.On the basis of literature, it remains controversial whether a given ICA should be treated surgically or managed endovascularly. However, recent American Heart Association (AHA) guidelines for the
management of SAH in adults have recommended that in patients with ruptured aneurysms who are technically amenable to endovascular coiling and surgical clipping, the former should be considered13. However, there are no pediatric guidelines and the decision to do surgical clipping or endovascular coiling should be taken after discussion with multidisciplinary team.
Medical management of aneurysmal subarachnoid hemorrhageThe medical management of pediatric patients with aneurysmal SAH is as important as the surgical or endovascular intervention in ensuring a favorable outcome. Following securing of the aneurysm, management of SAH involves close neuromonitoring, prevention or treatment of vasospasm and other complications. Most of these patients need admission to the intensive care unit.
Vasospasm and Delayed Cerebral IschemiaVasospasm causing delayed cerebral ischemia (DCI) is de ned as any neurological deterioration, including focal neurological de cits and altered consciousness, of which no other cause can be identi ed by radiographic, laboratory or electrophysiological investigations. It is very common in adult population with an incidence of about 30% but incidence of both radiographic and symptomatic vasospasm in pediatric population is much less. It usually happens between days four and ten after initial hemorrhage and persists for several days.
Diagnosis and monitoring for VasospasmAll patients with aneurysmal SAH should be closely monitored clinically. Reduction in the level of consciousness with or without focal neurological de cit should raise suspicion of vasospasm. Digital subtraction angiography remains the diagnostic gold standard however CTA and MRA can be helpful at initial suspension (Fig 3). Transcranial Doppler Ultrasonography measures blood ow in basal cerebral arteries and is a useful noninvasive method to detect vasospasm.
SPECIAL NEUROCRITICAL CARE REVIEW ARTICLE Pediatric Intracranial Aneurysms and Subarachnoid Hemorrhage: Review

JOURNAL OF PEDIATRIC CRITICAL CARE249Vol. 1 - No.4 October - December 2014
Figure 3: MRA showing severe segmental narrowing in the terminal left Internal Carotid Artery due to vasospasm
Treatment of VasospasmSeveral pharmaceutical agents like magnesium, anti- brinolytics, anti-platelets, and statins have been tried for the prevention and treatment of vasospasm but none has any proven bene ts except Nimodipine. Nimodipine is the only agent that has been shown to reduce the incidence of vasospasm and DCI and improve neurological outcome14. The AHAguidelines recommend that oral nimodipine should be administered to all the patients with aneurysmal SAH immediately after diagnosis. The recommended dose in adults is 60 mg every four hours and is usually continued for 21 days. Although intravenous nimodipine is sometimes used, this route of administration remains unproven.Another therapy that has been widely used to prevent and treat vasospasm is Triple H (hypertension, hypervolemia and hemodilution) therapy. However, this combination therapy has never been clinically proved to be useful and hypervolemia can be potentially harmful to critically ill patients. As per the recent guidelines, euvolemia rather than hypervolemia is recommended for both prophylaxis and treatment of vasospasm, and that hemodilution is not recommended13. Hypertensive therapy (induction of hypertension with vasopressors) is only recommended in patients with symptomatic vasospasm. Patients with symptomatic cerebral vasospasm, particularly those who have no response to medical treatment should undergo cerebral angioplasty of the narrowed vessels and/or selective intra-arterial vasodilator therapy13.
Management of other complicationsSeizuresSeizures occur commonly in patients after aneurysmal
SAH. The routine long term use of anticonvulsants is not recommended but the use of prophylactic anticonvulsants may be considered in the immediate post hemorrhagic period13. Levetirecetam is preferred and phenytoin should be avoided because of associated cognitive effects and poor outcome15.
FeverFever occurs in up to two-third of patients with aneurysmal SAH. Although the cause of fever can be related to the hypothalamic effects of subarachnoid blood, an infective cause should always be ruled out. Fever should be aggressively controlled with a target to achieve normothermia by the use of standard or advanced temperature modulating systems.
DysnatraemiaBoth hypernatremia and hyponatremia can occur in patients after aneurysmal SAH. Hyponatremia can develop from different mechanisms after SAH. It can be related to the syndrome of inappropriate antidiuretic hormone secretion (SIADH), cerebral salt wasting syndrome or iatrogenic hemodilution. It is important to monitor and diagnose hyponatremia as treatment varies with etiology.
AnemiaAnemia is common after aneurysmal SAH and may compromise brain oxygen delivery. Current guidelines recommend that the use of packed red cell transfusion to maintain hemoglobin concentration between 8-10 g/dl is reasonable in patients with SAH16.
Cardiac dysfunctionLeft ventricular dysfunction requiring inotropic support can occur in patients after SAH. It results from excessive catecholamine release in response to intracranial hemorrhage. In most cases it is temporary and resolves spontaneously after a variable period.
OutcomeOutcomes after aneurysm surgery and aneurysmal SAH are much better andfavorable in children as
SPECIAL NEUROCRITICAL CARE REVIEW ARTICLE Pediatric Intracranial Aneurysms and Subarachnoid Hemorrhage: Review

JOURNAL OF PEDIATRIC CRITICAL CAREVol. 1 - No.4 October - December 2014 250
compared to adults. In general, children have a lower incidence of vasospasm, which accounts for most of the morbidity and mortality associated with aneurysmal rupture. Overall, in different case series 90-95% of pediatric patients has good outcome with Glasgow coma outcome scale of 4 or 5.
References: 1. Eppinger H. Stenosis aortae congenita seu isthmus persistens.
Vjschr Prakt Heilk 1871; 112:31-67.2. Ljunggren B. Great Men with Sick Brains and Other Essays.
Park Ridge, IL: American Association of Neurological Surgeons; 1989.
3. Pradilla G, Lesniak MS, Tamargo RJ. Pediatric Intracranial aneurysms. Current management in child neurology, third edition. 2005, 606-612
4. Krings T, Geibprasert S & Ter Brugge KG. Pathomechanisms and treatment of pediatric aneurysms. Childs Nerv Syst (2010) 26:1309-1318.ent in child neurology, third edition. 2005, 606-612.
5. Greenberg MS. SAH and aneurysms. In: Greenberg MS, ed. Handbook of neurosurgery. 5th ed. New York: Thieme Medical, 2000: 754-803.
6. Jose I. Suarez, Robert W. Tarr, and Warren R. Selman. Aneurysmal Subarachnoid Hemorrhage. N Engl J Med 2006; 354: 387-396.
7. Hunt WE, Hess RM. Surgical risk as related to time of intervention in the repair of intracranial aneurysms. J Neurosurg 1968; 28:14�–20
8. Fisher, CM, Kistler, JP, Davis, JM. Relation of cerebral vasospasm to subarachnoid hemorrhage visualized by CT scanning. Neurosurgery 1980; 6:1
9. Molyneux A, Kerr R, Stratton I, et al. International Subarachnoid Aneurysm Trial (ISAT) of neurosurgical clipping versus endovascular coiling in 2143 patients with ruptured intracranial aneurysms: a randomized trial. Lancet 2002; 360:1267-74.
10. Agid R, Souza MPS, Reintamm G et al. The role of endovascular treatment for pediatric aneurysms. Childs Nervous System (2005) 21:1030-1036.
11. Sanai N, Quinones-Hinojosa A, Gupta NM, et al. Pediatric intracranial aneurysms: durability of treatment following microsurgical and endovascularmanagement. J Neurosurg 2006; 104(2 Suppl): 82-9.
12. Michael F. Stiefel, Gregory G. Heuer, Anuj K. Basil et al. Endovascular and surgical treatment of ruptured cerebral aneurysms in pediatric patients. Neurosurgery 63:859�–866, 2008
13. Guidelines for the Management of Aneurysmal Subarachnoid Hemorrhage. Stroke. 2012; 43: 1711-1737
14. Dorhout Mees SM, Rinkel GJ, Feigin VL et al. Calcium antagonists foraneurysmal subarachnoid haemorrhage. Cochrane Database Syst Rev 2007: CD000277
15. Naidech AM, Kreiter KT, Janjua N et al. Phenytoin exposure isassociated with functional and cognitive disability after subarachnoidhemorrhage. Stroke 2005; 36:583-87.
16. Diringer MN, Bleck TP, Claude HJ et al. Critical care management ofpatients following aneurysmal subarachnoid hemorrhage: recommendations from the Neurocritical Care Society�’s Multidisciplinary Consensus Conference. Neurocritical Care 2011; 15: 211-40.
SPECIAL NEUROCRITICAL CARE REVIEW ARTICLE Pediatric Intracranial Aneurysms and Subarachnoid Hemorrhage: Review

JOURNAL OF PEDIATRIC CRITICAL CARE251Vol. 1 - No.4 October - December 2014
Case ReportPulmonary Tuberculosis with ARDS and Hemophagocytic Syndrome
–A case reportPrabhas Prasun Giri*, Priyankar Pal**, Nupur Ganguly**, Apurba Ghosh***
*RMO Cum Clinical Tutor, Institute of Child Health, **Associate professor, Institute of Child Health, ***Professor of Pediatrics, Institute of Child Health, Kolkotta
Correspondence:Dr Prabhas Prasun GiriFlat C1; ANANDAN; 173, Sarat Ghosh Garden RoadKolkata-31, Wesbengal, IndiaMobile- +91-90519-58420Email- [email protected]
IntroductionTuberculosis continues to be an important cause of morbidity and mortality for children worldwide.1 Very rarely it can manifest as diffuse bilateral X-ray changes suggestive of Acute Respiratory Distress Syndrome (ARDS)2. ARDS is an emergency and mostly need mechanical ventilation ,non-invasive or invasive. ARDS can be a pulmonary manifestation of HLH.3 But tuberculosis complicated by both ARDS and HLH is extremely rare and till date there is no case report. Our case, 11 year old boy, presented with PUO, developed ARDS and HLH and ultimately diagnosed to be having tuberculosis.
Case Report10yr old boy admitted with history of fever for 14 days. Clinical examination revealed only a just palpable liver. Investigation showed Hb 11.2gm%, TLC 6400/cmm, DLC - N 54 L38 M02 E03 B 02, Malaria Parasite not found, SGPT 220 IU/dl, Widal 1:320, chest x-ray noncontributory. Assuming a clinical diagnosis of enteric fever, iv ceftriaxone was started. Over next few days his fever decreased in
ABSTRACT:Hemophagocytic lymphohistiocytosis(HLH) is a heterogeneous group of clinical syndromes, either familial or genetic in origin or secondary, characterised by uncontrolled non-malignant proliferation of T-lymphocytes, histiocytes and macrophages leading to a cytokine storm and manifest as prolonged fever, organomegaly, cytopenia, hyperferritenemia and demonstrable hemophagocytosis in the bone marrow. Secondary infection associated HLH(IAHLH) can be triggered by many infections, mostly viral. Here we present a case of Pulmonary tuberculosis complicated by ARDS and HLH.
intensity but did not subside. Mantoux test and blood culture were negative.On day 5 of admission, he suddenly developed severe respiratory distress. Respiratory rate was 86/min, SPO2 in room air was 56%, with 12 litres of O2 it was only 88-90%. There was no accessory sounds in the chest, B/L VBS was there and air entry was good. Chest x ray showed B/L diffuse patchy opacities suggestive of ARDS. ( gure 1) ABG revealed severe hypoxemia and so he was intubated and ventilated. Investigations showed a raised CRP with pancytopenia (TLC-3200, PLATELET 80,000, HB 8.2). HRCT showed features of ARDS with cavity and nodules in left upper lobe. ( gure 2)
Fig 1
Fig.2

JOURNAL OF PEDIATRIC CRITICAL CAREVol. 1 - No.4 October - December 2014 252
Because of the sudden deterioration with development of cytopenia, HLH was thought of and corresponding tests showed Ferritin 7568ng/dl, TG 423mg/dl, LDH 2543IU/dl, Fibrinogen 123gm/L, FDP 7800. IV Immunoglobulin (2gram/kg) with IV dexamethasone 10mg/m2 /day was started following bone marrow aspiration.Bronchoalveolar lavage showed acid fast bacilli and it was positive for Mycobacterium Tuberculosis Complex by DNA ampli cation (TB PCR Qualitative). Bone marrow revealed plenty of hemophagocytes.Following initiation of therapy, blood parameters improved in the next 72 hours and he was extubated on day 5 of Mechanical ventilation and discharged on day 26 of admission with 4 antitubercular drugs (HRZE) and steroid. Dexamethasone was given for 8 weeks in tapering doses as per HLH 2004 protocol, but no other chemotherapeutic drugs like Cyclosporine or Etoposide was used.He is on regular follow up for last 2 years and remains asymptomatic.
DiscussionChildren contribute a signi cant proportion of the disease burden of tuberculosis and suffer severe disease-related morbidity and mortality, particularly in endemic areas1. Pulmonary tuberculosis can manifest in various way in pediatric population. Symptomatic primary complex, progressive primary disease, endobronchial tuberculosis, tubercular pleural effusion and miliary tuberculosis are the commonest modes of presentation whereas gross brosis or cavitating lung lesions are uncommon4.ARDS (Acute respiratory distress syndrome) can result from either a direct lung injury or from a downstream in ammatory process manifested by profound hypoxemia and respiratory failure. ARDS has been traditionally described as: the acute onset of respiratory failure with bilateral in ltrates on chest radiograph associated with hypoxemia as de ned by a PaO2/FiO2 ratio 200 mmHg, and there should be no evidence of left atrial hypertension or a pulmonary capillary pressure should be <18 mmHg (if measured) to rule out cardiogenic edema. In pediatric age group, ARDS is largely secondary to lung infections5.
ARDS as a manifestation of pulmonary tuberculosis in children is extremely rare.Hemophagocytic lymphohistiocytosis (HLH) occurs due to uncontrolled proliferation and activation of macrophages, cytotoxic t cells and antigen presenting cells resulting in a state of hypercytokinemia6. Any infection can trigger HLH, though most are triggered by viral infections.7
Pulmonary tuberculosis manifesting as ARDS has rarely been reported in adults. Miliary tuberculosis is an uncommon but important treatable cause of ARDS. Mohan et al8 reported 6 cases of miliary TB who developed ARDS in the course of their disease. Agarwal et al2 also demonstrated that nine (4.9%) out of 187 adult patients had ARDS secondary to tuberculosis. But tubercular ARDS in pediatric population is extremely rare and limited to few case reports only.Tuberculosis is considered a rare cause for infection associated secondary HLH. Wen su et al9 reported a case of tuberculosis induced HLH in a 58 year old patient under hemodialysis. Gupta et al10 presented a case of generalised lymphadenopathy, hepatosplenomegaly and progressive cytopenias in a 17-year-old male who was simultaneously diagnosed to have HLH and Tuberculosis as AFB was demonstrated from the lymph node aspirates. Deshpande et all11 also reported a case of miliary tuberculosis with hemophagocytosis in a 2 months old infant.The most common pulmonary manifestation of HLH is Acute lung injury or ARDS. Lahm et al12 reported a case of Adenovirus associated HLH with ARDS. Roxana Mansour Ghanaiee et al13 also reported few cases of HLH in pediatric population in Iran who developed ARDS.But, Pulmonary tuberculosis with ARDS with secondary HLH is yet to be reported in literature. IAHLH does not always need full HLH 2004 therapy protocol; they can often be treated successfully with low intensive therapy depending upon the severity, and the initial response to steroids. Many of them can be treated with steroid only protocol14 as this child received only steroid in a tapering dosage over 8 weeks.
Reference1. Banu Rekha, Soumya Swaminathan. Childhood tuberculosis
CASE REPORT Pulmonary tuberculosis with ARDS and Hemophagocytic Syndrome

JOURNAL OF PEDIATRIC CRITICAL CARE253Vol. 1 - No.4 October - December 2014
�– global epidemiology and the impact of HIV. Paediatric Respiratory Reviews.Volume 8, Issue 2, June 2007, Pages 99�–106
2. Ritesh Agarwal, Dheeraj Gupta, Ashutosh N. Aggarwal, Digamber Behera, Surinder K. Jindal. Experience with ARDS caused by tuberculosis in a respiratory intensive care unit. Intensive Care Medicine.September 2005, Volume 31, Issue 9, pp 1284-1287
3. Fitzgerald NE, MacClain KL. Imaging characteristics of Hemophagocytic lymphohistiocytosis. Pediatr Radiol. 2003; 33(6): 392-401.
4. Seth V, Kabra SK. essentials of tuberculosis in children,3rd ed.New Delhi; Jaypee Publishers, 2006.
5. Bernard GR1, Artigas A, Brigham KL, Carlet J, Falke K, Hudson L, Lamy M, Legall JR, Morris A, Spragg R. The American-European Consensus Conference on ARDS. De nitions, mechanisms, relevant outcomes, and clinical trial coordination. Am J Respir Crit Care Med. 1994 Mar; 149(3 Pt 1): 818-24.
6. Janka GE. Familial and acquired hemophagocytic lymphohistiocytosis. Annu Rev Med. 2012; 63:233-246.
7. Hideaki Kikuta, Yukio Sakiyama, Shuzo Matsumoto, Tsutomu Oh-lshi, Takashi Nakano, Tetsurou Nagashima, Toshiaki Oka, Takashi Hironaka, and Kanji Hirai. Fatal Epstein-Barr Virus-Associated Hemophagocytic Syndrome. Blood, Vol82, No 11 (December I), 1993: pp 3259-3264
8. A Mohan, S K Sharma, J N Pande. Acute respiratory distress syndrome (ARDS) in miliary tuberculosis: a twelve year
experience. The Indian journal of chest diseases & allied sciences 01/1996; 38(3):157-62.
9. Nai-Wen Su, Chi-Kuan Chen, Gon-Shen Chen, Ruey-Kuen Hsieh, Ming-Chih Chang. A case of tuberculosis-induced hemophagocytic lymphohistiocytosis in a patient under hemodialysis. International Journal of Hematology, 2009, Volume 89, Number 3, Page 298
10. Gupta AP, Parate S N, Bobhate S K, Anupriya. Hemophagocytic syndrome: A cause for fatal outcome in tuberculosis. Indian J Pathol Microbiol 2009; 52:260-2
11. A. Deshpande, Priyanka S. Nayar, Avinash M. Pradhan, and Rumma V. Manchanda. Miliary Tuberculosis with Hemophagocytosis in a Two Months Old Infant. Indian J Hematol Blood Transfus. Sep 2010; 26(3): 115�–117.
12. Tim Lahma, Helena N. Spartzb, Dean A. Hawleyb, et al. Fatal adenovirus serotype 21 infection associated with hemophagocytic lymphohistiocytosis and multiorgan failure. Respiratory Medicine CME.Volume 3, Issue 4, 2010, Pages 223�–225
13. Roxana Ghanaie,Reza Shiari, Abdollah Karimi, Shahnaz Armin, Alireza Fahimzad, Faride Shiva, and Mohammad Arzanian. A case series report of Iranian children Hemophagocytic Lymphohistiocytosis syndrome. Arch Pediatr Infect Dis. 2012; 1(1):31-35
14. Prabhas Prasun Giri, Priyankar Pal, Apurba Ghosh, Rajiv Sinha. Infection-associated haemophagocytic lymphohistiocytosis: a case series using steroids only protocol for management. Rheumatol Int 2013 May 23;33(5):1363-6
CASE REPORT Pulmonary tuberculosis with ARDS and Hemophagocytic Syndrome

JOURNAL OF PEDIATRIC CRITICAL CAREVol. 1 - No.4 October - December 2014 254
Symposium: Monitoring in Pediatric Critical CareRespiratory Monitoring in PICU
Vishram B. Buche, Anand BhutadaDept of Pediatric Intensive Care (PICU), Central India’s CHILD Hospital and Research Institute, Nagpur
Correspondence:Dr Vishram BucheDirector NICU (level 3) Dept of Pediatric Intensive Care (PICU), Central India�’s CHILD Hospital and Research Institute, Nagpur.email: [email protected]
Respiratory monitoring in Pediatric Intensive Care Unit (PICU) is an essence of critical care. Be it clinical, invasive or noninvasive, monitoring remains crucial in overall assessment of a critically ill child with cardio-respiratory problems. A functioning knowledge of the various tools of monitoring is essential in applying their use to patient care. This chapter discusses traditional methods of evaluation of respiratory system and newly established gold standard techniques as well. Attention is also given to newer modalities, including those that are investigational or currently limited to bench application, that give promise for future application in PICU clinical practice. Pulse oximetry and Capnography are the most commonly employed monitoring modalities, which have transformed the practice of critical care in last 10 years. Arterial blood gases and calculated oxygen indices have been most commonly used and form essential part of monitoring in PICU. However may be the excellent information provided by respiratory monitors it cannot replace careful bedside clinical examination.Essentially respiratory monitoring consists of:1. Physical examination 2. Non-invasive monitoring 3. Invasive monitoring
Physical ExaminationMeasuring the respiratory rate (Table 1) is easy and has a got good accuracy in prediction of lower respiratory tract infection. Presence of increased work of breathing is suggested by aring of alae nasi, suprasternal, intercostal and subcostal retractions, use of accessory muscles of respiration and paradoxical breathing.
Normal Respiratory Rates…….. (Table1)Age Respiratory rate
Infant (birth�–1 year) 30-60Toddler (1�–3 years) 24-40Preschooler (3�–6 years) 22-34School-age (6�–12 years) 18-30Adolescent (12�–18 years) 12-16
Cyanosis of tongue and oral mucosa indicate oxygen saturation (SaO2) of less than 80 percent. However, there is signi cant inter-observer variability and dif culty in SaO2 interpretation. Let�’s take a moment to review the Silverman-Anderson Index related to the assessment of the neonates with suspected or diagnosed RDS. When a neonate is a premature, or has underlying pathology, then expiratory grunting, retraction of the chest wall muscles and other signs of respiratory distress may be readily seen. The Silverman �– Anderson Index, commonly referred to as the Silverman retraction score, was developed as a systematic means of assessing newborn respiratory status, particularly when respiratory distress is suspected. Silverman- Anderson Index (Table 2)
Feature Score 0 Score 1 Score 2Chest movement Equal Respiratory
LagSee-saw
respirationIntercostal retractions None Minimal MarkedXiphoid retraction None Minimal MarkedNasal Flaring None Minimal MarkedExpiratory Grunt None Audible
wheeze by stethoscope
Audible
The parameters assessed by inspection and auscultation of the upper and lower chest and nares on a scale of 0,1or 2. As it is observed in the table 2, the higher the score, the more severe is the respiratory distress.
JOURNAL OF PEDIATRIC CRITICAL CARE255Vol. 1 - No.4 October - December 2014
Non-Invasive Respiratory monitoringHistory
Oximetry measures the percentage of hemoglobin saturated with oxygen by passing speci c wavelengths of light through the arterial blood. In 1875 a German physiologist named Karl von Vierofdt demonstrated that the oxygen in his hand was consumed when a tourniquet was applied. This was done utilizing transmitted light waves, but the development of the pulse oximeter was still a long way off. In 1936 Karl Matthes developed the rst ear saturation meter that used two wavelengths of light. This compensated for the variations in tissue absorption. This idea was improved upon in 1940 when Glen Millikin developed a lightweight oximeter to help the military to solve their aviation hypoxia problem. The modern pulse oximeter was developed in 1972 by Takuo Aoyagi while he was working in Tokyo developing a noninvasive cardiac output measurement, using dye dilution and an ear densitometer. He noticed a correlation in the difference between unabsorbed infrared and red light and the oxygen saturation. This led to the clinical application of the pulse oximeter. It was not until 1980 that Nellcor produced the rst commercial pulse oximeter that was reliable, robust, and affordable. In 1988 the use of a pulse oximeter during anesthesia and recovery room became mandatory in Australia. Since then, its use has become mandated in many areas from pre-hospital treatment to intensive care units.
Pulse oximetry is now an integral part of PICU monitoring which helps in the assessment of the patient�’s cardio-respiratory (oxygenation) status. It is a simple, non-invasive and continuous method of monitoring the oxygen saturation of arterial blood (SaO2) and now widely accepted as the fth vital sign. The pulse oximeter is a convenient, cost-effective way to monitor the patient�’s oxygenation status (and thereby O2 content) and determine the changes before they are clinically apparent. It is important to know how oximeters work in order to maximize their performance and avoid errors in the interpretation of results. Pulse oximetry is based on principles of spectrophotometry governed by Beer-Lambert law. The mandatory condition for interpretation of SaO2 is the presence of a pulsatile arteriolar blood ow.How pulse oximeter works? Interpretation of SaO2 is based on the fact that oxygenated hemoglobin (HbO2) and deoxygenated hemoglobin (Hb) have different absorption spectra. Currently available pulse oximeters use two light-emitting diodes (LEDs) that emit light at the 660 nm (red) and the 940 nm (infrared) wavelengths. These two wavelengths are used because HbO2 and Hb have different absorption spectra at these particular wavelengths. In the red region, HbO2 absorbs less light than Hb, while the
reverse occurs in the infrared region. The ratio of absorbencies at these two wavelengths is calibrated empirically against direct measurements of SaO2 in volunteers, and the resulting calibration algorithm is stored in a digital microprocessor within the pulse oximeter. During subsequent use, the calibration curve is used to generate the pulse oximeter�’s estimate of arterial saturation (SpO2). In addition to the digital readout of O2 saturation and pulse rate, most pulse oximeters display a plethysmographic waveform which can help clinicians to distinguish an artifactual signal from the true signal.There are two techniques of measuring SaO2: transmission and re ectance. In the transmission method the emitter and photodetector are opposite of each other with the measuring site in-between. The light can then pass through the site. In the re ectance method, the emitter and photodetector, is next to each other on top the measuring site. The light bounces from the emitter to the detector across the site. The transmission method is the most common type of method of choice in use.The normal SpO2 value for adolescents and elders is greater than 95%, and for children, a level greater than 90-92% is normal. SpO2 can be misleading as other factors must be considered when determining whether this SpO2 is normal for the particular patient.
Critical discussion on Pulse oximetry (SpO2 = SaO2)�• SaO2 gives fairly good idea of not only saturation
but also of oxygen content (CaO2) provided Carboxyhemoglobin (COHb) and methemoglobin (MetHb) are expected in normal amounts. Since 98% of CaO2 is contributed by saturated hemoglobin, hence it is a good idea that one should always calculate CaO2, every time, after observing SpO2 since CaO2 is the better indicator of oxygenation.
CaO2 = SaO2 (98%) + PaO2 (2%). [CaO2 = 1.34ÏHbÏSaO2 + PaO2Ï0.003] Interpretation SpO2 should always be done in context of ODC. Since conditions causing Left shift can have normal saturation but patient may be hypoxic (low PaO2). Similarly conditions causing Right shift may have low SaO2 but patient may not be hypoxic.
SYMPOSIUM: MONITORING IN PEDIATRIC CRITICAL CARE Respiratory Monitoring in PICU

JOURNAL OF PEDIATRIC CRITICAL CAREVol. 1 - No.4 October - December 2014 256
�• ODC with Left shift ( g)
�• ODC with Right shift (fig)
Limitations of Pulse oximetry Oximeters have a number of limitations which may lead to inaccurate readings. Shape of oxygen dissociation curve, Carboxyhemoglobin, Methemoglobin Anemia, Dyes, Nail polish, Ambient light, motion artifact, Skin pigmentation and Low perfusion states are other causes as well. Pulse oximeters measure SpO2 that is physiologically related to arterial oxygen tension (PaO2) according to the oxyhemoglobin dissociation curve (ODC). Because the ODC has a sigmoid shape, oximetry is relatively insensitive in detecting the development of hypoxemia in patients with high baseline levels of PaO2 (upper at portion of ODC curve).Since pulse oximeters use only two wavelengths of light and, thus, it can distinguish only two substances, Hb and HbO2. When COHb and MetHb are also present, four wavelengths are required to determine the �‘fractional SaO2�’: i.e., (HbO2 × 100)/ (Hb + HbO2 + COHb + MetHb) and this can be measured by Co-oximetry. In the presence of elevated COHb levels, oximetry consistently over- estimates the true SaO2 by the amount of COHb present since it has got same absorption spectrum as of HbO2. Elevated MetHb levels also may cause inaccurate oximetry readings. Anemia does not appear to affect the accuracy of
pulse oximetry even in non-hypoxemic patients with acute anemia; pulse oximetry was accurate in measuring O2 saturation. Severe hyperbilirubinemia (mean bilirubin, 30.6 mg/dl) does not affect the accuracy of pulse oximetry. Intravenous dyes such as methylene blue, indocyaninegreen, and indigocarmine can cause falsely low SpO2 readings. Nail polish, if blue, green or black, causes inaccurate SpO2 readings, whereas acrylic nails do not interfere with pulse oximetry readings. Falsely low and high SpO2 readings occur with uorescent and xenon arc surgical lamps. Motion artifact continues to be a signi cant source of error and false alarms. In a recent, prospective study in an intensive care unit setting, SpO2 signals accounted for almost half of a total of 2525 false alarms.Inaccurate oximetry readings have been observed in pigmented patients, but not by all investigators. Low perfusion states, such as low cardiac output, vasoconstriction and hypothermia may impair peripheral perfusion and may make it dif cult for a sensor to distinguish a true signal from background layers. An under-recognized and worrisome problem with pulse oximetry is that many users have a limited understanding of how it functions and the
SYMPOSIUM: MONITORING IN PEDIATRIC CRITICAL CARE Respiratory Monitoring in PICU

JOURNAL OF PEDIATRIC CRITICAL CARE257Vol. 1 - No.4 October - December 2014
implications of its measurements. In a recent survey, 30% of physicians and 93% of nurses thought that the oximeter measured PaO2. Some clinicians also have a limited knowledge of the ODC, and they do not recognize that SpO2 values in the high 80s represent seriously low values of PaO2. In the above survey, some doctors and nurses were not especially worried about patients with SpO2 values as low as 80% (equivalent to PaO2 45 mm of Hg).Conventional pulse oximetry has problems during ambient light, abnormal hemoglobin, pulse rate and rhythm, vasoconstriction and cardiac function, physical motion and low perfusion and that has great impact on when making critical decisions. Arterial blood gas tests have been used to supplement or validate pulse oximeter readings. The advent of �“Next Generation�” pulse oximetry technology has demonstrated signi cant improvement in the ability to read through motion and low perfusion; thus making pulse oximetry more dependable to take decisions during critical period. It is important to remember that pulse oximeters assess oxygen saturation only and thereby Oxygenation status and gives no indication of the level of CO2 and thereby Ventilation status. For this reason they have a limited bene t in patients developing respiratory failure due to CO2 retention.The pulse oximeter may be used in a variety of situations that require monitoring of oxygen status and may be used either continuously or intermittently. It is not a substitute for an ABG, but can give clinicians an early warning of decreasing arterial oxyhemoglobin saturation prior to the patient exhibiting clinical signs of hypoxia. The pulse oximeter is a useful tool but the patient must be treated--not the numbers. As with all monitoring equipment, the reading should be interpreted in association with the patient�’s clinical condition. If a patient is short of breath and bluish with a saturation reading of 100%, check for possible causes due to artifact. Never withhold therapeutic oxygen from a patient in distress while waiting to get a reading. If the patient appears to be in perfect health and the saturation is reading 70%, this should alert you to the possibility of interference. Never ignore a reading which suggests the patient is becoming hypoxic. The main disadvantage of pulse oximeter is
its inability to use in cases of hyperoxia at saturations between 90-100%.
Masimo pulse oximetry - a new promising way of measuring SpO2 !!What makes Masimo pulse oximetry different from conventional pulse oximetry?Conventional pulse oximetry assumes that arterial blood is the only blood moving (pulsating) in the measurement site. During patient motion, the venous blood also moves, which causes conventional pulse oximetry to under-read because it cannot distinguish between the arterial and venous blood. Masimo signal technology identi es the venous blood signal, isolates it, and cancels the noise and extracts the arterial signal, and then reports the true arterial oxygen saturation and pulse rate. Following setbacks of Conventional Pulse Oximetry for inaccurate monitoring or signal dropout during the reading are recti ed by Masimo technology�• Patient Motion or Movement�• Low Perfusion (low signal amplitude)�• Intense Ambient Light (lighting or sunlight)�• Electrosurgical Instrument Interference
CapnographyEnd-tidal CO2 (EtCO2) monitoring is an exciting non-invasive technology that is more commonly used in the emergency department, intensive care units and in the pre-hospital settings. Its main use has been in verifying endotracheal tube position, during mechanical ventilation and cardio-pulmonary resuscitation, but it is being studied and used for other purposes as well. The American Heart Association new guidelines states the secondary con rmation of proper endotracheal tube placement in all patients by exhaled CO2 immediately after intubation and during transport is essential. EtCO2 monitoring is an exciting new technology that measures CO2 in the exhaled breath continuously and non-invasively. CO2 is produced during cellular metabolism, transported to the heart and exhaled via the lung and so EtCO2 re ects ventilation, metabolism and circulation. If any two systems are kept constant then changes in the third system re ect
SYMPOSIUM: MONITORING IN PEDIATRIC CRITICAL CARE Respiratory Monitoring in PICU

JOURNAL OF PEDIATRIC CRITICAL CAREVol. 1 - No.4 October - December 2014 258
changes in EtCO2. This was rst studied clinically by Smallhout and Kalenda in the 1970�’s, and in the late 1980�’s �– 1990�’s this methodology has been studied extensively in various clinical settings. The most common use of EtCO2 is to verify endotracheal tube (ETT) position. It is being increasingly studied and used during cardiopulmonary resuscitation (CPR) and other clinical settings.
What is Capnography?It is a graphical representation of noninvasive, continuous measurement of exhaled carbon dioxide (EtCO2) concentration over time accompanied by digital display that provides EtCO2 value and distinct waveform (tracing) for each respiratory cycle
Some de nitions: Capnometry�• Capnometer: Provides only a numerical
measurement of carbon dioxide�• Capnogram : Is a waveform display of carbon
dioxide over time�• Capnography: A numerical value of the EtCO2 and
A waveform of the concentration of CO2 present in the airway. And Respiratory rate detected from the actual air ow
Normal Capnogram (Fig)
The Capnogram is divided into four distinct phases:1. Phase I (A-B) is the beginning of exhalation. It
represents most of the anatomical dead space. CO2 is almost zero.
2. Phase II (B-C) is where the alveolar gas begins to mix with the dead space gas and the CO2 begins to rapidly rise.
3. Phase III (C-D) represents the alveolar gas,
usually has a slight increase in the slope as �“slow�” alveoli empty. The �“slow�” alveoli have a lower V/Q ratio and therefore have higher CO2 concentrations. In addition, diffusion of CO2 into the alveoli is greater during expiration. This is more pronounced in infants. EtCO2 is measured at the maximal point of Phase III (D)
4. Phase IV (D-E) is the inspirational phase
Note that the presence of the alveolar plateau con rms that the measurement is End-tidal. Without a Capnography you cannot be sure that a measured CO2 value is really end-tidal.
A normal value for ETCO2 is approximately 38-40 mm Hg.
Types of CO2 MonitorsThere are two types of CO2 monitors: 1) Mainstream and 2) Sidestream.Mainstream�…�…salient features are�…�…�• The infrared sensor is located in the airway
adapter, between the ET tube and the breathing circuit tubing.
�• Response time is faster and may be as little as 40msec
�• Water cannot be drawn-in to disrupt sensor function, and since no mixing of gases in the sample tube it is nearly a very accurate one.
�• Dif cult to calibrate without disconnecting (makes it hard to detect rebreathing)
�• More prone to the reading being affected by moisture.
�• Sensor device is larger in size hence can kink the tube.
�• Adds dead space to the airway.�• Bigger chance of being damaged by mishandling.
Sidestream�…�… salient features are�…..�• Can be used with in intubated or non-intubated
patients thus have wider applications.�• The airway adapter is positioned at the airway
(whether or not the patient is intubated) to allow aspiration of gas from the patient�’s airway back to the sensor, which lies either within or close to the monitor, thus gas is sampled through a small tube
�• Analysis is performed in a separate chamber
SYMPOSIUM: MONITORING IN PEDIATRIC CRITICAL CARE Respiratory Monitoring in PICU

JOURNAL OF PEDIATRIC CRITICAL CARE259Vol. 1 - No.4 October - December 2014
�• Very reliable�• Time delay of 1-60 seconds�• Less accurate at higher respiratory rates�• Prone to plugging by water and secretions�• Ambient air leaks are common.
Clinical Applications of CO2 MonitoringThe EtCO2 level read on the display of the monitor depends upon the proper functioning of the following:�• Lungs and airways�• Patient ventilation system�• Respiratory mechanism�• Patient�’s metabolism and circulation
Malfunctions of the lungs and airway OR the patient�’s ventilation system can be depicted as follows:�• Upper airway obstruction �– re ected by an
increased EtCO2�• Apnea �– re ected by a sudden cessation of EtCO2
readings�• Improper ventilator operation �– re ected by either
high or low EtCO2 readings�• Hyperventilation �– re ected by a decreased EtCO2�• Hypoventilation �– re ected by an increase in
EtCO2�• A faulty one-way valve �– re ected by an increased
inspired CO2 and increased EtCO2�• Esophageal intubation �– re ected by no EtCO2
reading�• Respiratory depression (from anesthesia) �–
re ected by a decreased EtCO2�• Increased level of muscle relaxation �– re ected by
a decreased EtCO2�• Reversal of muscle relaxant and resulting
improvement in muscle tone �– re ected by an increased EtCO2
�• Malignant hyperthermia �– re ected by an increased EtCO2
PaCO2-EtCO2 gradient�• It is usually < 6 mm Hg�• EtCO2 is usually less�• Difference depends on the number of underperfused
alveoli�• Tend to mirror each other if the slope of Phase III
is horizontal or has a minimal slope
�• Decreased cardiac output will increase the gradient
�• The gradient can be negative when healthy lungs are ventilated with high tidal volume and low rate
�• Decreased functional residual capacity also gives a negative gradient by increasing the number of slow alveoli
LIMITATIONS1. Critically ill patients often have rapidly changing
dead space and V/Q mismatch2. Higher rates and smaller tidal volumes can
increase the amount of dead space ventilation3. High mean airway pressures and PEEP restrict
alveolar perfusion, leading to falsely decreased readings
4. Low cardiac output will decrease the reading.
Indications for Capnography are:1. Con rm and verify tracheal intubation placement.2. Evaluate ventilator settings and circuit integrity.3. Assess cardiopulmonary status and changes in
pulmonary blood ow.4. Assess airway management and changes in airway
resistance.5. Monitor effectiveness of CPR.6. Monitor ventilatory status of the respiratory
impaired patient.7. Monitor ventilation of a nonintubated patient
during sedation/analgesia.8. Monitor the effectiveness of ventilator weaning
process, and response to changes in ventilator settings (i.e., respiratory rate, ow and/or volume).
9. Reduce the number and/or frequency of arterial blood gas drawings.
10.Aids in the treatment of neurological patients and the possibility of increasing intracranial pressures.
Other uses�…�….�• Metabolic
- Assess energy expenditure�• Cardiovascular
- Monitor trend in cardiac output- Can use as an indirect Fick method, but actual
numbers are hard to quantify- Measure of effectiveness in CPR- Diagnosis of pulmonary embolism by measuring
measure gradient
SYMPOSIUM: MONITORING IN PEDIATRIC CRITICAL CARE Respiratory Monitoring in PICU

JOURNAL OF PEDIATRIC CRITICAL CAREVol. 1 - No.4 October - December 2014 260
Microstream technologyIt is 3rd generation technology which can be used with intubated or non-intubated patients and requires low sample ow rate - 50 ml/min. It allows its use in neonate & pediatric patients. In this technology sampling lines not ooded with moistureMicrostream improves upon conventional Sidestream sampling based upon the principle that CO2 molecules absorb IR radiation at speci c wavelengths
Advantages1. No sensor at airway2. Intubated and non-intubated patients (neonatal
through adult)
Differential Diagnosis of Abnormal Capnogram �…�…. (Table) Symptom Possible CauseSudden drop ofEtCO2 to zero
Esophageal intubationVentilator disconnection or malfunction Defect in CO2 analyzerDislodged OR obstructed endotracheal tube
Sudden fallof EtCO2 (not to 0)
Leak in ventilator system, obstructionPartial disconnect in ventilator circuitPartial airway obstruction (secretions)
Exponentialfall of EtCO2
Cardiac ArrestHypotension (sudden)Severe hyperventilationCardiopulmonary bypassPulmonary Embolism
Change in CO2Baseline
CO2 absorber saturation (anesthesia)Calibration errorWater droplet in analyzerMechanical failure (ventilator)
Sudden increaseof EtCO2
Accessing an area of lung previously obstructedRelease of tourniquetSudden increase in blood pressure
Gradual loweringof EtCO2
HypovolemiaDecreasing Cardiac OutputDecreasing body temperature, hypothermia, drop in metabolism
Gradual increasein EtCO2
Rising body temperatureHypoventilationCO2 absorptionPartial airway obstruction (foreign body), reactive airway disease
Constantly high EtCO2 Respiratory depression duo to drugsMetabolic alkalosis (respiratory compensation)Insuf cient minute ventilation
3. No routine calibration4. Automatic zeroing5. Accurate at small tidal volumes and high
respiratory rates6. Superior moisture handling
Pulmonary Function TestsFew of the numerous pulmonary function tests currently available have an impact upon clinical management of the critically ill child, particularly if the patient has to be moved to a laboratory. A number of other tests require highly specialized equipment and ful ll a predominant research role.
SYMPOSIUM: MONITORING IN PEDIATRIC CRITICAL CARE Respiratory Monitoring in PICU
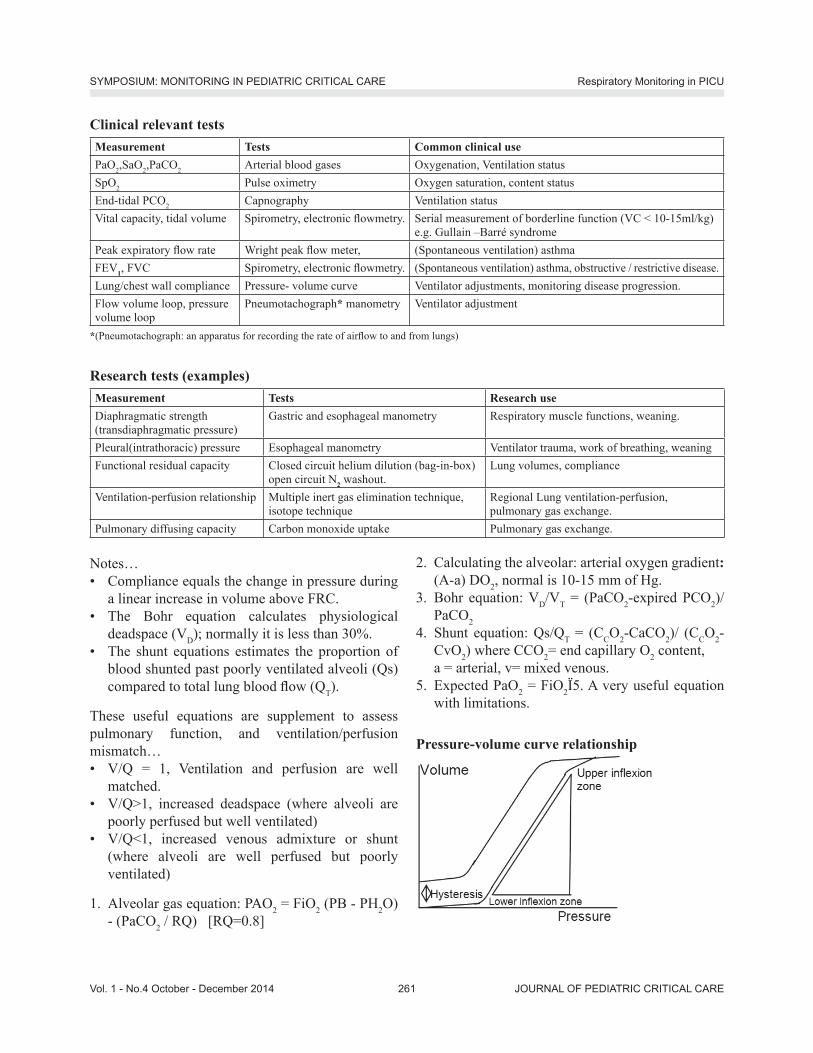
JOURNAL OF PEDIATRIC CRITICAL CARE261Vol. 1 - No.4 October - December 2014
Notes�…�• Compliance equals the change in pressure during
a linear increase in volume above FRC.�• The Bohr equation calculates physiological
deadspace (VD); normally it is less than 30%.�• The shunt equations estimates the proportion of
blood shunted past poorly ventilated alveoli (Qs) compared to total lung blood ow (QT).
These useful equations are supplement to assess pulmonary function, and ventilation/perfusion mismatch�…�• V/Q = 1, Ventilation and perfusion are well
matched.�• V/Q>1, increased deadspace (where alveoli are
poorly perfused but well ventilated)�• V/Q<1, increased venous admixture or shunt
(where alveoli are well perfused but poorly ventilated)
1. Alveolar gas equation: PAO2 = FiO2 (PB - PH2O) - (PaCO2 / RQ) [RQ=0.8]
Clinical relevant testsMeasurement Tests Common clinical usePaO2,SaO2,PaCO2 Arterial blood gases Oxygenation, Ventilation statusSpO2 Pulse oximetry Oxygen saturation, content statusEnd-tidal PCO2 Capnography Ventilation statusVital capacity, tidal volume Spirometry, electronic owmetry. Serial measurement of borderline function (VC < 10-15ml/kg)
e.g. Gullain �–Barré syndromePeak expiratory ow rate Wright peak ow meter, (Spontaneous ventilation) asthmaFEV1, FVC Spirometry, electronic owmetry. (Spontaneous ventilation) asthma, obstructive / restrictive disease.Lung/chest wall compliance Pressure- volume curve Ventilator adjustments, monitoring disease progression.Flow volume loop, pressure volume loop
Pneumotachograph* manometry Ventilator adjustment
*(Pneumotachograph: an apparatus for recording the rate of air ow to and from lungs)
Research tests (examples)Measurement Tests Research useDiaphragmatic strength (transdiaphragmatic pressure)
Gastric and esophageal manometry Respiratory muscle functions, weaning.
Pleural(intrathoracic) pressure Esophageal manometry Ventilator trauma, work of breathing, weaningFunctional residual capacity Closed circuit helium dilution (bag-in-box)
open circuit N2 washout.Lung volumes, compliance
Ventilation-perfusion relationship Multiple inert gas elimination technique, isotope technique
Regional Lung ventilation-perfusion, pulmonary gas exchange.
Pulmonary diffusing capacity Carbon monoxide uptake Pulmonary gas exchange.
2. Calculating the alveolar: arterial oxygen gradient: (A-a) DO2, normal is 10-15 mm of Hg.
3. Bohr equation: VD/VT = (PaCO2-expired PCO2)/PaCO2
4. Shunt equation: Qs/QT = (CCO2-CaCO2)/ (CCO2-CvO2) where CCO2= end capillary O2 content, a = arterial, v= mixed venous.
5. Expected PaO2 = FiO2Ï5. A very useful equation with limitations.
Pressure-volume curve relationship
SYMPOSIUM: MONITORING IN PEDIATRIC CRITICAL CARE Respiratory Monitoring in PICU

JOURNAL OF PEDIATRIC CRITICAL CAREVol. 1 - No.4 October - December 2014 262
1. P-V curve be obtained in fully relaxed and ventilated patient.2. Both static (chest) and dynamic (lung) respiratory system compliance
can be determined. 3. The lower in exion point represents appropriate setting for external
Positive End Expiratory Pressure (PEEP). 4. The upper in exion point represents the maximum setting for PEAK
AIRWAY PRESSURE (PAP).
X rayA very commonly ordered investigation in PICU which has diagnostic, therapeutic and prognostic value is x-ray chest. (This has been discussed detailed in other chapter in this book)
Invasive monitoringArterial blood gas analysisThe term arterial blood refers to a speci c set of tests performed on arterial blood sample. It provides four key point information: pH, PO2, [HCO3], and PCO2. The name blood gas is really a partial misnomer since H+ and HCO3 are not gases. It is a gold standard investigation to assess pulmonary functions and cardiac as well.
Basic Concepts�• Arterial Blood Gas �• Gas Exchange �• Acid-Base Disturbances
Systematic Analysis of Arterial Blood Gases1. Oxygenation 2. Stepwise approach to Acid-Base Disorders
Basic Introduction of Arterial Blood GasesThe term hypoxia refers to reduced O2 delivery to tissues. The term hypoxemia refers to reduced O2 content in arterial blood. A normal arterial pressure of O2 is dependent on the atmospheric pressure, temperature, inspired O2 content, and the patient�’s age.Hypoxemia can be for two basic reasons; oxygen may not be delivered to the alveolar air sacs (hypoventilation) or oxygen in the alveoli may not enter into the blood stream. A patient can be hypercarbic (high levels of CO2) Or hypocarbic (low level of CO2) which is due to an inability to normally
exchange gas in the lungs.The terms acidemia and alkalemia refer to alterations in blood pH, and are the result of underlying disturbance(s) (metabolic and/or respiratory). The terms acidosis and alkalosis refer to the processes that alter the acid-base status. There can be (and often are) more than one of these processes simultaneously in a patientDiseases that alter the acid-base status of a patient can be divided�….1. Metabolic 2. Respiratory Metabolic processes are those that primarily alter the HCO3 concentration in the blood. A decrease in serum HCO3 (an alkali or base) leads to a metabolic acidosis, while an increase in serum HCO3 leads to a metabolic alkalosis. Respiratory processes alter the pH by changing the CO2 levels. CO2 accumulation causes an acid state in the blood (through carbonic acid), and as respirations (respiratory rate and/or tidal volume) increase, the body eliminates more CO2 (acid) and is left with a respiratory alkalosis. In other words, a decrease in ventilation leads to retention and increased levels of CO2, and thus a respiratory acidosis. In conclusion, pH altering processes can be one of four types: 1. Metabolic acidosis, 2. metabolic alkalosis, 3. Respiratory acidosis,4. Respiratory alkalosis. Again, one or more of these processes may be present in a patient with an abnormal acid-base status. Systematic Analysis of Arterial Blood GasesArterial blood gases are obtained for two basic purposes: 1. To determine oxygenation and 2. To determine acid-base status. Let�’s elaborate now, how to determine oxygenation, and then evaluate the acid-base status systematically. Determining Oxygenation i.e. Alveolar: arterial oxygen gradient: (A-a) DO2(Age and FiO2 dependent derivative)An important part of interpreting blood gases is to assess oxygenation. An arterial oxygen concentration
SYMPOSIUM: MONITORING IN PEDIATRIC CRITICAL CARE Respiratory Monitoring in PICU

JOURNAL OF PEDIATRIC CRITICAL CARE263Vol. 1 - No.4 October - December 2014
(PaO2) of less than 60 mm Hg, associated with an oxygenation (SaO2) of less than 90%, is poorly tolerated in humans; therefore a PaO2 of less than 60 is termed hypoxemic. However, �“normal�” oxygenation decreases with age as the lungs become less ef cient at diffusing oxygen from the alveolus to the blood. Again, normal oxygenation for age can be estimated as�…PaO2 = 104.2 - (0.27 x age) Or more crudely, normal oxygenation for age is roughly 1/3 of the patient�’s age subtracted from 100. Using this estimation for example a 60-year-old patient should have a PaO2 of 80 and 15-year-old patient should have a PaO2 of 95. Values less than this would be considered hypoxemic for age.
Calculating the alveolar: arterial oxygen gradient: (A-a) DO2 can determine if hypoxia is a re ection of hypoventilation (in other words, decreased because of a rise in PaCO2) or due to de ciency in oxygenation. Unlike oxygen (for which alveolar concentrations are higher than arterial concentrations) CO2 freely diffuses across the lung such that the arterial and alveolar concentrations are identical. As a patient hypoventilates, CO2 will accumulate in the body (more CO2 is produced through metabolism than can be eliminated) and thus in the blood (where we measure it as PaCO2). The carbon dioxide displaces the oxygen in the alveolus. This reciprocal relationship between oxygen and carbon dioxide in the alveolus is described by the alveolar gas equation:PAO2 (partial pressure of oxygen in the alveolus) = 150-1.25 (PACO2)PA = partial pressure of a gas in the alveolus. Pa = partial pressure of a gas in the arterial blood.This equation assumes that the patient is breathing room air (21% O2) at atmospheric pressure.
Where do 150 come from? : �• (Atmospheric P - water vapor P) x FIO2. At room
temperature, at sea level, �• Atmospheric pressure = 760 mm Hg;�• In the lung, the air is fully saturated with water,
giving a water vapor pressure of about 47.�• Room Air is about 21%, thus at room air, the PAO2
= 0.21(760-47) = 149.7, or about 150.
AND�…Where does 1.25 come from? This is a fudge factor which is derived from the respiratory quotient. The formula actually requires that the PACO2 be divided by the respiratory quotient, which is de ned as the ratio of CO2 produced to O2 consumed (and which depends on diet and metabolism). We estimate the RQ to be 0.8, and the reciprocal of 0.8 is 1.25.This value is the partial pressure of O2 within the alveolus. Because the CO2 freely diffuse from arterial blood to alveolar airspaces, the PACO2 is equal to the PaCO2, which is measured in the arterial blood gas. The above equation can then be rewritten asPAO2 = 150-1.25 (PaCO2)Thus�….A-a DO2 = PAO2 - PaO2 OrA-a DO2 = [150-1.25 (PaCO2)] - PaO2A normal A-a gradient is 10-20 mm Hg, with the normal gradient increasing within this range as the patient ages. An increased A-a gradient identi es decreased O2 in the arterial blood compared to the O2 in the alveolus. This suggests a process that interferes with gas transfer, or in general terms, suggests ventilation-perfusion mismatch. A normal A-a gradient in the face of hypoxemia suggests the hypoxemia is due to hypoventilation and not due to underlying lung disorders.When the patient is not breathing room air then�… A-a gradient = {(FIO2) (760-47) - (1.25) (PaCO2)} - PaO2
SYMPOSIUM: MONITORING IN PEDIATRIC CRITICAL CARE Respiratory Monitoring in PICU

JOURNAL OF PEDIATRIC CRITICAL CAREVol. 1 - No.4 October - December 2014 264
Stepwise Approach to Diagnosing Acid-Base DisordersIn order to understand the various processes that can co-exist in a patient, one must systematically evaluateblood gases and serum electrolytes. The simple method of six steps to analyze the acid-base status of the patient is presented here.
pH and HCO3 �…Moves in same directionpH and PCO2 �….Moves in opposite directionHCO3 and PCO2 �…Moves in same direction �…Simple disorderHCO3 and PCO2 �… Moves in oppositedirections �…mixed disorder
pH : 7.35-7.45, PCO2 : 35-45HCO3 : 22-26, PaO2 : 90-99
Normal values of ABG
Steps in Acid-Base Analysis�• Step 1. Consider the clinical settings! Anticipate
the disorder!�• Step 2. Look at pH?�• Step 3.Who is the culprit for changing pH?...
Metabolic / Respiratory process �• Step 4. If respiratory�…�… acute and /or chronic
And Is metabolic compensation appropriate?�• Step 5. If metabolic acidosis, Is respiratory
compensation appropriate? Anion gap ed and/or normal or both?�• Step 6. Is more than one disorder present? Mixed
one?STEP 1: Clinical assessment based on clinical settings is an essential rst step. From the history, examination and initial investigations make a clinical decision as to what is the most likely acid-base disorder(s). This is very important but be aware that in some situations, the history may be inadequate, misleading or the range of possible diagnoses large. Mixed disorders are often dif cult: the history and examination alone are usually insuf cient in sorting these out.1. Vomiting�…�…�…�…. Metabolic alkalosis2. Diarrhoea �…�…�….. Metabolic acidosis
3. Septicemia �…�…......Lactic acidosis4. Hypotension, Hypoxemia, Shock �…�…�…�…
Lactic acidosis5. Diabetes mellitus... Ketoacidosis6. Pneumonia �…�…�…..Respiratory alkalosis/
acidosis7. Bronchial asthma �…Respiratory alkalosis/
acidosis8. Hepatic failure �…�…Respiratory alkalosis,
Metabolic alkalosis9. CNS disorders �…�… Respiratory alkalosis10. Renal disorders �…...Metabolic acidosis*KEY POINT: Metabolic alkalosis and acidosis can exist together with any respiratory either acidosis or alkalosis. Both two respiratory disorders can�’t occur simultaneouslySTEP 2: Look at the pH The pH of the arterial blood gas measurement identi es the disorder as alkalemic or acidemic. pH >7.4 �…Alkalosis, pH < 7.4 �…�…�…�…. Acidosis, pH = 7.4 �…�…�…�…. Normal or mixed disorder(Only Chronic Respiratory alkalosis can have normal value of pH)STEP 3: Who is responsible for this change in pH? Who is the CULPRIT?HCO3�…�… METABOLIC PCO2 �…�… Respiratory > 26 �….. Met. Alkalosis > 45 �…�… Resp. Acidosis< 22 �…�…Met. Acidosis < 35 �…�… Resp. AlkalosisIt is essential to determine whether the disturbance affects primarily the arterial PaCO2 or the serum HCO3. �• �…�…Respiratory disturbances alter the arterial
PaCO2 (normal value 35-45) �• �…�…Metabolic disturbances alter the serum HCO3
(normal value 22-26) If the pH is low (i.e., the primary and controlling disturbance is acidosis causing acidemia) either the PaCO2 is high or the HCO3 is low. (These are the only ways in which the pH can be low). A high PaCO2 de nes a primary respiratory acidosis and a low HCO3 de nes a primary metabolic acidosis. Conversely, if the pH is high (i.e., the primary and controlling disturbance is alkalosis causing alkalemia) either the PaCO2 is low or the HCO3 is high. (These are the only ways in which the pH can be high). A low
SYMPOSIUM: MONITORING IN PEDIATRIC CRITICAL CARE Respiratory Monitoring in PICU

JOURNAL OF PEDIATRIC CRITICAL CARE265Vol. 1 - No.4 October - December 2014
PaCO2 de nes a primary respiratory alkalosis and a high HCO3 de nes a primary metabolic alkalosis.
STEP 4 : If it is a primary respiratory disturbance, Is it acute? And/OR Chronic.For 10 mm change in pCO2pH�….changes�….asAcidosis ( CO2)..�…pH �… acute�…�…by 0.08, chronic�…by 0.03Alkalosis ( CO2).�… pH �… acute�…�… by 0.08, chronic�…by 0.03HCO3�…. Compensates as�….Acidosis ( CO2)..�…HCO3 �…�….. Acute�…�…by 1, Chronic�…by 3Alkalosis ( CO2) �… HCO3 �…�…Acute�…�…by 2, Chronic�…by 5 For example, In an acute respiratory acidosis, if the PCO2 rises from 40 to 50, you would expect the pH to decline from 7.40 to 7.32. In an acute respiratory alkalosis, if the PCO2 falls from 40 to 30, you would expect the pH to rise from 7.40 to 7.48.In chronic respiratory disturbances, there are renal mediated shifts of bicarbonate that alter and partially compensate for the pH shift for a change in the PaCO2. In a chronic respiratory acidosis, if the PCO2 rises from 40 to 50, you would expect the pH to decline from 7.40 to 7.37.In a chronic respiratory alkalosis, if the PCO2 falls from 40 to 30, you would expect the pH to rise from 7.40 to 7.43.Remember: to suspect if�• compensated HCO3 is > expected: additional
metabolic alkalosis is there�• compensated HCO3 is < expected: additional
metabolic acidosis is there
STEP 5 : If it is a primary metabolic disturbance, whether respiratory compensation appropriate?For metabolic acidosis: Expected PCO2 = (1.5 x [HCO3]) + 8 + 2 �…�….. Winter�’s formulaOR Expected CO2 is equal to Last two digits of pH (important & easy to remember.)For metabolic alkalosis: Expected PCO2 = 6 mm for
10 mEq. rise in Bicarb.�…�…�…UNCERTAIN COMPENSATIONRemember : to suspect if�• Compensated PCO2 is > expected : additional
respiratory acidosis is there . �• Compensated PCO2 is < expected : additional
respiratory alkalosis is there.Processes that lead to a metabolic acidosis can be divided into 1) Increased anion gap and 2) Normal anion gap. The anion gap is the difference between the measured serum cations (positive) and the measured serum anions (negative). (Of course, there is no real gap; in the body the numbers of positive and negative charges are balanced. The gap refers to the difference in positive and negative charges among cations and anions which are commonly measured.) The commonly measured cation is sodium. (Some people also use potassium to calculate the gap; that results in a different range of normal values.) The measured anions include chloride and bicarbonate. Thus the anion gap can be summarized as: AG = [Na+] - ([Cl] + [HCO3-]).The normal anion gap is 12. An anion gap of > than 12 is increased. Anion gap > 25 has got distinct value having signi cant ACIDOSIS. This is important, because it helps to signi cantly limit the differential diagnosis of a metabolic acidosis. The most common etiologies of a metabolic acidosis with an increased anion gap include: Commonest pediatric causes are Lactic acidosis, diabetic ketoacidosis and renal failure. Aspirin, Ketones (starvation, alcoholic and diabetic ketoacidosis)Uremia (renal failure), Lactic acidosis, Ethanol, Paraldehyde and other drugsMethanol other alcohols, and ethylene glycol intoxication Key point: The true anion gap is underestimated in hypoalbuminemia (fall in unmeasured anions); AG must be adjusted. Remember to adjust AG: For every 1.0 fall in albumin, increase the AG by 2.5
STEP 6: Is more than one DISORDER present?- Proper Clinical history- pH normal, and PCO2 and HCO3 out of range
SYMPOSIUM: MONITORING IN PEDIATRIC CRITICAL CARE Respiratory Monitoring in PICU

JOURNAL OF PEDIATRIC CRITICAL CAREVol. 1 - No.4 October - December 2014 266
- PCO2 and HCO3 moving in opposite directions- Degree of compensation for primary disorder is
inappropriate.
Key messages1. Respiratory monitoring helps in the early
diagnosis of change in a physiological parameter of oxygenation and ventilation, and provides guidelines towards institution of appropriate therapy.
2. Basic knowledge of the principles of monitoring tools and correct interpretation of data is important since failure to do so can result in misdirected therapy.
3. Pulse oximetry and Capnography are the essential monitors in PICU which need clinical correlation.
4. Arterial blood gas analysis is an integral part of respiratory monitoring in PICU.
5. No amount of monitoring, though excellent information provided by monitors, however, can replace careful bedside clinical signs.
Reference1. William R. Hayden: Respiratory monitoring. In Rogers Text
book of Pediatric intensive care 2007; 205-2132. David B. Swedlow, Noninvasive respiratory monitoring. In:
Jerry J. Zimmerman. Pediatric critical care, 2011: 99-109 3. Mervyn Singer, Andrew R. Webb. In : Oxford Hand Book of
Critical Care 2005, 94-974. Lawrence Martin. In : All you really need to know to interpret
arterial Blood gases 19925. Buche V B. Systematic analysis of blood gases. In :
Intensivist Jan 20066. Jubran A: Pulse oximetry. In: Tobin MJ (ed). Principles and
Practice of Intensive Care Monitoring. New York: McGraw Hill, Inc.; 1998, :261-287
7. Barker SJ, Tremper KK: The effect of carbon monoxide inhalation on pulse oximeter signal detection. Anesthesiology 1987, 67:599-603
8. Barker SJ, Tremper KK, Hyatt J: Effects of methemoglobinemia on pulse oximetry and mixed-venous oximetry. Anesthesiology 1989, 70:112-117
9. Jay GD, Hughes L, Renzi FP: Pulse oximetry is accurate in acute anemia from hemorrhage. Ann Emerg Med 1994, 24:32-35
10. Bhende MS. Capnography in the paediatric emergency department. Peds Emerg Care 1999;15:64-69
11. Benjamin Abelow. In : Understanding acid-base 199812. Buche V B. : �“Ventilator Graphics�…. A easy approach�” in
press
SYMPOSIUM: MONITORING IN PEDIATRIC CRITICAL CARE Respiratory Monitoring in PICU

JOURNAL OF PEDIATRIC CRITICAL CARE267Vol. 1 - No.4 October - December 2014
Hemodynamic Monitoring in PICUAnand M Patil, Suchitra Ranjit
Apollo Children’s Hospital, Chennai
The ability to intensively, continuously, and routinely monitor both usual vital signs and more specialized metrics forms one of the cornerstones of modern critical care. Monitoring should be selected and applied to detect pathophysiologic abnormalities in patients at high risk of developing them and to aid in the titration of therapy to appropriate physiologic end points. This area of medicine not only requires a detailed knowledge of patient physiology, but demands an understanding of the physical principles that underpin the technology and awareness of the limitations and potential errors of the information gathered.The monitoring and diagnostics speci cally addressed in this chapter include those related to the haemodynamic, respiratory and neurological systems of the body.
A. Hemodynamic Monitoring:At the bedside, haemodynamic monitoring can be approached in a series of steps aimed at assessing global and regional perfusion:Initial steps 1. Clinical assessment 2. Basic monitoring and assessment of global
perfusion3. Preload monitoring and uid responsivenessAdvanced monitoring measures1. Cardiac output monitoring2. Assessment of cardiac contractility 3. Assessment of tissue perfusion.
Step 1: Clinical assessment A clinical examination is the fastest and least invasive haemodynamic monitor available. Cold extremities, poor peripheral pulses and impaired capillary re ll are useful immediate indices of hypoperfusion. A patient with inadequate global perfusion often presents with one or several of these features: tachypnoea,
tachycardia, confusion, toe to core temperature gap, altered skin perfusion and oliguria. We can at bedside easily monitor three areas for end organ perfusion:1. CRT: Capilary re ll time �– Assessment of CRT is
almost universally done by pediatricians particularly in emergency room, neonatal ICU and pediatric ICU setting. There seems little agreement on the methods described for carrying out this simple assessment amongst the practitioners who follow various practices. It seems best to follow the below mentioned method: i. �“Pediatric Advanced Life Support Providers
manual 2011�” guide lines for eliciting CRT in children, which states To evaluate the CRT, lift the extremity slightly above the level of the heart, press on the skin, and rapidly release. A CRT of less than 2 is normal.
ii. �“The facility based IMNCI participants manual-2009�” guidelines for eliciting CRT in young infants. To assess the child�’s capillary re ll, grasp the child�’s thumb or big toe between nger and thumb. Look at the pink of the nail bed. Apply minimal pressure necessary for 3 s to produce blanching of the nail bed. Time the capillary re ll from the moment of release until total return of the pink color. A CRT of less than 3 is considered normal.Also, the warm toe or CRT of < 2 secs provides excellent negative predictive value for a cardiac index of < 3 or a superior vena cava oxygen saturation of > 70% . (1)
2. Urine Output �– Recognize acute kidney injury by AKIN staging in children
3. Sensorium - An awake, adequately talking patient is the best indicator of adequate cerebral perfusion.
Careful attention should be made to detecting skin mottling. It has been shown to independently predict mortality in septic shock in adults (2). Mottling usually begins at the knees, and can be quanti ed according to a mottling score (scored 0-5, with a higher score correlating with increased mortality). High doses of vasopressors can make skin mottling more severe and lead to purpuric changes. (Figure 1)

JOURNAL OF PEDIATRIC CRITICAL CAREVol. 1 - No.4 October - December 2014 268
Figure 1. Mottling ScoreScore 0= no mottling Score 1= small area of mottling, localised to centre of knee Score 2= modest mottling area that does not extend beyond superior border of kneecap Score 3= mild mottling area that does not extend beyond the mid- thigh Score 4= severe mottling area, not going beyond the groin fold Score 5= extremely severe mottling area, extending beyond groin fold
Step 2: Basic monitoring and assessment of global perfusion
Concept of upstream & downstream markers: The concept of tissue dysfunction in shock, has led to the concept of �‘�‘upstream�’�’ and �‘�‘downstream�’�’ indicators of organ perfusion. Upstream markers assess ow and pressure in the heart, vena cava, pulmonary artery, and aorta. These are the traditional variables that have been used to assess the hemodynamic status of critically ill patients.However, shock with end�–organ dysfunction occurs at the capillary and tissue levels. Tools have therefore been developed that follow alterations in the microvasculature of critically ill patients. These
techniques are known as the �‘�‘downstream�’�’ markers. Since patients�’ oxygen and metabolic needs vary with different stressors and at different times, monitoring downstream variables can be helpful. The current concept is to use these downstream markers to ensure that interventions that alter upstream variables are improving tissue oxygenation.Downstream markers therefore provide a guide to upstream therapy.1. Upstream markers include systemic blood pressure,
heart rate, central venous pressure (CVP), pulmonary capillary wedge pressure (PCWP), and cardiac output
2. Currently available downstream markers include urine output, blood lactate, base excess, tissue carbon dioxide levels, and mixed venous oxygen and carbon dioxide levels.
A. Blood PressureBlood pressure measurement is integral in the support of the critically ill patients. Cardiac output and systemic vascular resistance determine the mean blood pressure. It is very important to remember that pressure does not equal ow. When cardiac output falls, normal blood pressure is maintained by compensatory vasoconstriction causing high systemic vascular resistance. Hypotension is therefore a late sign of cardiovascular decompensation. Hence as clinicians one must not feel reassured by the presence of a normal blood pressure.
Non– invasive BP Monitoring (NIBP): The oscillometric technique is the most commonly used technique to measure arterial pressure. Mean arterial pressure (MAP) is most accurate by this method and diastolic pressure is the least accurate. The blood pressure readings are in uenced by cuff size and placement and ow in the limb. Accurate blood pressure measurement requires the use of a proper sized cuff. Current recommendations require the use of a cuff that covers 40% of the mid upper arm circumference. The major limitations of NIBP are:�• readings can be fallacious in presence of
hypoperfusion or peripheral vasoconstriction�• It gives intermittent readings �• Accuracy of readings are dependent on appropriate
cuff size and placement
SYMPOSIUM: MONITORING IN PEDIATRIC CRITICAL CARE Hemodynamic Monitoring in PICU

JOURNAL OF PEDIATRIC CRITICAL CARE269Vol. 1 - No.4 October - December 2014
Invasive hemodynamic monitoring: Invasive BP monitoring is considered the gold standard for arterial pressure monitoring in an ICU. It is indicated in situations where there is need for continuous, reliable BP recording along with the need for frequent arterial sampling. The BP measured by this method is unaffected by poor ow or perfusion in the limb(3). IBP is a relatively safe procedure. Some of the complications include hemorrhage, hematoma, arterial thrombosis, vasospasm, ischemia and infection.�• The equipment required for invasive BP monitoring
includes an arterial cannula with a heparinized saline column and ushing device, a transducer, an ampli er,and a monitor. A continuous column of uid from the blood vessel lumen to the transducer diaphragm transmits variations in intraluminal pressure; causing changes in resistance and current those are converted into an electrical signal, which is ampli ed to display a waveform and digital pressure on the bedside monitor. Disposable transducers have diaphragms that contain silicon crystals that undergo change in electrical resistance in proportion to the pressure applied to the diaphragm.The arterial pressure waveform is a complex sine wave that is a summation of a series of simple sine waves of different frequencies
�• Pressure is usually measured with a transducer, which is a device that coverts pressure in a uid lled system to electric waveform. Three factors have to be considered when using a transducer: (1) calibration (2) zero setting and (3) leveling
�• Calibration:In this process, a known pressure is applied to the membrane and change in current is related to the applied pressure. The precision and accuracy of arterial pressure system depends on meticulous calibration that must be carried out each shift.
�• Zero setting: Why is zeroing important ? The process of eliminating the atmospheric pressure is called �‘�‘zeroing,�’�’ and what is essentially being done is opening the uid column on the measuring device to atmosphere and adjusting the electronics so that atmospheric pressure is the starting value or zero.
�• Leveling: Leveling eliminates the in uence of hydrostatic pressure on the transducer. A transducer that is positioned below the patient�’s heart will produce falsely elevated pressure and a transducer positioned above the patient�’s heart will produce falsely low pressure. Pressure measurements in a uid- lled system are relative to a reference point. A widely used reference point is the phlebostatic axis which corresponds to the midpoint of the right atrium, because this is where blood comes back to the heart and this is also the pressure that provides the preload for the heart as a whole. The phlebostatic axis is determined by the junction of the two lines, a transverse line along the fourth intercostals space and a vertical line midway between the anterior and posterior chest wall.
�• The system should be arranged such that the reference stopcock of the transducer (that is opened for zeroing the transducer) must be leveled to the phlebostatic axis.
�• Pressure versus Flow:�• Clinicians caring for sick children must remember
that BP and heart rate often do not re ect blood ow. The distinction between pressure and ow is very important. This is most commonly seen during use of vasoconstrictor agents in the management of clinical shock. In this setting, an increase in blood pressure is often assumed to indicate an increase in systemic blood ow, but the opposite effect (a decrease in ow) is also possible. Few pointers:
• Check if system is optimally damped�• Damping is the tendency of the oscillation to
die down; anything that takes energy out of system dampens the system. (Figure2, Table 1 & 2)
Figure 2: The arterial waveforms �– normal, over damped and under damped waveforms.
Hemodynamic Monitoring in PICUSYMPOSIUM: MONITORING IN PEDIATRIC CRITICAL CARE

JOURNAL OF PEDIATRIC CRITICAL CAREVol. 1 - No.4 October - December 2014 270
Table 1 : Characteristic of Underdamped WaveformsNature of waveform
Effect on measurements
Causes
Narrow, peaked tracing
Overestimates SBPUnderestimates DBPMAP remains unchanged
Long tubing Increased vascular resistance
With too much damping (an �“overdamped�” system), however, frictional forces impede the arterial waveform such that it loses energy. Note the widened and slurred waveform characteristic of an overdamped pressure waveform (Figure 2). This waveform tends to underestimate SBP and overestimate DBP (Table-2).In both setting, mean arterial pressure (MAP) remains same, hence rely on MAP when system optimization is in doubt.
Table 2: Characteristic of Overdamped WaveformsNature of waveform
Effect on measurements
Causes
Widened and slurred pressure tracing
Underestimates SBPOverestimates DBP MAP remains unchanged
Air bubbles Overly compliant tubing Blood clots / Fibrin Catheter kinks Stopcocks / Injection ports No uid in ush bag / Low ush bag pressure
Although damping seems to be a solely a theoretical issue, under damped and over damped waveforms are encountered on a daily basis during arterial pressure monitoring in the intensive care unit. The ability to recognize when these potential sources of error or �“dynamic response artifacts�” are present is essential to being able to effectively analyze and apply haemodynamic measurements in the care of the critically ill and avoid potentially detrimental therapy based upon erroneous data
�• Damping can be checked by square wave testA �“fast- ush�” or �“square wave test�” is performed by opening the valve of the continuous ush device such that ow through the catheter-tubing system is acutely increased to 30 mL/hr from the usual 1-3 mL/hr. This generates an acute rise in pressure within the system such that a square wave is generated on the bedside monitor. With
closure of the valve, a sinusoidal pressure wave of a given frequency and progressively decreasing amplitude is generated.�• Optimally damped - one to two oscillations
before return to tracing�• Underdamped �– more than 2 oscillations before
returning to tracing�• Overdamped �– less than 3 oscillations before
returning to zero.
�• Check arterial waveform and interpret
Figure 3. Arterial waveformA wave = anacrotic limb B wave = systolic pressure C wave = dicrotic notch D wave = diastole
Figure 4. Changes of the arterial pressure waveform con guration throughout the arterial tree. Note the increasing steepness and amplitude of the systolic upstroke and the changing location of the dicrotic notch. This phenomenon is also called Distal pulse wave ampli cation.- The farther into the periphery blood pressure
is measured the waveform appears narrower, systolic and pulse pressure increase and .the diastolic pressure decrease. But MAP always remains same.
Hemodynamic Monitoring in PICUSYMPOSIUM: MONITORING IN PEDIATRIC CRITICAL CARE

JOURNAL OF PEDIATRIC CRITICAL CARE271Vol. 1 - No.4 October - December 2014
- Systolic blood pressure variations seen in hypovolemia
- Steep slope of upstroke suggests good contractility- Position of dicrotic notch �– low (low systemic
vascular resistance) and high (high afterload)- Slope of decent �– steep (low systemic vascular
resistance) (Figure 3&4)�• Optimize natural frequency of system- Use wide-bore, high-pressure tubing no longer than
122 cm (48 in) - Avoid tubing extensions and minimize stopcocks - Ensure that all connections are tightened - Eliminate air from the ush uid and air bubbles from
the tubing system - Keep continuous ush bag lled and keep external
pressure cuff at 300 mm Hg pressure - Keep cannulated extremity in a neutral or slightly
extended position to prevent catheter kinking.
B. SpO2 monitoring Continuous SpO2 monitoring enables almost immediate detection of even a small reduction in arterial oxygen saturation, which is an integral part of oxygen delivery. However, based on the sigmoid shape of the dissociation curve there is a time delay of the detection of acute oxygenation failure. Taking into account the shape of the O2 dissociation curve, SpO2 should be maintained >92% in most critically ill patients. The SpO2 signal is often inaccurate in the presence of altered skin perfusion. The inability to measure SpO2 is an indicator of abnormal peripheral perfusion.
C. LactateBlood lactate concentration is commonly used as a global �‘�‘downstream�’�’ marker of tissue perfusion and the adequacy of resuscitation. The normal serum lactate level in resting humans is approximately 1 mmol/L (0.7-2.0). The value is the same whether measured in venous or arterial blood (in the absence of a tourniquet). Elevated serum lactate levels may represent poor tissue perfusion. The association of increased lactate levels with circulatory failure, anaerobic metabolism and the presence of tissue hypoxia have led to its utility as a monitor of tissue perfusion in critically ill patients.
Lactate metabolismLactate is a byproduct of glycolysis. In the energy producing metabolism of glucose two distinct processes occur. The rst series of enzymatic reactions (Enden- Mierhoff pathway), occurring in the cytoplasm of cells, anaerobically transforms 1 molecule of glucose into 2 molecules of pyruvate, generating 2 molecules of ATP. This is the primary energy process for all cells functioning in a low oxygen environment, such as in poorly perfused tissues. Pyruvate may either be converted to lactate, producing one additional molecule of ATP, or move into the second series of reactions. The second series of enzymatic reactions (Krebs cycle) takes place in the mitochondria and requires oxygen: pyruvate is oxidized into CO2 and H2O producing 18 ATP molecules. In the absence of oxygen, pyruvate cannot enter the Krebs cycle and is preferentially transformed into lactate to maintain ATP production. This causes the lactate to pyruvate ratio to increase (normal ratio 10/1). Once molecular oxygen is again available, assuming that mitochondrial function is preserved, the excess lactate is rapidly metabolized back through pyruvate into CO2 and H2O via the Krebs cycle. Some cells, such as red blood cells, do not have mitochondria and thus are primary lactate producers. Since lactate is rapidly metabolized by liver and skeletal muscle, these functional anaerobic cells result in minimal blood lactate levels.Lactate in the blood is metabolized mainly by the liver (50%) and kidneys (20%). Liver function and liver blood ow in uence hepatic lactate clearance, but extreme conditions of pH can also decrease lactate clearance.Types: Hyperlactaemia (>5 mmol litre�–1) is conventionally divided into Type A, in which tissue hypoxia results in faster production than removal Type B, in which overt tissue hypoxia does not play a role. Type B has been further sub-divided depending on whether it is caused by underlying disease (B1), drugs and toxins (B2) or inborn errors of metabolism (B3).
Factors that may contribute to hyperlactataemia: �• Increased production of lactate: tissue hypoxia
Hemodynamic Monitoring in PICUSYMPOSIUM: MONITORING IN PEDIATRIC CRITICAL CARE

JOURNAL OF PEDIATRIC CRITICAL CAREVol. 1 - No.4 October - December 2014 272
�• Increased aerobic glycolysis �• Inhibition of pyruvate dehydrogenase (in sepsis)�• Methanol/ethylene glycol/propofol toxicity �• Decreased clearance of lactate: liver dysfunction
or failure, cardiopulmonary bypass (minor reduction in clearance)
�• Acute hyperventilation can elevate blood lactate levels, perhaps secondary to increased splanchnic release of lactate during hyperventilation
�• Exogenous sources of lactate: �• Lactate buffered solutions used in continuous
veno-venous haemodia ltration (CVVHDF) �• Medications (metformin, nucleosidic reverse
transcriptase inhibitors, long-term linezolid use, intravenous lorazepam, valproic acid)
�• Haematologic malignancies.
While an elevated lactate may be a marker of illness severity and an important prognostic marker, this variable has not been studied as an end point of resuscitation. Lactate clearance lags by many hours following therapeutic interventions and is therefore not suited for goal-directed resuscitation. But, the rate of lactate clearance has been demonstrated to be a good marker of outcome (4).
D. Venous Oximetery Oxygen saturation of the venous blood can be measured either at the level of the pulmonary artery: mixed venous oxygen saturation (SVO2), the level of the inferior vena cava, superior vena cava, or right atrium (RA): central venous oxygen saturation (ScVO2). Although hemodynamic assessment using clinical signs and symptoms, CVP, and urinary output can fail to detect early septic shock, tissue hypoxia suggested by ScVO2 or SVO2, and arterial blood lactate concentration can be an early marker of sepsis or marginal circulation. It is important, however, to remember that venous oxygen saturation like cardiac output is a marker of global tissue hypoxia and does not yield information on oxygen reserves or adequate tissue oxygenation of individual organs.
Physiology of mixed venous oxygen saturation The transport system for oxygen is separated into 4 compartments:
�• Blood oxygen content �• Oxygen delivery �• Oxygen consumption from the microcirculation�• Oxygen extraction ratio
Oxygen content The oxygen carried in arterial blood (CaO2) is in 2 forms: Dissolved in plasma PO2 - <2% Combined with hemoglobin SO2 - >98%.
Oxygen saturation is the ratio of the amount of oxygenated hemoglobin to the total hemoglobin in 100 ml of blood.SaO2 = HbO2 x 100 Hb + HbO2 Oxygen saturation in arterial blood is normally 95 - 98 % ( ie nearly 98 % of the heme groups in the hemogloboin are loaded with oxygen ) whereas the saturation of venous blood is typically 60 - 80 % . SvO2 is an averaged re ection of the saturation of venous blood from various organs. As a result it does not give indication of adequacy of oxygenation of individual vascular bed rather; it is global indicator of oxygen balance between oxygen consumption (VO2) and its delivery (DO2). Generally, the tissues utilise approximately 25% of the available oxygen leaving a luxury reserve of 75 % for periods of increased requirements. Since > 98% of all the circulating oxygen is bound to haemoglobin, oxyhaemoglobin saturation is a direct indicator of the oxygen content of blood, CaO2 = (0.003 x PaO2) + (1.34 x Hb x SaO2 ) 0.003 - solubility coef cient of oxygen in plasma - this fraction is negligible and insigni cant 1.34 mls oxygen carried / gm of Hb
Note: Changes in hemoglobin have a larger impact on arterial oxygenation than changes in PaO2 Hypoxemia (re ected by a decrease in PaO2) has a relatively minor impact on arterial oxygenation if the accompanying change in SaO2 is small. PaO2 in uences oxygenation only to the extent that it in uences saturation, depending on the position on the oxygen dissociation curve.
Oxygen delivery (DO2)This is the amount of oxygen delivered to the tissues every min (ml/min) O2 delivery is
Hemodynamic Monitoring in PICUSYMPOSIUM: MONITORING IN PEDIATRIC CRITICAL CARE

JOURNAL OF PEDIATRIC CRITICAL CARE273Vol. 1 - No.4 October - December 2014
dependent on 2 factors - oxygen content of arterial blood and the blood ow to tissues as re ected by the cardiac output (Q). DO2 = CaO2 x Q = (1.34 x Hb x SaO2 ) x Q In this analogy, the blood is compared to a train (Figure 5) consisting of boxcars (hemoglobin molecules). These boxcars have been lled (saturated) with a valuable product (oxygen) at the loading station (the lungs).
Figure 5. Oxygen Delivery explained in analogy
Oxygen consumption (VO2) As the train progresses along the track, it stops at multiple depots. A portion of the product carried by the train is unloaded at each of these depots. Similarly, as blood ows from the left ventricle through the capillaries, oxygen is needed to meet the metabolic needs of the tissues. The difference between the amount of oxygen carried to the tissues (arterial oxygen delivery) and the amount of oxygen returned to the heart (venous oxygen delivery) indicates the total amount of oxygen consumed by the tissues (Figure 6). Mixed venous oxygen saturation re ects the amount of oxygen returning to the pulmonary capillaries, since it was not needed by the tissues to support metabolic function.
Figure 6. Oxygen transport & consumption
SvO2 represents the end result of both oxygen delivery and consumption at the tissue level.SvO2 = Oxygen Delivered �– Oxygen Consumed(SaO2, Hb, CO) (VO2)When a threat to normal oxygen supply/demand occurs, the body attempts to compensate, and its success is immediately re ected by SvO2. If the SvO2 value is normal, there is suf cient oxygen supply available to the tissues. However, if the SvO2 value is low, then either the oxygen supply is insuf cient or the oxygen demand is elevated (Table 3 & 4). Regardless of the cause, a decrease in SvO2 indicates that the body has called upon its one of the last line of defense to preserve oxygen balance and therapeutic interventions may be appropriate
Oxygen Extraction ratio (O2 ER) The ratio of O2uptake to O2 delivery, it is the fraction of oxygen delivered to the microcirculation that is taken up by the tissues. O2 ER = VO2/DO2 Normally 0.2 - 0.3 or 20 - 30 %, only this small a fraction is required to support aerobic metabolism under normal circumstances i.e. 25% of delivered oxygen and thus theoretically has a reserve of 75% oxygen. (Normal oxygen ux is 1000 ml and the oxygen consumption is 250 ml) However 100% oxygen extraction is not possible and beyond SvO2 of 30%, anaerobic metabolism will start. The fall or rise in SvO2 can be due to increased demands or decreased supply or increased supply or decreased demand respectively. Table 3 lists the clinical conditions in which these changes in SVO2 are likely to occur.
Hemodynamic Monitoring in PICUSYMPOSIUM: MONITORING IN PEDIATRIC CRITICAL CARE

JOURNAL OF PEDIATRIC CRITICAL CAREVol. 1 - No.4 October - December 2014 274
Table 3. Clinical conditions and their effects on O2 delivery and O2 consumption and on venous oximetryDecrease in SvO2/ScvO2 Increase in SvO2/ScvO2O2 consumption
O2 delivery
O2 consumption
O2 delivery
Stress painhyperthermiashivering
anemiahypoxialow CO
Analgesia sedationmechanical ventilationhypothermia
high CaO2high CO blood transfusionmaintain MAP
During exercise SvO2 normally decreases despite increasing DO2. Therefore a drop in SvO2 or ScvO2 does not necessarily mean that tissue hypoxia occurs. The magnitude of the decrease indicates the extent to which the physiological reserves are stressed. In healthy individuals, anaerobic metabolism may occur when SvO2 drops below 48%, its normal value of 75% to 30�–40%, table 4 lists the correlation between values of mixed venous oxygen saturation status of oxygen supply and demand.
Table 4. Limits of SvO2 (& ScvO2) and clinical correlatesSvO2 Value Clinical Correlate SvO2 >75% Normal extraction, O2 supply >O2
demand 75% >SvO2 >50% Compensatory extraction, Increasing
O2 demand or decreasing O2 supply 50% >SvO2 >30% Exhaustion of extraction, Beginning of
lactic acidosis O2 supply <O2 demand 30% >SvO2 >25% Severe lactic acidosis SvO2 <25% Cellular death
What is the relationship is between the (ScvO2) and (ScvO2), and can ScvO2 be substituted for SvO2? The problems with the use of mixed venous oximetry as a monitoring tool or as a therapeutic goal are: obtaining SvO2 needs insertion of a pulmonary artery catheter which requires particular skill, a lot of time and may be associated with complications. On the other hand, central venous catheter insertion is part of standard management of most critically ill patients, is an essential skill for the intensivist, and can be done rapidlyThe tip of the central venous catheter usually lies at the junction of the superior vena cava and the right atrium or in the superior vena cava. The sample drawn from here represents not the mixed venous
blood but the venous blood from upper body and neglects blood from the lower body. In normal conditions, the blood in inferior vena has higher oxygen saturation than that in superior vena cava. This is because of lower O2 extraction in many vascular circuits draining in the inferior vena cava, as these organs use blood ow for nonoxidative phosphorylation needs (e.g., renal blood ow, portal ow, hepatic blood ow). A normal value for SvO2 is in the range of 70-80%. Thus ScvO2, in normal individuals, is usually lower by 2-3% than the SvO22. This relationship changes during periods of cardiovascular instability. Figure 7 shows normal arterial and venous oxygen saturations in various vascular beds. In pathologic states, such as severe sepsis, circulatory shock, cardiogenic shock, heart failure, etc, the blood ow to the vital organs, including the brain and heart, is maintained. At the same time, there is decreased blood ow to the kidneys and splanchnic circulations. This reduced blood ow also results in increased oxygen extraction in the splanchnic circulation. This causes a decrease in the oxygen saturation of blood that is returning from the lower body (IVC), and results in ScvO2 being greater than SvO2. While monitoring ScvO2 thus, if there is a fall in SCvO2, this suggests even lower values of SvO2. The absolute values of SvO2 and ScvO2 may differ, however the changes in SvO2 are accompanied by parallel changes in ScvO2.
Figure 7. Arterial and Veonus oxygen saturation in various vascular organs
Hemodynamic Monitoring in PICUSYMPOSIUM: MONITORING IN PEDIATRIC CRITICAL CARE

JOURNAL OF PEDIATRIC CRITICAL CARE275Vol. 1 - No.4 October - December 2014
Clinical utility of mixed venous saturation:In the clinical setting, a decrease in SvO2 of 5% from its normal value (65%-77%) represents a signi cant fall in DO2 and/or an increase in O2 demand. The ScVO2 can be used in 2 ways: 1. Relating the absolute ScVO2 value to the OER
(eg, a low ScVO2 value [< 70%] accompanied by a high OER [> 0.25] could indicate relatively low CO)
2. Changes in ScVO2 might guide hemodynamic therapy, although it is dif cult in hyperdynamic conditions (5).
In adult patients with sepsis, restoring ScVO2 to > 70% might improve outcome (6). This might also be true for children with septic shock(7). Unfortunately, studies in septic adults have shown that many patients already have a ScVO2 value of> 70% at the start of therapy, although they might still need hemodynamic improvement.At present, the additional value of ScVO2 measurement in pediatric clinical practice is not clear. Nevertheless, ScVO2 monitoring is already incorporated in the surviving sepsis campaign algorithm for both adults and children. If ScVO2 is used, it should preferably be combined with CO measurement or markers of insuf cient oxygen perfusion such as lactate levels.Note: Occasionally, normal or increased SvO2 values are observed in a patient, who, by all other criteria, demonstrates compromised tissue oxygenation. Three etiologic mechanisms have been postulated for this observation: arterial admixture, abnormalities in distribution of blood ow, and histotoxic hypoxia.
Step 3: Preload and uid responsivenessIn the presence of hypotension, an important step is the assessment of preload and uid responsiveness. Preload is de ned as end-diastolic myocardial stretch (wall tension) and is often estimated at the bedside by a single/static measurement e.g. central venous pressure, CVP. More recently, assessment of uid responsiveness (e.g. pulse pressure variation PPV, systolic pressure variation, SPV) has been utilised in the care of critically ill patients. (Figure 9)Clinically, preload may be separated into right ventricular (RV) and left ventricular (LV) preload.
Jugular venous pressure (JVP) and CVP are used as surrogate estimates of RV preload. Pulmonary artery occlusion pressure (obtained using pulmonary artery catheter, see below) is used as a surrogate estimate of LV preload. Dynamic measures such as SPV are more accurate than static measurements for assessing uid responsiveness in mechanically ventilated patients. In simple terms, assessing uid responsiveness asks the question: will the cardiac output increase with uid administration? The principle behind dynamic measures is that swings in intrathoracic pressure, imposed by mechanical ventilation, affect venous return and as a consequence cardiac output (8). These swings in cardiac output are exaggerated in hypovolaemia indicating that the heart is operating on the ascending limb of the Frank-Starling (FS) curve (Figure 8).
Figure 8 Frank-Starling relationship: Once the ventricle is functioning on the steep part of the Frank-Starling curve, there is a preload reserve. Volume expansion (VE) induces a signi cant increase in stroke volume. The pulse pressure (PPV) and stroke volume (SVV) variations are marked and the passive leg raising (PLR) and end-expiratory occlusion (EEO) tests are positive. By contrast, once the ventricle is operating near the at part of the curve, there is no preload reserve and uid infusion has little effect on the stroke volume. There is a family of Frank-Starling curves depending upon the ventricular contractility
Hemodynamic Monitoring in PICUSYMPOSIUM: MONITORING IN PEDIATRIC CRITICAL CARE

JOURNAL OF PEDIATRIC CRITICAL CAREVol. 1 - No.4 October - December 2014 276
Central Venous PressureCentral venous pressure is the intravascular pressure in the great thoracic veins, measured relative to atmospheric pressure. It is conventionally measured at the junction of the superior vena cava and the right atrium and provides an estimate of the right atrial pressure.
Interpretation of central venous pressureNormal mean CVP is 5 to 3 mm Hg. Clinicians often assume that low values indicate hypovolemia and high values indicate hypervolemia or heart failure. However, isolated single CVP measurements are of limited utility. Instead, trends in CVP measurement over time or changes in CVP in response to therapy are better indicators of a patient�’s intravascular volume status. For example, a rapid uid bolus (eg, 500 mL) administered to a hypovolemic patient with good ventricular function will increase CVP minimally (1-2 mm Hg), with a return to baseline within 10 to 15 minutes due to circulatory re exes and stress relaxation of the vessels. The combination of a minimal rise in CVP and an associated increase in arterial blood pressure indicates a �‘�‘volume-responsive�’�’ patient who may be hypovolemic.
Preload
Static Dynamic
Pressure Indices
CVP PAOP
CVP= Central venous pressure Measurement device: Central venous catheter
PAOP=Pulmonary artery occlusion pressureMeasurement device: Pulmonary artery catheter
Volume Indices
GEDV LVEDV
GEDV= Global end-diastolic volume (transpulmonary thermodilution) Measurement device: PiCCO, Volume View
LVEDV= Left ventricularend-diastolic volume Measurement device: Echocardiography
PPV SPV SVVIVC/ SVC ‘collapsibility’
PPV= pulse pressure variationMeasurement device: PiCCO, LiDCOplus
SPV= systolic pressure variation Measurement device: PiCCO, LiDCOplus SVV= stroke volume variation Measurement device: PiCCO, LiDCOplus Flotrac/VigileoVolume clamp method (e.g Finapres, Nex n) Oesophageal Doppler, EchoDoppler
IVC= inferior vena cava SVC= superior vena cava
In contrast, the same uid bolus given to a patient who responds with a large increase in CVP without an accompanying improvement in blood pressure, suggests that additional volume loading is not indicated. Therefore, under most clinical circumstances, a trend in CVP values or its change with therapeutic maneuvers is more reliable than a single measurement. CVP is measured in the superior vena cava close to the right atrium, and for clinical purposes is assumed to equal right atrial pressure and right ventricular end-diastolic pressure. This pressure is monitored as a surrogate for right ventricular lling volume, which is proportional to muscle ber length or preload, the major determinant of stroke output of the right ventricle for any given level of contractility.When using a lling pressure, such as CVP, as a surrogate for estimating cardiac volume, one must take into consideration several points:�• The diastolic-pressure�–volume relationship in
cardiac muscle is not linear, but rather curvilinear, with a progressively steeper slope at higher volumes.
�• Ventricular compliance may change independent of end-diastolic volume (eg, as a consequence of ischemia). The same effective preload may be represented by two different CVP values if
Figure 9. Static and Dynamic Measure of Preload and the Devices Used for Measurement
Hemodynamic Monitoring in PICUSYMPOSIUM: MONITORING IN PEDIATRIC CRITICAL CARE

JOURNAL OF PEDIATRIC CRITICAL CARE277Vol. 1 - No.4 October - December 2014
ventricular compliance changes (Figure 10).�• CVP measurements are referenced to atmospheric
pressure, but physiologically, it is transmural pressure (the difference between intracardiac and intrathoracic-extracardiac pressure) that determines ventricular preload. Increased intrathoracic or high intrapericardial pressure (eg, high positive end-expiratory pressure levels, cardiac tamponade, large pleural effusion) may attenuate venous return but, at the same time, paradoxically increase measured CVP (Figure 11)
In summary, changes in CVP over time or in response to uid administration are more useful clinically than reliance on absolute numeric values. Central venous pressure must be considered to be the result of the complex interaction between intravascular volume status, ventricular compliance, and intrathoracic pressure.
Figure 10. Pressure�–volume relationship in a ventricle with normal or abnormal compliance. When ventricular compliance is normal, a 20-mL increase in right ventricular end-diastolic volume (RVEDV) produces a 2-mm-Hg rise in CVP (point A to point B) when RVEDV is 80 mL, but an 8-mm-Hg rise in CVP (point B to point C) when RVEDV is 100 mL. When ventricular compliance changes, as with ischemia or ventricular hypertrophy, higher lling pressures are required to generate the same RVEDV (point A to point D).
Figure 11. CVP changes during positive-pressure mechanical ventilation. Mean CVP increases at onset of each positive-pressure breath (arrows), but venous return decreases when the measured CVP increases.
Normal central venous pressure waveform morphologyThe CVP has three prominent positive waves: the �‘a,�’ �‘c,�’ and �‘v�’ waves and two prominent negative waves, the �‘x�’ and �‘y�’ descents. The �‘a�’ wave is due to atrial contraction, the �‘c�’ wave is due to the backward buckling of the tricuspid valve at the onset of systole, and the �‘v�’ wave is due to atrial lling during diastole. The �‘x�’ descent is due to the fall in atrial pressure during relaxation of the atrial contraction. The �‘y�’ descent is due to the sudden decrease in atrial pressure at the onset of diastole when the atrioventricular valve opens and allows the atrium to empty into the ventricle. (Table 5)
Table 5. Central Venous Pressure Waveform ComponentsWaveform Component
Phase of Cardiac Cycle Mechanical Event
a wave End diastole Atrial contraction
c wave Early systoleIsovolumic ventricular contraction, tricuspid motion toward the right atrium
v wave Late systole Systolic lling of the atrium
h wave Mid to late diastole Diastolic plateau
x descent Mid systole Atrial relaxation, descent of the base, systolic collapse
y descent Early diastole Early ventricular lling, diastolic collapse
Electronic measurement of central venous pressureProminent �‘a�’ and �‘v�’ waves raise the question where one should make the measurement on the tracing: at the top of the waves, the bottom, or the middle (Figure 12). As in all pressure measurements, there is an arbitrariness of the measurement; however, the
Figure 12: Normal CVP and its temporal relationship to the ECG.
Hemodynamic Monitoring in PICUSYMPOSIUM: MONITORING IN PEDIATRIC CRITICAL CARE

JOURNAL OF PEDIATRIC CRITICAL CAREVol. 1 - No.4 October - December 2014 278
most common reason for assessing CVP is likely the assessment of cardiac preload. For this purpose, the best place for the measurement is the �‘z�’ point, which is at the leading edge of the �‘c�’ wave, for this gives the nal pressure in the atrium and thus the ventricle just before ventricular contraction. This value is often not easy to identify, however, in which case it can be closely approximated by the base of the �‘a�’ wave.Although three distinct CVP peaks (a, c, v) and two troughs (x, y) are discernible in the normal venous pressure trace, heart rate changes and conduction abnormalities alter this pattern. A short ECG PR interval causes fusion of the a and c waves, and tachycardia reduces the length of diastole and the duration of the y descent, which causes the v and a waves to merge. In contrast, bradycardia causes each wave to become more distinct, with separate x and x descents visible and a more prominent h wave. Although there are circumstances in which other pathologic waves may be evident in the CVP trace, one should resist the temptation to assign physiologic signi cance to each small pressure peak because many will arise as artifacts of uid- lled tubing-transducer monitoring systems. It is more useful to search for the expected waveform components, including those characteristic of the pathologic conditions suspected (Table 6).
Table 6. Central Venous Pressure Waveform AbnormalitiesCondition Characteristics
Atrial brillationLoss of a waveProminent c wave
Atrioventricular dissociation Cannon a wave
Tricuspid regurgitationTall systolic c-v waveLoss of x descent
Tricuspid stenosisTall a waveAttenuation of y descent
Right ventricular ischemiaTall a and v wavesSteep x and y descentsM or W con guration
Pericardial constrictionTall a and v wavesSteep x and y descentsM or W con guration
Cardiac tamponadeDominant x descentAttenuated y descent
Respiratory variation during spontaneous or positive-pres-sure ventilation
Measure pressures at end-expiration
Utility of CVP to Predict the Volume Responsive PatientDuring the optimization of cardiovascular function, an important decision is whether to attempt to increase cardiac output by giving additional uid or whether to administer inotropic drugs. A desirable characteristic, therefore, of any index of preload is that it should be able to predict whether or not the heart is uid responsive, i.e., whether a further increase in preload will result in an increase in stroke volume. The majority of studies of the predictive value of CVP for uid responsiveness have been unable to demonstrate a relationship between the baseline CVP and the response to lling; those studies where a relationship between low CVP and uid responsiveness has been demonstrated found such an overlap of CVP values between the responder and non-responder groups that to threshold value which would discriminate between the two groups could be determined. Patients can be volume limited at CVP values as low as 2 mm Hg (based on sternal angle referenced values), whereas others may respond at CVP values greater than 18 mm Hg. We recently found that 40% of patients with a CVP below 6 mm Hg did not respond to uids Use of CVP measurements to assess whether or not a patient�’s cardiac output will increase signi cantly in response to an infusion of intravenous uid cannot therefore be recommended.
Dynamic Changes in CVPRecently there has been interest in using the dynamic changes in CVP with respiration to predict uid responsiveness. Two studies from the same group [23, 24], both involving spontaneously breathing patients, have shown that an inspiratory fall in CVP by 1 mmHg is highly predictive of a uid responsive cardiac index (9).
‘y’ descentAnother indicator that there will not be an increase in cardiac output with a volume infusion is the magnitude of the �‘y�’ descent. Although the number of patients was small, we found that a �‘y�’ descent greater than 4 mmHg indicated that there would be no increase in cardiac output in response to uid infusion. An explanation is that the �‘y�’ descent is due
Hemodynamic Monitoring in PICUSYMPOSIUM: MONITORING IN PEDIATRIC CRITICAL CARE
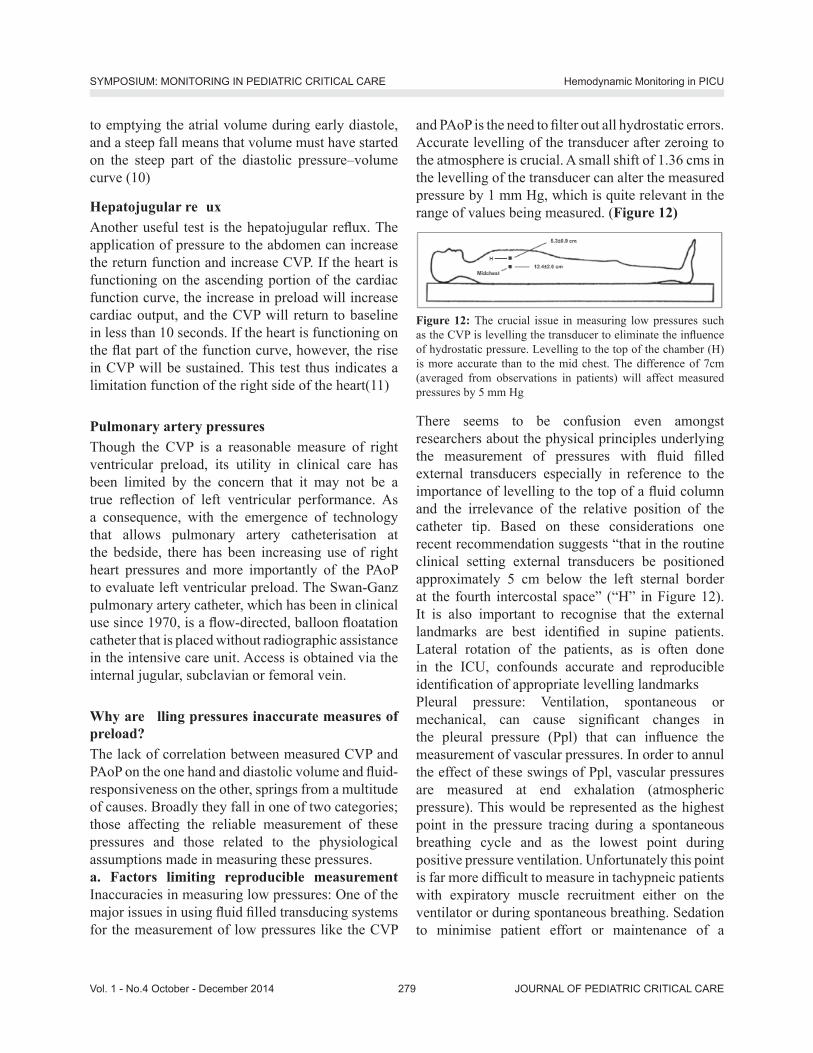
JOURNAL OF PEDIATRIC CRITICAL CARE279Vol. 1 - No.4 October - December 2014
to emptying the atrial volume during early diastole, and a steep fall means that volume must have started on the steep part of the diastolic pressure�–volume curve (10)
Hepatojugular re uxAnother useful test is the hepatojugular re ux. The application of pressure to the abdomen can increase the return function and increase CVP. If the heart is functioning on the ascending portion of the cardiac function curve, the increase in preload will increase cardiac output, and the CVP will return to baseline in less than 10 seconds. If the heart is functioning on the at part of the function curve, however, the rise in CVP will be sustained. This test thus indicates a limitation function of the right side of the heart(11)
Pulmonary artery pressuresThough the CVP is a reasonable measure of right ventricular preload, its utility in clinical care has been limited by the concern that it may not be a true re ection of left ventricular performance. As a consequence, with the emergence of technology that allows pulmonary artery catheterisation at the bedside, there has been increasing use of right heart pressures and more importantly of the PAoP to evaluate left ventricular preload. The Swan-Ganz pulmonary artery catheter, which has been in clinical use since 1970, is a ow-directed, balloon oatation catheter that is placed without radiographic assistance in the intensive care unit. Access is obtained via the internal jugular, subclavian or femoral vein.
Why are lling pressures inaccurate measures of preload? The lack of correlation between measured CVP and PAoP on the one hand and diastolic volume and uid-responsiveness on the other, springs from a multitude of causes. Broadly they fall in one of two categories; those affecting the reliable measurement of these pressures and those related to the physiological assumptions made in measuring these pressures.a. Factors limiting reproducible measurement Inaccuracies in measuring low pressures: One of the major issues in using uid lled transducing systems for the measurement of low pressures like the CVP
and PAoP is the need to lter out all hydrostatic errors. Accurate levelling of the transducer after zeroing to the atmosphere is crucial. A small shift of 1.36 cms in the levelling of the transducer can alter the measured pressure by 1 mm Hg, which is quite relevant in the range of values being measured. (Figure 12)
Figure 12: The crucial issue in measuring low pressures such as the CVP is levelling the transducer to eliminate the in uence of hydrostatic pressure. Levelling to the top of the chamber (H) is more accurate than to the mid chest. The difference of 7cm (averaged from observations in patients) will affect measured pressures by 5 mm Hg
There seems to be confusion even amongst researchers about the physical principles underlying the measurement of pressures with uid lled external transducers especially in reference to the importance of levelling to the top of a uid column and the irrelevance of the relative position of the catheter tip. Based on these considerations one recent recommendation suggests �“that in the routine clinical setting external transducers be positioned approximately 5 cm below the left sternal border at the fourth intercostal space�” (�“H�” in Figure 12). It is also important to recognise that the external landmarks are best identi ed in supine patients. Lateral rotation of the patients, as is often done in the ICU, confounds accurate and reproducible identi cation of appropriate levelling landmarks Pleural pressure: Ventilation, spontaneous or mechanical, can cause signi cant changes in the pleural pressure (Ppl) that can in uence the measurement of vascular pressures. In order to annul the effect of these swings of Ppl, vascular pressures are measured at end exhalation (atmospheric pressure). This would be represented as the highest point in the pressure tracing during a spontaneous breathing cycle and as the lowest point during positive pressure ventilation. Unfortunately this point is far more dif cult to measure in tachypneic patients with expiratory muscle recruitment either on the ventilator or during spontaneous breathing. Sedation to minimise patient effort or maintenance of a
Hemodynamic Monitoring in PICUSYMPOSIUM: MONITORING IN PEDIATRIC CRITICAL CARE
JOURNAL OF PEDIATRIC CRITICAL CAREVol. 1 - No.4 October - December 2014 280
mechanical rate high enough to override spontaneous breathing will allow better identi cation of the end-expiratory point in critically ill patients.b. Failure of assumptions Besides the factors that may result in mismeasurement of vascular pressures, the poor correlation of CVP and PAoP with other estimates of preload is probably due to the lack of robustness of the physiological assumptions we make prior to measuring these pressures. Inter-individual differences may further confound the interpretation of CVP and PAoP. In conclusion for static pressure indices, it is wrong to believe that the CVP and PAoP are foolproof measures of preload, as there are many limitations to accurate measurement. A full understanding of limitations will minimize errors in estimation and interpretation and allow these parameters to be used more effectively in clinical practice.
Dynamic indices for preload assessmentIf absolute measures of cardiovascular values cannot be used effectively as parameters describing cardiovascular status or responsiveness, then more provocative maneuvers need to be employed to improve the utility of these measures. Cavallaro has proposed a useful classi cation of dynamic indices that predict volume responsiveness (8).- Group A consists of indices based on cyclic variation
in SV or SV-related hemodynamic parameters determined by mechanical ventilation induced cyclic variation in intrathoracic pressure, and includes such metrics as pulse pressure variation (PPV), its derivatives, and aortic blood ow.
- Group B is made up of indices based on cyclic variations of non-stroke volume-related hemodynamic parameters determined by mechanical ventilation, and includes vena cava diameter or ventricular pre-ejection period.
- Group C consists of indices based on preload redistribution maneuvers; mechanical ventilation is not required, and group C includes passive leg raising and Valsalva maneuvers.
Group A and B techniques are based on the physiologic interaction of the heart and lungs within a closed thoracic cavity, and rely on the phasic changes
in SV created by changing intrathoracic pressure due to positive pressure mechanical ventilation. During positive pressure inspiration, preload to the right heart is decreased because of increased intrathoracic pressure, both from compression of the vena cava (decreased venous return) and increased right atrial pressure. This decrease in right ventricular (RV) preload leads to a decrease in RV output, which subsequently leads to a decrease in pulmonary artery blood ow, LV lling, and LV output. Other mechanisms postulated to increase LV SV variation with PPV include the following changes during inspiration, caused by increased transpulmonary pressure - Increased RV afterload- Increased LV preload- Decreased LV afterload.The end result of these pressure changes is that LV SV increases, while RV SV decreases during positive pressure inspiration. The delay of pulmonary blood transit time results in decreased RV SV translating to a decreased LV SV a few heartbeats later (ie, usually during expiration). These phasic differences are exaggerated in the setting of hypovolemia for several reasons:- The under lled vena cava is more collapsible- The under lled right atrium is more susceptible to
increased intrathoracic pressureMore of the lung demonstrates the physiology of West Zones 1 and 2 (in West Zone 1 the alveolar pressure is greater then the arteriolar pressure, which is greater than venous pressure; in West Zone 2 the arteriolar pressure is greater than alveolar pressure, which is greater than venous pressure), which effectively increases RV afterload. Larger changes are seen when operating on the steeper portion of the Frank-Starling curve. This increased variation in pressures between the inspiratory phase and the expiratory phase can be used to identify hypovolemia and volume responsiveness, and is the basis for Cavallaro�’s group A and B indices, including stroke volume variation (SVV) and pulse pressure variation.
Stroke Volume VariationSVV examines the difference between the SV during
Hemodynamic Monitoring in PICUSYMPOSIUM: MONITORING IN PEDIATRIC CRITICAL CARE

JOURNAL OF PEDIATRIC CRITICAL CARE281Vol. 1 - No.4 October - December 2014
the inspiratory and expiratory phases of ventilation, and requires a means to directly or indirectly assess SV. This eliminates arterial compliance as a variable, but until recently, has required invasive monitoring such as aortic ow probes. Now, the PiCCO (Pulsion Medical Systems,Germany), LiDCO (LiDCO Group PLC, England) and FloTrac sensor (Edwards Lifesciences, USA) monitors uses pulse contour analysis through a proprietary formula to measure cardiac output and SVV. SVV of 10% has also been shown to be a speci c and sensitive predictor of uid responsiveness.
Systolic Pressure Variation ( gure 13)Systolic pressure variation (SPV) is the difference between the maximum and the minimum systolic pressure over a single respiratory cycle and can be expressed in millimeters of mercury (SPmax - SPmin) or as a percent SPV(%) = 100 X (SPmax - SPmin)/ [(SPmax + SPmin)/2]). Increased SPV was the rst of these indices to be recognized to correlate with hypovolemia and was later shown to have a sensitivity of 82%, speci city of 86%, and area under the receiver operator characteristic (ROC) curve (AUC) of 0.92, using a threshold of 8.5 mm Hg. SPV can be broken down into delta up (dUp) and delta down (dDown). These two components are calculated using a reference systolic pressure measured during an end�–expiratory pause according to the following equations:dUp = SPmax - SPref
dDown = SPref - SPmin
where SPmax is the maximum systolic pressure in a single respiratory cycle; SPref is the reference systolic pressure at end�–expiration, and SPmin is the minimum systolic pressure measured in a single respiratory cycle. dUp re ects the inspiratory increase in systolic pressure, resulting from an increase in extramural aortic pressure (increase in diastolic pressure) and an increase in LV SV. As the extramural aortic pressure component seems more signi cant in many patients,increased dUp is not a reliable indicator of uid responsiveness. dDown re ects the expiratory decrease in LV SV related to the inspiratory decrease in RV SV.
Figure 13. Arterial pressure (ART) waveform showing systolic pressure variation during positive pressure mechanical ventilation. End-expiratory systolic blood pressure (1) serves as a baseline from which an early inspiratory increase (2, Dup) can be measured, followed by a delayed decrease (3, Ddown). The large Ddown and total systolic pressure variation of nearly 30 mm Hg suggests the diagnosis of hypovolemia
Pulse Pressure Variation ( gure 14)Arterial pulse pressure is the difference between arterial systolic and diastolic pressure. This difference is in uenced by SV and the arterial compliance. Comparison of the pulse pressure during inspiration with pulse pressure during expiration demonstrates the degree to which the pulse pressure is preload-limited. As comparison is being made during a single respiratory cycle, change in arterial compliance theoretically should be minimal. Prerequisites for the adequate use of PPV include sinus rhythm, absence of spontaneous ventilatory effort (sedated), absence of right heart failure and a tidal volume
8 mL/kg. Analysis of the PPV thus can be used to predict volume responsiveness, and is expressed as a percentage: PPV(%) = 100X (PPmax - PPmin)/[(PPmax + PPmin)/2].
Figure 14: Pulse pressure variation
A PPV of 13% has been shown to be a speci c and sensitive indicator of preload responsiveness (12)
Hemodynamic Monitoring in PICUSYMPOSIUM: MONITORING IN PEDIATRIC CRITICAL CARE

JOURNAL OF PEDIATRIC CRITICAL CAREVol. 1 - No.4 October - December 2014 282
Respiratory variability of the superior and inferior vena cavaThe inferior and superior venae cavae are distensible blood vessels whose diameters and ow vary with respiration. These variations are re ected by changes in aortic ow within a few beats of the heart.In PPV, the increase in pleural pressure is transmitted fully to the right atrium, and partially transmitted to the abdomen via depression of the diaphragm, causing an overall increase in transmural pressure of the IVC. Because the IVC is distensible, this increase in pressure causes an increase in diameter of the IVC. In hypovolemic patients (ie, those on the steep part of the pressure volume curve), these diameter changes should be larger than if the IVC is full (ie, on the at part of the pressure volume curve). Unlike the IVC, the course of the SVC is mainly intrathoracic. Positive pressure ventilation then should cause a decrease in transmural pressure, and subsequent decrease in the diameter of the SVC, especially in hypovolemic patients.Barbier and colleagues determined that the distensibility index of the IVC (dIVC), de ned as (Dmax - Dmin)/Dmin and expressed as a percentage, was predictive of uid responsiveness with a sensitivity of 90% and a speci city of 90%. They concluded that a dIVC above 18% was predictive of an increase in cardiac index of at least 15% with uid loading(13). Viellard-Baron studied the effect of PPV on the SVC and the ability to predict volume responsiveness. They studied 66 mechanically ventilated patients in septic shock with acute lung injury. An SVC collapsibility index (maximum diameter on expiration �– minimum diameter on inspiration/maximum diameter on expiration) threshold of 36% allowed discrimination between non-responders and responders with sensitivity of 90% and speci city of 100%(14).Cautions Regarding Cavallaro Group A and B IndicesThere are several important caveats to keep in mind when using these dynamic indices to predict uid responsiveness:- Positive pressure, controlled ventilation is
required to obtain meaningful values for any of the Cavallaro group A or B indices. Spontaneous respiratory efforts, even when supported by the ventilator, alter the mechanics such that these
numbers lose their reliability.- Sinus rhythm is required. Arrhythmia or frequent
extra systoles result in altered SV and invalidate these tools to predict volume responsiveness.
- Many of these techniques require invasive arterial blood pressure monitoring with a catheter, and as such, they are prone to the same errors in measurement associated with invasive blood pressure monitoring: air bubbles in the catheter tubing, excessive tubing length, kinks in the tubing, excessively compliant tubing, and other errors.
- A single value never should replace clinical judgment. A high PPV value in a normotensive patient with evidence of normal tissue perfusion does not mean that person requires volume expansion.
- Further investigation of these techniques in the setting of vasoactive medications is needed.
- How extremes of ventilation (ie, low tidal volume, high respiratory rate, high positive end-expiratory pressure [PEEP]) affect group A and B indices is not yet clear. Most of the early data came from patients ventilated with at least 10 mL/kg tidal volumes.
Passive Leg Raising ( gure 15)Passive leg raising (PLR) is a form of reversible volume challenge that can be used to evaluate which patients will bene t from intravenous uid and increased preload. Elevating a patient�’s legs allows a passive transfer of blood from the lower part of the body toward the central circulation. The amount of blood transferred from the legs is variable and has been estimated to be between 150 to 750 mL (equivalent approximately to 4.3 ml/kg) depending on technique and patient. Importantly, PLR can be used in spontaneously breathing patients and in patients not in sinus rhythm. The increase in preload from the maneuver is reversed completely when the legs are returned to horizontal, meaning it is safe even in cases in which increasing blood volume may be harmful, such as ARDS. International consensus guidelines now recommend PLR to evaluate uid responsiveness in patients with shock. Using esophageal Doppler measurements of aortic blood ow as a surrogate of cardiac output, Monnet found that an increase in
Hemodynamic Monitoring in PICUSYMPOSIUM: MONITORING IN PEDIATRIC CRITICAL CARE

JOURNAL OF PEDIATRIC CRITICAL CARE283Vol. 1 - No.4 October - December 2014
aortic blood ow of at least 10% with PLR predicted volume responsiveness with a sensitivity of 97% and speci city of 94% (15). Changes in aortic blood ow were rapid (within 30 seconds of PLR) and transient. The authors found that the PLR-induced changes in aortic blood ow and arterial pulse pressure variation were predictive of volume responsiveness, but the former was more accurate than the latter. Jabot and colleagues con rmed that maximal uid shifts, and therefore better predictive value, are obtained when patients are shifted from the semirecumbent (chair) position to supine with legs elevated. Elevating the legs of a horizontal supine patient may still be helpful, but sensitivity is decreased. In the largest study to date, Thiel and colleagues measured SV changes with PLR, using a transthoracic Doppler device, they determined that a greater than or equal to 15% increase in SV with PLR predicted. Vasoconstrictors, increased intra-abdominal pressures, and elastic compression stockings all may have an impact on validity of PLR; further studies are needed to clarify these issues. It would be prudent to avoid PLR in patients with increased intracranial pressure.
Figure 15. Postural change during PLR
Respiratory Systolic Variation Test ( gure 16)The respiratory systolic pressure variation (RSVT) is a technique whereby three or four consecutive pressure-controlled breaths of increasing peak inspiratory pressures are administered over a brief period of time to intubated, sedated patients. The minimum systolic blood pressure (SBP) value following each of these breaths is recorded, and the results plotted against their respective airway pressures. A steeper slope (ie, larger decrease in SBP with increasing tidal volume) implies that the patient will be uid-responsive, whereas less of a slope
implies the patient�’s ventricles are on the at part of the Frank-Starling curve, and the patient will not increase cardiac output with uid loading.
Figure. 16. Response of the arterial blood pressure (BP) to the RSVT. Three consecutive mechanical pressure-controlled breaths are delivered with inspiratory pressures of 10, 20, and 30 cm H2O. Minimal values of SBP in response to each breath are recorded, and then the slope of the relationship between the decrease in BP and inspiratory pressure is calculated.
End-expiratory occlusion test (EEOT)It is hypothesized that upon interrupting mechanical ventilation at the end of expiration for a period of 15 sec, the preload increases due to an increase of the venous return in such a way suf cient to predict a uid response. Recently, Monnet et al. validated this hypothesis in patients with circulatory failure. Responsive patients demonstrated an increase of the pulse pressure and cardiac index with this maneuver. It is also possible to apply this test to patients with arrhythmia in whom a partial ventilatory modality is being used or in patients with ARDS with low pulmonary compliance where the use of the PPV and SVV do not present greater usefulness.
Cardiac Preload Evaluation Using Echocardiographic TechniquesIn short, using echocardiographic and Doppler parameters, low volume status is often characterized by a small inferior vena cava size and large diameter respiratory changes, large respiratory movements of the interatrial septum, small LV size, E/A ratio < 1, DTE > 150 ms, TDA > 60 ms, A/a > 1, SF > 55 %, E/Em < 8 and E/Vp < 2.5, low cardiac output and
Hemodynamic Monitoring in PICUSYMPOSIUM: MONITORING IN PEDIATRIC CRITICAL CARE

JOURNAL OF PEDIATRIC CRITICAL CAREVol. 1 - No.4 October - December 2014 284
large respiratory variations of aortic ow or stroke volume (16).Conclusion: Dynamic indices repeatedly have been shown to be superior to static measures for determining preload responsiveness in critically ill patients. The number of options for assessing uid responsiveness available to the clinician is increasing; however, few have been evaluated in large, multicenter trials. Currently there are no data on whether managing patients using dynamic indices affects outcomes. It is important to remember that preload responsiveness does not equate to needing more preload. Healthy individuals are preload-responsive, and will increase their cardiac output in response to a uid challenge, but they do not require increased blood volume. Therefore even with accurate measures of preload responsiveness, clinical judgment remains essential.
Step 4: Cardiac output monitoringCardiac output (CO) monitoring plays an essential role in critical care. Direct measurement of CO should be considered when a patient remains hypotensive despite adequate uid resuscitation or when there is ongoing evidence of global tissue hypoperfusion. There are many CO monitoring devices available today. These include devices which use methodologies based on indicator dilution, thermodilution, pulse pressure analysis, Doppler principles, and also Fick principle. Patient status dictates the type of CO monitoring required. These systems can be easily listed in order of degree of invasiveness, from the highly invasive PAC to the completely non-invasive bioimpedance/bioreactance technique and transthoracic echo-doppler.
Methods of cardiac output measurements:A. Invasive
�• Dilution techniques�• Dye dilution�• Pulmonary artery
thermodilution�• Transpulmonary
thermodilution�• Lithium dilution�• Direct - Fick
B. Non- invasive/Minimal Invasive
�• Indirest Fick using CO2
�• Bioimpedance�• Echocardiography�• Transoesophageal
Doppler�• Pulse contour analysis
In general, dilution techniques deliver a reliable CO measurement for children from 3.5 kg, but all require insertion of central venous and arterial catheters. Less invasive methods are often less reliable. At present the transpulmonary thermodilution method is considered to be the clinical gold standard for children (17). The transpulmonary thermodilution technology also offers the measurement of global enddiastolic volume, re ecting preload, and extravascular lung water (EVLW), which re ects pulmonary edema. In general, the bedside CO techniques cannot be used in patients with intracardiac and extracardiac shunts. However, the transpulmonary thermodilution technology and the modi ed CO2 Fick methods might be feasible in this situation.Nonetheless, in adults there is no evidence that the use of a pulmonary artery catheter improves morbidity and/or mortality rates (18). Likewise, the evidence that CO monitoring improves outcome in critically ill children is also missing. CO monitoring does provide the clinician with important hemodynamic information and provides a physiologic value that can be used to determine and guide therapy. Clinical studies of CO-guided hemodynamic therapy in children, therefore, are warranted.
Basic principles of thermodilution and indicator dilution methods The principles underlying these techniques are essentially the same (Table 7). An indicator is injected into a central vein, and cardiac output is calculated by measuring the change in blood indicator concentration over time at a point downstream of the injection. The method for sensing the indicator varies according to the injectate and may utilize a thermistor (temperature), densitometry or oximetry (dye), or an ion-selective electrode (lithium charge) (Figure 17).
Hemodynamic Monitoring in PICUSYMPOSIUM: MONITORING IN PEDIATRIC CRITICAL CARE
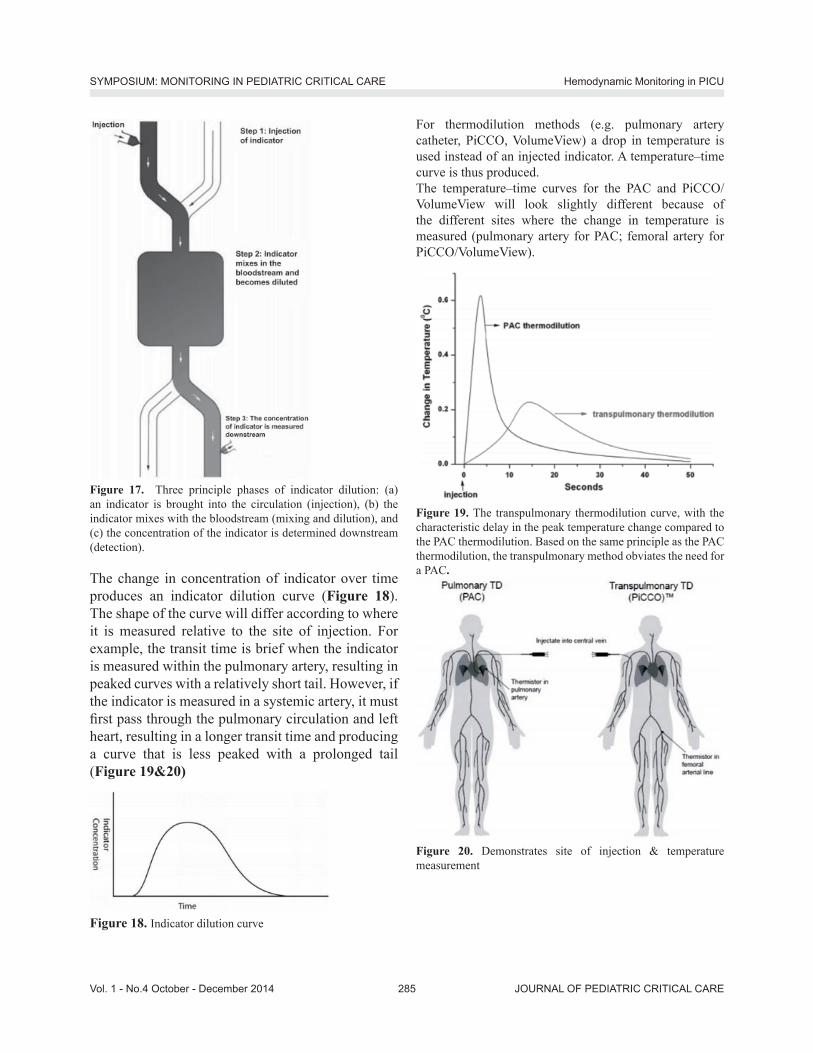
JOURNAL OF PEDIATRIC CRITICAL CARE285Vol. 1 - No.4 October - December 2014
Figure 17. Three principle phases of indicator dilution: (a) an indicator is brought into the circulation (injection), (b) the indicator mixes with the bloodstream (mixing and dilution), and (c) the concentration of the indicator is determined downstream (detection).
The change in concentration of indicator over time produces an indicator dilution curve (Figure 18). The shape of the curve will differ according to where it is measured relative to the site of injection. For example, the transit time is brief when the indicator is measured within the pulmonary artery, resulting in peaked curves with a relatively short tail. However, if the indicator is measured in a systemic artery, it must rst pass through the pulmonary circulation and left heart, resulting in a longer transit time and producing a curve that is less peaked with a prolonged tail (Figure 19&20)
Figure 18. Indicator dilution curve
For thermodilution methods (e.g. pulmonary artery catheter, PiCCO, VolumeView) a drop in temperature is used instead of an injected indicator. A temperature�–time curve is thus produced. The temperature�–time curves for the PAC and PiCCO/VolumeView will look slightly different because of the different sites where the change in temperature is measured (pulmonary artery for PAC; femoral artery for PiCCO/VolumeView).
Figure 19. The transpulmonary thermodilution curve, with the characteristic delay in the peak temperature change compared to the PAC thermodilution. Based on the same principle as the PAC thermodilution, the transpulmonary method obviates the need for a PAC.
Figure 20. Demonstrates site of injection & temperature measurement
Hemodynamic Monitoring in PICUSYMPOSIUM: MONITORING IN PEDIATRIC CRITICAL CARE

JOURNAL OF PEDIATRIC CRITICAL CAREVol. 1 - No.4 October - December 2014 286
The Direct Fick MethodThe Fick method was rst described by Adolph Fick in 1870(19), who applied the concept of mass balance to the measurement of blood ow. As such, it remains one of the most technically challenging, yet useful techniques for measuring cardiac output, not least because of its applicability to patients with anatomic shunts. The Fick principle involves adding (or removing) an indicator and measuring the change in indicator concentration upstream and downstream of the point of indicator addition (or removal); ow can then be calculated via the formula:Flow (volume/time) = indicator added (mass/time)/change in indicator concentration (mass/volume)For calculation of cardiac output, the most common measured indicator is oxygen consumption, although carbon dioxide production can also be utilized. A valuable aspect of the Fick principle is that it allows cardiac output to be calculated separately for the systemic (Qs) and pulmonary (Qp) circulations. The Fick technique requires a method for measuring oxygen consumption or carbon dioxide production, as well as access to the arterial and mixed venous circulations. Traditional methods for measuring oxygen consumption, such as the Douglas bag or
Table 7. Dilution methods for determining cardiac outputMethod Advantages Disadvantages Additional variables measuredThermodilution: (pulmonary artery sampling)
Proven track record; semicontinuous mode available
Variations in cardiac output with respiratory cycle; dif cult access in small patients; inaccurate at low ow; low but signi cant morbidity: infection, bleeding, catheter knotting
Pulmonary pressure; wedge pressure; mixed venous oxygen saturation
Thermodilution: Transpulmonary (systemic artery sampling)
Easy access in small patients; repeatable; continuous if device is combined with arterial pulse contour method (combination commercially available)
Requires dedicated arterial line, safe length of insertion time unknown, frequent recalibration required if used in conjunction with pulse contour method
Intrathoracic blood volume (preload); cardiac function index (contractility); extravascular lung water; stroke volume variability (if used with pulse contour method)
Dye dilution Accurate Sequential measurements limited by dye clearance; commercial availability of dye and devices
Lithium chloride dilution
Utilizes preexisting central venous and arterial lines; continuous if device is combined with arterial pulse contour method (combination commercially available)
Sequential measurements limited by lithium clearance; theoretical risk of toxicity; requires blood sample with each measurement; unlicensed in <40 kg; frequent recalibration required if used in conjunction with pulse contour method
Stroke volume variability (if used with pulse contour method)
spirometry, preclude measurement in the intensive care environment. However, these techniques have been advanced with portable metabolic monitors and/or mass spectrometry. As the Fick technique is vulnerable to many sources of error at each measurement step, attention to detail is vital.
Continuous cardiac output measurement: Minimal/Non-invasive: Arterial pressure waveform analysisThe PiCCO and LiDCO and Flotrac/Vigileo systems provide continuous CO m easurement using the arterial pressure waveform. These systems analyse the arterial waveform and use algorithms to calculate the CO. The newer versions LiDCO (LiDCOrapid) and Flotrac/Vigileo do not require calibration (20). The main advantage of the arterial pressure trace-derived systems is that they are less invasive than the PAC. However they have weaknesses which limit their use in certain clinical situations.The way in which the arterial pressure waveform is analysed is slightly different with each device (Figure 21). PiCCO analyses the systolic portion of the arterial waveform. LiDCO analyses the waveform with what is called pulse power analysis. Flotrac/
Hemodynamic Monitoring in PICUSYMPOSIUM: MONITORING IN PEDIATRIC CRITICAL CARE

JOURNAL OF PEDIATRIC CRITICAL CARE287Vol. 1 - No.4 October - December 2014
Vigileo analyses the waveform 100 times/second over 20 seconds, capturing 2000 data points for analysis. This is then incorporated into a proprietary formula to calculate CO.
Figure 21. Demonstrates technologies to assess arterial waveform analysis
Echocardiography and Doppler technology to measure cardiac output Echocardiography has become an important diagnostic and monitoring tool in critical care. Cardiac output can be measured by 2D echocardiography and Doppler technology, using either a transthoracic (TTE) or transoesophageal (TOE) technique. TTE has the advantage of being rapid and non-invasive, but images may sometimes be limited in ventilated ICU patients. TOE provides high quality images but is more invasive than TTE. Stroke volume is calculated using Doppler to measure the velocity time integral (VTi) of the ow signal at a given site, and 2D echo to measure the cross sectional area of the same site. These measurements of ow and diameter are usually obtained at the level of the left ventricular out ow tract (LVOT), and then used to calculate CO. Many modern machines will compute this information automatically when measurements are entered. Echo-Doppler calculation of CO is operator dependent, and continuous measurement of CO cannot be performed using this technique.Continuous transoesophageal echocardiography is a miniaturised TOE probe which allows continuous
qualitative haemodynamic assessment from a transverse plane, allowing visual assessment of cardiac performance and uid status. It consists of a disposable probe (licensed for use up to 72 hours) which is connected to the echocardiography machine. Although smaller than a conventional TOE probe, some of the contraindications to TOE use may still apply with this device. There has been limited evaluation of this technique to date in critically ill patients. Oesophageal Doppler monitoring Oesophageal Doppler (ODM) measures blood ow velocity in the descending aorta by using a Doppler transducer at the tip of a probe, which is inserted into the oesophagus via the mouth or nose.
CO2 rebreathingCO2 rebreathing systems, based on the Fick principle, use a CO2 sensor, a disposable air ow sensor and a disposable rebreathing loop. CO2 production is calculated from minute ventilation and its CO2 content, and the arterial CO2 content is estimated from end-tidal CO2. Partial rebreathing reduces CO2 elimination and increases the end-tidal CO2. By combining measurements taken during and without rebreathing, venous CO2 content can be eliminated from the Fick equation. However, intrapulmonary shunting of blood and rapid hemodynamic changes affect the accuracy of the measurement, so that this technique is not considered to be reliable in acutely ill patients.
Bioimpedance and bioreactanceBioimpedance is based on the fact that the conductivity of a high-frequency, low-magnitude alternating current passed across the thorax changes as blood ow varies with each cardiac cycle. These changes can be measured using electrodes placed on a patient�’s chest and used to generate a waveform from which cardiac output can be calculated. Bioreactance has developed out of bioimpedance and measures changes in the frequency of the electrical currents traversing the chest, rather than changes in impedance, potentially making it less sensitive to noise. These techniques are non-invasive and
Hemodynamic Monitoring in PICUSYMPOSIUM: MONITORING IN PEDIATRIC CRITICAL CARE

JOURNAL OF PEDIATRIC CRITICAL CAREVol. 1 - No.4 October - December 2014 288
can be applied quickly. They have been used for physiological studies in healthy individuals and may be useful in perioperative applications, but are less reliable in critically ill patients. Electrical interference may also occur in the ICU environment.
Volume clamp methodThis newer non-invasive technique uses an in atable nger cuff. Photoelectric plethysmography in combination with a volume clamp technique (in atable nger cuff) is used to produce a brachial arterial waveform, allowing continuous CO to be measured. Data to date on the usefulness of this technique in the critically ill is limited.
Step 5: Assessment of cardiac contractilityAssessing cardiac contractility is important in establishing the aetiology of shock, and in guiding further therapy. For example, a patient in cardiogenic shock with poor LV function is likely to require inotropy with adrenaline or dobutamine infusion, whereas a septic patient with a hyperdynamic heart is more likely to bene t from a vasopressor infusion such as noradrenaline.
EchocardiographyCardiac performance may be rapidly assessed at the bedside using transthoracic echocardiography (TTE). A visual assessment of LV function will often reveal any signi cant abnormality. Formal estimation of LV contractility can be performed by measuring ejection fraction (EF). The EF is the percentage of LV diastolic volume ejected with each heart beat (normal >55%)(Table 8).EF (%) = {(EDV- ESV)/ EDV} x 100
Table 8. Left Ventricular ejection fraction rangeEjection fraction (EF) Value %Normal 55% Mild impairment 45�–54% Moderate impairment 30�–44%Severe impairment <30
The utility of echocardiography as a haemodynamic monitor is far greater than assessment of LV function.
It is the test of choice in critically ill hypotensive patients to identify or exclude a �‘cardiac�’ cause of shock as it is portable to the bedside, safe and can provide an immediate diagnosis. Left ventricular contractility can also be estimated by analysis of the arterial waveform. It is derived from the maximum speed of the arterial pressure curve (dP/dtmax) during the ejection phase.Echocardiography should not be viewed simply in the context of cardiac output or ejection fraction. It can provide an assessment of preload and diagnose potentially reversible ventricular or valvular pathologies, cardiac tamponade, or massive pulmonary embolism or congenital shunt defects.
Step 6: Assessment of microcirculation / regional tissue perfusionMeasuring the adequacy of microcirculatory blood ow as a direct indicator of the success of the cardiovascular system to provide adequate oxygen and nutrients to the cells, can be regarded as an important extension of the measurement of systemic hemodynamic variables [21,22]. However several issues need to be addressed. These are:1. The reliability and reproducibility of the
measurement2. The identication of the most relevant
microcirculatory parameters which need to be determined; and
3. The prognostic value of these parameters in guiding therapy
A. Orthogonal polarisation spectral (OPS) and sidestream dark eld (SDF) imaging devices: Orthogonal polarization spectral (OPS) imaging is the rst hand-held imaging device that allows bedside visualization of the microcirculation. OPS imaging is based on the optical technique introduced by Slaaf et al, in which green polarized light is used to illuminate the tissue area of interest, which at the bedside is usually the buccal or sublingual mucosa. The green light is absorbed by hemoglobin within the red blood cells (RBCs) in the microcirculation. The re ected light is detected by an orthogonally placed analyzer which lters out surface re ections in order to
Hemodynamic Monitoring in PICUSYMPOSIUM: MONITORING IN PEDIATRIC CRITICAL CARE

JOURNAL OF PEDIATRIC CRITICAL CARE289Vol. 1 - No.4 October - December 2014
produce a high contrast re ected light image of owing RBCs within the microcirculation. Sidestream dark eld (SDF) imaging is the improved successor to OPS imaging and is based on the dark eld illumination technique introduced by Sherman et al. In this technique, the micro circulation can be observed without the need to use transillumination (Figure 22). Instead SDF imaging uses a stroboscopic light emitting diode ring-based imaging device so it provides better image quality of the microcirculation.
Figure 22. Sidestream dark- eld (SDF) imaging: This imaging technique is an improved method of observing the human microcirculation at the bedside. (a) SDF imaging consists of a light guide surrounded by green light-emitting diodes (LEDs; wavelength 530 nm) whose light penetrates the tissue and illuminates the microcirculation. The light is absorbed by hemoglobin of the red blood cells and scattered by leukocytes. A magnifying lens projects the image onto a video camera. Placed on organ surfaces, SDF imaging provides crisp images of the red blood cells and leukocytes owing through the microcirculation. (b) As an example of the improved image quality provided by SDF imaging, the sublingual microcirculation of a volunteer is shown, with a magni ed inset showing several leukocytes.
These techniques can be used only on organs covered by a thin epithelial layer. In the sublingual area, which is the area that has been investigated most, capillaries and venules of variable size (resolution is 2�–3 lm) can be visualized; arterioles are usually not visualized because they are located in deeper layers. Red blood cells are identi ed as black bodies and tissue perfusion can be characterized in individual vessels.What can be measured with these techniques and what is important? Different variables can be measured, including vascular density, heterogeneity of perfusion, and microvascular blood ow (Table 9). Several limitations should be acknowledged. Secretions and movement artifacts may impair image quality. In addition, movement artifacts can spuriously interrupt ow in some microvessels. Finally, the investigation of the sublingual area is only feasible in sedated or cooperative patients. It is also impossible to evaluate the sublingual microcirculation in hypoxemic patients who are being treated with noninvasive mechanical ventilation.
B. NIRS (Near-infrared spectroscopy) Near-infrared spectroscopy (NIRS) is a technique
that utilizes near-infrared light to measure chromophores (oxy- and deoxyhemoglobin, myoglobin, and cytochrome aa3) in tissues. The fractions of oxy- and deoxyhemoglobin are used to calculate tissue O2 saturation (StO2). In addition, total light absorption is used to compute total tissue hemoglobin (HbT) and the absolute tissue hemoglobin index (THI), two indicators of blood volume in the region of microvasculature sensed by the probe.
According to Beer�’s law, the NIRS signal is limited to vessels that have a diameter less than 1 mm (arterioles, capillaries, and venules), but, as 75% of the blood in a skeletal muscle is venous, NIRS StO2 measurements mostly represent local venous hemoglobin O2 saturation. This represents the aggregate of O2 saturations in the sampling volume and this technique is not suitable in conditions of heterogeneous blood ow. Indeed, even though StO2 is slightly lower in septic patients compared to healthy volunteers, there
Hemodynamic Monitoring in PICUSYMPOSIUM: MONITORING IN PEDIATRIC CRITICAL CARE

JOURNAL OF PEDIATRIC CRITICAL CAREVol. 1 - No.4 October - December 2014 290
is a huge overlap between the groups. StO2 also differs from ScvO2 saturation in sepsis.
The analysis of changes in StO2 during a brief episode of forearm ischemia enables quanti cation of microvascular dysfunction. This technique, which can easily be repeated, is particularly promising as it provides quantitative information on microvascular function within a few minutes. One should bear in mind that NIRS does not measure microcirculatory blood ow, making interpretation of the absolute StO2 value in terms of tissue oxygenation dif cult. As StO2 represents the balance between O2 delivery and O2 consumption, any change in StO2 can re ect a change in ow in the same direction and/or a change in metabolism in the opposite direction. More importantly, proportional changes in ow and metabolism may be associated with unchanged StO2.
Figure 23. Portable near infrared spectroscopy (NIRS) monitor in use. The probe is placed over the thenar eminence.
Figure 24. Schematic illustration of the StO2 changes during VOT.In addition, the vasoreactivity test evaluates a different aspect of microvascular function than ow: it evaluates microvascular reserve more than actual microvascular perfusion (23). NIRS-derived measurements are in uenced by adipose tissue thickness as well as the presence of edema; hence, in the majority of studies, the thenar eminence has been used because the thickness of skin and adipose tissue covering this muscle is less in uenced by any increase in uid content or body mass index (Figure 23&24). The in uence of temperature and vasoactive substances on NIRS-derived variables obtained in the thenar eminence need to be evaluated. Likewise, the relationship between peripheral and more central microvascular beds need to be further studied in critically ill patients. Finally, NIRS devices vary in
Table 9: Parameters for the evaluation and scoring of the microcirculation by SDF.Microcirculation parameter
Information provided Measurement
Microvascular ow index (MFI)
Perfusion quality (for small, medium, and large vessels)
The image is divided into four quadrants; a number is assigned for each quadrant according to the predominant type of ow (0 = no ow; 1 =intermittent; 2 = sluggish; 3 = continuous). The MFI results from the averaged values
De Backer score (n/mm)
Vessel density The image is divided by 3 vertical and 3 horizontal lines; the De Backer score is calculated as the number of vessels crossing the lines divided by the total length of the lines
Total vessel density (mm/mm2)
Vessel density (for small, medium, and large vessels)
Total length of vessels is divided by the total surface of the analyzed area
Perfused vessel density (mm/mm2)
Functional vessel density (for small, medium, and large vessels)
Total length of perfused vessels (sluggish or continuous) is divided by the total surface of the analyzed area
Proportion of perfused vessels (%)
Perfusion quality (for small, medium, and large vessels)
100 number of perfused vessels is divided by thetotal number of vessels
Flow heterogeneity index (FHI)
Perfusion heterogeneity The difference between the highest MFI and the lowest MFI is divided by the mean MFI. MFI is intended as the averaged MFI of each site
*Vessel diameter classi cation: <20 = small; 20�–50 = medium; 50�–100 = large. Three or ve sites are evaluated. MFI of small vessels can be calculated separately.
Hemodynamic Monitoring in PICUSYMPOSIUM: MONITORING IN PEDIATRIC CRITICAL CARE

JOURNAL OF PEDIATRIC CRITICAL CARE291Vol. 1 - No.4 October - December 2014
terms of wavelength and number of wavelengths, optode spacing, and algorithms. Accordingly, the data reported with the different devices may vary
somewhat and this absence of standardization may limit comparisons of results from different trials (Table 10).
Table 10. Summary of techniques used to evaluate the microcirculation at the bedsideVariable measured Main limitations
Techniques measuring microvascular perfusionLaser Doppler Flow (relative), hemoglobin content/
microvascular reactivity testGlobal ow to relatively large sampling volume (mixture of arterioles,capillaries, and venules)
Nailfold videomicroscopy Vascular density, heterogeneity, ow Restricted to ngers/sensitivity to temperature and vasoconstriction
OPS and SDF Vascular density, perfusionheterogeneity, ow
Mostly restricted to semiquantitative scoring/limited sites to investigate/movement and pressure artifacts
Techniques measuring tissue oxygenationSvO2 Adequacy of perfusion to ow Global measurementO2 electrodes Tissue PO2 Global measurement in sampled volume (mixture of
arterioles, capillaries, and venules)NIRS Tissue O2 saturation Global measurement in sampled volume (mixture of
arterioles, capillaries, and Venules)` Re ectance spectroscopy O2 saturation/microvascular reactivity test Global measurement in sampled volume (mixture
of arterioles, capillaries, and venules) unless SO2 histograms are provided
Gastric tonometry Tissue CO2 (re ects inadequate perfusion and/or anaerobic metabolism)
Interference (feeding/re ux)/dif cult discrimination between low ow and anaerobic metabolism
Sublingual capnometry Tissue CO2 (re ects inadequate perfusionand /or anaerobic metabolism)
Availability limited/dif cult discrimination between low ow and anaerobic metabolism
These devices have been used in clinical research to evaluate the microcirculation but have not yet found a de nite role in clinical practice.
References1. Raimer PL, Han YY, Weber MS, et al: A normal capillary
re ll time of 2 seconds is associated with superior vena cava oxygen saturation of > 70%. J Pediatr 2011; 158: 968-972
2. Ait-Oufella H, et al.: Mottling score predicts survival in septic shock. Intensive Care Med 2011, 37:801-807
3. Mignini MA, Piacentini E, Dubin A: Peripheral arterial blood pressure monitoring adequately tracks central arterial blood pressure in critically ill patients: An observational study. Crit Care 2006;10:R43.
4. Nguyen HB, Rivers EP, Knoblich BP, et al. Early lactate clearance is associated with improved outcome in severe sepsis and septic shock. Crit Care Med 2004;32:1637-42.
5. Spenceley N, Krahn G, Skippen PW, Kissoon N. Evaluation of a pediatric central venous oximetry catheter in critically ill children. Pediatr Crit Care Med. 2010;11(1):26 �–30
6. Rivers E, Nguyen B, Havstad S, et al. Early goal-directed therapy in the treatment of severe sepsis and septic shock. N Engl J Med. 2001; 345(19):1368-1377
7. de Oliveira CF, de Oliveira DS, Gottschald AF,et al. ACCM/PALS haemodynamic support guidelines for paediatric septic shock: an outcomes comparison with and without monitoring central venous oxygen saturation. Intensive Care Med. 2008; 34(6):1065�–1075
8. Cavallaro F, Sandroni C, Antonelli M. Functional hemodynamic monitoring and dynamic indices of uid responsiveness. Minerva Anestesiol 2008;74:123�–35.
9. Magder SA, Georgiadis G, Cheong T. Respiratory variations in right atrial pressure predict response to uid challenge. J Crit Care 1992; 7:76-85.
10. Magder S, Erice F, Lagonidis D. Determinants of the �‘y�’ descent and its usefulness as a predictor of ventricular lling. J Intensive Care Med 2000; 15:262-269.
11. Ducas J,Magder SA, McGregor M. Validity of the hepato-jugular re ux as a clinical test for congestive heart failure. Am J Cardiol 1983; 52:1299-1304.
12. Michard F, Boussat S, Chemla D, et al. Relation between respiratory changes in arterial pulse pressure and uid responsiveness in septic patients with acute circulatory failure. Am J Respir Crit Care Med 2000;162:134-8.
13. Barbier C, Loubieres Y, Schmit C, et al. Respiratory changes in inferior vena cava diameter are helpful in predicting uid responsiveness in ventilated septic patients. Intensive Care Med 2004;30:1740-6.
Hemodynamic Monitoring in PICUSYMPOSIUM: MONITORING IN PEDIATRIC CRITICAL CARE
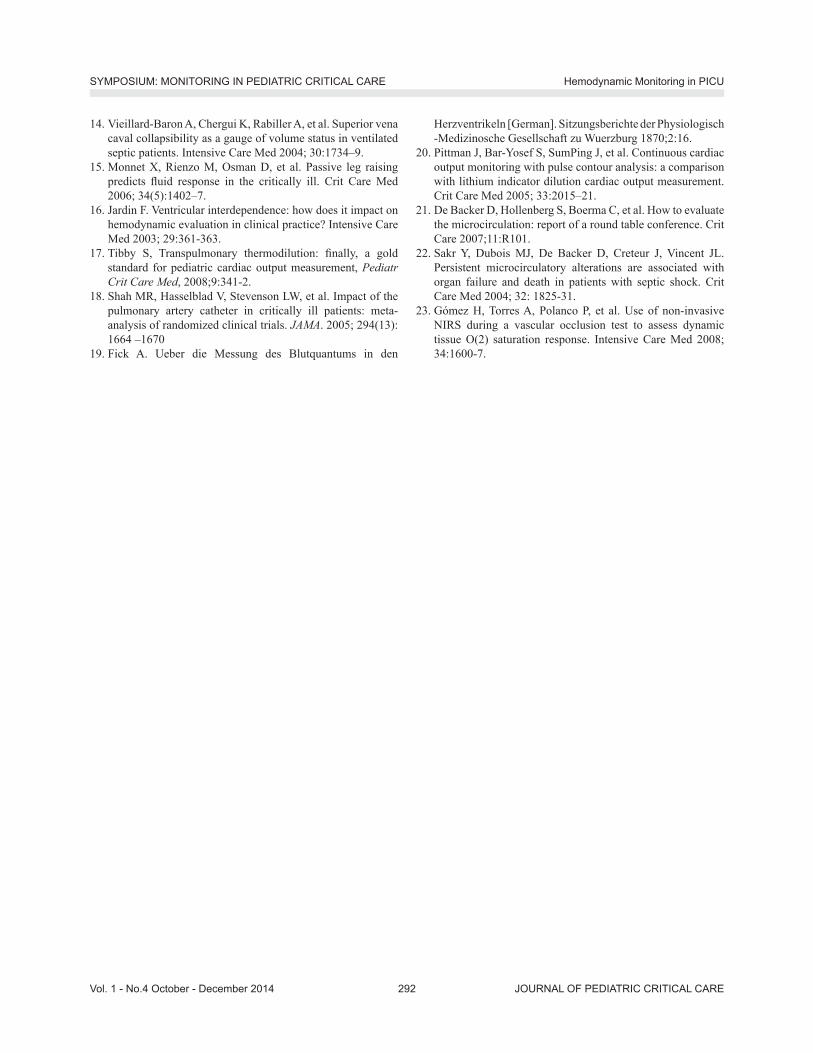
JOURNAL OF PEDIATRIC CRITICAL CAREVol. 1 - No.4 October - December 2014 292
14. Vieillard-Baron A, Chergui K, Rabiller A, et al. Superior vena caval collapsibility as a gauge of volume status in ventilated septic patients. Intensive Care Med 2004; 30:1734�–9.
15. Monnet X, Rienzo M, Osman D, et al. Passive leg raising predicts uid response in the critically ill. Crit Care Med 2006; 34(5):1402�–7.
16. Jardin F. Ventricular interdependence: how does it impact on hemodynamic evaluation in clinical practice? Intensive Care Med 2003; 29:361-363.
17. Tibby S, Transpulmonary thermodilution: nally, a gold standard for pediatric cardiac output measurement, Pediatr Crit Care Med, 2008;9:341-2.
18. Shah MR, Hasselblad V, Stevenson LW, et al. Impact of the pulmonary artery catheter in critically ill patients: meta-analysis of randomized clinical trials. JAMA. 2005; 294(13): 1664 �–1670
19. Fick A. Ueber die Messung des Blutquantums in den
Herzventrikeln [German]. Sitzungsberichte der Physiologisch -Medizinosche Gesellschaft zu Wuerzburg 1870;2:16.
20. Pittman J, Bar-Yosef S, SumPing J, et al. Continuous cardiac output monitoring with pulse contour analysis: a comparison with lithium indicator dilution cardiac output measurement. Crit Care Med 2005; 33:2015�–21.
21. De Backer D, Hollenberg S, Boerma C, et al. How to evaluate the microcirculation: report of a round table conference. Crit Care 2007;11:R101.
22. Sakr Y, Dubois MJ, De Backer D, Creteur J, Vincent JL. Persistent microcirculatory alterations are associated with organ failure and death in patients with septic shock. Crit Care Med 2004; 32: 1825-31.
23. Gómez H, Torres A, Polanco P, et al. Use of non-invasive NIRS during a vascular occlusion test to assess dynamic tissue O(2) saturation response. Intensive Care Med 2008; 34:1600-7.
Hemodynamic Monitoring in PICUSYMPOSIUM: MONITORING IN PEDIATRIC CRITICAL CARE

JOURNAL OF PEDIATRIC CRITICAL CARE293Vol. 1 - No.4 October - December 2014
Intracranial Pressure and its Monitoring: A reviewSuresh Panda, Rakshay Shetty
Rainbow Childrens Hospital, Hyderabad
Evidence suggests that the mortality and morbidity of acquired brain injury could be reduced if clinicians used an aggressive intracranial pressure guided approach to care. Despite nearly 50 years of evidence that intracranial pressure monitoring bene ts patient care, only about half of the patients who could bene t are monitored. Some clinicians express concerns regarding risks such as bleeding, infections, and inaccuracy of the technology. Others cite cost as the reason. This article discusses the risks and bene ts of intracranial pressure monitoring and the current state of evidence of why patients should be monitored. Keywords: intracranial pressure, cerebral perfusion pressure, monitoring devices, drift, infections, hemorrhage
BackgroundElevated intracranial pressure (ICP) is seen in head trauma, hydrocephalus, intracranial tumors, metabolic encephalopathy, intracranial bleeds and CNS infections. Increased ICP is an important cause of secondary brain injury, and its degree and duration is associated with outcome after TBI.1,2
Intractable intracranial hypertension can lead to death or devastating neurological damage either by reducing cerebral perfusion pressure (CPP)and causing cerebral ischemia or by compressing and causing herniation of the brainstem or other vital structures. Prompt recognition is crucial in order to intervene appropriately. The association between the severity of intracranial hypertension and poor outcome after severe head injury is well recognized. Outcomes tend to be good in patients with normal ICP, whereas those with elevated ICP are much more likely to have an unfavorable outcome. Elevated ICP carries a mortality rate of around 20%.The rapid recognition of elevated ICP is therefore of obvious and paramount importance so that it can be
monitored and so that therapies directed at lowering ICP can be initiated. Continuous ICP monitoring is important both for assessing the ef cacy of therapeutic measures and for evaluating the evolution of brain injury.Although some investigators have questioned invasive ICP monitoring in improving patient outcomes, numerous retrospective have favored the use of this technique.The goal of ICP monitoring is to ensure maintenance of optimal CPP. The ICP also forms a basis for medical or surgical intervention in cases of increased ICP in cases of intractable ICP elevation that do not respond to conservative management. ICP monitoring may be discontinued when the ICP remains in the normal range within 48-72 hours of withdrawal of ICP therapy or if the patient�’s neurological condition improves to the point where he or she is following commands.
PathophysiologyPhysiology of ICP was described by Professors Munroe and Kellie in the 1820s. In essence, they noted that, in adults, the brain is enclosed in a rigid case of bone and that the volume of its contents must remain constant if ICP is to remain constant. The intracranial compartment consists of brain approximately 83%, cerebrospinal uid (CSF) approximately 11%, and blood approximately 6%. Under normal conditions there are two main components of ICP namely CSF and vasogenic.3 The former is derived from the circulation of CSF and is responsible for baseline ICP. It may be deranged in pathologic states, causing an increase in ICP, because of resistance to CSF ow between intracerebral compartments secondary to brain swelling or expansion of intracranial mass lesions, or because CSF out ow is obstructed.
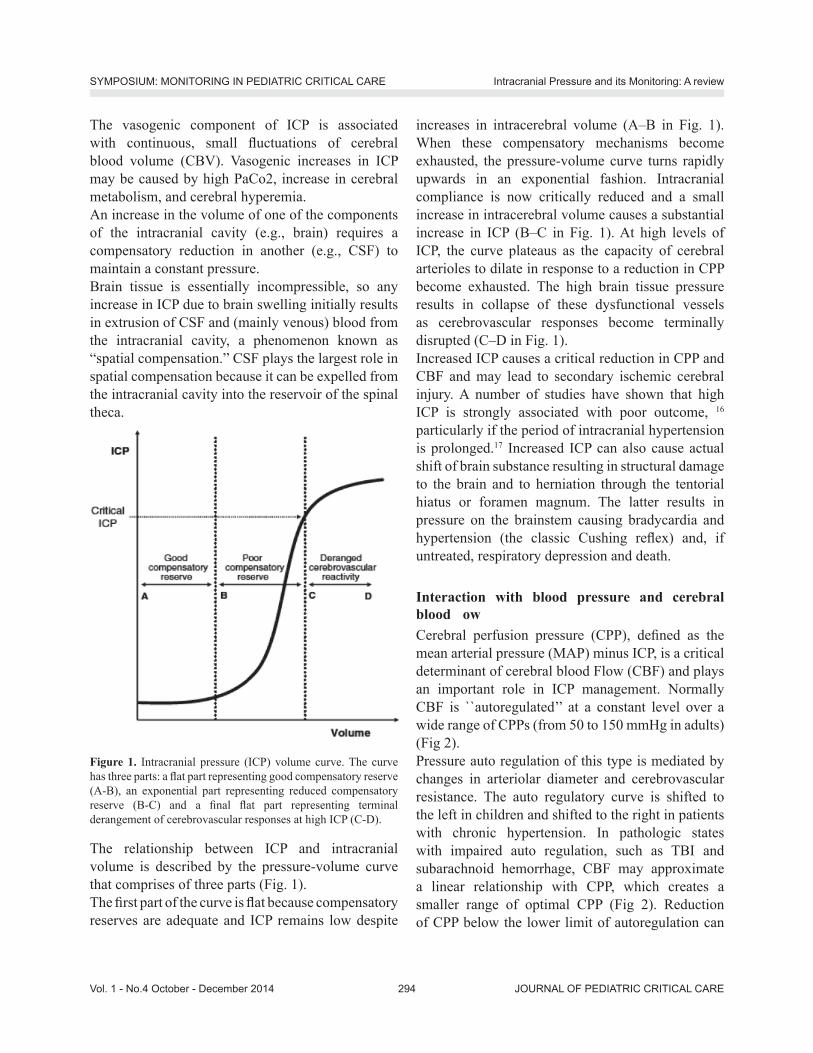
JOURNAL OF PEDIATRIC CRITICAL CAREVol. 1 - No.4 October - December 2014 294
The vasogenic component of ICP is associated with continuous, small uctuations of cerebral blood volume (CBV). Vasogenic increases in ICP may be caused by high PaCo2, increase in cerebral metabolism, and cerebral hyperemia.An increase in the volume of one of the components of the intracranial cavity (e.g., brain) requires a compensatory reduction in another (e.g., CSF) to maintain a constant pressure. Brain tissue is essentially incompressible, so any increase in ICP due to brain swelling initially results in extrusion of CSF and (mainly venous) blood from the intracranial cavity, a phenomenon known as �“spatial compensation.�” CSF plays the largest role in spatial compensation because it can be expelled from the intracranial cavity into the reservoir of the spinal theca.
Figure 1. Intracranial pressure (ICP) volume curve. The curve has three parts: a at part representing good compensatory reserve (A-B), an exponential part representing reduced compensatory reserve (B-C) and a nal at part representing terminal derangement of cerebrovascular responses at high ICP (C-D).
The relationship between ICP and intracranial volume is described by the pressure-volume curve that comprises of three parts (Fig. 1). The rst part of the curve is at because compensatory reserves are adequate and ICP remains low despite
increases in intracerebral volume (A�–B in Fig. 1). When these compensatory mechanisms become exhausted, the pressure-volume curve turns rapidly upwards in an exponential fashion. Intracranial compliance is now critically reduced and a small increase in intracerebral volume causes a substantial increase in ICP (B�–C in Fig. 1). At high levels of ICP, the curve plateaus as the capacity of cerebral arterioles to dilate in response to a reduction in CPP become exhausted. The high brain tissue pressure results in collapse of these dysfunctional vessels as cerebrovascular responses become terminally disrupted (C�–D in Fig. 1).Increased ICP causes a critical reduction in CPP and CBF and may lead to secondary ischemic cerebral injury. A number of studies have shown that high ICP is strongly associated with poor outcome, 16 particularly if the period of intracranial hypertension is prolonged.17 Increased ICP can also cause actual shift of brain substance resulting in structural damage to the brain and to herniation through the tentorial hiatus or foramen magnum. The latter results in pressure on the brainstem causing bradycardia and hypertension (the classic Cushing re ex) and, if untreated, respiratory depression and death.
Interaction with blood pressure and cerebral blood owCerebral perfusion pressure (CPP), de ned as the mean arterial pressure (MAP) minus ICP, is a critical determinant of cerebral blood Flow (CBF) and plays an important role in ICP management. Normally CBF is ``autoregulated�’�’ at a constant level over a wide range of CPPs (from 50 to 150 mmHg in adults) (Fig 2).Pressure auto regulation of this type is mediated by changes in arteriolar diameter and cerebrovascular resistance. The auto regulatory curve is shifted to the left in children and shifted to the right in patients with chronic hypertension. In pathologic states with impaired auto regulation, such as TBI and subarachnoid hemorrhage, CBF may approximate a linear relationship with CPP, which creates a smaller range of optimal CPP (Fig 2). Reduction of CPP below the lower limit of autoregulation can
Intracranial Pressure and its Monitoring: A reviewSYMPOSIUM: MONITORING IN PEDIATRIC CRITICAL CARE

JOURNAL OF PEDIATRIC CRITICAL CARE295Vol. 1 - No.4 October - December 2014
lead to ischemia2, whereas CPP elevation above the upper limit of autoregulation can be associated with hyperemia, exacerbation of vasogenic edema, and increased ICP3. Although the optimal CPP for any particular patient may vary, as a rule of thumb CPP should be maintained above 70 mmHg to avert ischemia and below 110 mmHg to avoid breakthrough hyperperfusion in adults.CBF also depends upon Paco2 and Pao2 level. In general, the cerebral vessels are less responsive to changes in PaO2 than to those in PaCO2. Arteriolar diameter and CBF progressively increase as PaCO2 rises from 20 to 80 mmHg, whereas hypoxemia leads to vasodilatation and increased CBF only when PaO2 falls below 50 mmHg.
Fig 2: Cerebral autoregulation curve. In the normal relationship (solid line), with CBF held constant across a wide range of CPP (50±150 mmHg). In disease states (e.g., vasospasm, ischemia, intracranial mass lesion), cerebral blood ow may become pressure passive (dotted line).
Normal and Pathologic ICPTable 2: Normal intracranial pressure valuesAge group Normal range (mm Hg)Adults <10�–15Children 3�–7Term infants 1.5�–6
The de nition of intracranial hypertension depends on the speci c pathology and age, although ICP >15 mm Hg is generally considered to be abnormal. However,
treatment is instituted at different levels depending on the pathology. For example, ICP <15 mm Hg warrants treatment in a patient with hydrocephalus, 9 whereas after TBI, treatment is indicated when ICP exceeds 20 mm Hg.10 Thresholds vary in children and it has been recommended that treatment should be initiated during TBI management when ICP exceeds 15 mm Hg in infants, 18 mm Hg in children upto 8-yr-of-age and 20 mm Hg in older children and teenagers.11
ICP is not evenly distributed in pathologic states because CSF does not circulate freely and intracranial CSF volume may be low because of brain swelling. The assumption of one, uniform, ICP is therefore questionable and intraparenchymal pressure may not be indicative of �“real�” ICP, i.e., ventricular CSF pressure.12 In the injured brain, there may be intraparenchymal pressure gradients between the supra and infra-tentorial compartments13 and bilateral monitoring has revealed differential pressures across the midline in the presence of hematomas14 and also in the absence of space-occupying lesions.15
Causes of Raised Intracranial PressureTable 3Pathological process ExamplesLocalized mass lesions
Traumatic hematomas (extradural, subdural, intracerebral) neoplasm (glioma, meningioma, metastasis) Abscess Focal edema secondary to trauma, infarction, tumor
Disturbance of CSF circulation
Obstructive hydrocephalus, Communicating hydrocephalus
Obstruction to majorvenous sinuses
Depressed fractures overlying major venous sinuses Cerebral venous thrombosis
Diffuse brain edema or swelling
Encephalitis, meningitis, diffuse head injury, subarachnoid hemorrhage, Reye�’s syndrome, lead encephalopathy, water intoxication, near drowning
Idiopathic Benign intracranial hypertension
Methods of ICP MonitoringICP cannot be reliably estimated from any speci c clinical feature or computed tomography (CT) nding and must actually be measured.
Intracranial Pressure and its Monitoring: A reviewSYMPOSIUM: MONITORING IN PEDIATRIC CRITICAL CARE

JOURNAL OF PEDIATRIC CRITICAL CAREVol. 1 - No.4 October - December 2014 296
Figure 3: Intracranial pressure monitors ventriculostomy allows both ICP monitoring and therapeutic drainage of cerebrospinal uid (CSF). Subdural and intraparenchymal monitors cannot be used to drain CSF.
Different methods of monitoring ICP are depicted in gure 3. Intraventricular catheter and intraparenchymal micro transducer systems are the most common monitoring devices used in practice. Subarachnoid and epidural devices have much lower accuracy18,19 and are now rarely used. Measurement of lumbar CSF pressure does not provide a reliable estimate of ICP and may be dangerous in the presence of increased intracranial hypertension.20 Advantages and disadvantages of each monitoring method are summarized in Table 4.
Intraventricular CathetersThe �“gold standard�” technique for ICP monitoring is a catheter inserted into the lateral ventricle, usually via a small right frontal burr hole. This can be connected to a standard pressure transducer via a uid lled catheter. The reference point for the transducer is the foramen of Munroe, although, in practical terms, the external auditory meatus is often used. Ventricular catheters measure global ICP and have the additional advantages of allowing periodic external calibration, therapeutic drainage of CSF, and administration of drugs (e.g., antibiotics).20,21 However, placement of the catheter may be dif cult if there is ventricular effacement or displacement due to brain swelling or intracranial mass lesions. The use of intraventricular Catheters is complicated by infection in up to 11% of cases.22,23This is a serious complication resulting in signi cant morbidity and mortality. The risk of
infection increases after 5 days23 and this has been presumed to be related to retrograde colonization of the catheter. However, recent data suggest that CSF infection is also likely to be acquired during introduction of the catheter in a signi cant number of cases.24 Intraventricular catheters may become blocked, especially in the presence of subarachnoid blood or increased CSF protein.25 Although the patency of catheters can often be restored by gentle ushing, repeated attempts signi cantly increase the risk of infection.23 Regular microbiological analysis of CSF samples to permit early diagnosis of ventriculitis is recommended by some, whereas others believe that routine sampling may actually predispose to higher infection rates because of the repeated opening of the closed drainage system. The use of antibiotic-impregnated catheters is associated with a lower infection rate, 26 although catheters coated with hydrogel to impede bacterial adherence are not associated with reduced infection rates.27
Intraparenchymal Pressure TransducersThe pressure transducer in these disposable devices is incorporated into the tip of a thin ber optic cable (the Camino device) or within a strain-gauge micro sensor at the tip of a exible catheter (the Codman device). These catheters can be placed into either the brain parenchyma or the ventricle via a small burr hole and screw28,29. With intraparenchymal placement, the infection rate is exceedingly low (approximately 1%)30. When combined with a ventricular catheter, the system allows simultaneous CSF drainage and continuous ICP measurement.These devices only need to be calibrated once prior to insertion, and the accuracy of ICP measurements is generally superior to those provided by subarachnoid bolts or epidural transducers31. A new version of the Codman monitor also provides measurements of brain temperature. A third intraparenchymal monitor recently approved by U.S. Food and Drug Administration (FDA) (the Spielberg device) features a small air lled balloon at the tip of a exible catheter; it has the advantage of providing measurements of intracranial compliance (calculated as a pressure/volume index) as well as ICP32.
Intracranial Pressure and its Monitoring: A reviewSYMPOSIUM: MONITORING IN PEDIATRIC CRITICAL CARE

JOURNAL OF PEDIATRIC CRITICAL CARE297Vol. 1 - No.4 October - December 2014
Subarachnoid BoltsThis is another uid-coupled system which connects the intracranial space to an external transducer at the bedside via saline- lled tubing33. The subarachnoid bolt is actually a hollow screw that is inserted via a burr hole. The dura at the base of the bolt is perforated with a spinal needle, allowing the subarachnoid CSF to ll the bolt. Pressure tubing is then connected to establish communication with a pressure monitoring system. Although the infection risk is low, these devices are prone to error, including underestimation of ICP, screw displacement, and occlusion by debris34.
Epidural TransducersThese devices (the Gaeltec device) are inserted deep into the inner table of the skull and super cial to the dura35. In most of these devices, pressure is transduced by an optical sensor. They have a low infection rate (approximately 1%)29, but are prone to malfunction, displacement, and baseline drift that can exceed 5±10 mmHg after more than a few days of use. Much of the inaccuracy results from having the relatively inelastic dura between the sensor tip and the subarachnoid space.
Noninvasive ICP MonitoringAt present there is no noninvasive method that can provide accurate continuous online measurement of ICP. However, optic nerve sheath diameter (OPNSD)38,39 and transcranial Doppler (TCD) Ultrasonography are promising modalities. TCD measures the velocity of blood ow in the basal cerebral arteries, shows characteristic changes with increasing ICP36. As CPP falls, diastolic velocity decreases and pulsatility increases, re ecting increased distal vascular resistance to ow.Though this nding is speci c for severe intracranial hypertension, TCD is not sensitive to mild to moderate ICP elevations. Lateralized asymmetries in TCD pulsatility correlate with lesion volume in intracerebral hemorrhage, and are believed to re ect compartmentalized ICP gradients37.
IndicationThe most common use of continuous ICP monitoring
is in the management of severe closed head injury. Bullock and colleagues reviewed the published evidence base for the indications for ICP monitoring. They concluded that there were insuf cient data to support standard treatment guidelines (no class I evidence). There was, however suf cient class II and III evidence to support the following indications summarized in Table 5.
Table 5: Indications of ICP MonitoringSevere head injuryIntracerebral hemorrhageSubarachnoid hemorrhageHydrocephalusStrokeCentral nervous system infectionsHepatic encephalopathy
ContraindicationNo absolute contraindications. However, caution should be exercised in following conditions�• Coagulation defects�• Anticoagulant therapy�• Scalp infection
Complications�• Intracranial infection�• Intracerebral hemorrhage�• Air leakage into the ventricle or subarachnoid
space�• CSF leakage�• Over drainage of CSF leading to ventricular
collapse and herniation�• Loss of monitoring or drainage capabilities due
to the occlusion of the catheter with brain tissue or blood
�• Inappropriate therapy because of erroneous ICP readings due to dampened waveforms, electromechanical failure, or operator error (i.e. inappropriate leveling)
Analysis of ICP Wave FormFour major waveforms are of clinical importance: normal, A, B, and C.
Intracranial Pressure and its Monitoring: A reviewSYMPOSIUM: MONITORING IN PEDIATRIC CRITICAL CARE

JOURNAL OF PEDIATRIC CRITICAL CAREVol. 1 - No.4 October - December 2014 298
Normal: Normal ICP waves have a steep upward systolic slope followed by a downward diastolic slope with a dicrotic notch. In most cases, this waveform occurs continuously and indicates that the ICP is between 0 and 15 mm Hg.
“A” waves or “plateau” wavesThese are steep increases in ICP from baseline to peaks of 50�–80 mm Hg that persist for 5�–20 min. These waves are always pathologic and may be associated with early signs of brain herniation, such as bradycardia and hypertension. They occur in patients with intact autoregulation and reduced intracranial compliance and represent re ex, phasic vasodilatation in response to reduced cerebral perfusion.40,41 The development of plateau waves leads to a vicious cycle, with reductions in CPP predisposing to the development of more plateau waves, further reductions in CPP and irreversible cerebral ischemia.
“B” wavesThese are rhythmic oscillations occurring at 0.5�–2 waves/min with peak ICP increasing to around 20�–30 mm Hg above baseline. They are related to changes in vascular tone, probably due to vasomotor instability when CPP is at the lower limit of pressure autoregulation.
“C” wavesThese are oscillations occurring with a frequency of 4�–8/min and are of much smaller amplitude than B waves, peaking at 20 mm Hg. They occur synchronously with ABP, re ect changes in systemic vasomotor tone, and are of no pathologic signi cance.
FIG 4: Pathologic ICP elevations. (A) Lundberg A (plateau)
waves. (B) Lundberg B waves. (Reprinted from Mayer SA. Management of increased intracranial pressure. In: Wijdicks EFM, Diringer MN, Bolton CF, et al. Continuum: Critical Care. Minneapolis, MN: American Academy of Neurology, 1997:47±61.)
Why Monitor ICP? Four lines of evidence support the use of ICP monitoring in children with severe TBI.1. Frequently reported high incidence of intracranial
hypertension.2. A widely reported association of intracranial
hypertension and poor neurological outcome.3. Concordance of protocol driven intracranial
hypertension and best reported clinical outcome.4. Improved outcome associated with successful ICP
�–lowering therapiesThere is a large body of evidence to indicate that ICP monitoring is of bene t to the patient by the following ways:
1. Early detection of developing pathologyPatients at high risk of developing raised ICP usually are drowsy or sedated and ventilated, and the rst clinical indication of an increase of edema or a hematoma might be signs of herniation. By alerting the medical team prior to this deterioration, monitoring enables early intervention and improved outcome. Intervention when a small rise in IC occurs has also been shown to prevent later profound intracranial hypertension43. A management protocol based solely on repeated CT scans is economically not feasible for most of our patients, and has been shown to be less accurate than actual monitoring44. There is also evidence that time-bound repetition of CT scans does not contribute to patient management45. In addition to the lack of bene t, transporting a critically ill patient for investigation increases the risk for the patient and imposes a logistical strain on the ICU. ICP monitoring can indicate the need for a repeat imaging and avoid routine protocol-based investigation. ICP monitoring should never be at the expense of clinical examination.
2. Limit avoidable therapyEmpirical therapy for presumed raised intracranial
Intracranial Pressure and its Monitoring: A reviewSYMPOSIUM: MONITORING IN PEDIATRIC CRITICAL CARE

JOURNAL OF PEDIATRIC CRITICAL CARE299Vol. 1 - No.4 October - December 2014
pressure runs the risk of in icting unnecessary iatrogenic complications on patients who either had only mild or no intracranial hypertension. These include unnecessary prolongation of ventilation, brain ischemia induced by hyperventilation, uid-electrolyte imbalance induced by mannitol and diuretics and even at times unnecessary surgery.
3. Cerebral perfusion pressureThe CPP can be calculated only if the ICP is measured. The importance of maintaining an adequate CPP has been discussed earlier in this review.
4. Safety factorICP monitoring can help in revealing shortcomings in other treatment modalities like head positioning, adequacy of sedation, analgesia or paralysis, and even draws attention to other abnormalities such as hyponatremia. Most raised ICP alarms are in fact due to one of these causes, and therefore the monitoring provides an additional layer of safety for the patient.
5. Decision on surgeryThe decision to operate on the brain when the clinical and radiological features are ambiguous is extremely dif cult. Knowledge of the ICP can help in decision-making regarding surgery in these cases. ICP monitoring also provides essential information for the timing of decompressive craniectomies in stroke,46 subarachnoid hemorrhage and severe head injury.47
6. CSF drainageThe use of an intraventricular catheter to monitor ICP also provides the option of venting CSF, which directly lowers the pressure without any of the systemic effects associated with all other means of ICP control.
7. PrognosticationRefractory raised pressure intuitively indicates a bad prognosis which has been demonstrated in all studies from the 1970s to the present43,48,49. There is also data to show that even transient, controllable rises in ICP
indicate a worse prognosis in head injury46.
Opinions against ICP monitoring The arguments against ICP monitoring are generally negative and much fewer than those of proponents of monitoring.
1. Lack of evidenceThere has not been a randomized controlled trial on the ef cacy of ICP monitoring in improving outcome, and there most likely will never be one because the utility of monitoring is so widely accepted that a trial where ICP is not monitored for a group of patients is considered unethical. Even if a trial were to be attempted, the sample size required to prove the bene t would be over 750 patients42, which would be logistically and nancially extremely dif cult.
2. Outcome without monitoringRecent Trial on Intracranial Pressure Monitoring in Traumatic Brain Injury by Randall M, Chesnut et al showed no signi cant between-group difference in the primary outcome, a composite measure based on percentile performance across 21 measures of functional and cognitive status (score, 56 in the pressure-monitoring group vs. 53 in the imaging�–clinical examination group; P = 0.49). Six-month mortality was 39% in the Pressure-monitoring group and 41% in the imaging�–clinical examination group (P = 0.60). The median length of stay in the ICU was similar in the two groups (12 days in the pressure-monitoring group and 9 days in the imaging�–clinical examination group; P = 0.25), although the number of days of brain-speci c treatments (e.g., administration of hyperosmolar uids and the use of hyperventilation) in the ICU was higher in the imaging�–clinical examination group than in the pressure-monitoring group (4.8 vs. 3.4, P = 0.002). The distribution of serious adverse events was similar in the two groups.
3. Clinical deteriorationTemporal lobe hematomas and swelling can theoretically cause uncal herniation and brainstem
Intracranial Pressure and its Monitoring: A reviewSYMPOSIUM: MONITORING IN PEDIATRIC CRITICAL CARE

JOURNAL OF PEDIATRIC CRITICAL CAREVol. 1 - No.4 October - December 2014 300
compression without raising the ICP to alarm threshold values �– there is a report of herniation taking place at an ICP of 18 mmHg.
4. Choice of patients to monitorThe debate on which patients will bene t from ICP monitoring is nowhere near settled, the closest approach to agreement being with regard to trauma. There is not suf cient data on other disease conditions for the establishment of guidelines.
ConclusionICP monitoring is safe, has relatively low complications rates, and has been shown to improve patient outcomes by giving the clinician a tool to evaluate both the patient and the effectiveness of treatment. Proper training for the clinician who is inserting the device, whether neurosurgeon or non-neurosurgeon, will minimize complication and facilitate accurate information being obtained. It is important to remember the strengths and limitations of each system when choosing the placement of the monitor (intraparenchymal, intraventricular, or surface monitor), the technology ( uid- lled versus advanced technology), and as well as cost. With proper education of all staff regarding the care, management, and troubleshooting of ICP, monitoring ICP will enhance the care we give our brain-injured patients.
References1. Marmarou A, Anderson RL, Ward JD, Choi SC, Young HF,
Eisenberg HM, Foulkes MA, Marshall LF, Jane JA. Impact of ICPinstability and hypotension on outcome in patients with severe head trauma. J Neurosurg 1991; 75: S59-66
2. Marmarou A. Increased intracranial pressure in head injury andin uence of blood volume. J Neurotrauma 1992; 9: S327-32
3. Czosnyka M. Association between arterial and intracranialpressures. Br J Neurosurg 2000; 14:127-8
4. Marmarou A, Fatouros PP, Barzo P, Portella G, Yoshihara M,Tsuji O, Yamamoto T, Laine F, Signoretti S, Ward JD, BullockMR, Young HF. Contribution of edema and cerebral blood volume to traumatic brain swelling in head-injured patients. JNeurosurg 2000;93:183-93
5. Unterberg AW, Stover J, Kress B, Kiening KL. Edema and braintrauma. Neuroscience 2004;129:1021�–96. Marmarou A. Pathophysiology of traumatic brain edema: currentconcepts.
ActaNeurochirSuppl 2003;86:7�–107. Marmarou A, Signoretti S, Aygok G, Fatouros P, PortellaG.
Traumatic brain edema in diffuse and focal injury: cellular orvasogenic? ActaNeurochirSuppl 2006;96:24�–9
8. Albeck MJ, Skak C, Nielsen PR, Olsen KS, Borgesen SE, GjerrisF. Age dependency of resistance to cerebrospinal uid out ow.JNeurosurg 1998;89:275�–8
9. Czosnyka M, Pickard JD. Monitoring and interpretation o ntracranial pressure. J NeurolNeurosurg Psychiatry 2004; 75:813-21
10. The Brain Trauma Foundation. The American Association ofNeurological Surgeons. The Joint Section on NeurotraumaandCritical Care. Intracranial pressure thresholds. J Neurotrauma 2007;24:S55�–8
11. Mazzola CA, Adelson PD. Critical care management of head trauma in children. Crit Care Med 2002;30:S393�–401
12. Wol a CE, Luerssen TG, Bowman RM. Regional brain tissue pressure gradients created by expanding extradural temporal mass lesion. J Neurosurg 1997;86:505�–10
13. Rosenwasser RH, KleinerLI, Krzeminski JP, Buchheit WA. Intracranial pressure monitoring in the posterior fossa: a preliminary report. J Neurosurg 1989;71:503�–5
14. Chambers IR, Kane PJ, Signorini DF, Jenkins A, MendelowAD.Bilateral ICP monitoring: its importance in detecting the severityof secondary insults. ActaNeurochirSuppl 1998;71:42�–3
15. Mindermann T, Gratzl O. Interhemispheric pressure gradientsin severe head trauma in humans. ActaNeurochirSuppl1998; 71:56-8
16. Balestreri M, Czosnyka M, Hutchinson P, Steiner LA, Hiler M, Smielewski P, Pickard JD. Impact of intracranial pressure and cerebral perfusion pressure on severe disability and mortality after head injury. Neurocrit Care 2006;4:8�–13
17. Saul TG, Ducker TB. Effect of intracranial pressure monitoring and aggressive treatment on mortality in severe head injury.J Neurosurg 1982; 56:498�–503
18. The Brain Trauma Foundation. The American Association of Neurological Surgeons. The Joint Section on Neurotrauma and Critical Care. Intracranial pressure monitoring technology.J Neurotrauma 2007; 24: S45�–54
19. Citerio G, Andrews PJ. Intracranial pressure. Part two: clinical applications and technology. Intensive Care Med 2004; 30:1882�–5
20. Steiner LA, Andrews PJ. Monitoring the injured brain: ICP and CBF. Br J Anaesth 2006;97:26�–38
21. Zhong J, Dujovny M, Park HK, Perez E, Perlin AR, Diaz FG. Advances in ICP monitoring techniques.Neurol Res 2003; 25:339-50
22. Lozier AP, Sciacca RR, Romagnoli MF, Connolly ES Jr. Ventriculostomy-related infections: a critical review of the literature.Neurosurgery 2002; 51:170�–81
23. Mayhall CG, Archer NH, Lamb VA, Spadora AC, Baggett JW,Ward JD, Narayan RK. Ventriculostomy-related infections.Aprospective epidemiologic study. N Engl J Med 1984; 310:553-9
24. Lo CH, Spelman D, Bailey M, Cooper DJ, Rosenfeld JV, BrecknellJE. External ventricular drain infections are
Intracranial Pressure and its Monitoring: A reviewSYMPOSIUM: MONITORING IN PEDIATRIC CRITICAL CARE

JOURNAL OF PEDIATRIC CRITICAL CARE301Vol. 1 - No.4 October - December 2014
independent ofdrain duration: an argument against elective revision. J Neurosurg 2007; 106: 378-83 246 Intracranial Pressure Monitoring ANESTHESIA &ANALGESIA
25. Birch AA, Eynon CA, Schley D. Erroneous intracranial pressure measurements from simultaneous pressure monitoring and ventricular drainage catheters. Neurocrit Care 2006; 5:51-4
26. Zabramski JM, Whiting D, Darouiche RO, Horner TG, Olson J, Robertson C, Hamilton AJ. Ef cacy of antimicrobialimpregnatedexternal ventricular drain catheters: a prospective,randomized, controlled trial. J Neurosurg 2003;98:725�–30
27. Kaufmann AM, Lye T, Redekop G, Brevner A, Hamilton M,Kozey M, Easton D. Infection rates in standard vs. hydrogelcoated ventricular catheters. Can J NeurolSci 2004; 31:506-10
28. Ostrup RC, Luerssen TG, Marshall LF, et al. Continuousmonitoring of intracranial pressure with a miniaturized beroptic device. J Neurosurg1987; 67:206±209
29. Gopinath SP, Robertson CS, Contant CF, et al. Clinical evaluationof a miniature strain-gauge transducer for monitoring intracranial pressure. Neurosurgery 1995; 36: 1137±1140
30. Levin A. The use of a beroptic intracranial pressure monitorin clinical practice. Neurosurgery 1977;1:266±271
31. Sundbarg G, Nordstrom CH, Messeter K, et al. A comparison of intraparenchymatous and intraventricular pressure recording in clinical practice. J Neurosurg1987; 67:841±845
32. Yau Y-H, Piper IR, Clutton RE, et al. Experimental evaluationof the Spielberger intracranial pressure and intracranialcompliance monitor. Technicalnote. J Neurosurg 2000; 93: 1072±1077
33. Vries JK, Becker DP, Yang HF.A subarachnoid screw formonitoring intracranial pressure. J Neurosurg 1973; 39: 416±419
34. Miller JD, Bobo H, Kapp JP. Inaccurate pressure readingsfrom subarachnoid bolts. Neurosurgery 1986;19:253±255
35. Ream AK, Silverberg GD, Corbin SD, et al. Epidural measurement of intracranial pressure. Neurosurgery 1979; 5: 36±43
36. Hassler W, Steinmetz H, Gawlowski J. Transcranial Dopplerultrasonography in raised intracranial pressure and in intracranial circulatory arrest. J Neurosurg 1988;68:745±751
37. Mayer SA, Thomas CE, Diamond BE. Asymmetry of intracranialhemodynamics as an indicator of mass effect in acuteintracerebral hemorrhage: a transcranial Doppler study. Stroke 1996;27:1788±1792
38. Schmidt B, KlingelhoÈfer J, Schwarze JJ, et al. Noninvasiveprediction of intracranial pressure curves using
transcranialDoppler ultrasonography and blood pressure curves. Stroke1997; 28: 2465±2472
39. Pranevicius O, Bertasius K, Pranevicius K, et al. Non-invasivedynamic assessment of the elasticity of intracranialstructures. ActaNeurol Scand 1992; 86:512 ±516
40. Czosnyka M, Smielewski P, Piechnik S, et al. Critical closingpressureincerebrovascularcirculation. J Neurol Neurosurg Psychiatry 1999; 66: 606±611
41. Lundberg N, Troupp H, Lorin H. Continuous recording of theventricular- uid pressure in patients with severe acute traumaticbrain injury. A preliminary report. J Neurosurg 1965; 22: 581�–90
42. The Brain Trauma Foundation. The American Association of Neurological Surgeons.The Joint Section on Neurotrauma and Critical Care.Indications for intracranial pressure monitoring. J Neurotrauma 2000; 17(6-7): 479-91
43. Narayan RK, Kishore PR, Becker DP, Ward JD, Enas GG, Greenberg RP, Domingues Da Silva A, Lipper MH, Choi SC, Mayhall CG, Lutz HA 3rd, Young HF. Intracranial pressure: to monitor or not to monitor? A review of our experience with severe head injury.J Neurosurg. 1982; 56(5):650-9.
44. Miller MT, Pasquale M, Kurek S, White J, Martin P, Bannon K, Wasser T, Li M. Initial head computed tomographic scan characteristics have a linear relationship with initial intracranial pressure after trauma. J Trauma. 2004; 56(5):967-72.
45. Kaups KL, Davis JW, Parks SN. Routinely repeated computed tomography after blunt head trauma: does it bene t patients? J Trauma. 2004; 56(3):475-80.
46. Cho DY, Chen TC, Lee HC. Ultra-early decompressivecraniectomy for malignant middle cerebral artery infarction.Surg Neurol. 2003; 60(3):227-32.
47. Strege RJ, Lang EW, Stark AM, Scheffner H, Fritsch MJ, Barth H, Mehdorn HM. Cerebral edema leading to decompressivecraniectomy: an assessment of the preceding clinical and neuromonitoring trends. Neurol Res. 2003; 25(5):510-5.
48. Becker DP, Miller JD, Ward JD, Greenberg RP, Young HF, Sakalas R. The outcome from severe head injury with early diagnosis and intensive management.J Neurosurg. 1977; 47(4):491-502.
49. Heuer GG, Smith MJ, Elliott JP, Winn HR, LeRoux PD. Relationship between intracranial pressure and other clinical variables in patients with aneurysmal subarachnoid hemorrhage. J Neurosurg. 2004; 101(3):408-16.
50. Stuart GG, Merry GS, Smith JA, Yelland JD. Severe head injury managed without intracranial pressure monitoring. J Neurosurg. 1983; 59(4): 601-5.
Intracranial Pressure and its Monitoring: A reviewSYMPOSIUM: MONITORING IN PEDIATRIC CRITICAL CARE

JOURNAL OF PEDIATRIC CRITICAL CAREVol. 1 - No.4 October - December 2014 302
GuidelinesPediatric Brain Death Guidelines
Pediatric Braindeath Guidelines Group 2011
IntroductionThe diagnosis of Brain Death in children is generally regarded as being more dif cult than in adults and there is considerable variation in the exact protocol followed in different countries, and even between different states in the same country. Nevertheless, the diagnostic procedure is essentially by clinical examination.The following guidelines are based on multiple sources, including the American Academy of Pediatrics Guidelines for the determination of brain death in children1,4, the American Academy of Neurology evidence based guideline update 20102, the Australian and New Zealand Intensive Care Society statement on death and organ donation, 20083 and the general consensus of the Guidelines committee of experts from India listed at the end of this article (Guidelines group was chaired and coordinated by Dr Balaramachandran in year 2011 and this consensus was compiled by him on behalf of the Guidelines group).
De nitionBrain death is de ned as irreversible cessation of all functions of the entire brain, including the brain stem
Pre-requisitesThe following conditions must be met before brain death can be determined:1. There must be a recognized cause of coma
suf cient to explain the irreversible cessation of all brain function. Both coma and apnea must coexist to declare brain death.
2. Potentially reversible causes of coma must be excluded
a. Hypothermia �– core body temperature must be > 35o C, since severely hypothermic patients may appear brain dead
b. Uncontrolled hypotension �– the blood pressure must be normal for age (systolic BP not < 2 SD below norm for age)
c. Sedatives and other CNS depressant drugs / toxins �– suf cient time must be allowed for any CNS depressant agents to be metabolized. If this cannot be assured, a drug level may be obtained, if possible, to show that the drug in question does not exceed the normal therapeutic levels.
d. If neuromuscular blocking agents have been administered, a peripheral nerve stimulator should be used to show that there is no residual neuromuscular blockade
e. Severe metabolic derangements must be excluded, including markedly abnormal plasma concentrations of glucose, sodium, potassium, phosphate, magnesium, calcium
f. Any other sign that suggests a potentially reversible cause of coma
3. Neurological assessment may be unreliable immediately following cardiopulmonary resuscitation or acute brain injury �– brain death evaluation should be deferred by 24 hours in these circumstances.
Clinical ExaminationThe diagnosis of brain death is essentially clinical. There must be absence of higher brain function �– lack of consciousnessThere must be absence of brain stem functions
NOTEObservations that are compatible with brain death�• The following observations can be present in
brain death
Correspondence:Dr. Bala RamachandranPICU, Kanchi Kamakoti CHILDS Trust Hospital12A Nageswara Road, Nungambakkam, Chennai - 600 034email:[email protected]

JOURNAL OF PEDIATRIC CRITICAL CARE303Vol. 1 - No.4 October - December 2014
�• Spinal re exes in response to stimulation�• These may include movements of the upper limbs,
deep tendon re exes, plantar re exes, respiratory like movements and head turning
�• Sweating, blushing or tachycardia�• Normal blood pressure without pharmacological
support�• Absence of diabetes insipidus
Observations that are incompatible with brain deathThe following observations are incompatible with brain death:�• Decerebrate or decorticate posturing�• True extensor or exor responses to painful
stimuli�• Seizures
Number of tests and who should perform themTwo examinations (including two apnea tests) should be performed, separated by an interval. A different Consultant Physician who is taking care of the child should perform each clinical examination. These physicians should have speci c expertise and experience in performing such assessment and can include Pediatric Intensivists, Neurologists, Anesthetists, Neurosurgeons or Pediatricians. The same individual may perform the apnea tests. In case the testing is being performed for the purposes of organ harvesting, additional requirements from the individual State Governments may apply (such as pre-registration and authorization of the physician performing the tests).
Demonstration of apneaThe role of the apnea test has been questioned recently5. Nevertheless, it continues to be a part of
Clinical testing Test procedure and response CommentsComa Apply noxious stimuli in the cranial nerve distribution
and all four limbs and trunk. There should be no motor response
See note below
Pupillary light re ex-cranial nerves II & III
Shine a bright light into each eye and look for pupillary constriction. There should be no pupillary constriction
Pupils must be 4 mm in diameter. A magnifying glass may be used, if required. Use of anti-cholinergic drugs, such as Atropine, can cause pupillary dilatation
Corneal re ex �– cranial nerves V & VII
Touch the corneas with soft cotton wool. There should be no blinking or withdrawal re ex
Touch only the lateral aspect of the cornea to avoid damage
Absence of movement of the bulbar musculature �– cranial nerves V & VII
Apply deep pressure over the condyles at the temporo-mandibular joints and over the supra-orbital ridges. There should be no grimacing or facial muscle movement
Oculo-vestibular re ex �– cranial nerves III, IV, VI & VIII
Inspect the external auditory meatus with an otoscope to make sure that the ear drum is visible and intact �– if required, clean any cerumen before proceeding. Elevate head to 30o and place in the neutral position. Instill 20 �– 50 ml of iced water into the ear canal with a syringe. Hold both eyes open and observe for at least 1 minute. There should be no response �– both eyes should remain in the mid-position. Wait 5 minutes and repeat test in the other ear
Fracture of the skull base or petrous temporal may obliterate the response on the side of the fracture.
Gag re ex �– cranial nerves IX & X
Stimulate the posterior pharyngeal wall on both sides with a tongue depressor. There should be no gag response
May be dif cult to examine in orally intubated patients
Cough re ex - cranial nerve X
Stimulate the trachea with a suction catheter. There should be no cough
Flaccidity Evaluate all extremities by passive range of motion (unless contra-indicated). There should be accid tone and no spontaneous or induced movements
See note below
GUIDELINES Pediatric Brain Death Guidelines
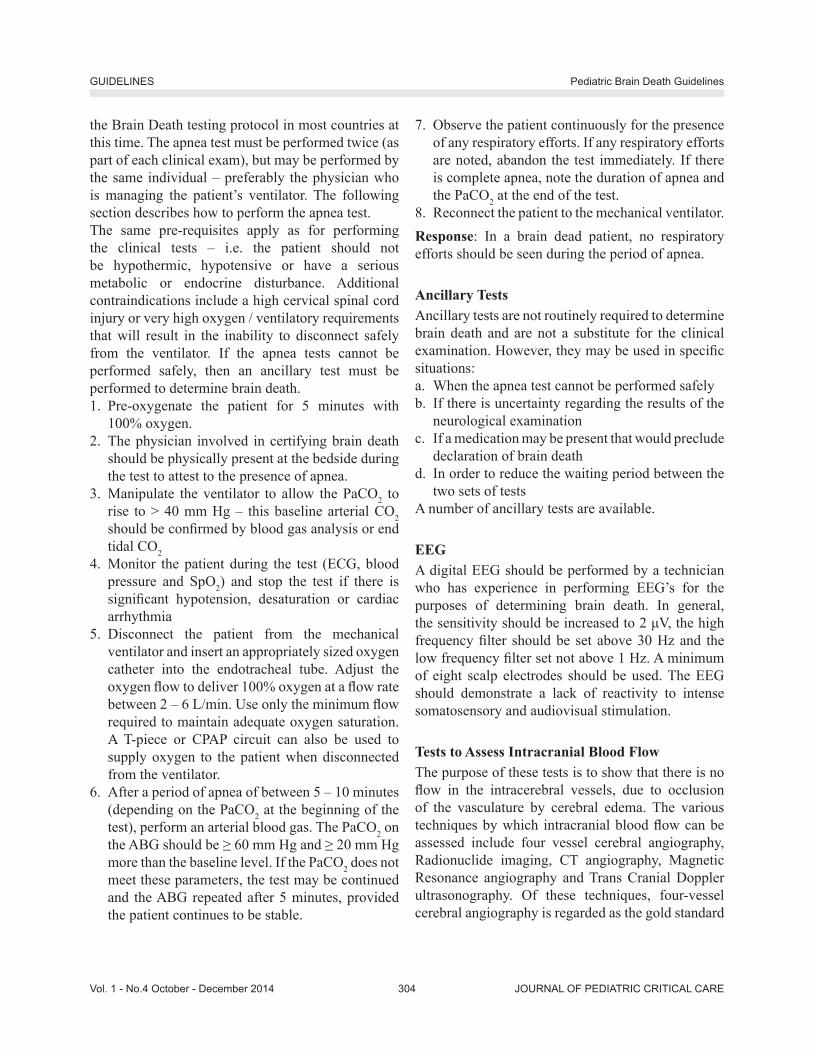
JOURNAL OF PEDIATRIC CRITICAL CAREVol. 1 - No.4 October - December 2014 304
the Brain Death testing protocol in most countries at this time. The apnea test must be performed twice (as part of each clinical exam), but may be performed by the same individual �– preferably the physician who is managing the patient�’s ventilator. The following section describes how to perform the apnea test. The same pre-requisites apply as for performing the clinical tests �– i.e. the patient should not be hypothermic, hypotensive or have a serious metabolic or endocrine disturbance. Additional contraindications include a high cervical spinal cord injury or very high oxygen / ventilatory requirements that will result in the inability to disconnect safely from the ventilator. If the apnea tests cannot be performed safely, then an ancillary test must be performed to determine brain death.1. Pre-oxygenate the patient for 5 minutes with
100% oxygen. 2. The physician involved in certifying brain death
should be physically present at the bedside during the test to attest to the presence of apnea.
3. Manipulate the ventilator to allow the PaCO2 to rise to > 40 mm Hg �– this baseline arterial CO2 should be con rmed by blood gas analysis or end tidal CO2
4. Monitor the patient during the test (ECG, blood pressure and SpO2) and stop the test if there is signi cant hypotension, desaturation or cardiac arrhythmia
5. Disconnect the patient from the mechanical ventilator and insert an appropriately sized oxygen catheter into the endotracheal tube. Adjust the oxygen ow to deliver 100% oxygen at a ow rate between 2 �– 6 L/min. Use only the minimum ow required to maintain adequate oxygen saturation. A T-piece or CPAP circuit can also be used to supply oxygen to the patient when disconnected from the ventilator.
6. After a period of apnea of between 5 �– 10 minutes (depending on the PaCO2 at the beginning of the test), perform an arterial blood gas. The PaCO2 on the ABG should be 60 mm Hg and 20 mm Hg more than the baseline level. If the PaCO2 does not meet these parameters, the test may be continued and the ABG repeated after 5 minutes, provided the patient continues to be stable.
7. Observe the patient continuously for the presence of any respiratory efforts. If any respiratory efforts are noted, abandon the test immediately. If there is complete apnea, note the duration of apnea and the PaCO2 at the end of the test.
8. Reconnect the patient to the mechanical ventilator.Response: In a brain dead patient, no respiratory efforts should be seen during the period of apnea.
Ancillary TestsAncillary tests are not routinely required to determine brain death and are not a substitute for the clinical examination. However, they may be used in speci c situations:a. When the apnea test cannot be performed safelyb. If there is uncertainty regarding the results of the
neurological examinationc. If a medication may be present that would preclude
declaration of brain deathd. In order to reduce the waiting period between the
two sets of testsA number of ancillary tests are available.
EEGA digital EEG should be performed by a technician who has experience in performing EEG�’s for the purposes of determining brain death. In general, the sensitivity should be increased to 2 V, the high frequency lter should be set above 30 Hz and the low frequency lter set not above 1 Hz. A minimum of eight scalp electrodes should be used. The EEG should demonstrate a lack of reactivity to intense somatosensory and audiovisual stimulation.
Tests to Assess Intracranial Blood FlowThe purpose of these tests is to show that there is no ow in the intracerebral vessels, due to occlusion of the vasculature by cerebral edema. The various techniques by which intracranial blood ow can be assessed include four vessel cerebral angiography, Radionuclide imaging, CT angiography, Magnetic Resonance angiography and Trans Cranial Doppler ultrasonography. Of these techniques, four-vessel cerebral angiography is regarded as the gold standard
GUIDELINES Pediatric Brain Death Guidelines

JOURNAL OF PEDIATRIC CRITICAL CARE305Vol. 1 - No.4 October - December 2014
and involves direct injection of contrast medium into both Carotid arteries and both Vertebral arteries.Of all the con rmatory tests mentioned above, EEG is the most easily available test. Radionuclide cerebral blood ow assessment is also acceptable �– the remainder are time consuming, not easily available, not always standardized, may require shifting an unstable patient and, in some cases, expensive. Any one of the following tests may be used (depending on availability) when an ancillary test is required:i. EEGii. Radionuclide cerebral blood ow assessmentiii. Four vessel cerebral angiography.
Time Course of Tests for Brain Death�• The clinical tests are performed twice, each time
by a different physician�• The apnea test is performed twice �– may be
performed by the same physician�• Death is declared when the second neurological
examination and apnea test con rm that the results of the rst tests are unchanged and the changes are irreversible
�• If an ancillary test performed after the rst clinical examination/apnea test is consistent with brain death, then the second clinical examination / apnea test can be performed at any time
Table 1 below gives the time gap between the clinical tests.
Age Clinical tests
Interval between
tests
Ancillary tests
Term new born (> 37 weeks gestational age to 30 days
As adult 24 hrs If required
31 days �– 18 years As adult 12 hrs If required
References1. American Academy of Pediatrics, Task Force on Brain Death
in Children. Report of Special Task Force: guidelines for determination of brain death in children. Pediatrics. 1987; 80(2): 298-300
2. Eelco F.M. Wijdicks, Panayiotis N. Varelas, Gary S. Gronseth, et al. Evidence-based guideline update: Determining brain death in adults : Report of the Quality Standards Subcommittee of the American Academy of Neurology. Neurology 2010;74;1911
3. Australian and New Zealand Intensive Care Society. The ANZICS Statement on Death and Organ Donation (3rd Edition). Melbourne: ANZICS, 2008
4. Nakagawa TA et al. Guidelines for the determination of brain death in infants and children: An update of the 1987 Task Force recommendations. Crit Care Med 2011; 39:2139-2155
5. Tibballs J. A critique of the apneic oxygenation test for the diagnosis of �“brain death�”. Ped Crit Care Med. 2010 Jul;11(4):475-8
Pediatric Braindeath Guidelines Group 2011Dr. Bala Ramachandran, Consultant and Head of the Department of Intensive Care & Emergency Medicine, Kanchi Kamakoti CHILDS Trust Hospital, Chennai Email: [email protected]
Dr. Krishan Chugh, Head of the Department of Paediatrics, Fortis Hospital, Gurgaon Email: [email protected]
Dr. Sunit Singhi, Head of the Department of Paediatrics, Post Graduate Institute for Medical Education and Research, Chandigarh Email: [email protected]
Dr. Praveen Khilnani, Consultant Pediatric Intensivist, BLK Superspeciality Hospital, New Delhi Email: [email protected]
Dr. V. Viswanathan, Consultant Pediatric Neurologist, Kanchi Kamakoti CHILDS Trust Hospital, Chennai Email: [email protected]
Dr. Joseph Mathew, Consultant Neurosurgeon, Christian Medical College, Vellore, TN Email: [email protected]
Dr. Soonu Udani, Consultant Pediatric Intensivist, Hinduja Hospital, Mumbai Email: [email protected]
GUIDELINES Pediatric Brain Death Guidelines

JOURNAL OF PEDIATRIC CRITICAL CAREVol. 1 - No.4 October - December 2014 306
NCPCC 2014 Abstracts (Oral)High-frequency Oscillatory Ventilation
(HFOV) for Acute Pediatric Respiratory Failure - A tertiary care centre experience of
62 casesSandeep Dhingra, Anil Sachdev, Dhiren Gupta
Sir Ganga Ram Hospital, Rajinder Nagar, New Delhi - 110 060
Background & Aims: The present article reports our experience with high-frequency oscillatory ventilation (HFOV) in pediatric patients with acute respiratory failure who deteriorated on conventional mechanical ventilation.
Methods: In this analysis of retrospective data, we analyzed the chart records of 62 consecutively ventilated pediatric patients with HFOV from October 2011 to August 2014 in our pediatric intensive care unit. The demographics, cause of respiratory failure, Pediatric Index of Mortality (PIM II) Score, oxygenation index, PaCO2, and complications if any, were recorded and calculated at various time points before and after the start of HFOV, along with patient outcome and cause of death.
Results: There were 39 male subjects while 23 were female. The median age of the subjects was 54 (1.5-192) months. All patients received conventional ventilation before HFOV. Mean oxygenation index (OI) at the start of HFOV was 28 and mean PCO2 was 67 mmHg with signi cant respiratory acidosis in all. After initiation of HFOV, there was an immediate and sustained improvement in ventilation with signi cant decrease in PCO2 (p
0.003) and improved oxygenation with increase in PaO2/FiO2 ratio in most subjects except 4. Oxygenation Index (OI) was decreased signi cantly after 6 hours of HFOV and maintained for at least 48 hours (p < 0.05) except in patients who developed complications (pneumothorax �– 5, hemodynamic compromise �– 3 & oxygenation failure �– 4). Overall survival rate was 33%. Mean PIM II risk of mortality was 63% with no mortality bene t with use of HFO in our series of patients.
Conclusions: HFOV rescue therapy was associated with a signi cant improvement in ventilatory & oxygenation parameters without any bene t on mortality. Future studies are necessary to evaluate whether the outcome of patients may be improved if HFOV is applied earlier in the course of disease.
Occurrence and Outcome of Acute Kidney Injury Amongst Patients Admitted in
Paediatric Intensive Care Unit (PICU)Urmila Jhamb, Jyoti
Professor Paediatrics, Maulana Azad Medical College and Associated Lok Nayak Hospital
Objective: To study the occurrence and progression of acute kidney injury (AKI) IN Children in paediatric intensive care unit (PICU). as de ned by pRIFLE criteria and to study its association with mortality and length of stay in PICU.Design: Prospective cohort study.
Setting: PICU, Maulana Azad Medical CollegePatients: The study included 250 patients, aged 1 month to 12 years, admitted to PICU, from May 2012 to Jan 2013.
Intervention: For all Patients pRIFLE stage was checked at admission, every 2nd day if normal and daily if any abnormality was found.
Main outcome measures: Patients were subsequently divided into AKI and no AKI groups, progression/improvement of various AKI stages was recorded and effect of AKI on mortality and Length of stay in PICU was analyzed.
Result: 34.4% of total patients developed AKI. 24.8% had an initial p-ri e Score of risk (R), 7.2% had injury (I) and 2.4% had failure (F). Out of children who had initial score of R, 14.5% progressed to I while 89% were detected with AKI within 7 days of PICU stay. Mortality in max pRIFLE score of R, I, F was 45.8%, 62.3%, 62.5% respectively, compared with 18.9% for patients without AKI. Children with AKI had a higher mean (1.64 times) length of stay in PICU than children with no AKI.
Conclusion: In our PICU population acute kidney, injury, as de ned by the pRIFLE class cation, is associated with increased mortality and length of stay.
Predictors of Extubation Success in Mechanically Ventilated Children in PICU
S Khurana, B Mehra, D Singh, P A Pooni, S Bhargava, R Nagpal
Dayanand Medical College and Hospital, Ludhiana, Punjab, India
Aim: To evaluate the signi cance of parameters affecting extubation in children.
Methods: Data was collected prospectively on all children between age group of one month to 17 year, admitted to pediatric ICU over a period of one year. Patients admitted with respiratory failure at admission or during hospitalization were included. Pre-extubation clinical, ventilator and laboratory parameters were evaluated. Their signi cance in relation to extubation success was determined by student�’s t test and chi-square test.
Results: A total of 53 patients underwent 62 extubation trials (n = extubation trials). Patients who were successfully extubated had signi cantly better nutritional status (weight > 3rd centile) and lower PRISM score (< 10). Most common etiology amongst patients who were being mechanically ventilated was primary pulmonary pathology. Extubation success was signi cantly higher in this group (p value-0.0039). Laboratory parameters (pre-extubation ABG, hematocrit, serum K+) were not found to be signi cantly associated with extubation success. Pre-extubation ventilator parameters-PEEP ( 3), DPIP (8-11), ventilator rates ( 25) and FiO2 ( 0.35) were found to be associated with signi cantly higher extubation success. Stridor, accidental extubation, VAP (ventilator associated pneumonia) and duration of mechanical ventilation (> 7 days) had statistically

JOURNAL OF PEDIATRIC CRITICAL CARE307Vol. 1 - No.4 October - December 2014
higher association with extubation failure.
Conclusions: This study demonstrates that close attention towards etiology, clinical assessment, PRISM Score, respiratory mechanics, duration of mechanical ventilation and ventilator related complications, may help predict extubation success. Thus improving patient care and nal outcome.
Impact of Multifaceted Quality Improvement Intervention on Device Related Infections in Pediatric Intensive Care Unit-A single centre
experienceRamachandran Rameshkumar, Anbazhagan Jagadeesh, Manju Kedarnath, Subramanian
Mahadevan, Parameshwaran Narayanan, Kelamangalam Neelakantakurup Harikrishnan,
Sujatha SistlaJawaharlal Institute of Postgraduate Medical Education &
Research (JIPMER), Puducherry, India 605 006.
Background and Aims: Health care associated infections (HAI) are a signi cant problem in PICU. Surveillance and prevention of HAI by multifaceted quality improvement intervention remains a part of standard of care.
Methods: Study was conducted in 19 bedded-PICU of a tertiary care referral academic institute. Data regarding VAP and CLABSI using CDC de nition was collected prospectively before (July-Dec2013) and after (Jan-June-2014) introduction of multifaceted quality improvement intervention consists of infection control nurse & physician and hand hygiene education module and wearing a gown & mask during the care of critically ill children. Institute scienti c advisory committee approved the study.
Results: Before intervention, incidence of VAP was 28.5 and CLABSI was 13.7 as compared to after intervention period, incidence of VAP was 13.3 per 1000 ventilation days and CLBSI was 8.3 per 1000 catheter days. Patients ventilated for > 48 hours who had VAP was signi cantly less after intervention as compared to before intervention [14.2% vs 25.2%; p = 0.012, OR, 95% CI 0.49, 0.28 �– 0.86]. Both the groups were similar with respect to age, sex ratio, severity (PRISM-III), device utilization rate and grade of infection. No signi cant difference in overall PICU mortality before and after intervention (28.2% vs 28.9%).
Conclusion: Multifaceted quality improvement intervention results in signi cant reduction of health care associated infections rate though it was higher than reported from developed countries.
Factors Affecting Survival After in-Hospital Cardiac Arrest Among Pediatric Patients in a
Tertiary Care Hospital in South IndiaRajaguru Ganesan, Narayanan Parameswaran
Department of Pediatrics, Jawaharlal Institute of Postgraduate Medical Education and Research, Pondicherry, India.
Background and Aims: Often a pediatric intensivist is questioned about chances of survival of a child after an episode of in-hospital cardiac arrest by the anxious parents. Although western data is available, they may not be generalizable for Indian setting. Due to lack of studies in Indian children, there is a need to determine the factors affecting survival in children after an episode of in-hospital cardiac arrest.
Methods: All children aged 12 years with an episode of in-hospital cardiac arrest, atleast 6 hours after admission to the hospital, in pediatric general ward, emergency room and pediatric ICU were recruited. Preterm children, children with terminal illness receiving compassionate palliative care and children who were brain dead at admission were excluded. Various hemodynamic parameters, blood sugar and ECG rhythm and certain investigations for organ function and venous blood gas analysis (done at admission and 1 hour before arrest) were recorded. Cardiac arrest event characteristics were recorded according to the Utstein guidelines. Post resuscitation hemodynamic parameters and random blood glucose were recorded for children with ROSC at speci ed time intervals (4, 12 and 24 hours). Neurological outcome based on Pediatric Cerebral Performance Category (PCPC) scale was determined for all survivors at discharge. All these parameters were compared between the survivors (discharged after an in- hospital cardiac arrest) and non survivors.
Results: Among 5049 children admitted during study period, 382 (7.5%) children had an episode of in-hospital cardiac arrest. Of these, 225 children had to be excluded. 137 children were included for study and results of these were analysed. ROSC was achieved in 82 children (59.8%) but only 27 children (19.7%) survived till hospital discharge (survivors). Most common rhythm during arrest was bradycardia (72.9%) followed by asystole (19%) and VT/VF (5.8%). Presence of low blood pressure, prolonged capillary re lling time, low saturation and hypothermia at 4 hours, 12 hours and 24 hours post cardiac arrest were associated with poor outcome. Multivariate logistic regression analysis showed prolonged CFT, combined (metabolic& respiratory) acidosis and altered coagulation pro le during pre-arrest period, need for multiple doses (> 3) of adrenaline during intra-arrest period and low GCS at 24 hrs post ROSC were also predictive of non survival apart from the above mentioned factors. 77.8% had good neurological outcome (with PCPC score of 1 or 2 at hospital discharge).
Conclusion: Survival after cardiac arrest can be reliably predicted using certain pre-arrest parameters and blood investigations and post cardiac arrest hemodynamic parameter monitoring.
Assessment of Volume Responsiveness by Passive Leg Raising Test in Pediatric Patients
with Shock - Preliminary observationsPriyavarthini V, Sathish kumar K, Suchitra Ranjit,
Rajeshwari NatarajPediatric Intensive Care Unit, Apollo Children�’s Hospital,
Chennai, Tamilnadu.
Background and Aims: Passive leg raising (PLR) test to assess uid responsiveness (FR) has been validated extensively in adults

JOURNAL OF PEDIATRIC CRITICAL CAREVol. 1 - No.4 October - December 2014 308
and has been found to be very useful in assessment of the same. However, paediatric literature is limited.The objective of this study was to determine if PLR induced changes in hemodynamics predicted FR in children with shock.
Methods: This is an ongoing prospective observational study in a tertiary care paediatric centre, done after ethics committee approval. Children with tachycardia plus any other sign of shock were included. Hemodynamic parameters including heart rate, systolic BP, stroke volume and cardiac index (CI) were assessed at baseline, after PLR and after volume loading using Ultrasonic Cardiac Output Monitor (USCOM). An increase in CI > 10% with PLR was considered as predictor of uid response.
Results: Of 17 patients, only 3patients (17.6%) had >10% increase in CI after PLR and 5(29.4%) had an increase after uid challenge. The sensitivity and speci city of PLR in predicting uid responsiveness were 40% and 91.7% respectively. The positive predictive value of PLR was 66.7% and the negative predictive value 78.6%.
Conclusions: The preliminary results of this ongoing study indicate that PLR may not be as good a predictor of FR as in adults. However, the negative predictive value may be signi cant. Certainly, the sample size was small and larger numbers are required to validate these ndings.
Retrospective Analysis of Levosimendan in Pediatric Post Cardiac Surgery Patients
Naresh Lal, Suchitra Ranjit, Satish Kumar, Neville Solomon
Apollo Childrens Hospital, Chennai, Tamil Nadu
Background and Aim: Levosimendan is a new inodilator with calcium sensitizing and K-ATP channel opening properties. Our aim was to demonstrate its safety and ef cacy in post cardiac surgery patients.
Methods: Ethical clearance was obtained. Retrospective analysis of 20 children who received levosimendan infusions between March 2014 and August 2014. Cases included were TGA, TAPVC, AVCD, TOF, Ebsteins anomaly etc. Levosimendan was administered without bolus dose, as a continuous infusion of 0.1 to 0.2 g/kg/min over 24 to 48 hours duration. Mean time of initiation was 6.5days(1-17days). Hemodynamic parameters, inotropic score and ECHO ndings were analysed from 48hours before and upto 5days after levosimendan infusion .Adverse effects during levosimendan infusion were studied
Results: Mean inotropic score (IS) for patients improved from 14.72 to 9.63 {Median value before infusion 14 (range 1.25-42.3) and after infusion 8.6 (range1.6-51)}14 out of 20 (70%) patients had improvement in the IS within 72 hours. ECHO showed marginal improvement for 6 patients (30%) in terms of biventricular function.HR,systolic BP,diastolic BP, mean BP, and CVP were largely unchanged. No adverse effects were noticed.
Conclusions: This study shows levosimedan is safe in postoperative period and its use resulted in a signi cant reduction
in i notrope score. Further prospective studies in children are required to determine its ef cacy early in post cardiac surgery children with LCOS.
Long Term Effects of Mechanical Ventilation on Pulmonary Functions in Children
M Garg, R Nagpal, D Singh, P A PooniDepartment of Pediatrics, Dayanand Medical College and
Hospital, Ludhiana, Punjab, 141001, India
Aim: To determine effect and factors affecting pulmonary function tests in mechanically ventilated children on follow up.
Method: Mechanically ventilated children (> 5 yrs) admitted in PICU of a tertiary care, multispecialty hospital over a period of 15 months were included. PFT were done using spirometer at time of discharge, 3 months and 6 months later. Values were compared to expected norms at each visit and de cit improvement noted.
Results: 20 patients completed 6 month follow up (male: female 3:1) with mean age of 9 years. Reason for ventilation was pulmonary condition (45%), CNS (35%) and miscellaneous (20%), mean duration of ventilation 8.3 days. 75 % (n = 15) and 65% (n = 13) patients at 3 months, 6 months respectively had restrictive pattern of lung function. No patient had signi cant de cit in Tidal volume. Signi cant improvement was seen in inspiratory volume, PEFR at 3 and 6 months though normal values were not achieved. Nearly 65% and 60% children had de cit in FVC at 3 and 6 months respectively. Signi cant increase in FEV1 occurred on follow up. Patients with neurological causes, low PRISM III scores had better results, while longer duration of ventilation, high peak pressures and high O2 had worse outcome. Vital Capacity, FEV1 and FVC showed greatest de cits.
Conclusion: Mechanically ventilated patients develop signi cant defects in long term lung function, most common was restrictive lung disease. Many factors may affect the same. Longer follow up studies are needed.
Comparison of 0.45% vs. 0.22% Normal Saline in 5% Dextrose as Intravenous
Maintenance Therapy in Children Admitted in Pediatric ICU
Asha Benazir. M, Urmila JhambDepartment of Pediatrics, Maulana Azad Medical College and
Lok Nayak Hospital, New Delhi, India
Background and Aims �– Due to concerns regarding occurrence of hyponatremia with use of hypotonic maintenance solutions (0.22% normal saline (NS) in 5% dextrose) in critically ill children, we did a study to compare the change in serum sodium levels in children receiving i.v maintenance uids as 0.22% NS in 5% dextrose or 0.45% NS in 5% dextrose.
JOURNAL OF PEDIATRIC CRITICAL CARE309Vol. 1 - No.4 October - December 2014
Methods- An open labeled RCT was conducted in 140 children aged 3 months-12 years in PICU. One group received 0.22% NS in 5% dextrose and the other received 0.45% NS in 5% dextrose. We studied thechange in serum sodium levels from baseline at 24 & 48 hours and occurrence of dysnatremia. Ethical approval was obtained from institutional ethical committee.
Results- 68 children received 0.22% NS in 5% dextrose and 72 received 0.45% NS in 5% dextrose. Mean change in sodium levels from baseline between two groups (0.22% saline vs. 0.45% saline) was statistically signi cant (At 24 hrs: -2.75+4.61 vs. +0.61+4.58, p=0.0001; At 48 hrs: -2.68+3.99 vs. +0.68+4.23, p = 0.0157). The number of patients with hyponatremia was signi cantly higher in 0.22% saline group at 24 hrs [Moderate hyponatremia (125-129 mEq/l) - 5 vs. 0, p=0.025; Mild hyponatremia (130-134 mEq/l) - 31 vs. 11, p=0.000]. No hypernatremia was observed with 0.45% dextrose saline.
Conclusions- With the use of 0.22% dextrose saline, fall in serum sodium was signi cantly higher and there was more hyponatremia.0.45% dextrose saline caused a minimal increase in mean serum sodium and no hypernatremia making it a more appropriate maintenance uid.
Competing interests- None.
Agreement between Invasive and Oscillometric Non-Invasive BP
Measurements in Critically Ill ChildrenLiah Raju1, Poonam Joshi1, Manju Vatsa1,
SK Kabra 2, Rakesh Lodha2
1College of Nursing and 2Department of Pediatrics, All India Institute of Medical Sciences, New Delhi 110029, India
Background and objective: Accurate measurement of BP is essential for the rational hemodynamic management of all critically ill children. The present study aimed to study the agreement between invasive and oscillometric non-invasive BP measurements in critically ill children of age less than 15 years admitted in Pediatric ICU of a tertiary level care hospital.
Methods: The prospective observational study was done by intra-patient comparison of two blood pressure measurement systems on 93 critically ill children of age less than 15yearshaving radial arterial catheter for continuous BP monitoring admitted in Pediatric ICUof a tertiary level care hospital. Ethical approval for the study was obtained from the institutional Ethics Committee.
Measurements and Main Results: Atotal of 1060 paired measurements of invasive and oscillometric non-invasive BP were taken on each subject at the time of enrolment and then every 3-4 hourly for 7 days or till the arterial catheter was in place, whichever occurred earlier. Invasive and oscillometric NIBP were taken simultaneously. Oscillometric NIBP was taken on right arm if arterial line was on left and vice-versa using a BP cuff appropriate to the child�’s arm. We assessed the agreement using Bland Altman analysis. Mean (±SD) differences between the invasive and oscillometric non-invasive BPfor systolic,
diastolic and mean arterial BP measurements were -3.6 ± 5.6, -3.4 ± 5.5 and -3.4 ± 5.5 mm Hg respectively (p<0.05). Bland Altman analysis showed fairly wide limits of agreement. When analyzed using age speci c normo-, hypo- and hypertensive criteria, among normotensive group, the difference of invasive and non-invasive systolic (dSBP), diastolic (dDBP) and mean (dMAP) arterial BP measurements were -2.96, -3.17, -2.89 mm Hg respectively(p<0.05). The dSBP among hypotensive group (-3.4 ± 3.93 mm Hg) and dMAP among hypertensive group (-4.24 ± 5.37 mm Hg) also showed signi cant difference (p<0.05). A good correlation was found between both methods.
Conclusion: As the limits of agreement were wide and oscillometric readings were overestimated, invasive method of BP monitoring should be used for monitoring critically ill children to get accurate blood pressure, whenever feasible.
Effect of Estimated Glomerular Filtration Rate (eGFR) & Fluid Balance on Clinical
Course and Outcomes of Children Admitted with Severe Dengue
Vivekanand VV, Sasidaran Kandasamy, Niranjan Vijaya Kumar, Thangavelu Sangaralingam,
NedunchezhianDivision of Pediatric Intensive Care, Department of Pediatrics,
Mehta Children�’s Hospital , Chennai, India
Background and aims: To measure estimated glomerular ltration rate (eGFR) at admission and uidbalance in the rst 36 hours of ICU stay and assess their effect on disease course and outcomes in severe dengue.This was designed as a retrospective descriptive study in a tertiary level pediatricintensive care unit in South India.
Methods: Case records of all children ful lling the WHO case de nition of severe dengue were included, those who received intravenous uid for less than 12 hours were excluded. Primary parameters measured included uid balance in rst 36 hours measured every 12 hours, durations of oxygen requirement, mechanical ventilation, ICU stay and total hospital stay.
Results: 26 children were enrolled, 14 boys and 12 girls. The median duration of ICU stay was 60 hours, and that of hospital stay 109 hours. eGFR was less than 60 ml/min in 6 patients (83.3% expired and 16.7% survived). eGFR, measured by modi ed Schwartz�’s formula, at the time of admission correlated inversely with requirement of oxygen therapy and mechanical ventilation (p<0.05) and uid balance in rst 36 hours. Positive uid balance (FO > 15%) in the rst 36 hours was signi cantly higher in children who expired (p- 0.011). eGFR<90 mL/min at admission had 100% sensitivity and 79% speci city to predict the possible occurrence of uid overload >15% (Area under curve - 0.882)
Conclusion: Fluid balance in the rst 36 hours had a signi cant positive correlation with mortality and negative correlation with eGFR. Children with admission eGFR<90 mL/min may require restrictive uid therapy to improve survival.

JOURNAL OF PEDIATRIC CRITICAL CAREVol. 1 - No.4 October - December 2014 310
Flexible Fibreoptic Bronchoscopy in Critically Sick Indian Children
PreetiAnand, Anil Sachdev, Dhiren GuptaIntensive Care Unit, Sir Ganga Ram Hospital, Rajinder Nagar,
New Delhi
Background: Flexible breoptic bronchoscopy (FFB) remains a modality occasionally used in critically sick Indian children for a variety of reasons. This modality, however, is safe and helpful for both diagnosis as well as guidance of treatment. This study is a brief description of our experience with this modality.
Materials and Methods: This observational study was conducted in the PICU over a 15 month period from March 2012 till June 2013. Children requiring a bronchoscopy for prede ned indications were enrolled in the study. A record was maintained of the indication for the procedure, the patient�’s clinical status, ventilator parameters, etc. The procedure was performed under continuous cardiorespiratory monitoring. A lavage sample was collected when indicated. Patient�’s vital parameters and ventilator settings, if any, were recorded before, during and upto 6 hours post procedure. The success in achievin g objectives, both diagnostic and therapeutic was noted.
Results: FFB was performed in a total of 43 PICU patients during the study period. The mean age ranged between 1 month to 12 years. Of the 43 children studied 36 were males (83.7%).
The common indications were persistent radiographic shadows in the form of pneumonia (27.9%) or collapse (20.9%), suspected airway foreign body (20.9%) and acute stridor (16.3%). One patient was intubated using exible bronchoscopy. The route for scope insertion was through the nostril in 26 patients (60.5%), via the endotracheal tube in 15 patients (34.89%) and through the LMA in 2 patients (4.65%). 15 (34.9%) of the patients were mechanically ventilated at the time of performing FFB. 2 patients were extubated within 6 hours of bronchoscopy after foreign body removal. 5 (33.33%) patients required increase in FiO2 post-bronchoscopy. The mean±SDincrease in FiO2 from baseline was 15.6±3.96. Increased PEEP requirements were seen in 4 patients (14%). The mean±SD increase in PEEP from baseline was 2.8±1.5. 4 patients were on inotropic support during the procedure, and inotropic requirements was seen to transiently increased in 2. De nitive diagnostic clue to etiology was available in nearly 85% of patients who underwent the procedure
Conclusion: Flexible breoptic bronchoscopy in PICU patients has a high diagnostic yield, is safe and well tolerated.
Bedside Sonographic Measurement of the Inferior Vena Cava Diameter Correlate With Central Venous Pressure in the Assessment of
Intravascular Volume in ChildrenKaran Raheja1, Anil Sachdev2, Dhiren Gupta3
Pediatric Intensive Care Unit Sir Gangaram Hospital, Delhi
Backround: Volume status assessment is an important aspect of
patient management in the pediatric intensive care unit (PICU). Echocardiologist-performed measurement of IVC distensibility index (IVC-DI) provides useful information about lling pressures, but is limited by its portability, cost, andavailability. Intensivist-performed bedside ultrasonography (INBU) examinations have the potential to overcome these impediments. We used INBU to evaluate hemodynamic status of PICU patients, focusing on correlations between IVC-DI and CVP.
Study Design: Prospective evaluation of hemodynamic status was conducted on 42 consecutive PICU patients with a brief (3 to 10 minutes) INBU examination. IVC-CI measurementswere compared with invasive CVP values.
Objective: To determine bedside ultrasound (BUS) measurements of the IVC diameter correlate with central venous pressure (CVP) measurements .
Methods: 42 oro-tracheal intubated patients on positive pressure ventilation were included in the study.Inferior vena cava diameters were recorded by a subcostal view using M Mode.Distensibility index was calculated as follows: (Dmax - Dmin/Dmin) × 100.
Results-Of the 42 participants, 19 (45%) had a CVP < 8 mmHg. 28 out of 42 (66%) children had a distensibilityindex > 46 %. The sensitivity, speci city, positive predictive value and negative predictive value of a distensibility index 0.18to predict a CVP < 8 mmHg were 55.56 %, 40 %, 53 % and 25 %.
Conclusion-Based on these data, the IVC by INBU and invasive CVP are not having any correlation in acutely ill children.
Impact of Early Fluid Overload in Critically Ill Children- A prospective observational study
Lalitha, A1, Vasudevan, A2, Shilpa, R2, Phadke, K2
1Pediatric Intensive Care Unit, St. John�’s Medical College Hospital, 2Pediatrics Nephrology St. John�’s Medical College
Hospital, Bangalore, India
Background and aims: Fluid management has a major impact on duration, severity and outcome of critical illness.
Aims: To determine the impact of early uid overload on mortality in critically ill children.
Methods: Critically ill children (1 month and 18 years of age) admitted in PICU for at least 24 hours were eligible for recruitment. Fluid overload (FO) was estimated by subtracting the sum of all uid inputs from the sum of all uid outputs on everyday for 72 hours after admission.
Results: 211 children were included. The difference in the mean daily uid balance (ml/kg) between survivors and non-survivors was maximum at 48 hours (32.3 ± 2.9 vs 46.7 ± 5.0, p =0.01). 85 patients (40.2%) developed < 10% FO, 81 patients (38.4 %) developed 10%-20% FO, and 45 patients (21.4%) developed > 20% FO at 48 hours of ICU admission. Patients who developed > 20% FO at 48 hours had signi cantly higher mortality (25/45;

JOURNAL OF PEDIATRIC CRITICAL CARE311Vol. 1 - No.4 October - December 2014
55.6%) than those who had 10%-20% FO (27/81; 33.1%) and with < 10% FO (25/85; 29.4%). The adjusted odds of death in presence of early FO > 20% was 3.16 as compared to children with < 10% (p=0.02). The cumulative uid balance (%) was signi cant more positive in AKI children versus non AKI (9.0 ± 7.11 versus 11.9 ± 9.2, p = 0.009).
Conclusions: Children who died in PICU accumulated more uid in rst 48 hours. Fluid overload > 20% at 48 hours was associated with 3 times increase mortality as compared to FO < 10%.
Effect of Pre-hospital Transport and Patient Related Factors on Rates of PICU Admission Among Patients Presenting to the Pediatric Emergency Department of a Tertiary Care
CentrePraveen Narsaria1, Archana Singh2, Lesa Dawman1,
Jhuma Sankar1
1Department of Pediatrics, AIIMS, New Delhi, 2Department of Pediatrics, PGIMER, DR RML Hospital, New Delhi
Background and Aims: Data on the transport practices prevalent among patients presenting to the Pediatric emergency department (PED) of resource limited countries is scarce. Moreover, effect of these and other patient related factors on rates of ICU admission has also not been well studied. The aim of this study was therefore to evaluate the prevailing pre-hospital transport practices and study the effect of these and other patient related factors on rates of admission to the PICU.
Methods: Children presenting to the PED of our hospital over a period of 6 months (Jan-Jun 2013) were evaluated. We collected information on details pertaining to pre-hospital transport, and, their clinical parameters, and need for PICU admission. The study was approved by the IRB.
Results: A total of 319 patients presented to the PED during the study period. Nearly 61% (196) of the patients used public transport systems such as autorickshaw and bus to transport the children to the health care facility. Fifty four children (17%) required PICU admission and 19 (6%) were admitted to the wards. Severe sepsis/septic shock (26, 48%) was the commonest cause for PICU admission, followed by respiratory illnesses such as pneumonia and asthma (13, 24%). On univariable analysis, we found factors such as nature of illness (septic shock/pneumonia), Pediatric Index of mortality (PIM) 2 score and duration of illness before presentation to be signi cantly associated with need for PICU admission.
Conclusion: Public transport systems were commonly used to transport patients from home/ hospital to our centre. Nature of illness and the admission PIM2 scores predicted the need for PICU admission.
Key words: Pre-hospital transport; PICU admission; public transport; autorickshaw
Continuousrenal Replacement Therapy (CRRT) in Children Withsepsis and Multi
Organ Dysfunction Syndrome- Indian scenario
Krishna Mohan Gulla1, Kanav Anand2, Anil Sachdev1, P.K.Pruthi2, Dhiren Gupta1, Neeraj Gupta1
Division of 1Pediatric Critical Care and 2Pediatric Nephrology, Institute of Child Health, Sir Ganga Ram Hospital,
New Delhi, India
Background: Sepsiswith multi organ dysfunction syndrome (MODS) is a common occurrence in Pediatric Intensive Care Unit(PICU) in sick children. Unfortunately scanty literature is available regarding CRRT utility in sepsis with MODS from developing countries.
Objectives: To report our experience and emphasize the initiation of early CRRT in managing children with sepsis and MODS in a developing nation.
Materials and methods: Medical records of children required CRRT in PICU at Sir Ganga Ram Hospital from September 2010 to August2014 were retrospectively analyzed to obtain data on demographic factors, mode of CRRT& its prescription, probable effect of CRRT on inotropic score, plateau pressures, P/F ratio, hemodynamicstability while on CRRT, anticoagulants, feasibility and complications.
Results: During the study period 23 children required CRRT(male-15). The median age was 11years (13 months to 16 years) and median weight 39kg (7.5kg to 65kg).18had primary diagnosis of sepsis with MODS, while 5 had severe Dengue fever with sepsis. At initiation of CRRT, all patients were receiving mechanical ventilation and inotropic support. 11 children (47.8%) had uid overload (F.O) of >10% at the time of initiation of CRRT. 8 out of 11 survivors (72%) received CRRT within 48 hours of admission while in 7 out of 12(58.4%) non-survivors CRRT was initiated after 48 hours.The medianF.O among survivors and non survivors was 9.1%(2.9%-12.5%)and 7.4%(2.4%-14%)respectively but the mean serum creatinine in survivors and non survivors were 2.5±0.8SD and 3.5±1.1SD(p<0.03) r espectively. There was no statistically signi cant difference in the duration of ICU stay and CRRT, change in inotropic score and P/F ratios between the survivor andnon-survivors. Total of 30CRRT sessions amounting to 1142.4hours were given. CVVHDF was preferred in all patients. The mean lifespan of lter was 47.62 hours. One patient had Intracranial bleed secondary to heparin usage as an anticoagulant.Manageable electrolyte abnormalities like hypokalemia, hypophosphatemia, hypomagnesaemia, hypocalcaemia were observed in 75%, 55%, 40%, 10% patients respectively. Clotting was the most common circuit related complication.
Conclusion: Early initiation of CRRT in children with sepsis and MODS may improve the survival but large sample size is required for validation in Indian scenario.

JOURNAL OF PEDIATRIC CRITICAL CAREVol. 1 - No.4 October - December 2014 312
Critical ReviewJournal Scan
Comments by International Reviewers
Infection Risk From Femoral vs Jugular Venous Catheters Critical Care Medicine - December 30, 2013 - Vol. 19 - No. 8
Femoral venous catheters may carry the same risk of infection as jugular venous catheters in critically ill patients.
Article ReviewedJugular Versus Femoral Short-Term Catheterization and Risk of Infection in ICU Patients: Causal Analysis of 2 Randomized Trials. Timsit JF, Bouadma L, et al: Am J Respir Crit Care Med; 2013;188 (November 15): 1232-1239.
ObjectiveTo evaluate the risk of infection and catheter-tip colonization with femoral versus internal jugular central venous catheters.
DesignSecondary analysis from 2 previous studies designed to assess the effect of chlorhexidine-impregnated dressings on the incidence of catheter-related bloodstream infections (CR-BSI).
MethodsBoth studies enrolled ICU patients from hospitals in France. The present study analyzed data only from internal jugular and femoral vein sites. Catheters were managed via a protocol similar to that of Centers for Disease Control guidelines for catheter maintenance. Catheters were removed when no longer needed or if CR-BSI was suspected. Catheter-tip culture was performed with a quantitative culture technique. Insertion-site skin colonization was assessed semiquantitatively by pressing an agar-coated, chlorhexidine-neutralizing plate to the skin. If a CR-BSI was suspected, peripheral blood cultures were obtained. A special blinded committee classi ed
the event as a CR-BSI or colonization. A Cox model for clustered data was constructed to determine the effect of catheter site on colonization and CR-BSI.
Results2128 patients involving 2527 catheters and 19,481 catheter-days were analyzed (55.4% femoral, 44.6% internal jugular). Patients with femoral catheters were sicker, and median time of catheter duration was longer (7 vs 5 days). There was no difference in CR-BSI. Catheter colonization was not different between the femoral and internal jugular vein sites overall, although there was an increase in femoral site colonization after the fourth day. There was a decrease in colonization for females at the internal jugular site. Dressing disruptions were higher at the femoral site. Skin colonization at catheter removal was higher at the internal jugular vein site. There was no difference between sites when impregnated dressings were used.
ConclusionsInternal jugular and femoral central venous catheters carry a similar risk of CR-BSI and skin colonization.
Reviewer’s CommentsThe subclavian site is clearly preferred for central venous access, but fewer than half of ICU patients receive subclavian catheters because of either real or perceived disadvantages (risk of pneumothorax, bleeding, etc). We are often forced to choose �“the lesser of 2 evils,�” namely, internal jugular or femoral. There are a number of factors that must be weighed in this decision, and risk of infection is high on the list. The present study suggests that infectious risk may be similar between the sites, especially if the catheter remains in place <5 days. Use of chlorhexidine-impregnated dressings may also reduce skin colonization and, perhaps ultimately, infection. The overall rate of infection in this study was low (0.8%), so it may have been underpowered

JOURNAL OF PEDIATRIC CRITICAL CARE313Vol. 1 - No.4 October - December 2014
to detect a difference. This study did not assess the risks of other complications with the femoral site (reduced mobility, deep venous thrombosis), so it must be interpreted in the broader context of site selection.(Reviewer�–Brian T. Garibaldi, MD).
The Bad Blood of Transfusion MedicineCritical Care Medicine - December 30, 2013 - Vol. 19 - No. 8
A restrictive, compared to a more liberal, transfusion strategy has been shown to decrease the number of blood transfusions in elderly mechanically ventilated patients without worsening clinical outcomes.
Article ReviewedRestrictive Versus Liberal Transfusion Strategies for Older Mechanically Ventilated Critically Ill Patients: A Randomized Pilot Trial. Walsh TS, Boyd JA, et al: Crit Care Med; 2013;41 (October): 2354-2363.
BackgroundA restrictive transfusion strategy improves outcomes in critically ill patients, but elderly patients with respiratory failure may need extra oxygen-carrying capacity to supply adequate oxygen to their tissues.
ObjectiveTo compare the effect of a restrictive versus liberal transfusion strategy on outcomes in elderly critically ill ventilated patients.
DesignOpen-label randomized trial.
Participants100 patients in 6 ICUs aged >55 years already ventilated for >4 days, needing at least another 24 hours of ventilation, and having a hemoglobin (Hgb) <9.0 g/dL.
MethodsThe primary endpoint was difference in Hgb levels between groups. Clinical outcomes, such as mortality and ventilator-free days, were secondary outcomes.
InterventionsPatients in the liberal arm received single-unit transfusions when their Hgb fell <9.0 g/dL with a target of 9.0 g/dL to 11.0 g/dL compared to a transfusion threshold of 7.0 g/dL and a goal of 7.0 g/dL to 9.0 g/dL for the restrictive group. The strategy was continued for the longer of either 14 days or ICU discharge. With signi cant bleeding, clinicians could transfuse as clinically indicated.
ResultsAlmost one-third of the patients had ischemic heart disease and two-thirds had already received at least 1 transfusion prior to enrollment. The restrictive group received a median of 1 less unit of red-blood cell (RBC) transfused (2 units vs 3 units; P =0.002), with 9% fewer patients receiving a transfusion (40% vs 49%). The mean Hgb was almost 1.5 g/dL higher in the liberal strategy group (9.6 g/dL vs 8.2 g/dL; P <0.0001). There was no difference in any of the secondary outcomes, including ICU length of stay, hospital length of stay, ventilator-free days, or change in sequential organ failure assessment score. Hospital mortality was numerically lower in the restrictive strategy group, but it was not statistically signi cant (19% vs 24%; relative risk, 0.76; 95% con dence interval, 0.48 to 1.2).
ConclusionsA restrictive transfusion strategy resulted in lower mean Hgb values and less transfusions but similar clinical outcomes as a more liberal transfusion strategy in older, mechanically ventilated patients.
Reviewer’s CommentsDespite new blood preparation and storage techniques, the results of this study, although limited to elderly mechanically ventilated patients, are very similar to those from the Transfusion Requirements in Critical Care study, which was completed more than a decade ago. Once again, a higher transfusion threshold did not improve outcomes, and it may have worsened them. This has now been shown in general ICU patients, in patients following cardiac surgery, and in critically ill patients with upper gastrointestinal bleeds. Limitations to this study include its small size and the de nition of �“elderly�” extending to as young
CRITICAL REVIEW Journal Scan

JOURNAL OF PEDIATRIC CRITICAL CAREVol. 1 - No.4 October - December 2014 314
as 55 years; however, all available data indicate transfusing PRBCs to optimize oxygen delivery in all critically ill patients is not bene cial. The real advance in transfusion medicine will occur when we obtain the ability to measure the oxygen delivery and/or demand in each individual patient at the bedside.(Reviewer�–Todd W. Rice, MD, MSc).
Induced Hypothermia Not Bene cial in Severe Bacterial Meningitis Critical Care Medicine - December 30, 2013 - Vol. 19 - No. 8
Induced hypothermia for 48 hours fails to improve neurological outcomes in patients with bacterial meningitis and may worsen mortality.
Article ReviewedInduced Hypothermia in Severe Bacterial Meningitis: A Randomized Clinical Trial. Mourvillier B, Tubach F, et al: JAMA; 2013; (October 8): epub ahead of print.
BackgroundThe morbidity and mortality of bacterial meningitis remain high, with about 20% of patients dying and another large proportion surviving with signi cant neurological injury. Induced hypothermia has bene t in other conditions with global cerebral ischemia, but its effect in bacterial meningitis remains unknown.
ObjectiveTo determine if induced hypothermia would improve the functional outcome of comatose patients with bacterial meningitis.
DesignOpen-label, multicenter, randomized controlled trial.
Participants98 adults with suspected or proven meningitis with a Glasgow Coma Scale score of < 9 from 49 ICUs in France.
MethodsThe primary endpoint was Glasgow Outcome Scale
score 3 months after randomization assessed by a blinded physician via telephone. Only mild or no disability was scored as a favorable outcome. Three-month mortality, hearing impairment, and muscle strength were secondary outcomes.
InterventionsInduced-hypothermia patients were cooled to 32 degrees Celsius to 34 degrees Celsius for 48 hours followed by passive rewarming. Patients in both groups were treated with appropriate antibiotics, tight glycemic control, and mean arterial pressure >70 mm Hg. A total of 87% of patients in both groups received steroids.
ResultsAfter enrollment of 98 of a planned 276 patients, the data and safety monitoring board stopped the study due to higher mortality in the hypothermia group (51% vs 31%; P =0.04). Streptococcus pneumoniae was the causative agent in 77% of cases. A total of 37% of patients in the hypothermia group had shock at baseline compared to only 20% in the control group (P =0.14). Mean temperatures 24 hours after randomization were 33.3 degrees Celsius versus 37.0 degrees Celsius in the hypothermia and control groups, respectively. At 3 months, an unfavorable neurological outcome occurred in 42 of 49 patients in the hypothermia arm (86%) compared to 36 of 49 (73%) in the control (P =0.13). After multivariable adjustment, mortality remained higher in the hypothermia group at 3 months, although not statistically signi cant (hazards ratio, 1.76; P =0.10).
ConclusionsInduced hypothermia did not improve favorable neurological outcomes in patients with severe bacterial meningitis and may have worsened mortality.
Reviewer’s CommentsGiven its success in post-cardiac arrest patients, hypothermia has become an exciting treatment modality. Its use has started to spread to other disease processes, including some studies looking at its use in neurological injuries, drownings, and fulminant hepatic failure. In the not-so-distant
CRITICAL REVIEW Journal Scan

JOURNAL OF PEDIATRIC CRITICAL CARE315Vol. 1 - No.4 October - December 2014
past, sepsis represented a relative contraindication to hypothermia, but recently this has thought to be less of an issue. This study in patients infected with bacterial meningitis demonstrated no bene t, and even potential harm, with hypothermia. The fact that patients who underwent cooling overall had worse outcomes is concerning that maybe this is sepsis related. These data demonstrate that although hypothermia may be good post-cardiac arrest, it clearly is not a panacea, and we should exercise caution implementing it in patients who are infected.(Reviewer�–Todd W. Rice, MD, MSc).
Lung Ultrasound Frequently Changes Management in Mechanically Ventilated Patients Critical Care Medicine - December 30, 2013 - Vol. 19 - No. 8
When performed for speci c clinical questions or unexplained alterations in arterial blood gas results, lung ultrasound has an impact on clinical decision-making in critically ill patients receiving mechanical ventilation.
Article ReviewedImpact of Lung Ultrasound on Clinical Decision Making in Critically Ill Patients. Xirouchaki N, Kondili E, et al: Intensive Care Med; 2013; (October 25): epub ahead of print.
BackgroundLung ultrasound (LU) is a noninvasive tool that provides rapid and accurate diagnostic information in mechanically ventilated patients. The impact of this modality on medical decisions in the ICU has not been examined.
ObjectiveTo examine the impact of LU on decision-making among critically ill patients receiving mechanical ventilation.
DesignSingle-center, prospective, interventional trial.
Participants
189 mechanically ventilated patients in a combined medical-surgical ICU.
MethodsPatients were enrolled when a single operator was available and the primary physician requested LU due to unexplained alteration in arterial blood gas or suspicion of 1 of 5 speci c pathologic conditions (pneumothorax, signi cant pleural effusion, unilateral atelectasis, pneumonia, diffuse interstitial syndrome). The LU operator reported imaging ndings, but he/she did not play a role in decision-making. LU was performed using a validated protocol. The clinical yield of LU for the speci c diagnosis was calculated as the percentage of studies that con dently excluded the suspected diagnosis or revealed positive ndings with diagnostic implications. The primary physician labeled ndings as expected or unexpected. Impact of LU on decision-making was assessed by calculating a net reclassi cation improvement.
ResultsLU was performed 253 times in 189 patients. A total of 108 (42.7%) studies were performed due to unexplained change in blood gas and 145 (57.3%) due to a suspected pathologic condition. The net reclassi cation improvement was 85.6%, and management changed directly due to LU ndings in 119 cases (47%). LU ndings supported diagnoses not suspected by the primary physician in 53 (21%) cases.
ConclusionsLU impacts clinical decision-making when performed for speci c clinical questions or unexplained alterations in arterial blood gas results in critically ill patients receiving mechanical ventilation.
Reviewer’s CommentsAlthough prior research has demonstrated the diagnostic utility of bedside LU in critically ill patients, this study attempts to evaluate the impact of LU on medical decision-making. The high percentage of management changes reported to be due to ultrasound ndings is impressive, and the frequent ndings consistent with unsuspected diagnoses are very intriguing. In addition, performing
CRITICAL REVIEW Journal Scan
JOURNAL OF PEDIATRIC CRITICAL CAREVol. 1 - No.4 October - December 2014 316
LU for 5 speci c suspected diagnoses or blood-gas abnormalities is a unique characteristic of this study design, as compared to routine LU in patients with respiratory failure. The non-randomized design and uncontrolled nature of the study, however, are major limitations that cannot be overlooked. In addition, this study was performed at a single center with signi cant experience using LU, such that routine chest x-rays are no longer obtained in this ICU. Therefore, these results are not generalizable to other centers. Although LU is a powerful bedside tool in experienced hands, the results of this study must be taken in the context of these major limitations.(Reviewer�–Jakob I. McSparron, MD).
Using Prone Positioning at High PEEP Levels Critical Care Medicine - December 30, 2013 - Vol. 19 - No. 8
Using prone positioning at high positive end-expository pressure levels protects against marked rises in tidal hyperin ation, decreases cyclic recruitment/derecruitment, and increases alveolar recruitment.
Article ReviewedEffects of Prone Positioning on Lung Protection in Patients With Acute Respiratory Distress Syndrome. Cornejo RA, Diaz JC, et al: Am J Respir Crit Care Med; 2013;188 (August 15): 440-448.
BackgroundA recent large randomized controlled trial reported that prone positioning markedly improved mortality in mechanically ventilated patients with acute respiratory distress syndrome (ARDS). The mechanisms by which this led to better outcomes is unclear.
ObjectiveTo examine how the combination of prone positioning and positive end-expository pressure (PEEP) in mechanically ventilated patients with ARDS impacts alveolar recruitment, tidal hyperin ation, and cyclic recruitment/derecruitment.
Participants
24 adult mechanically ventilated patients (for 24 to 72 hours) who ful lled ARDS criteria.
MethodsMeasurements were obtained in both the ICU and in the CT scanner. All patients were paralyzed, deeply sedated, and underwent lung-protective ventilation (VT=6 mL/kg). In the ICU, respiratory mechanics and oxygenation were measured after 20 minutes of ventilation at a PEEP of 5 and 15 cm H2O. A recruitment maneuver (RM) of 45 cm H2O was performed to standardize volume history before each change in PEEP. In the CT scanner, static images to assess alveolar recruitment were taken in both prone and supine positions at PEEP 5 and 15 and during an RM. Dynamic images (to assess tidal hyperin ation and cyclic recruitment/derecruitment) were taken both supine and prone at 5 and 15 cm H2O PEEP. The various lung compartments were categorized by CT density, and �“high recruitability�” was de ned as having >14% of potentially recruitable lung volume in the supine position. The sequencing of positions and PEEP levels were randomized.
ResultsRaising PEEP to 15 cm H2O in either position improved oxygenation and overall compliance while decreasing nonaerated tissue at the expense of increased tidal hyperin ation. Compared to supine, prone positioning resulted in signi cantly less tidal hyperin ation and nonaerated tissue at PEEP 15. The combination of prone positioning and PEEP 15 led to signi cantly decreased cyclic recruitment/derecruitment. In the supine position, a PEEP of 15 cm H2O increased tidal hyperin ation signi cantly, and this was signi cantly attenuated by prone positioning. A total of 14 of 24 patients had high lung recruitability. They responded better to increasing PEEP to 15 (better compliance, less cyclic recruitment/derecruitment). For low recruitability patients, prone positioning signi cantly reduced nonaerated tissue.
ConclusionsUsing prone positioning at high PEEP levels reduces tidal hyperin ation, decreases cyclic recruitment/derecruitment, and increases alveolar recruitment.
CRITICAL REVIEW Journal Scan

JOURNAL OF PEDIATRIC CRITICAL CARE317Vol. 1 - No.4 October - December 2014
Reviewer’s CommentsThis study supplements our understanding of the physiologic effects of prone positioning on lung mechanics and ventilator-induced lung injury in ARDS patients. One criticism on ARDS trials is that patients are often very heterogeneous. In trials looking at an open lung strategy, there were concerns that the nal results were negative because there was a subpopulation of PEEP-responsive patients and another group of nonresponders. Perhaps prone positioning makes these groups more homogeneous and, thus, ampli es the effects of an open lung strategy. (Reviewer�–Timothy J. Scialla, MD).
Does Arterial Line Infection Rate Rival Frequency of Central Line Infection? Critical Care Medicine - January 30, 2014 - Vol. 19 - No. 9
Arterial catheter-related bloodstream infections occur with a similar frequency to that of central venous catheter-related bloodstream infections.
Article ReviewedArterial Catheter-Related Bloodstream Infection: Incidence, Pathogenesis, Risk Factors and Prevention. Safdar N, O�’Horo JC, Maki DG: J Hosp Infect; 2013; 85 (November): 189-195.
BackgroundDespite widespread arterial catheter use, limited data report the risk of arterial catheter-related bloodstream infection (CRBSI) or provide insight into its pathogenesis.
ObjectiveTo examine the epidemiology, microbial pathogenesis, and risk factors surrounding arterial CRBSI.
DesignProspective study.
Participants542 patients (834 arterial catheters, 3273 catheter-days) who also participated in 2 prospective randomized trials of CRBSI prevention methods (a chlorhexidine-
alcohol solution for cutaneous antisepsis or a chlorhexidine-impregnated sponge dressing).
MethodsInvestigators routinely obtained quantitative cultures of insertion site skin, catheter segments, hub, and infusate at the time of catheter removal. Restriction-fragment DNA subtyping de ned concordance between catheter and peripheral blood organisms. A univariate analysis explored risk factors for arterial CRBSI.
Results109 catheters (13%) were colonized, and causative bacteremia occurred in 11 cases (1.3%; 3.4 per 1000 catheter-days). Extraluminal colonization caused 63% of CRBSIs. Univariate analysis identi ed duration of catheter placement >6 days as a risk factor for CRBSI (RR, 4.3; 95% CI, 1.2 to 15.6). The rate of arterial CRBSI was similar to the rate of non-cuffed central venous (CV) CRBSI in the contemporaneous randomized trials (2.7%, 5.9 per 1000 catheter-days).
ConclusionsArterial CRBSIs occur with comparable frequency to CV CRBSIs and should be included in the differential diagnosis of sepsis or bacteremia. Extraluminal colonization is an important pathogenic mechanism of arterial CRBSI. Arterial catheters should be removed as early as possible.
Reviewer’s CommentsArterial CRBSIs may be underappreciated in the ICU. When they do occur, CRBSIs increase ICU length of stay and carry a high attributable mortality. This prospective study used rigorous microbiological methodology to determine that the risk of arterial CRBSI is on par with the risk of CV CRBSI. The authors report a point estimate for arterial CRBSI risk but do not provide a con dence interval (CI); based on their gures, a 95% CI of 0.7% to 2.4% surrounds the arterial CRBSI incidence estimate of 1.3% (modi ed Wald method). It should be noted that the reported risk of CV CRBSI (2.7%; 5.9 per 1000 catheter-days) is on the high end of published values. Only 11 arterial CRBSIs occurred in their sample, which precluded multivariate analysis. Their
CRITICAL REVIEW Journal Scan

JOURNAL OF PEDIATRIC CRITICAL CAREVol. 1 - No.4 October - December 2014 318
univariate data have wide CIs and do not inform which risk factors for arterial CRBSI are most prominent other than duration of catheter placement >6 days. Their nding that extraluminal colonization caused the majority of arterial CRBSIs con rms that an alternative anatomic site should be selected when replacing arterial catheters. This article contradicts the notion that arterial catheters are an uncommon cause of bacteremia, although more robust data are still needed. Arterial catheters should be a suspected source in cases of sepsis or bacteremia without another compelling etiology and should be removed as soon as possible. (Reviewer�–Benjamin D. Singer, MD).
Is It Time to Throw Away Gowns in the UCI? Critical Care Medicine - January 30, 2014 - Vol. 19 - No. 9
Universal contact isolation does not reduce acquisition of methicillin-resistant Staphylococcus aureus (MRSA) or vancomycin-resistant Enterococcus, but it may decrease MRSA acquisition in ICUs with a high incidence of MRSA colonization.
Article ReviewedUniversal Glove and Gown Use and Acquisition of Antibiotic-Resistant Bacteria in the ICU: A Randomized Trial. Harris AD, Pineles L, et al: JAMA; 2013;310 (October 16): 1571-1580.
BackgroundNosocomial infections with methicillin-resistant Staphylococcus aureus (MRSA) or vancomycin-resistant Enterococcus (VRE) are associated with poor patient outcomes and high costs of care.
ObjectiveTo determine if universal contact isolation (UCI; gown and gloves for all patients in the ICU) reduces acquisition of MRSA and VRE colonization during an ICU stay.
DesignCluster randomized, prospective controlled trial.
Methods
20 ICUs (medical, surgical, and medical-surgical) were compared. MRSA and VRE swabs were obtained from patients at admission and at discharge. Primary (combined) end point was acquisition of either MRSA or VRE. Secondary end points were acquisition of MRSA or VRE, a health care-associated infection (HAI), and adverse events.
ResultsUse of UCI did not decrease the combined end point of acquisition of either MRSA or VRE, but it decreased rates of MRSA acquisition alone. No difference in the development of HAI was observed in either group. UCI increased the frequency of handwashing, but it decreased entry into each patient�’s room.
ConclusionsDespite a high compliance with UCI, routine use of gowns and gloves did not reduce the acquisition of either MRSA or VRE (as a composite end point), but it did reduce MRSA colonization (as a single end point).
Reviewer’s CommentsHospitals, regulatory agencies, and advocates for health care improvement have been searching for the magic bullet to reduce HAIs, especially those associated with resistant organisms such as VRE and MRSA. This study asks whether routine use of gowns and gloves in all patients reduces the acquisition of VRE or MRSA during an ICU stay. Routine use of gowns and gloves did not reduce acquisition of VRE or MRSA. This seems like a victory for those of us who hate donning gowns and gloves. However, UCI did reduce MRSA acquisition alone. While there were no differences in rates of HAIs, the study may not have been powered to detect these differences. Since intervention groups had higher baseline rates of MRSA than did control groups, this nding may more generalizable to ICUs with higher rates of admission MRSA colonization. Also, the reduction in rates of MRSA acquisition may have been related to decreased contact with providers/hour or increased compliance with hand washing, both of which might affect acquisition of MRSA as an isolated intervention. There were no cost/bene t analyses of costs associated with implementation of
CRITICAL REVIEW Journal Scan

JOURNAL OF PEDIATRIC CRITICAL CARE319Vol. 1 - No.4 October - December 2014
UCI or patient/family/provider satisfaction analyses. These factors might also affect implementation of UCI, particularly with studies demonstrating that use of gowns and gloves increase a patient�’s sense of isolation. While I�’d like to throw out routine use of gowns and gloves in favor of efforts aimed at increased hand washing in ICUs with modest to high rates of MRSA colonization, that move is premature.(Reviewer�–Alison S. Clay, MD).
De-Escalation of Broad-Spectrum Antibiotics Decreases Mortality in Sepsis Critical Care Medicine - January 30, 2014 - Vol. 19 - No. 9
De-escalating broad-spectrum antibiotics based on culture results decreases mortality in septic patients.
Article ReviewedDe-Escalation of Empirical Therapy Is Associated With Lower Mortality in Patients With Severe Sepsis and Septic Shock. Garnacho-Montero J, Gutiérrez-Pizarraya A, et al: Intensive Care Med; 2014;40 (January): 32-40.
BackgroundThe Surviving Sepsis Campaign 2012 guidelines recommend empiric broad-spectrum antibiotics in the initial management of patients with severe sepsis or septic shock, and de-escalation of antibiotics to the most targeted regimen based on culture data. These recommendations are not based on robust clinical evidence, however, as randomized controlled trials have not been performed to rigorously assess their risks and bene ts.
ObjectiveTo assess the effects of de-escalating antibiotics on short- and longer-term mortality after culture results were available in patients with severe sepsis or septic shock.
DesignProspective observational trial at a single academic medical center from 2008 to 2012.
Discussion712 patients with severe sepsis (n=278) or septic shock (n=434) were evaluated during the 4-year study period. In total, 84 patients died before culture results were available and were excluded from analyses. Culture results were available for 76.7% of the 628 patients included in analysis. After culture results were available (on average 72 hours after admission), de-escalation of antibiotics was done for only 219 (34.9%) of patients. The respective in-hospital mortality rates for patients for whom antibiotics were de-escalated, not changed, or escalated were 27.4%, 32.6%, and 42.9% (P =0.006 for between-group differences). These differences were similar for ICU mortality and 90-day mortality. After correcting for potential confounders, de-escalation was found to be associated with decreased mortality as compared to not de-escalating antibiotic therapy (adjusted OR, 0.58; 95% con dence intervals [CI], 0.36 to 0.93). This association was also true for patients who received adequate initial empiric antibiotic therapy (403 patients), as de-escalation carried an adjusted OR of 0.54 (CI, 0.33 to 0.89). Propensity score-adjusted logistic regression corroborated these results, as the propensity score-adjusted OR for de-escalation was 0.57 (CI, 0.38 to 0.94).
ConclusionsDe-escalation of antibiotics when culture results are known is safe and may result in decreased mortality for patients with severe sepsis and septic shock.
Reviewer’s CommentsOveruse of broad-spectrum antibiotics increases health care costs and encourages drug resistance. However, it is unexpected that it might also kill the patients being treated. Knowledge of these adverse effects has not substantively changed practice, and overuse of broad-spectrum antibiotics remains common. Perhaps this study can lead some to change their practice and rationally de-escalate antibiotics when culture results indicate it is safe to do so. Although this study is an observational trial with risk of unmeasured confounders, it does add to the growing literature demonstrating increased mortality associated with failure to de-escalate antibiotics
CRITICAL REVIEW Journal Scan

JOURNAL OF PEDIATRIC CRITICAL CAREVol. 1 - No.4 October - December 2014 320
in patients with severe sepsis and septic shock. Considered from a different perspective, this and other studies demonstrate that failure to de-escalate may cause harm and increase mortality in our critically ill patients with sepsis.(Reviewer�–Jeremy B. Richards, MD, MA).
High Intraoperative Fluid Balance Associated With Increased Postoperative Mortality Critical Care Medicine - January 30, 2014 - Vol. 19 - No. 9
High intraoperative uid balance is associated with increased frequency of postoperative complications, including mortality.
Article ReviewedThe Effect of Excess Fluid Balance on the Mortality Rate of Surgical Patients: A Multicenter Prospective Study. Silva JM Jr, de Oliveira AM, et al: Crit Care; 2013;17 (December 10): R288.
BackgroundThe optimal strategy for intraoperative uid management is unknown. Since the type and means of administering uids has been shown to affect outcomes in other clinical settings, determining the effects of intraoperative uid balances on postoperative outcomes is important.
ObjectiveTo determine the effects of intraoperative uid balance on postoperative clinical outcomes, including organ dysfunction and mortality.
Design/MethodsThis was a multicenter prospective study in 4 ICUS at 3 hospitals in Brazil. Exclusion criteria included palliative surgery, limited life expectancy, renal disease, advanced congestive heart failure (NYHA class IV heart failure or an ejection fraction of <30%), and diabetes, among others.
Results479 patients who underwent surgery and were admitted to an ICU were enrolled in the study.
Patients who died after surgery (8.7% of the cohort) had a higher intraoperative uid balance than patients who did not die (non-survivors 1.95 L) (range of 1.4 to 3.4 L) versus survivors 1.4 L [1.0 to 1.6 L]). Not unexpectedly, patients who died were in general sicker than patients who survived, with higher ASA and SAPS-3 scores, both of which were statistically signi cantly higher in patients who died. In addition, patients with an intraoperative uid balance of >2.0 L had a statistically signi cantly longer ICU length of stay than patients who received <2.0 L (P<0.001). Postoperative infectious, neurological, respiratory, and cardiovascular complications were also statistically signi cantly higher in patients who received >2.0 L intraoperatively. These unadjusted observations were con rmed by multivariate regression analyses, as a high intraoperative uid balance was associated with an adjusted OR for death of 1.024 (con dence intervals, 1.007 to 1.041; P =0.006).
ConclusionsHigh intraoperative uid balance is associated with increased mortality, increased ICU length of stay, and increased postoperative complications.
Reviewer’s CommentsThis study is interesting, as the authors assessed intraoperative uid balance and not the total quantity of uid provided during surgery. The speci c calculation was the sum of crystalloids and/or colloids infused, minus urine output and estimated insensible losses (based on the type and duration of surgery performed.) Of note, estimated blood loss was explicitly not included in the determination of intraoperative uid balance due to �“variations that may occur among observers in computing blood loss.�” Not including estimated blood loss both makes sense (there is wide variation in this value between practitioners) and limits the study�’s results (massive hemorrhage would be nice to know about in considering intraoperative uid balance.) There are other issues with this study, including the exclusion of several patient populations such as diabetics, and the universal use of colloids, as all patients received approximately 500 cc of colloids intraoperatively for unclear reasons. Acknowledging this and other
CRITICAL REVIEW Journal Scan

JOURNAL OF PEDIATRIC CRITICAL CARE321Vol. 1 - No.4 October - December 2014
limitations, this is still an intriguing study, and further work to more rigorously characterize best practices for optimal intraoperative uid management strategies are clearly needed.(Reviewer�–Jeremy B. Richards, MD, MA).
Rapid Fingerprinting of Pathogens With Mass Spectrometry Critical Care Medicine - January 30, 2014 - Vol. 19 - No. 9
Partnering rapid identi cation of pathogens by mass spectrometry with an antimicrobial stewardship team may improve clinical outcomes in bloodstream infection.
Article ReviewedImpact of Rapid Organism Identi cation Via Matrix-Assisted Laser Desorption/Ionization Time-of-Flight Combined With Antimicrobial Stewardship Team Intervention in Adult Patients With Bacteremia and Candidemia. Huang AM, Newton D, et al: Clin Infect Dis; 2013;57 (November): 1237-1245.
BackgroundRapid identi cation of pathogens during bloodstream infection (BSI) is associated with improved patient outcomes. Emerging technologies, including mass spectrometry by matrix-assisted laser desorption/ionization time-of- ight (MALDI-TOF), have shown promise for providing accelerated pathogen identi cation. Antimicrobial stewardship teams (ASTs) that provide real-time advice to clinicians on positive cultures are also reported to yield better outcomes than standard laboratory reporting.
ObjectiveTo determine whether rapid MALDI-TOF identi cation of pathogens, partnered with AST intervention, yields better microbiological and clinical outcomes in BSI than conventional laboratory reporting.
DesignSingle-center, pre-post quasi-experimental study.
Participants501 adult patients with bacteremia or candidemia.
MethodsPatients with BSI identi ed by MALDI-TOF over a 3-month period (September to November 2012) were compared to a historical control group with conventional pathogen identi cation from the same 3 calendar months during the previous year. Positive gram stains were reported in real-time for both groups; during the MALDI-TOF period, an AST provided real-time culture alerts and antibiotic recommendations.
ResultsThe MALDI-TOF with AST strategy was associated with a reduction in time to pathogen identi cation (55.9 vs 84.0 hours; P <0.001), as well as in time to effective (20.4 vs 30.1 hours; P =0.021) and optimal (47.3 vs 90.3 hours; P <0.001) antibiotic therapy. On univariate analysis, there were also reductions in mortality (14.5% vs 20.3%), recurrent bacteremia (2.0% vs 5.9%), and length of intensive care unit stay (8.3 vs 14.9 days).
ConclusionsMALDI-TOF mass spectrometry identi cation of pathogens, partnered with AST intervention, decreased time to pathogen identi cation and to effective antibiotic therapy, and improved clinical outcomes.
Reviewer’s CommentsSimilar to other emerging methods for rapid pathogen identi cation, such as peptide nucleic acid- uorescence in situ hybridization (PNA-FISH) and nucleic acid microarrays, MALDI-TOF mass spectrometry shows great promise for improving microbiologic and clinical outcomes during infection. While PNA-FISH has been more extensively studied, MALDI-TOF is much less labor-intensive and allows facile identi cation of a much broader array of pathogens, suggesting it may be the more easily acquired technology. The ndings of the present study are consistent with those of 3 prior observational studies of MALDI-TOF. It is dif cult to know the relative degree to which MALDI-TOF versus AST affected outcomes in this trial; indeed
CRITICAL REVIEW Journal Scan

JOURNAL OF PEDIATRIC CRITICAL CAREVol. 1 - No.4 October - December 2014 322
the investigators found that clinician acceptance of an AST intervention was independently associated with a trend toward reduced mortality on multivariate analysis. In addition, this non-randomized, historically controlled trial is subject to several possible biases. Nonetheless, taken together with past reports, this study strongly suggests that AST initiatives, partnered with best practices for rapid pathogen identi cation, should be optimized and strongly encouraged as standard of care. (Reviewer�–Michael B. Fessler, MD).
Focused US Increases Diagnostic Accuracy for Acute Respiratory Symptoms Critical Care Medicine - January 30, 2014 - Vol. 19 - No. 9
Focused ultrasonography aids in diagnosing potentially life-threatening illness in patients presenting to the emergency department.
Article ReviewedFocused Sonography of the Heart, Lungs, and Deep Veins Identi es Missed Life-Threatening Conditions in Admitted Patients With Acute Respiratory Symptoms. Laursen CB, Sloth E, et al: Chest; 2013;144 (December 1): 1868-1875.
BackgroundIn patients with acute but nonspeci c respiratory symptoms, diagnostic accuracy is essential to quickly institute appropriate therapy. Moreover, delayed diagnosis slows therapy and worsens outcomes. Sonography might be a useful extension of the initial clinical exam in such patients.
ObjectiveTo evaluate the ability of focused ultrasonography (US) to identify potentially life-threatening illnesses at presentation of acute respiratory illness.
DesignProspective observational study.
ParticipantsPatients presenting to a single university medical
center in Denmark over a 6-month period.
MethodsEmergency department (ED) patients with tachypnea, hypoxia, dyspnea, cough, and chest pain were eligible if they were aged >18 years and had focused US within 1 hour of presentation. ED physicians made a primary assessment based on routine history, physical, and diagnostic testing. Subsequently, all included patients underwent 3 US evaluations: focused assessed transthoracic echocardiography, focused lung US, and limited compression ultrasonography whose descriptions are outlined in the paper. The US exams were performed by a single investigator. Primary assessment was compared to US assessment diagnoses, and the gold standard was a chart audit after discharge.
Results139 of 342 screened patients were included. Primary assessment yielded the correct diagnosis 59.6% of the time. Isolated focused US identi ed 44.3% of the correct diagnoses; however, the focused US also identi ed 26 patients (19%) with a prede ned potentially life-threatening diagnosis that was missed on the primary assessment. In total, 73% of these potentially life-threatening diagnoses were con rmed by chart audit. The focused US was performed in 12 minutes (interquartile range, 11 to 14 minutes), and a complete exam was achieved on 96% of patients. For focused US, the positive predictive value was 76.7% and the negative predictive value was 100% in determining prede ned life-threatening diagnoses.
ConclusionsFocused US of the heart, lungs, and deep veins is a fast, accurate way to determine potentially life-threatening illnesses in patients with acute respiratory illness.
Reviewer’s CommentsThis is another study that supports the use of ultrasonography in patients with acute illness. Although the single test does not perform as well as a primary clinical assessment, focused US was able to diagnose signi cant illness where recognition otherwise may have been delayed. The US test was fast to perform, but the single operator had extensive
CRITICAL REVIEW Journal Scan
JOURNAL OF PEDIATRIC CRITICAL CARE323Vol. 1 - No.4 October - December 2014
experience. This may limit generalizability of the ndings, which are critically dependent on the skill of the ultrasonographer and perhaps the lack of skill of the ED physicians. This investigation suggests that, with proper training and experience, focused US as part of a primary assessment of patients with acute respiratory illness augments diagnostic accuracy and may identify potentially life-threatening illness early. However, it was an uncontrolled and purely observational study. The conclusions are limited; US was fast and accurate. Its impact on clinical outcomes remains speculative.(Reviewer�–Jeffrey B. Hoag, MD, MS).
Can We Afford ECMO? Critical Care Medicine - January 30, 2014 - Vol. 19 - No. 9
Extracorporeal membrane oxygenation is an extremely resource-intensive salvage therapy that remains in clinical practice without the support of good clinical evidence.
Article ReviewedResource Use Trends in Extracorporeal Membrane Oxygenation in Adults: An Analysis of the Nationwide Inpatient Sample 1998-2009. Maxwell BG, Powers AJ, et al: J Thorac Cardiovasc Surg; 2013;(October 31): epub ahead of print.
BackgroundExtracorporeal membrane oxygenation (ECMO) is a well-established but expensive salvage therapy for respiratory failure. The costs and trends in use warrant consideration.
ObjectiveTo examine the temporal trends and costs associated with ECMO use in the U.S.
DesignHealth insurance database study.
ParticipantsPatients receiving ECMO in the U.S. between 1998 and 2009.
MethodsThe Nationwide Inpatient Sample (NIS) database was examined for trends in ECMO use over study period. The NIS provides insurance-based data on approximately 20% of all U.S. admissions.
ResultsThe study included 8753 admissions involving ECMO. Costs associated with ECMO increased from $109 million in 1998 to $765 million in 2009. The per-patient charges and length of stay increased over this time as well as in-hospital mortality, which rose from 33% in 1998 to 53% in 2009. These changes seemed related to changes in case-mix, a lower proportion of post-cardiomyotomy cases, and more cases involving cardiogenic shock, respiratory failure, and lung transplant. Mean post-cardiotomy hospital charges were $273,429 ± $31,361 whereas charges in the setting of heart transplant were $722,123 ± $57,494 and lung transplant were $702,973 ± $50,502. Overall in-hospital mortality associated with ECMO cases was 51% and discharges to location other than home were common at 58.6%, and were highest at 78.9% in association with lung transplantation.
ConclusionsThe dramatic increase in health care expenditures associated with ECMO was not entirely attributable to increases in volume. Changes in case-mix have resulted in higher costs and worse outcomes.
Reviewer’s CommentsIn light of the Affordable Care Act, there is increasing attention paid to the costs of health care. The current study is timely; ECMO may be unaffordable care. Enthusiasm for ECMO as a salvage therapy for refractory lung failure surged after the controversial CESAR trial was published in 2009. It is therefore likely that the temporal trends described in this paper continued or accelerated. Currently, ECMO should be considered a very expensive therapy outside of evidence-based medicine. While potentially promising, the optimal role of ECMO remains to be determined.(Reviewer�–Robert Michael Reed, MD).
CRITICAL REVIEW Journal Scan
JOURNAL OF PEDIATRIC CRITICAL CAREVol. 1 - No.4 October - December 2014 324
Critical ! inkingPICU Quiz
Praveen Khilnani, MD FCCMDirector Pediatric critical care and pulmonology BLK Superspeciality hospital.New Delhi
Question 1:Which of the following effects is least likely to be mediated by atrial natriuretic peptide on the kidneys?A) A direct increase in efferent arteriolar resistance
with a net increase in glomerular ltrationB) Direct natriuresis resulting from inhibition of
sodium transport in the medullary collecting ductC) Indirect natriuresis resulting from inhibition of
aldosterone release from the zona glomerulosa of the adrenal gland
D) A direct decrease in afferent arteriolar resistance resulting in an increase in renal blood ow
E) An indirect increase in efferent arteriolar resistance via activation of the renin-angiotensin system
Question 2:A 14-year-old boy sustains signi cant blunt abdominal trauma when hit by a motor vehicle while riding his bicycle. Following adequate resuscitation with multiple blood products and crystalloid, he has signi cant abdominal distension and oliguria with increasing serum potassium on serial measurements. Which of the following is the least likely to be a cause of hyperkalemia?A) Decreased glomerular ltering of potassium due to an overall decrease in the glomerular ltration rateB) Hypoxemic injury to the renal tubule and impaired potassium excretionC) Activation of the renin-angiotensin-aldosterone axis with increased tubular reabsorption of potassiumD) Metabolic acidosis with cellular exchange of intracellular potassium for hydrogen ionE) Increased potassium load from tissue catabolism
Question 3: A 9-month-old boy presents with dif culty breathing. His mother states that he has been treated for croup twice already with similar symptoms. He has had 2 days of upper respiratory tract infection symptoms
and now has expiratory stridor on examination. Which of the following is correct?A) Croup (viral laryngotracheobronchitis) is
typically characterized by expiratory stridorB) Intrathoracic airway obstruction is typically
worse during inspirationC) Extrathoracic airway obstruction is typically
worse during inspirationD) Croup (viral laryngotracheobronchitis) is typically
characterized by intrathoracic airway obstruction
Question 4:A 12-year-old boy with acute respiratory distress syndrome is being mechanically ventilated in synchronized intermittent mandatory ventilation pressure control/pressure support mode with peak inspiratory pressures of 28 mm Hg, positive end-expiratory pressure of 12 mm Hg, FIO2 of 0.60, and rate of 15/min. Arterial blood gas analysis shows PaCO2 of 60 mm Hg, and PaO2 of 60 mm Hg. His respiratory quotient is 0.8, core body temperature is 37°C (98.5°F), and barometric pressure is 747 mm Hg. What is this patient�’s PAO2-PaO2 difference?A) 285 mm HgB) 300 mm HgC) 345 mm HgD) 360 mm HgE) Cannot be determined
Question 5:A patient with acute respiratory distress syndrome has been managed with high-frequency oscillatory ventilation for the past 2 hours. A blood gas study shows pH of 7.48, PaCO2 of 30 mm Hg, PaO2 of 70 mm Hg, bicarbonate level of 22 mEq/L, and oxygen saturation of 97% on a FIO2 of 60%. Which of the following is the most appropriate intervention?A) Wean the mean airway pressure.B) Increase the delta P.

JOURNAL OF PEDIATRIC CRITICAL CARE325Vol. 1 - No.4 October - December 2014
C) Decrease the frequency.D) Increase the mean airway pressure.E) Increase the frequency.
Question 6:A patient is admitted following an elective posterior spinal fusion. Besides kyphoscoliosis, the only pertinent history is sulfamethoxazole/trimethoprim allergy. In the operating room, he received packed red blood cells, 3 U; platelets, 4 U; and crystalloid uid, 6 L, with only 2.4 L of urine output. He is admitted to the pediatric ICU on mechanical ventilation due to persistent hypoxemia. His admission chest radiograph shows diffuse pulmonary edema, so he is given a dose of furosemide. In the next 30 minutes he develops tachycardia, bronchospasm, and diffuse ushing. Which of the following is the most likely cause of his decompensation?A) Inadvertent administration of an aminoglycoside
for postoperative wound prophylaxisB) Allergic reaction to furosemideC) Transfusion reactionD) Worsening pulmonary edema from transfusion-
related acute lung injuryE) Aspiration pneumonia
Question 7:A 2-year-old, acyanotic infant with tetralogy of Fallot undergoes elective repair with ventricular septal defect closure and right ventricle-to-pulmonary artery conduit placement, but a restrictive patent foramen ovale is not addressed. Four hours after being admitted postoperatively, she develops tachycardia with hypotension despite a central venous pressure of 20 mm Hg and hypoxemia. Her arterial blood gas analysis shows pH of 7.28, PaCO2 of 55 mm Hg, PaO2 of 50 mm Hg, bicarbonate level of 23 mEq/L, and base excess of �–0.1 mEq/L.The most appropriate next maneuver is:A) Sedation with fentanyl, 2 g/kgB) Opening her sternotomy incisionC) Initiation of cooling and administration of
amiodaroneD) Giving 5% albumin solution, 20 mL rapid IV pushE) Hyperventilation with 100% oxygen
Question 8: A 6-month-old infant is admitted to the pediatric ICU with the con rmed diagnosis of Klebsiella pneumoniae meningitis. Antibiogram pro le shows the organism to be an extended-spectrum beta-lactamase-positive strain that is sensitive to extended-spectrum penicillins, second-generation and third-generation cephalosporins, and aminoglycosides. The most appropriate long-term course of antibiotic therapy would include:A) GentamicinB) CeftazidimeC) ClindamycinD) Cefuroxime
Question 9: An obtunded, 2-year-old boy presents to the emergency department with a BP of 70/20 mm Hg, HR of 200/min, and temperature of 40.1°C (104.1°F). He has the ecchymotic lesions pictured in the Figure on his trunk and extremities.Which of the following statements is incorrect?A) Absence of meningitis (>20 WBCs/ L in
cerebrospinal uid) is associated with a poorer outcome.
B) Carriage of the organism in the nasopharynx is common.
C) Presence of petechiae for less than 12 hours prior to admission is associated with a favorable outcome.
D) Prior infections with in uenza A or B have been associated with increased susceptibility to this organism.
E) Association of thrombocytopenia is common.
Question 10:A child with acute respiratory distress syndrome is receiving mechanical ventilation with the following settings: mode, pressure-regulated; volume control, 8 mL/kg; plateau pressure, 30 cm H2O; mean airway pressure, 20 cm H2O; positive end-expiratory pressure, 10 cm H2O; FIO2, 0.5; rate, 22/min; inspiratory time, 0.7 seconds. The associated arterial blood gas measurements are pH, 7.36; PaO2, 106 mm Hg; PaCO2, 45 mm Hg; bicarbonate, 25 mEq/L.Which of the following will most adversely affect the oxygenation index?
CRITICAL THINKING PICU Quiz

JOURNAL OF PEDIATRIC CRITICAL CAREVol. 1 - No.4 October - December 2014 326
A) Need to increase mean airway pressure to 25 cm H2O to generate the same blood gas data
B) Drop in PaO2 to 80 mm Hg with no changes in ventilator settings
C) Need to increase the ventilator rate to 30/min to generate the same blood gas data
D) Need to increase FIO2 to 0.60 to generate the same blood gas data
E) Increase in PaCO2 with no changes in ventilator settings
QUIZ Answers and explanantions
1. Answer ERationale:Atrial natriuretic peptide directly decreases the afferent arteriolar resistance and inhibits the activity of the renin-angiotensin axis, thereby indirectly resulting in decreased afferent arteriolar resistance and an increase in renal blood ow. Increased efferent arteriolar resistance is a direct effect of atrial natriuretic peptide that somewhat counteracts the increase in renal blood ow, but results in increased glomerular pressures and increased glomerular ltration rate. Natriuresis is accomplished directly by the action of atrial natriuretic peptide on sodium reabsorption in the medullary collecting duct, and indirectly by the inhibition of aldosterone release from the adrenal gland.
2. Answer C Rationale:Activation of the renin-angiotensin-aldosterone axis may occur due to decreased renal blood ow or reduced tubular ef uent ow; however, the activity of aldosterone in the intact kidney is to reabsorb sodium ion at the expense of potassium ion, thereby resulting in hypokalemia. The most common causes of hyperkalemia in acute renal failure are as follows:�• Reduction in the glomerular ltration rate, thereby
limiting the glomerular ltration of potassium ion�• Decreased secretion of potassium due to direct
injury to the renal tubular cells (acute tubular necrosis)
�• Metabolic acidosis due to azotemia or lactic acid, resulting in the exchange of intracellular potassium ion for extracellular hydrogen ion
�• Increased tissue catabolism or tissue necrosis with the resultant release of potassium ion
�• Exogenous administration of potassium ion, such as may occur with transfusion of multiple blood products
3. Answer C Rationale:Intrathoracic airway (ie, distal trachea, bronchi, bronchioles) obstruction is typically worse during expiration. Therefore, tracheobronchomalacia and bronchiolitis are characterized by expiratory stridor and wheezing, respectively. In contrast, extrathoracic airway (ie, larynx, proximal trachea) obstruction is typically worse during inspiration. Croup is therefore characterized by inspiratory stridor.
4. Answer A Rationale:PAO2 is calculated using the alveolar gas equation (PB, barometric pressure; PH2O, water vapor pressure; RQ, respiratory quotient):PAO2 = FIO2 (PB �– PH2O) �– PaCO2/RQThe water vapor pressure (PH2O) at a temperature of 37°C (98.5°F) is 47 mm Hg. Therefore, PaO2 =0.60 (747 �– 47) - 60/0.8 = 420 �– 75 = 345 mm HgThe PAO2 �– PaO2 difference is then 345 mm Hg �– 60 mm Hg, or 285 mm Hg.
5. Answer ERationale:High-frequency oscillatory ventilation (HFOV) has become an increasingly utilized tool in the management of severe hypoxemic respiratory failure. A modest number of variables are under control of the practitioner that allow support for oxygenation and/or ventilation. The blood gas analysis demonstrates a respiratory alkalosis (pH will decrease by 0.08 for every 10 mm Hg change in PaCO2 from a normal value). As a result, the patient is currently being overventilated, and an alteration that results in decreased ventilation is indicated. It is important to recall that ventilation is inversely proportional to the frequency (Hz). Therefore, to decrease ventilation, one would increase the frequency. Increasing the delta P would increase the ventilation further. Changing the mean airway pressure (MAP) would have little
CRITICAL THINKING PICU Quiz

JOURNAL OF PEDIATRIC CRITICAL CARE327Vol. 1 - No.4 October - December 2014
in uence on ventilation. The patient continues to have a marginally accepted PaO2 (70 mm Hg) while on an FIO2 of 60%; therefore, it is premature to consider weaning the MAP at this time. Since the patient has only been managed for 2 hours and the PaO2 remains acceptable, increasing the MAP is not indicated at this time. High-frequency oscillatory ventilation is used predominantly for hypoxemic respiratory failure and persistent, severe air leaks. Its effect on ventilation is often unpredictable.Two parameters regulate oxygenation:�• FIO2�• MAP: increase MAP to increase PaO2 Two parameters regulate ventilation:�• Delta P or amplitude: increase delta P to increase
carbon dioxide.�• Frequency: increase frequency to DECREASE
ventilation/carbon dioxide.�• Remember that frequency goes in the direction you
want your carbon dioxide to go.CvO2 = (13.5 × 1.36 × 0.56) + (0.003 × 30) = 10.37 mL/dLRecall that respiratory quotient (RQ) is the ratio of VCO2 to VO2 such that,VO2 = VCO2/RQ or here: VO2 = 236 mL/min/0.76 = 310 mL/minAs a result: cardiac output = 310 mL/min/([17.52 �– 10.37 mL/dL]) × 100 = 4.3 L/minFick principle is frequently used to measure cardiac output using oxygen content differences in systemic and pulmonary circulations:�• Cardiac Output = Oxygen Uptake/(Arterial
Oxygen �– Venous Oxygen)Remember conversion of units is crucial here: CaO2 and CvO2 are most commonly calculated as mL/dL, so to convert to L/min, the product must be multiplied by 100 (number of dL in L).
6. Answer B Rationale:Recall that furosemide is a member of the sulfa family of drugs (similar to cotrimoxazole). The timing of the reaction (within 30 minutes of drug administration) is typical for allergic reactions. The symptomatology is consistent with acute release of histamine from triggered mast cells causing
ushing, vasodilation (hence the tachycardia), and bronchospasm. Transfusion-related acute lung injury can manifest with pulmonary edema and persistent hypoxemia, though this is rarely associated with the allergic manifestations described in this case. Acute transfusion reactions can present with these manifestations, but the timing is much more proximate to the timing of the blood product transfusion. There would be no reason that an aminoglycoside should trigger an allergic reaction in a sulfa-allergic patient.
7. Answer ERationale:It is imperative to familiarize oneself with anticipated postoperative complications following speci c repairs of congenital heart lesions. Bleeding with tamponade and arrhythmias can potentially complicate every postoperative course. In the setting of acyanotic (so-called �“pink�”) tetralogy, the pulmonary vasculature is under both increased pressure and ow due to the ventricular septal defect-like physiology with little obstructive physiology. These patients are at risk for acute pulmonary hypertensive crises (PHCs) characterized by acute hypotension with concurrent elevation in the central venous pressure (and pulmonary artery pressure, if being monitored). Several causes can trigger an acute PHC, including hypovolemia, agitation, hypoxia, and/or hypercapnia. In this case, the patient�’s arterial blood gas analysis shows a respiratory acidosis, which can profoundly effect pulmonary vascular resistance by increasing it. The quickest maneuver one can perform in this setting that may be of substantial bene t is to reverse this with hyperventilation. Also, the addition of 100% oxygen is a potent vasodilator, which may acutely aid in decreasing pulmonary vascular resistance. Opening the chest may be indicated ultimately, but would not be the rst thing to attempt. Fluid administration to increase right ventricular preload will help with PHC, but this too will take time to obtain and intravenously push. Junctional ectopic tachycardia can be a frequent complication following repairs of congenital lesions associated with right ventricular hypertrophy. Sedation, cooling, and amiodarone can control the rate of junctional ectopic tachycardia; however, this diagnosis and therapy will take additional inquiry of the electrocardiographic strips and time. While all these maneuvers may be
CRITICAL THINKING PICU Quiz
JOURNAL OF PEDIATRIC CRITICAL CAREVol. 1 - No.4 October - December 2014 328
necessary and/or indicated, the rst response should be immediate reversal of the respiratory acidosis and provision of 100% oxygen, which can be achieved almost immediately.
8. Answer ARationale:Appropriate antibiotic coverage is critical to successful treatment of acute bacterial meningitis. Gram-negative meningitis may require an antibiotic course as long as 3 weeks. Antibiotic resistance has become a real issue in both community and hospital clinical settings. The Klebsiella strain described in this scenario is noted to be extended-spectrum beta-lactamase positive. Although its antibiogram shows sensitivity to beta-lactam antibiotics, it is at high risk for becoming a resistant strain. Aminoglycosides are not affected by beta-lactamases. Clindamycin is not appropriate for gram-negative infections.
9. Answer C Rationale:Neisseria meningitidis sepsis can produce rapidly developing septic shock. The pictured patient had classic purpura fulminans caused by N meningitidis. This organism is usually endemic and is commonly carried in the nasopharynx. Infection is more common in males and following in uenza infections.
10 Answer B Rationale:Oxygenation Index = FIO2 × mean airway pressure (MAP)/PaO2 has been used to assess risk of ventilator-associated injury associated with barotraumas and oxygen toxicity and to identify appropriate candidates for extracorporeal life support. Baseline oxygenation index above (0.5 x 20 x 100)/106= 9.4a. (0.5 x 25 x 100)/106 = 11.8b. (0.5 x 20 x 100)/80 = 12.5c. (0.5 x 20 x 100)/106 = 9.4d. (0.6 x 20 x 100)/106 = 11.3e. (0.5 x 20 x 100)/106 = 9.4
CRITICAL THINKING PICU Quiz

JOURNAL OF PEDIATRIC CRITICAL CARE329Vol. 1 - No.4 October - December 2014

JOURNAL OF PEDIATRIC CRITICAL CAREVol. 1 - No.4 October - December 2014 330 JOURNAL OF PEDIATRIC CRITICAL CAREVol. 1 - No.4 October - December 2014 330