ispe’s process capability team · pdf fileispe process validation conference 12...
TRANSCRIPT

ISPE Process Validation Conference12 – 14 September 2017
Bethesda, MD
1
INDUSTRY MATURITY IN THE ASSESSMENT AND USE OF PROCESS CAPABILITY
Arne ZilianHead MS&T Processes & StandardsNovartis Pharma AG
Process Validation Statistics Conference12 – 15 September 2017
Connecting Pharmaceutical Knowledge ispe.org
ISPE’s Process Capability Team
PQLIISPE Process
Capability Team
1 - Performance and ComplianceApplications
2 - Statistical Considerations
3 - Maturity Model Development
Team Goals (per Team Charter):• To develop a position on process capability as a performance and/or compliance metric
• Reportable to FDA to support a risk-based inspection program as outlined in sections 705 to 706 of US Food and Drug Administration Safety and Innovation Act (FDASIA).
• Acceptable to industry, addressing challenges for implementation.• To communicate this position & gain support for implementation across pharmaceutical
companies via: • A series of articles and/or white papers.• Potential baseline guide.• Sessions at ISPE and other meetings.
2

ISPE Process Validation Conference12 – 14 September 2017
Bethesda, MD
2
Connecting Pharmaceutical Knowledge ispe.org
1. Performance and Compliance Applications. Self-audit of process performance helps to prioritize improvements
• Embed a product robustness review process in the organization(at site level/ supply chain end-to-end/ for overall product portfolio)
2. Statistical Considerations. Process Capability is an easy and meaningful metric to capture and report but there are challenges:
• Real life is drastically different from textbook examples
• Difficult to predict failures using Cpk/Ppk
• Many failures are not related to Cpk/Ppk
3. Maturity Model Development.Such a model can be used to guide through the implementation journey
• Survey was conducted to assess where companies are today, where they want to be
• Common opportunities for improvement have been identified
3
Goal: Improve Quality and Ensure Reliable Supply.
Connecting Pharmaceutical Knowledge ispe.org 4
Process Capability Indices: The Good, The Bad, and The Ugly
ASTM defines process capability as the natural or inherent behavior of a stable process that is in a state of statistical control, which is achieved when the process exhibits no detectable patterns or trends. (ASTM E2281). Statistical tools such as control charts are utilized in the determination of process capability, however capability indices are often commonly used.
The Good: Dimensionless index which can be used to compare across products, attributes, etc.The Bad: Highly dependent on meaningful specifications and “well-behaved” data sets. The Ugly: Process Capability is not the whole story. Complexity associated with practical application of these tools limits their effectiveness as a compliance requirement.

ISPE Process Validation Conference12 – 14 September 2017
Bethesda, MD
3
Connecting Pharmaceutical Knowledge ispe.org 5
Three Levels of Product Robustness Monitoring Rely on Associates with Product Understanding
3. Quarterly Portfolio ReviewSr. Management Scorecard looking at all sites and products
2. End to End Product Reviews--Cross functional team across Drug Substance, Drug Product, Analytical, Stability and Quality
--Deeper Statistical Analysis applied to Hot Spots
1. Drug Product Manufacturing Site -Approximately Monthly inter batch data reviews
-Voice of the Process at the Shop Floor
-Site Focused…but also feeds data upward0
10
20
30
40
50
60
70
80
90
100
Attribute X
Connecting Pharmaceutical Knowledge ispe.org 6
Product Robustness Involves Many Elements
Bika, D., Walsh, J., Nestor, T., and Allenspach, C. “Product Robustness: A comprehensive Product Quality Strategy”, AAPS Newsmagazine, p 16-19, August 2015.
ISPE Process Validation Conference12 – 14 September 2017
Bethesda, MD
4
Connecting Pharmaceutical Knowledge ispe.org 7
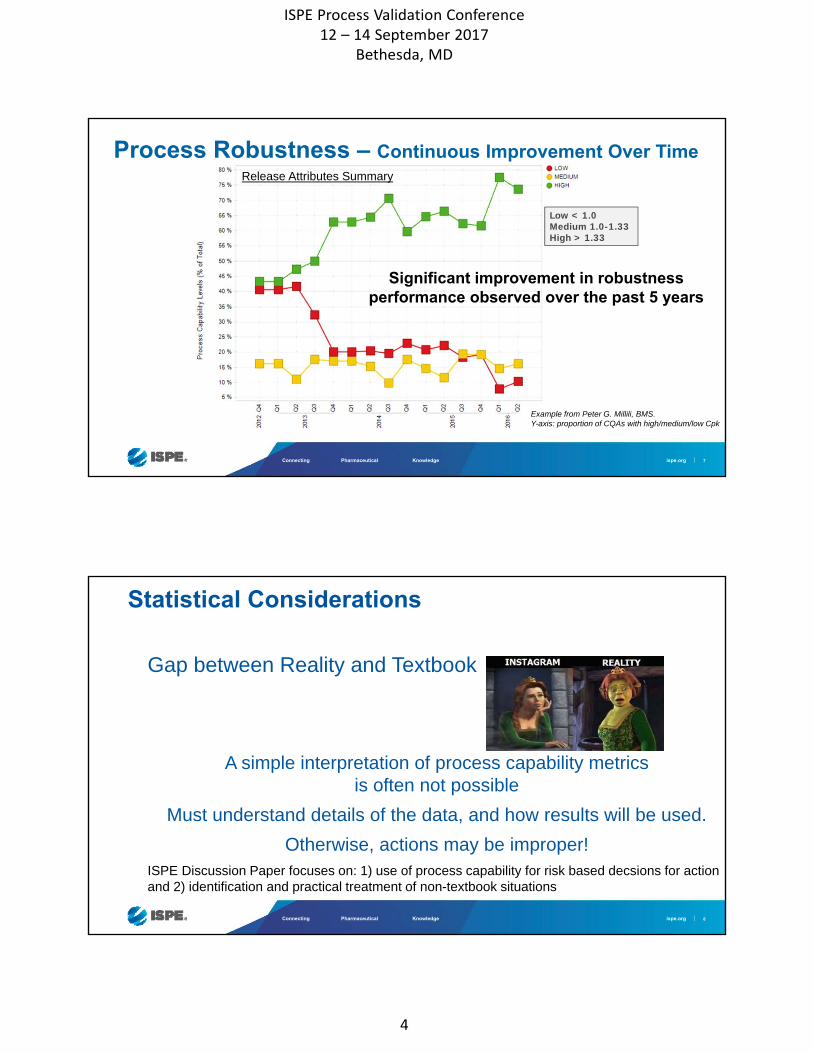
Process Robustness – Continuous Improvement Over Time
Low < 1.0Medium 1.0-1.33High > 1.33
Significant improvement in robustness performance observed over the past 5 years
Release Attributes Summary
Example from Peter G. Millili, BMS.Y-axis: proportion of CQAs with high/medium/low Cpk
Connecting Pharmaceutical Knowledge ispe.org
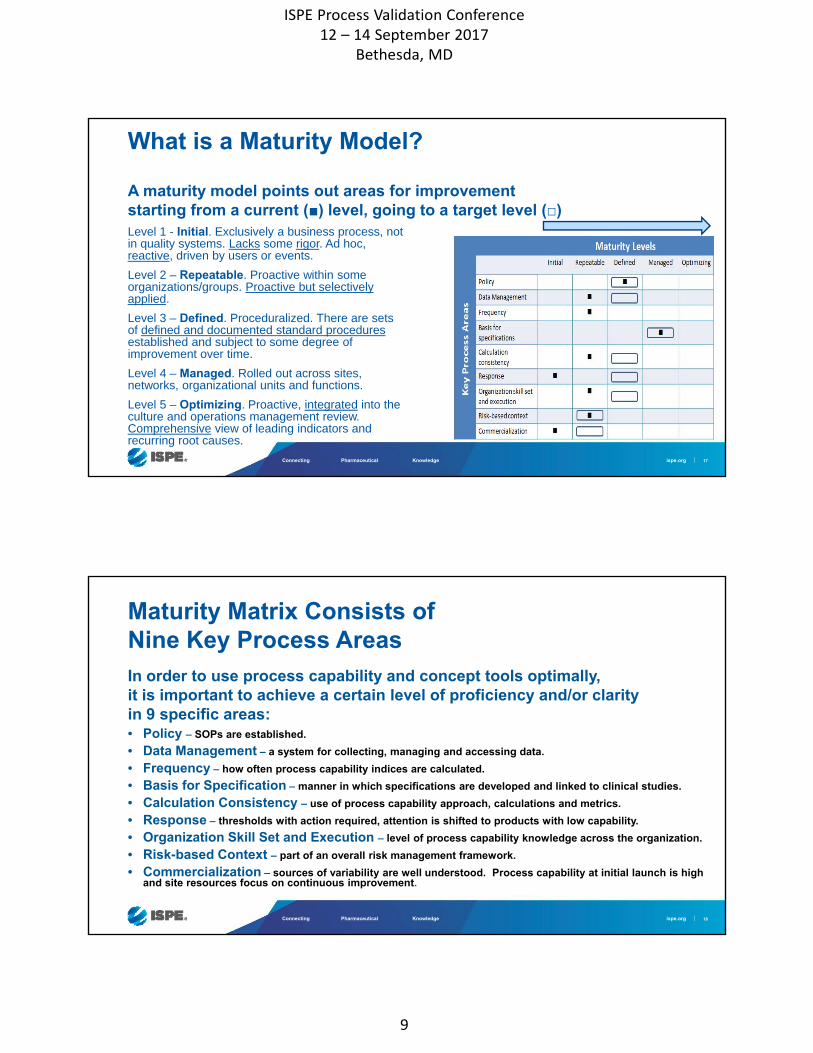
Gap between Reality and Textbook
A simple interpretation of process capability metrics is often not possible
Must understand details of the data, and how results will be used.
Otherwise, actions may be improper!ISPE Discussion Paper focuses on: 1) use of process capability for risk based decsions for action and 2) identification and practical treatment of non-textbook situations
8
Statistical Considerations

ISPE Process Validation Conference12 – 14 September 2017
Bethesda, MD
5
Connecting Pharmaceutical Knowledge ispe.org 9
Using Ppk for Risk Based Decision for Action
DRAFT
Here risk is acceptable hence no further action required.
Here risk is negligible hence no further action required.
Further analysis required. Maybe action required to remediate risk. Maybe accept risk based on cross-functional review.
Select relevant CQA and IPC
Connecting Pharmaceutical Knowledge ispe.org 10
Statistical Considerations: Textbook Example
28252219161310741
105
100
95
Indi
vidu
al V
alue
_X=99.05
UCL=103.73
LCL=94.36
28252219161310741
5.0
2.5
0.0
Mov
ing
Rang
e
__MR=1.763
UCL=5.760
LCL=0
3025201510
104
100
96
Observation
Valu
es
1041021009896
LSL 95USL 105
Specifications
LSL USL
OverallWithin
102.5100.097.595.0
StDev 1.563Cp 1.07Cpk 0.86PPM 4881.59
WithinStDev 1.527Pp 1.09Ppk 0.88Cpm *PPM 4080.77
OverallOverall
Within
Specs
Process Capability Sixpack Report for AssayI Chart
Moving Range Chart
Last 25 Observations
Capability Histogram
Normal Prob PlotAD: 0.565, P: 0.131
Capability Plot

ISPE Process Validation Conference12 – 14 September 2017
Bethesda, MD
6
Connecting Pharmaceutical Knowledge ispe.org
• Small data sets
• Small number of unique values, including case with many values less than LOQ
• Non-independence resulting from non-random use of sources of variability
• Non-normality
• Specifications based on process performance, not customer driven (clinically relevant)
11
Statistical Considerations - Reality
Connecting Pharmaceutical Knowledge ispe.org 12
Process Shifts Due to Non Random Use of Sources of Variability
1361211069176614631161
0.310
0.305
0.300
0.295
Observation
Indi
vidu
al V
alue
_X=0.29755
UCL=0.30031
LCL=0.29479
1 2 3 4 5 6 7
0.31
1
1
11
I Chart of CQA4 by Batch
15413712010386695235181
0.305
0.300
0.295
Indi
vidu
al V
alue
_X=0.30138
UCL=0.30423
LCL=0.29853
15413712010386695235181
0.0050
0.0025
0.0000
Mov
ing
Rang
e
__MR=0.001073
UCL=0.003505
LCL=0
170165160155150
0.3000
0.2975
0.2950
Observation
Valu
es
0.3090.3060.3030.3000.2970.294
USL 0.31Specifications
USL
OverallWithin
0.310.300.29
StDev 0.0009510Cp *Cpk 3.02PPM 0.00
WithinStDev 0.003982Pp *Ppk 0.72Cpm *PPM 15184.78
OverallOverall
Within
Specs
11111111211
111111
1111111
1111111
2222222122222
11
2
111
1111111
11
11
1
111
2222222
121111111
1111
222111222
111
22
111111111
11111111111111111
11
1
11
1
1
22222
Process Capability Sixpack Report for CQA4I Chart
Moving Range Chart
Last 25 Observations
Capability Histogram
Normal Prob PlotAD: 2.221, P: < 0.005
Capability Plot

ISPE Process Validation Conference12 – 14 September 2017
Bethesda, MD
7
Connecting Pharmaceutical Knowledge ispe.org 13
Process Shifts Due to Non Random Use of Sources of Variability
15413712010386695235181
24
22
20
Indi
vidu
al V
alue
_X=20.583
UCL=22.614
LCL=18.552
15413712010386695235181
2
1
0
Mov
ing
Rang
e
__MR=0.764
UCL=2.495
LCL=0
170165160155150
22.5
21.0
19.5
Observation
Valu
es
24232221201918
LSL 18USL 24
Specifications
LSL USL
OverallWithin
24222018
StDev 0.6769Cp 1.48Cpk 1.27PPM 68.05
WithinStDev 0.9725Pp 1.03Ppk 0.89Cpm *PPM 4172.60
OverallOverall
Within
Specs
22
2222
2221
2
111
2
11
222
222
1
22
Process Capability Sixpack Report for CQA3I Chart
Moving Range Chart
Last 25 Observations
Capability Histogram
Normal Prob PlotAD: 1.164, P: < 0.005
Capability Plot
17015313611910285685134171
24
23
22
21
20
19
18
Index
CQA3
18
24
Time Series Plot of CQA3
Connecting Pharmaceutical Knowledge ispe.org 14
Data with underlying non-normal distribution
17215313411596775839201
80
40
0Indi
vidu
al V
alue
_X=16.2
UCL=47.7
LCL=-15.3
17215313411596775839201
50
25
0
Mov
ing
Rang
e
__MR=11.84
UCL=38.67
LCL=0
190185180175170
50
25
0
Observation
Valu
es
75604530150
USL 50Specifications
USL
OverallWithin
80400
StDev 10.49Cp *Cpk 1.07PPM 634.04
WithinStDev 12.48Pp *Ppk 0.90Cpm *PPM 3371.31
OverallOverall
Within
Specs
111
1
11
222
1
1
11
22222
11
111
2222
2222
11
Process Capability Sixpack Report for Tailings (kg)I Chart
Moving Range Chart
Last 25 Observations
Capability Histogram
Normal Prob PlotAD: 9.722, P: < 0.005
Capability Plot
CQA 5
17215313411596775839201
4
2
0
Indi
vidu
al V
alue
_X=2.539
UCL=4.552
LCL=0.527
17215313411596775839201
2
1
0
Mov
ing
Rang
e
__MR=0.757
UCL=2.472
LCL=0
190185180175170
3.5
2.5
1.5
Observation
Valu
es
4.23.63.02.41.81.2
USL* 3.91202Specifications
USL*
OverallWithin
4.53.01.50.0
StDev 0.6709Cp *Cpk 0.68PPM 20376.38
WithinStDev 0.6969Pp *Ppk 0.66Cpm *PPM 24448.85
OverallOverall
Within
Specs
2
Process Capability Sixpack Report for Tailings (kg)Using Box-Cox Transformation With λ = 0
I Chart
Moving Range Chart
Last 25 Observations
Capability Histogram
Normal Prob PlotAD: 0.242, P: 0.767
Transformed Capa Plot
CQA 5

ISPE Process Validation Conference12 – 14 September 2017
Bethesda, MD
8
Connecting Pharmaceutical Knowledge ispe.org
• Influence of Measurement Variability
• Manipulated Data
• Survey of Other Methods
15
Statistical Considerations - Other Topics
Connecting Pharmaceutical Knowledge ispe.org
As shown in the example, continuous improvement success comes after a multi- year effort.
During the course of the program,
• Sponsor and workstream leaders may change
• Culture changes slowly
• Systems contribute to inertia
• New ways of working need to be implemented
A compass is needed to find true north
16
Why a Maturity Model?
ISPE Process Validation Conference12 – 14 September 2017
Bethesda, MD
9
Connecting Pharmaceutical Knowledge ispe.org
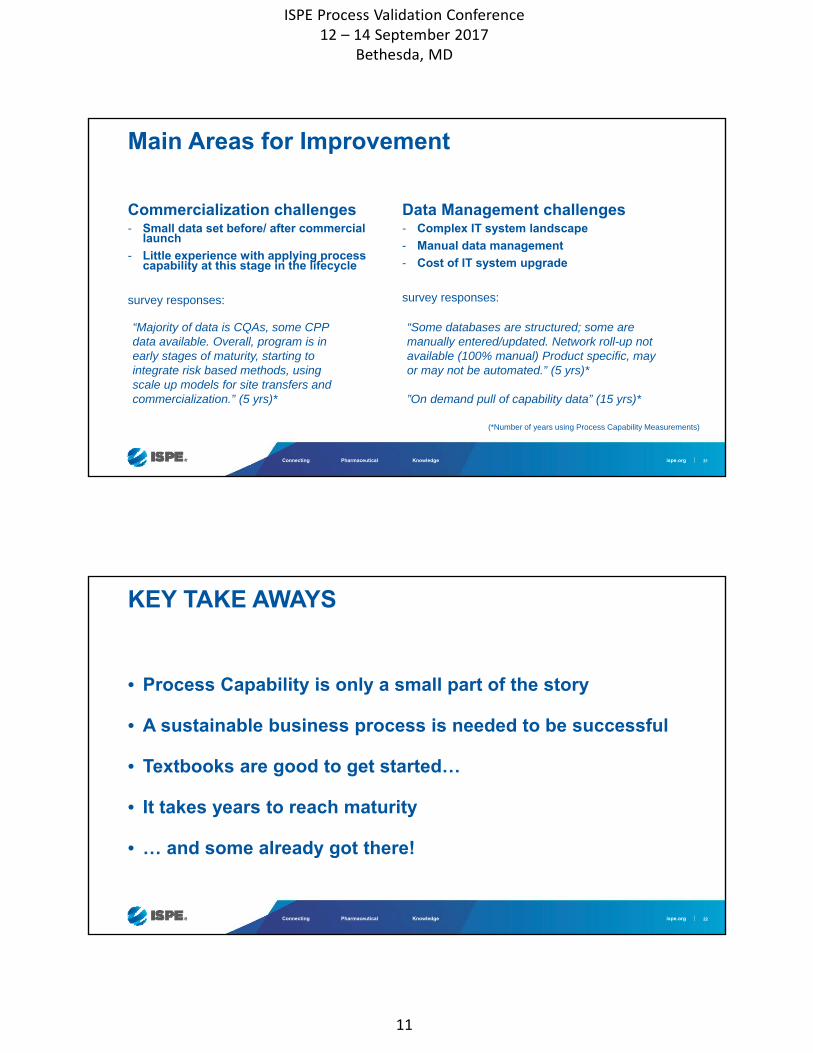
A maturity model points out areas for improvementstarting from a current (■) level, going to a target level (□)
17
What is a Maturity Model?
Level 1 - Initial. Exclusively a business process, not in quality systems. Lacks some rigor. Ad hoc, reactive, driven by users or events.
Level 2 – Repeatable. Proactive within some organizations/groups. Proactive but selectively applied.
Level 3 – Defined. Proceduralized. There are sets of defined and documented standard procedures established and subject to some degree of improvement over time.
Level 4 – Managed. Rolled out across sites, networks, organizational units and functions.
Level 5 – Optimizing. Proactive, integrated into the culture and operations management review. Comprehensive view of leading indicators and recurring root causes.
Connecting Pharmaceutical Knowledge ispe.org
In order to use process capability and concept tools optimally, it is important to achieve a certain level of proficiency and/or clarity in 9 specific areas:• Policy – SOPs are established.
• Data Management – a system for collecting, managing and accessing data.
• Frequency – how often process capability indices are calculated.
• Basis for Specification – manner in which specifications are developed and linked to clinical studies.
• Calculation Consistency – use of process capability approach, calculations and metrics.
• Response – thresholds with action required, attention is shifted to products with low capability.
• Organization Skill Set and Execution – level of process capability knowledge across the organization.
• Risk-based Context – part of an overall risk management framework.
• Commercialization – sources of variability are well understood. Process capability at initial launch is high and site resources focus on continuous improvement.
18
Maturity Matrix Consists of Nine Key Process Areas

ISPE Process Validation Conference12 – 14 September 2017
Bethesda, MD
10
Connecting Pharmaceutical Knowledge ispe.org 19
ISPE Process Capability Maturity Model:Key Process Areas
FrequencyData
ManagementOrganization and Skill sets
ResponseCalculation Consistency
Basis for Specifications
Policy Risk-basedApproach
Foundational
Optimization
Commercialization
For each key process area five levels of maturity are defined with detailed descriptions
Connecting Pharmaceutical Knowledge ispe.org 20
Maturity Model Survey - biggest opportunities according to participating companies are “Commercialization” and “ Data Management”
FrequencyOrganization and Skill sets
ResponseCalculation Consistency
Basis for Specifications
Policy Risk-basedApproach
Foundational
Optimization
Commercialization
Big change planned:Lowest starting pointMedium ambition
Big change planned:Low starting pointHigh ambition
Publication submitted to Pharm Eng
ISPE Process Validation Conference12 – 14 September 2017
Bethesda, MD
11
Connecting Pharmaceutical Knowledge ispe.org
Commercialization challenges- Small data set before/ after commercial
launch
- Little experience with applying processcapability at this stage in the lifecycle
survey responses:
21
Main Areas for Improvement
Data Management challenges- Complex IT system landscape
- Manual data management
- Cost of IT system upgrade
survey responses:
“Majority of data is CQAs, some CPP data available. Overall, program is in early stages of maturity, starting to integrate risk based methods, using scale up models for site transfers and commercialization.” (5 yrs)*
“Some databases are structured; some are manually entered/updated. Network roll-up not available (100% manual) Product specific, may or may not be automated.” (5 yrs)*
”On demand pull of capability data” (15 yrs)*
(*Number of years using Process Capability Measurements)
Connecting Pharmaceutical Knowledge ispe.org
• Process Capability is only a small part of the story
• A sustainable business process is needed to be successful
• Textbooks are good to get started…
• It takes years to reach maturity
• … and some already got there!
22
KEY TAKE AWAYS
ISPE Process Validation Conference12 – 14 September 2017
Bethesda, MD
12
ISPE PROCESS CAPABILITY COMMUNITY OF PRACTICE
PERFORMANCE AND COMPLIANCE APPLICATIONS
WORKSTREAMPeter Millili – Team Lead, BMSJason Orloff – PharmStatKevin Roberson – ABC Labs Abizer I. Harianawala – AriadJulia O’Neill – Tunnell ConsultingAbe Germansderfer – SHLPhilippe Cini – Tunnell ConsultingGeorge Millili – Roche Genentech
STATISTICS WORKSTREAM
Tara Scherder – Team Lead, Synolo StatsJames Crichton – Cook Pharmica Mahesh Shivhare – NovartisAndreas Dander – NovartisAaron Goerke – Roche Genentech
MATURITY MODEL WORKSTREAM
Philippe Cini – Team Lead, Tunnell ConsultingGretchen Allison – Pfizer Gerald Leister – Eli Lilly and CompanyEda Ross Montgomery – Shire PharmaceuticalsJulia O’Neill – Tunnell ConsultingMike Thomas – Tunnell ConsultingEric Thostesen – Janssen PharmaceuticalsArne Zilian – Novartis