isolation of bone cell clones with differences in growth ... · hormone responses, and...
TRANSCRIPT

Isolation of Bone Cell Clones with Differences in Growth,
Hormone Responses, and Extracellular Matrix Production
452
J. E . AUBIN, J . N . M. HEERSCHE, M. J . MERRILEES, and J. SODEKMedical Research Council Group in Periodontal Physiology, Faculty of Dentistry, University of Toronto,Toronto, Ontario, Canada M5S 1A8
ABSTRACT Clones of nontransformed hormone-responsive bone cells have been isolated invitro from mixed cell populations of fetal rat calvaria . In several independent isolations,microscopically visible colonies appeared at plating efficiencies of 5-10% of the starting cellnumbers. Of these clones, ~10% grew to mass populations which could be assayed for anumber of growth and biochemical properties . Although some similarities existed among theclones, they could be distinguished from each other and from the mixed cell populations.Population-doubling times (tos) and saturation densities varied over a wide range: e.g ., tos of24-72 h and saturation densities of 0.4-5 x 10⁵ cells/Cm 2. Morphologies varied from roughlypolygonal multilayering cells to typically spindle-shaped monolayering cells. Hormone respon-siveness, as measured by stimulation of CAMP by hormones, indicated that some clones wereresponsive to both parathyroid hormone (PTH) and prostaglandin E2 (PGE2), while othersresponded to PTH only . Analysis of extracellular matrix components revealed that all clonesproduced type I and type III collagens, though in different proportions. Similarly, although allclones synthesized four glycosaminoglycans (hyaluronic acid, heparan sulfate, chondroitinsulfate, and dermatan sulfate), the quantities of each were distinctive from clone to clone.Further investigation of such clones is continuing to define more precisely the heterogeneityof clonal bone cell populations in vitro. They represent an important step in the study of theendocrinology and differentiation of bone .
The study of hormonal control of bone cell metabolism hasbeen advanced markedly by the culture in vitro of cells isolatedfrom mouse and rat calvaria (21, 22, 24, 25, 28, 34) . Bysequential enzyme digestion, mixed populations of cells havebeen isolated which may be classified as osteoclastlike orosteoblastlike, based on a number ofbiochemical features (13) .Initial characterization of these populations has provided evi-dence that both osteoclastlike and osteoblastlike populationsrespond to parathyroid hormone (PTH) while only the formerrespond to salmon calcitonin (sCT) (13, 34) . However, studiesof this type, which attempt to determine the molecular mech-anisms of, for example, hormone desensitization (10) and hor-monal regulation of collagen synthesis' (35, 36) are limited byseveral fundamental problems . First, populations of cells de-fined as osteoclastlike and osteoblastlike are, in fact, mixed cellpopulations . The degree ofheterogeneity cannot adequately bedefined in the experiments, i .e., fibroblastlike cells as well as
' Harper, R. P ., J. N . M. Heersche, J . Sodek, and K . L . Yao . Collagensynthesis by isolated bone populations. Submitted for publication .
specific bone cells may be present in the populations . A moredifficult to define functional heterogeneity may exist also inthe possible presence ofa variety ofosteoclastlike or osteoblast-like cells in each population . For example, each populationmay consist of cells at various stages of differentiation orlifespan, and each class of such cells may have quite differenthormone responsiveness . Second, it has been found that ex-tended primary culturing or repeated subculturing of mixedbone cells results in changes of response, e.g ., loss of PTHresponse (22) or change in ratio of type I to type III collagen(35, 36) . Whether such changes reflect senescence of certaincells, differentiation in vitro, or overgrowth by some rapidlydividing subpopulation cannot be answered on such mixedpopulations . Third, determination of which particular cells inthe mixed population are actually responsible for certain meas-ured responses has not been possible . For example, whether ornot some or all cells are responsive to PTH is not known, norwhether one sort of bone cell can make both type I and typeIII collagens .These questions are best approached using a homogeneous
THE JOURNAL OF CELL BIOLOGY " VOLUME 92 FEBRUARY 1982 452-461
©The Rockefeller University Press " 0021-9525/82/02/0452/10$1 .00

isogenic population . Such cells may be generated in vitro bycloning homogeneous populations from mixed cell populations.Clones of parathyroid hormone-responsive cells originatingfrom nontransformed bone cell populations have not previ-ously been described . We report here the isolation of clones ofbone cells from mixed populations of early subcultures of ratcalvaria . Preliminary characterization of the clones has in-cluded analyses of their growth properties, their responsivenessto certain hormones including parathyroid hormone, and theirability to synthesize specific collagen types and glycosamino-glycans .
MATERIALS AND METHODSIsolation and Culture of Bone CellsBone cells were isolated from fetal rat calvaria by a modification of the
methods of Wong and Cohn (36) and Rao et al. (25) . 10 calvaria were minced atotal of 20 times in spinner flasks containing I ml ofPBS with 10 x antibiotics(1 mg/ml penicillin G, 500ILg/ml gentamicin, and 3 lag/ml amphotericin a). ThePBS was removed and replaced with l ml of enzyme mixture (25) . Incubationwith continuous stirring was carried out in a 37°C water bath. After 10 min, thesupernatant containing the cells was removed, filtered through a stainless steelsieve (200 mesh), and added to an equal volume of ice-cold fetal calf serum(FCS) to stop the enzyme activity. This was labeled population I (RCI). Freshenzyme was added to the remaining bone chips and the digestion continued fora further 10 min (population II, RCII). A third 10-min digestion yielded popu-lation III (RCIII) . Populations IV and V (RCIV and RCV, respectively) wereharvested after two subsequent 20-min digestion periods . Populations isolated inthis manner were centrifuged (10 min, 800 g), resuspended in a-MEM (FlowLaboratories, Inc., Rockville, Md.) plus 15% heat-inactivated FCS andantibiotics(as above at 1/10 stated concentration), and plated in 60-mm culture dishes at aconcentration of 4 x 10⁵ cells per plate . In some experiments, populations I and11 were combined (designated population A, RCA) and populations IV and Vwere combined (designated population B, RCB) . After 7 d of incubation at 37°Cin 95% humidified air plus 5% COs, confluent cultures were washed once withphosphate-buffered saline (PBS) and the cells were detached by incubation with3 ml of trypsin (0 .25% in citrate saline) for 4 min. The enzyme activity wasstopped by adding an equal volume of ice-cold FCS. Subculturing of mixedpopulations was performed routinely in this manner at -l-wk intervals withseeding densities of -1 .5 x 10" cells/cm'. Colony-forming ability (plating effi-ciency) was determined by plating 10 2 -10' cells on 60-mm culture dishes andscoring for macroscopically visible, stained colonies after 14 d at 37°C . The ratosteosarcoma cell clone, ROS 17/2, was given to us by G. Rodan (Departmentof Oral Biology, University of Connecticut) (see reference 14) .
Cloning
Clones isolated from populations RCIII, RCIV, and RCB are reported in thispaper (Fig. 1). The procedure in all cases was essentially as reported below forpopulation III . Single-cell suspensions of 1st-4th subculture population III,prepared by trypsinization as described, were plated at limiting dilutions (e.g ., -1cell/16-mm well) in I ml of a-MEM, 15% FCS, and antibiotics as describedabove. Trays were left undisturbed for 12-14 d, after which wells with micro-scopically detectable single colonies (0 .5-2mm diameter) were scored . Wells withmore than one colony were recorded to determine plating efficiencies, but thesecolonies were not isolated or utilized further .
After identification of single-colony wells, oldmediumwas aspirated and freshmedium added every 4-7 d, for 1-2 wk . Large colonies (>-1,000 cells) weresubcultured ; this was always well before confluence in the initialwell since almostall clones tended to multilayer extensively and cells in heavily multilayered areasappeared to degenerate when left in this state. Subculturing was done byaspirating the medium, rinsing the well with PBS, and adding 2-3 drops oftrypsin (as described above). As soon as the cells were rounded and easy toremove by gentle pipetting, 2 ml of fresh a-MEM + 15% FCS were added, andcells were resuspended and plated in fresh wells or 35-mm dishes. Thereafter,cells were subcultured on reaching confluence (though some areas could bemultilayered; see Results) . Cell seeding densities were normally kept at 1-2 x 10°cells/cm'; as populations attained higher numbers, they were maintained in T-75flasks (Falcon Labware, Div. Becton, Dickinson & Co ., Oxnard, Calif.), andsome cells were frozen at -70°C to ensure stocks of clones.
Growth CurvesFor growth curves, cells were plated in 60-mmculture dishes at desired seeding
cell densities as given in Results. At various times usually starting 18 h after
plating, cells were trypsinized, resuspended, and counted in a hemocytometer.For such experiments over 2-wk intervals, medium waschanged on all remainingdishes each 4-5 d.
Cumulative population-doubling levels (CPDL) were calculated according toMueller et al . (18) . Briefly, the number of population doublings (PD) thatoccurred in each subculture is given by: PD = loge (cell density at subculture/[celldensity at inoculation x attachment efficiency]) . The CPDL is the sum of allPD throughout the lifetime of the culture . The CPDL for clones was estimatedfor the cloning procedure (e .g., 1 cell up to >-1,000 cells or CPDL >: 10), this baselevel was added to CPDL accumulated for the mixed population before cloning,and those CPDL were more accurately determined for each clone as it grew tohigh cell numbers.
cAMP Responses to PTH, PGE2, and sCTHormone incubations were carried out on confluent cell cultures in PBS,
supplemented with 0.1% bovine serum albumin (BSA; Pentex [Miles Laborato-ries, Elkhart, Ind.]), 0.1% glucose, and 10 mM theophylline . 30 min beforeincubation, the culture medium was removed and replaced by 1 ml of supple-mented PBS without theophylline. The cAMP incubation was initiated by theaddition of an equal volume of supplemented PBS containing 20 mM theophyl-line, and either PTH (5 U/ml or as otherwise stated), prostaglandin E2 (PGE2 , 5pg/ml or as otherwise stated), sCT (400 mU/ml), or no hormone. Incubation wascarried out at 37'C with air as the gas phase. Incubation times varied and aregiven with the respective tables and figures .
At the end of the incubation period, the medium was decanted and the cellswere washed once for --10 s with ice-cold PBS. After the PBS was decanted, thecell layer was extracted twice with 2 x 1 ml 90% propanol (2 x 24 h, at 4°C) . Thepropanol extracts were pooled and the propanol was evaporated. cAMP in thedried extract was assayed according to Brown (2) as described previously (7) .
Collagen SynthesisTo measure collagen synthesis, confluent cells were labeled with 2.5 pCi/ml
l'H]proline (NEC-323; New England Nuclear, Boston, Mass.) in serum-free a-MEM supplemented with 50 I~g/ml each of ,Q-aminopropionitrile (P-APN) andascorbic acid, and with proline adjusted to 3.5 mM .' A labeling period of 18 hwas used, after which the medium was collected and heat-inactivated serum wasadded to a final concentration of 0.3% (vol/vol) . The medium was exhaustivelydialyzed against distilled waterbefore equilibration with 0.05 M Tris-HC1 buffer,pH 7.6 . The collagenous proteins in a 0.5-mlsample were digested by the additionof 25 pl of a 1 mg/ml solution of bacterial collagenase (CPLSA ; WorthingtonBiochemical Corp ., Freehold, N. J.) purified as described by Peterkovsky andDiegelmann (23). N-Ethyl maleimide was added to a final concentration of2.5mM to inhibit residual protease activity, and the digestion was carried out at37°C for 2 h. The digestion was terminated by the addition of trichloroaceticacid (TCA) to a final concentration of 7% (wt/vol). The precipitated proteinswere pelleted by centrifugation at 10,000 g, washed in 1.0 ml of 7% (wt/vol)TCA, and repelleted . The supernatants were combined, the TCA was removedby ether extraction, and an aliquot was taken to measure the radioactivityassociated with the degraded collagen. The pellet was dissolved in 100 lal of70%formic acid, and an aliquot was taken to measure the radioactivity associatedwith the noncollagenous proteins . The percentage of radioactivity in the collagenswas divided by 5.4 to compensate for the preferential incorporation of the['H]proline into collagenous proteins (36). The cell layers were scraped offof theculture dishes after adding 2 ml of7% TCA. The insoluble material was pelletedby centrifugation, washed until negligible radioactivity could be extracted, thenheated to 90°C for 20 min to selectively solubilize the collagenous proteins .
To determine the nature of collagens synthesized, confluent cells were labeledwith 1 ACi/ml each of [' °C]glycine and ['°C]proline (NEC-047H and NEC-285;New England Nuclear) in serum-free a-MEM deficient in these amino acids butsupplemented with 50 pg/ml each of /3-APN and ascorbic acid . After 18 h oflabeling, the medium was removed and the cell layer was freeze-thawed threetimes and then extracted with 2 ml of 0.5 M acetic acid . Each fraction wasexhaustively dialyzed against 1% acetic acid after the addition of serum to 0.125%(vol/vol). A sample of each was digested with 100 lag of pepsin in 0.5 N aceticacid for 4 h at 15°C . Both pepsin-digested and non-pepsin-digested sampleswerefreeze-dried before analysis by SDS PAGE. The conditions used for electropho-resis and quantitation of radiolabeled collagen a chains have been describedpreviously (11, 29). Identification of the various collagen a chains was made fromcomparisons of their mobility on electrophoresis gels in the presence and absenceof mercaptoethanol with known standards.
Glycosaminoglycan Analysis
Confluent clones and ROS cells, cultured in 60-mm dishes, were labelled for24 h with 200 pCi of ['H]acetate in 5 ml of a-MEM supplemented with 1% FCS
AuBIN ET AL .
Isolation of Bone Cell Clones with Different Properties
453

-3 weeks
-8 weeksRCIII -----------0- RCJ 1 .1
RESULTS
1stcloning
CPDL -9
CPDL -20
RCIV
10
RCF 1 .5
0RCF 1 .5
RCB
-------------Do- RCB 2 .2 ~~RCB 2.2
454
THE JOURNAL OF (TELL BIOLOGY " VOLUME 92, 1982
and the glycosaminoglycan (GAG) extracted from the growth medium and thecell layer separately, using the method ofNiebes and Schifflers (19) as modifiedby Merrilees et al. (16) . The growth medium (5 ml) or cell layer (5 ml of 0 .01%trypsin in citrate saline) was digested in 25-ml polycarbonate centrifuge tubeswith a I -ml solution of protease (12.5 mg/ml; Type VI from Streptomyces griseus;Sigma Chemical Co ., St . Louis, Mo.) in Tris buffer (pH 7.4) at 50°C for 16 h .After digestion, 3.3 ml of aqueous 31% NaCl and 0 .18 ml of 3 N acetic acid wereadded before the samples were heated to 100°C for 5 min, cooled in an ice bath,
and centrifuged at 30,000 g for 20 min at 4°C . The supernatant was transferred
to 50-ml glass centrifuge tubes containing 21 ml of absolute ethanol and sodium
acetate (0.8 g/liter) and left at 4*C for 72 h. Tubes were then centrifuged at 2,200
g for 20 min at 4°C . The supernatant was discarded and the precipitate taken up
in 1-2 ml of distilled water and transferred to small test tubes for drying at 80°-
90°C. Each sample was redissolved in 40 Al of distilled water, and a 1-pl aliquotwas electrophoresed on cellulose acetate membranes using aBeckman MicrozoneCell (model R101 ; Beckman Instruments, Inc ., Palo Alto, Calif.), 0 .2 M zincsulfate buffer, and a front current of l pAmp/cm for 70 min (l) . Membraneswere stained for 8 min in l% Alcian blue made up in a l : l ethanol :sodium acetate(4 .1 g/liter) solution (pH 5 .8) and destained by rinsing in an aqueous solution of5% acetic acid and 10% ethanol. Membranes were then transferred to anhydrousmethanol for 1 min and placed between two glass plates for drying .GAG bands corresponding to hyaluronic acid (HA), dermatan sulfate (DS),
and chondroitin sulfates (CS) 4 and 6 were identified using coelectrophoreticstandards. Heparan sulfate (HS), for which no standard was available, wasidentified by its known position between HA and DS. Although the two CS couldbe clearly distinguished as standards, separation was less distinct in the samples,and for purposes of quantification these two GAG have been combined. Theposition of chondroitin 6-sulfate (CS6) is close to the known position of keratansulfate (1) ; to check that this GAG was not present, selected samples of both theclones and the ROS cells were digested with chondroitinase ABC (aqueous
sample digested with an equal volume of 0.2 M Tris buffer, pH 7 .8, containing
0.02 U of enzyme/pl, for 16 h).
After identification, each band containing an individual GAG was cut out of
the membrane, transferred to a scintillation vial, and digested for 20 min in 0.5
ml of 1,4-dioxan before adding 6 ml of scintillation fluid for counting.
Mixed populations RCIII, RCIV, and RCB, grew to highsaturation densities in multilayered patterns . Colony-formingabilities of these populations measured at different times var-ied; normally, however, plating efficiencies of up to 25% weremeasured. A large variability in colony size was noted : i.e .,about half of the colonies grew to diameters >_2 mm (?1,000cells), whereas the rest grew to <1 mm (<1,000 cells) in 14 d .Such a heterogeneity was reflected also in the colony sizeresulting when clones were generated by limiting dilutionplating in 16-mm cloning wells . Data from typical clonings ofRCIII, RCIV, and RCB populations are shown in Table I.Depending on the starting population, the frequency of isola-tion ofclones varied slightly, but actual percentages varied alsowithin one population from one time of isolation to another.To ascertain whether the starting populations actually vary
FIGURE 1
Isolation of bone cell clones . RCIII, RCIV,and mixed RCB populations were plated at limitingdilution in multiwell plating dishes as described .Many clones attained CPDL ?9; a small percentagereached CPDL ? 20 (see text for details) .
TABLE I
Analysis of Numbers of Clones Attaining Measured Population-doubling Levels from Different Starting Mixed Populations
* Clones were screened 2-3 wk after initial plating; all colony sizes werecounted.
significantly in the percentage of clonable cells that eachcontains, many more isolations would have to be performed.In general, however, we have routinely isolated more clonesfrom RCIII population than from other mixed populations.A number of growth characteristics were determined for
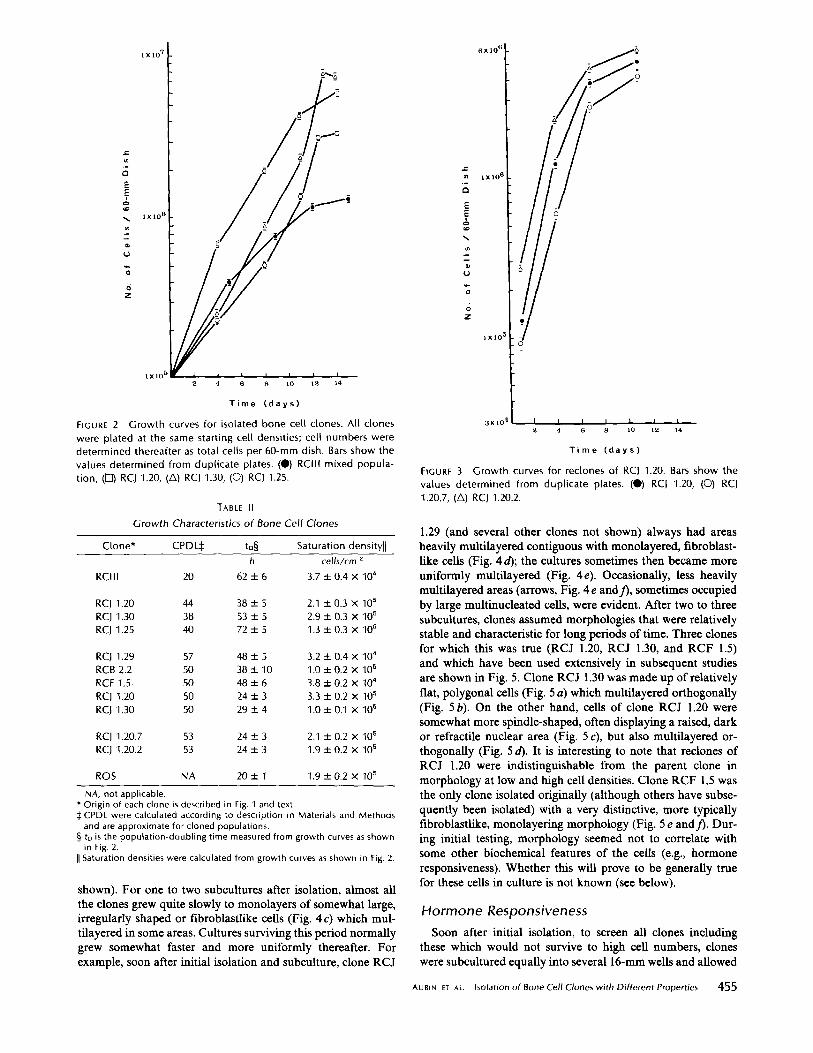
those clones considered most interesting in terms of initialscreening assays of hormone responsiveness. Typical growthcurves are presented in Fig . 2 for some of the clones soon aftertheir isolation. It is evident that the RCIII mixed populationwas significantly different from some clones, e.g ., RCJ 1.30and RCJ 1 .25, in terms of both doubling times (tD) andsaturation densities (Table II) .Some of the clones were recloned and tested also in several
of the assays. Fig. 3 compares two RCJ 1 .20 reclones with theoriginal clone ; when tested, the tD (-20 h, with saturationdensities of 1-2 x 10⁵ cells/cm') were similar for all three.As a comparison, the transformed rat osteosarcoma cell
clone, ROS 17/2, was used in several assays . ROS 17/2 cellsgrew with a tD of -20 h, attaining saturation densities (inmultilayered cultures) of -2 x 10 5 cells/cm 2 .
Morphology
Figs . 4 and 5 summarize the morphological characteristics ofthe RCIII mixed population, compared with some ofthe clones,soon after initial cloning. In mixed population RCIII, areas ofrelatively polygonally shaped cells (Fig. 4a) were seen in thesame flasks as areas with much more fibroblastlike cells (Fig .4b). Cells in this RCIII mixed population multilayered exten-sively as did cells of many of the clones. Clones initially grewup usually as tightly packed multilayered colonies (data not
No . of No . ofNo . of clones at- clones
clones at- taining attainingTotal No . of taining ~-1-5 x ,106
Starting no . of clones .1,000 10° cells, cells,popula- cells when cells, CPDL , CPDL
tion plated screened* CPDL , 9 13-16 20
RCIII 532 53 (10.4%) 30 (5 .6%) 13 (2 .4%) 5 (0 .9%)RCIV 360 31 (11 .6%) 10 (2 .8%) 3 (0 .8%) 2 (0 .5%)RCB 1,152 26 (2 .3%) 14 (1 .2%) 4 (0 .3%) 2 (0 .2%)
RCJ 1 .2 -A
RCJ" 1 .18--0- RCJ 1 .18
recloningRCJ 1 .20 RCJ 1 .20 RCJ 1 .20 .4
RCJ 1 .20 .7,etc .
RCJ " 1 .25 10 RCJ 1 .25
RCJ . 1 .29 -----1" RCJ 1 .29RCJ 1 .30 -------im. RCJ 1 .30 RCJ 1 .30 .1
recloning
shown) .
L
EE0ao
U
O
O2
FIGURE 2 Growth curves for isolated bone cell clones . All clones
were plated at the same starting cell densities; cell numbers weredetermined thereafter as total cells per 60-mm dish . Bars show thevalues determined from duplicate plates . (") RCIII mixed popula-tion, (0) RCJ 1 .20, (A) RCJ 1 .30, (O) RCJ 1 .25 .
TABLE II
Growth Characteristics of Bone Cell Clones
NA, not applicable .* Origin of each clone is described in Fig . 1 and text.$CPDL were calculated according to description in Materials and Methodsand are approximate for cloned populations .
§ t D is the population-doubling time measured from growth curves as shownin Fig . 2 .
~~ Saturation densities were calculated from growth curves as shown in Fig . 2.
For one to two subcultures after isolation, almost allthe clones grew quite slowly to monolayers ofsomewhat large,irregularly shaped or fibroblastlike cells (Fig. 4c) which multilayered in some areas . Cultures surviving this period normallygrew somewhat faster and more uniformly thereafter. Forexample, soon after initial isolation and subculture, clone RCJ
Time (days)
FIGURE 3 Growth curves for reclones of RCJ 1.20. Bars show thevalues determined from duplicate plates. (") RCJ 1.20, (O RCJ1.20.7, (A) RCJ 1 .20.2 .
1 .29 (and several other clones not shown) always had areasheavily multilayered contiguous with monolayered, fibroblast-like cells (Fig . 4d); the cultures sometimes then became moreuniformly multilayered (Fig . 4e). Occasionally, less heavilymultilayered areas (arrows, Fig. 4e andf), sometimes occupiedby large multinucleated cells, were evident . After two to threesubcultures, clones assumed morphologies that were relativelystable and characteristic for long periods of time . Three clonesfor which this was true (RCJ 1 .20, RCJ 1.30, and RCF 1 .5)and which have been used extensively in subsequent studiesare shown in Fig . 5 . Clone RCJ 1 .30 was made up of relativelyflat, polygonal cells (Fig. 5 a) which multilayered orthogonally(Fig. 5 b) . On the other hand, cells of clone RCJ 1.20 weresomewhat more spindle-shaped, often displaying a raised, darkor refractile nuclear area (Fig. 5 c), but also multilayered or-thogonally (Fig . 5 d) . It is interesting to note that reclones ofRCJ 1.20 were indistinguishable from the parent clone inmorphology at low and high cell densities . Clone RCF 1 .5 wasthe only clone isolated originally (although others have subse-quently been isolated) with a very distinctive, more typicallyfibroblastlike, monolayering morphology (Fig. 5 e andf) . Dur-ing initial testing, morphology seemed not to correlate withsome other biochemical features of the cells (e.g., hormoneresponsiveness) . Whether this will prove to be generally truefor these cells in culture is not known (see below) .
Hormone ResponsivenessSoon after initial isolation, to screen all clones including
these which would not survive to high cell numbers, cloneswere subcultured equally into several 16-mm wells and allowed
AUBIN ET AL .
Isolation of Bone Cell Clones with Different Properties
455
Clone* CPDL$ tD§h
Saturation densityllcells/cm z
RCIII 20 62±6 3.7±0.4X10°
RCJ 1 .20 44 38 ± 5 2.1 ± 0.3 X 10 5RCJ 1 .30 38 53 ± 5 2.9 ± 0.3 X 10⁵RCJ 1 .25 40 72 ± 5 1 .3 ± 0.3 X 10⁵
RCJ 1,29 57 48 ± 5 3.2 ± 0.4 X 10⁴
RCB2 .2 50 38±10 1 .0±0.2X10⁵RCF 1.5 50 48 ± 6 3.8 ± 0.2 X 10⁴
RCJ 1.20 50 24 ± 3 3.3 ± 0.2 X 10⁵RCJ 1 .30 50 29 ± 4 1 .0 ± 0.1 X 10⁵
RCJ 1.20.7 53 24 ± 3 2.1 ± 0.2 X 10⁵RCJ 1.20.2 53 24 ± 3 1 .9 ± 0.2 X 10⁵
ROS NA 20 ± 1 1 .9 ± 0.2 X 10⁵

FIGURE 4 Phase-contrast micrographs of mixed population and clones of rat calvaria cells soon after isolation . RCIII mixedpopulation contained areas of polygonally shaped cells (a) interspersed with more fibroblastic cells (b) . After first subcluturing,cells from almost all clones grew with quite flat, fibroblastic morphology (RCJ 1.25 is shown in c) . RCJ 1 .29 typically grew withheavily multilayered areas contiguous with monolayered fibroblastic areas (d); cultures of RCJ 1 .29 left longer became moreuniformly multilayered (e) . Often, large multinucleated cells (arrows in e and f) appeared in these cultures; other cells did notgrow over these. Bar, 20 p,m. x 500.
to grow to confluence . PTH stimulation of intracellular cAMPwas determined for each clone (data not shown) . Those re-sponding above control levels were replated in 60-mm dishesand retested in a more complete assay with both PTH andPGE2. These latter data are summarized in Table III. Cloneswere not identical ; rather, each clone was characterized by aparticular hormone responsiveness. In this sort of analysis,clones fell into categories ofbeing responsive to both hormonesor to one only.
456
THE JOURNAL OF CELL BIOLOGY " VOLUME 92, 1982
A more precise way of defining differences in hormoneresponsiveness is to analyze stimulation of cAMP with time ofexposure to various hormones. This has been done for severalof the clones, and a comparison of such data for two clones isshown in Fig. 6 . RCJ 1 .20 response to PTH clearly peaks at 2min, whereas that of RCJ 1 .30 peaks later at -4 min, with agreater magnitude of response . cAMP was not stimulated inRCJ 1.30 by PGE2 , whereas it was stimulated and peaked at 4min for RCJ 1.20. Neither of these clones was responsive for

FIGURE 5 Morphology of bone cell clones. RCJ 1 .30 at confluence appeared polygonally shaped with tight packing (a) andmultilayering occurred orthogonally (b) . RCJ 1 .20 similarly multilayered orthogonally (d) but appeared more spindle-shaped inmonolayer (c) . RCF 1 .5 had a very elongated spindle-shaped morphology with cells never multilayering (e and f) . Bar, 20 ttm . x500.
sCT. Table IV summarizes these and similar data for two otherclones for which complete time-courses have been determined.These data were compared with those of ROS 17/2 cells, whichwere highly responsive to PTH (peak time, 4 min) and notresponsive to PGE2 (see Table IV) .
Collagen SynthesisThe percentage of protein secreted by the various cells into
the culture medium as collagen is shown in Table V. For thecloned cells the values varied, the lowest values being deter-mined for RCJ 1.29 and the highest for RCJ 1.20 . A similar
range of values was observed in the mixed bone cells in theRCA and RCB populations . However, the value for collagensynthesis by the ROS cells was significantly lower than thevalues for all but one (RCJ 1 .29) of the cloned bone cells.Measurement of collagen in the various cell layers showed thisto be <15% of the total collagen and did not account for thevariability in the collagen analysis in the medium samples .However, ~45% of the total collagen was in the cell layer ofROS 17/2 cells .
Analysis of 1"C-labeled collagens by SDS PAGE revealed asimilar pattern of procollagens and collagen a chains for thecloned cells, a representative scan of which is shown in Fig . 7 .
AUBIN ET At .
Isolation of Bone Cell Clones with Different Properties
457

Conversion of pro-a, and pro-a2 chains to pc intermediatesand to pn intermediates was observed with little conversion toa chains. In contrast to many other cell types, including themixed bone cells, most clones revealed little or no labeledmaterial in the position expected for fibronectin. After pepsindigestion, two major bands corresponding to the a, and a2chains oftype I collagen and two minor bands migrating in theposition'of type III collagen a chains and the type V collagena, chain were observed. Under nonreducing conditions, thetype III band migrated in the position of collagen y chains,whereas the other bands were unaffected . Quantitation of theradiolabeled a chains by densitometry demonstrated that, inthe majority of clones, type III collagen comprised 1-2% ofthetotal collagen and the a,(V) chain <1%. Similar values wereobtained with collagens synthesized by the ROS cells. How-ever, appreciably more type III collagen was synthesized byRCB 2.2 and, in RCF 1.5, type III collagen comprised 14% ofthe total collagen synthesized. In the mixed population ofbonecells, type III collagen synthesis varied between 1 and 20% ofthe total collagen synthesized and was dependent upon thedensity and time in culture.'
GAG
Table VI summarizes the production of GAG by a varietyofclones and ROS cells . All these bone cells tested synthesizedfour GAG (HA, HS, DS, and CS). While all the clones weresimilar in GAG profiles, each clone was distinct. Similarities,as indicated in Table VI, were as follows. First, the predomi-nant GAG was HA, comprising 30-50% of the total; DS was
O
1
2432 d0 ~~ 84MINUTES
458
THE JOURNAL OF CELL BIOLOGY " VOLUME 92, 1982
usually the next most prominentGAG. Second, a large amount(frequently >50%) of GAG was found in the cell layer. Third,it was notable that the proportion ofHS was higher in the celllayer than in the growth medium; in the cell layer it frequentlycomprised >20% of the GAG. Anumber of distinctive differ-ences should be pointed out for several of the clones. In cloneRCJ 1.20, the proportion of HA was greater than in the other
--------------------------0 ii 78 24 3 0
14
TABLE IV
Hormone-induced Stimulation of CAMP
PTH (2 .5 U/ml*
PGEZ (2 .5 Pg/ml oror 1 .25 U/ml$)
1 .25 hg/ml$)
Times of peak stimulation and maximal value of cAMP in response tohormone were determined from complete time-course experiments asshown in Fig . 6.
* 2.51Ag/ml or 2.5 U/m l .$ 1 .25 Pg/ml or 1.25 U/ml .§ Not significantly elevated from control values calculated on the same cellswithout hormone treatment.
TABLE V
Hormone
TABLE III
Stimulation of CAMP in Bone Cell Clones
Effect of hormone treatment, cAMP pmol/60-
Analysis of
Cell type
Collagen Synthesis by
Percent collagensynthesized
Bone Cell
Percenttype III
Clones
Percenta, (V)
mm dishMixed populationsRCA 13.3-14.3* 9-20 ND$
None (4, 10 PTH (2 .5 U/ml, PGEZ (2 .5 gg/RCB 12.2-15.4 1-14 ND
Clone min) 4 min) ml, 10 min)Clones
RCJ 1 .18 1.5 10.1 13 .9 19.5 5.4 ± 1,8 RCJ 1 .20 14.5 t 0.4 1-2 1RCJ1 .20 2.8±0.1 31.3±0 .9 5.7±0 .2 RCJ 1 .25 13 .0 ± 0.2 1-2 1RCJ1 .25 2.5±0.2 25.9±6 .3 9.2±0 .9 RCJ 1 .29 10.7 ± 1 .4 1-2 1RCJ 1 .29* 4.0 t 0.5 45.6 ± 2.9 58 .3 ± 3.5 RCJ 1.30 13 .4 ± 0.6 1-2 1RCJ1 .30 3.0±0.2 10.9±2 .5 1.7±0 RCJ 1.18 12 .3 ± 0.7 1-2 1RCJ1 .20.2 2.2±0.2 15.6±0 .2 10.1±2 .7 RCB 2.2 14.2 ± 0.1 3-4 1RCJ 1 .20.4 0.2 t 0.2 5.0 ± 0.2 2.3 ± 0 RCF 1 .5 12 .7 ± 0.7 14 NDRCB2.2* 7.4±1.0 105.6±9 .8 5.5±0 .7 ROS 17/2 10.5 ± 0.1 1-2 1
Each value is the mean* Each value is the mean
a 40y
II
and mean deviation of duplicate determinations.of triplicates t standard deviation .
b,60. hI
* Mean of triplicates t standard deviation .$ ND, not determined .
FIGURE 6 Time-course ofhormone-induced cAMP re-30
II
501 sponse in bone cell clones .9 cAMP was measured at var-EE II
40" ious times after addition ofe 2 I hormone. (a) RCJ 1 .20 re-
0 301 sponse to PTH (---),E I PGEZ (-), sCT (---),
a I 20- or no addition (---) . (b)fa I 1 RCJ 1 .30 response to PTHV t0. (---), PG E2 (-), sCT
(---), or no addition
ClonePeaktimemin
cAMPpmol/60-mm
dish
Peaktimemin
cAMPpmol/60-mm
dish
RCJ 1.20$ 2 38 .9 t 9.5 4 14 .9 ± 2.2RCJ 1.30$ 4 63 .3 ± 8.6 4 2.2 ±0.4§RCJ 1 .29* 4 41 .0 ± 7.6 20 586.5 t 59 .7RCF 1 .5* 4 52 .7 t 9.4 4 252.2 ± 37 .0ROS 17/2$ 4 33.9 t 3.4 20 11 .6 t 1 .6§

clones . In fibroblasts (9) and smooth muscle cells (16), it hasbeen found that the percent HA increases as cell densitydecreases . Clone RCJ 1 .20 often attained higher densities thanseveral of the other clones ; comparison at equivalent celldensities showed that RCJ 1.20 still produced proportionatelymore HA. Note that reclone RCJ 1 .20 .4 had a profile similar
Ec
h
0
8aa
234 8 9 10
0 .1 02 03 0-4
Relative Mobility
FIGURE 7
Spectrophotometric scans of 14C_ labeled collagens sep-arated by SDS PAGE and visualized by fluorography . The scans weretypical of the patterns obtained for the majority of clones . Procol-lagens evident in the non-pepsin-digested sample (-----) wereidentified by comparison of mobilities with purified standards .Pepsin-digested sample (-) revealed a chains corresponding totype I, III, and V collagens . 1, pro-a l (l) ; 2, pc-a,(I) ; 3, pro-a2 (I) ; 4,pc-412(1) ; 5, a, (I I I) ; 6, pn-a, (I) ; 7, a, (V) ; 8, a, (I) ; 9, pn-a2(I) ; 10, a2(I) .
Amount and Percentage of Labeled ([ 3 H]Acetate) GAG Synthesized by Confluent Clones and ROS CellsTABLE
to that of RCJ 1.20. Clone RCJ 1.30 and a reclone of it, RCJ1 .30 .1, produced proportionately less HA and more sulfatedGAG (both DS and CS) than, for example, clones RCJ 1.20and RCJ 1.20.4. At comparable cell densities, less GAG wassynthesized per cell in RCJ 1.30 than in other clones. RCJ 1.29was high in HS, especially in the cell layer, compared to otherclones . RCB 2.2 synthesized DS in large amounts relative tothose of CS. RCF 1.5 was similar to RCB 2.2, but more HAwas found, especially in the growth medium . In comparison,ROS cells differed from the clones in synthesizing predomi-nantly CS rather than HA, and only a small amount of DS .Furthermore the CS corresponded in electrophoretic positionto that of the CS6 standard rather than chondroitin 4-sulfate(CS4) as was the case for the clones . Chondroitinase ABCdigestion confirmed that keratan sulfate, which has an electro-phoretic position close to CS6, was not produced in either theclones or the ROS cells . As in the clones, the percent of GAGin the cell layer of ROS cells was high .
DISCUSSIONIn this report, we have summarized the first isolation and initialcharacterization of clones ofPTH-responsive cells from mixedbone cell populations . A number of features ofthese clones areof special interest: (a) Although clones of transformed osteo-blastlike cells, rat osteosarcoma cells (e .g ., ROS 17/2 ; seereference 14), and clones of nontransformed cells derived frombone but only responsive to PGE2 (33) have been isolated,clones derived from nontransformed bone cells and respondingto PTH have not been reported previously. The clones in thisstudy were isolated at frequencies and with growth propertiesamenable with their being useful for biochemical and endo-crinological studies. (b) The clones were heterogeneous in that
VI
Each determination represents the mean of three samples with the standard deviation in parentheses . HA, hyaluronic acid ; HS, heparan sulfate; DS, dermatansulfate; CS, chondroitin sulfate 4 and 6 combined .
AUBIN ET AL.
Isolation of Bone Cell Clones with Different Properties
459
Clone
Cells/cm 2 X10⁻⁸
TotalGAGdpm/108
cells HA
Total GAG percentdistribution
HS DS CS
Growth medium GAGpercent distribution
HA HS DS CS
PercentGAGin celllayer
Cell-layer GAG percentdistribution
HA HS DS CSRCJ 1 .20 1 .03 2,247 45 .5 15 .0 19 .2 20 .3 57 .5 5 .5 15 .0 22.0 53 .7 34 .9 23 .1 23 .1 18 .9
(0.35) (290) (2 .1) (1 .4) (0 .1) (1 .4) (2 .1) (2 .1) (1 .4) (2 .8) (2 .1) (1 .4) (2 .8) (1 .4) (0 .1)
RCJ 1.20.4 0.77 2,072 49 .7 17 .3 20 .7 12 .3 58 .7 5 .7 20.3 15 .3 56 .5 42 .6 26 .4 20.7 10 .3(0 .13) (533) (2 .1) (1 .5) (2 .5) (1 .5) (4 .5) (2 .1) (3 .5) (2 .1) (5 .4) (2 .5) (2 .0) (3 .8) (2 .1)
RCJ 1 .30 0.76 1,231 37 .4 13 .2 26 .7 22 .7 33 .6 5 .6 37 .0 23 .8 55 .2 40 .7 20 .3 19 .3 19 .7(0 .25) (154) (1 .7) (1 .0) (1 .2) (0 .6) (2 .1) (0.6) (5 .8) (4.0) (2 .5) (5 .5) (2 .1) (1 .5) (6 .9)
RCJ 1 .30.1 0 .36 2,620 39 .6 9 .3 23 .1 28 .0 37.8 4 .3 25 .7 32 .2 36 .9 41 .9 17 .7 18 .9 21 .5(0 .07) (425) (1 .2) (1 .0) (1 .0) (1 .2) (3 .0) (1 .2) (0 .1) (2 .6) (5 .6) (2 .7) (2 .3) (0 .8) (0 .5)
RCJ 1 .29 0 .63 1,616 34 .2 24 .2 24.3 17 .3 44.7 5 .8 25 .0 24 .5 57 .1 26 .4 28 .2 23 .7 11 .7(0 .11) (352) (2 .6) (0.6) (2.3) (2 .3) (4 .2) (0 .8) (1 .7) (4 .6) (4 .2)) (7.5) (3.6) (4 .0) (2.3)
RCB 2.2 0 .64 2,615 37 .4 20.8 28.5 13 .3 38.7 5 .2 37 .9 18 .2 68 .7 36 .8 27 .5 24 .3 11 .4(0 .11) (790) (0 .6) (0.6) (1 .5) (1 .0) (1 .2) (1 .5) (1 .5) (1 .0) (1 .5) (0 .6) (1 .0) (2 .1) (1 .5)
RCF 1 .5 0 .35 2,389 41 .9 16.7 29.6 11 .8 50 .2 7 .8 29 .5 12 .5 47 .5 32 .8 26.5 29 .7 11 .0(0 .06) (390) (2.0) (1 .1) (0.5) (0.9) (3 .2) (2 .0) (2 .0) (1 .1) (4.2) (3 .8) (2.2) (1 .6) (1 .1)
ROS 4.23 2,436 37 .2 9.7 5.3 47 .8 38 .7 3 .0 4 .1 54 .2 40.4 35.4 19.1 6.6 38.9(0 .4) (66) (0.6) (0.6) (0.6) (1 .0) (1 .2) (1 .0) (0 .4) (1 .2) (6.0) (0.6) (0.5) (1 .2) (0.2)

different clones had distinctive morphological and growthproperties . Whether these will relate finally to functional ca-pacities of the clones, reflecting also in vivo potentialities,awaits further isolation and characterization. (c) These cloneshave allowed for the first time an unambiguous analysis ofhormone responsiveness in one clonally derived population ofcells . Thus, for example, it is possible to state that : (1) cellsderived from certain individual cells cloned from the calvariumcan respond to both PTH and PGE2, and (2) other cells canrespond only to PTH. It is evident that both the magnitudeand the peak time ofresponse differ in different clones, thoughsome clones may be similar to each other. It would be ofinterest to isolate and screen a variety ofother clones to extendthis catalogue ofhormone responsiveness . (d) Individual clonesof osteoblastlike cells were capable of synthesizing both type Iand type III collagens . Previously such a conclusion has beenpostulated from some studies (26) but, as populations of cellsin all these former studies were mixed, it was not possible torule out the presence of a type III-producing contaminatingsubpopulation in the population of predominantly type I-producing cells .The possibility that PTH and PGE2 responsiveness might be
associated with different cell types within osteoblastlike popu-lations was suggested previously (8) . In the experiments re-ported there, cAMP responses to PTH and to PGE2 variedindependently of each other when such populations were sub-cultured. The first unequivocal evidence that osteoblastlike cellpopulations responding to PTH but not to PGE2 did exist wasprovided by the fact that ROS 17/2 cells responded to PTHand not to PGE2 (G . Rodan, personal communication) . How-ever, since these cells represent transformed osteoblastlike cells,this observation might not necessarily imply that such celltypes would exist in the nontransformed state . Unfortunately,it is not clear whether the nontransformed PTH-responsive andPTH- and PGE2-responsive osteoblastlike cells isolated in thepresent communication are derived from and similar to osteo-blasts, preosteoblasts, or undifferentiated osteoprogenitor cells.Further investigations of the metabolic properties ofthese cellsin a variety of in vitro and in vivo systems are required tofurther our knowledge in this regard.
Since mineralized bone is generally considered to containonly type I collagen (17) and transformed bone cells have beenreported to synthesize essentially only type I collagen (30), thesynthesis of type III collagen by the cloned bone cells is,perhaps, surprising . However, it is apparent that most cellsproduced very small amounts of this collagen, and it is notknown whether type III collagen is synthesized by bone cellsin vivo. Immunohistochemical analyses have indicated that asmall amount of type III collagen may be present in mineral-ized alveolar bone (31), but at these levels this would bedifficult to determine biochemically.
Despite differences in the relative amounts of the interstitialcollagens synthesized by the clones, the procollagen profileswere similar. A low amount of procollagen peptidase activityis often found for connective tissue cells in culture. However,the predominance of pn intermediates over pc intermediates isnot usually observed. The apparent absence of fibronectin inradiolabeled culture media is also in contrast to most fibroblastsystems . A similar observation has been made with mixed bonecells but only after an extended time in culture (6) . Thesignificance ofthis with respect to cell attachment by bone cellsremains to be investigated .Such a detailed analysis of GAG production in cloned or
460
THE JOURNAL Of CELL BIOLOGY " VOLUME 92, 1982
mixed cultured bone cells has not been done previously . Allclones isolated and analysed synthesized four GAG: HA, HS,DS, and CS (probably CS4). The predominant GAG associatedwith cortical bone in vivo appears to be CS4 (4, 15) . Medullarybone, formed in the marrow cavity of bird long bones inresponse to estrogen, however, contains predominantly keratansulfate (4) . We are not aware of any detailed studies withregard to the GAG composition of osteoid or of woven bone,but it has been reported (32) that the sulfur content of osteoiddecreases dramatically at the mineralization front in youngrats . Of interest is the observation that GAG appear to bealtered in osteogenesis imperfecta (3) . A high percentage oftheGAG in the bone cell clones reported here was found in thecell layer as compared with the growth medium. In contrast, infibroblasts, usually <20% of the GAG is found in the cell layer,although in very dense cultures this percentage may increase .Clones with lower cell numbers had less material in the celllayer. This, combined with the extensive multilayering of theclones, suggests that considerable GAG may be built up in anextracellular matrix in the cell layer . The high proportion ofHS in the cell layer as opposed to the growth medium is alsoconsistent with a large amount of GAG in the cell layer andmultilayering, since HS tends to be associated with the cellsurface . It is notable, however, that clone RCF 1 .5 also main-tained a high percentage of GAG in the cell layer, although ithad a strikingly fibroblast morphology and did not multilayerto any appreciable extent . This might argue that the GAGproduction by bone cells may be quite different from that offibroblast-type cells . In this respect, it is interesting to note thatwhile all the clones were broadly similar, each clone had acharacteristic GAG profile .What effect long-term culturing has had or will have on
these bone cell clones is not yet known . All previous longer-term studies were carried out on mixed bone cell populationsin which true genotypic and phenotypic alterations could notbe separated unambiguously from outgrowth of certain sub-populations of cells. Preliminary data are available for a num-ber of properties . After isolation, through at least 15 subcul-tures, the cells maintained approximately their growth prop-erties . Gradually, these parameters altered (e .g ., RCJ 1 .20, RCJ1 .30, in Table I) . Ifrelated to senescence as frequently reportedfor human diploid fibroblasts (6) and many other cells (forreviews, see references 5, 12, 18, 20, 27), then interestingly theCPDL for both these clones are now above 100, the to havenot lengthened, and morphologically the cells do not displayclassical symptoms of senescence . Most of the clones (>80%o)could not be propagated past CPDL of ~20 and may havebeen typically senescent . Since clones with long lifespans rep-resented < 1% ofthe starting cell population, they may comprisea small subpopulation of cells with much longer proliferativepotential. An alternative hypothesis is that some of the clonesmay spontaneously transform in culture, as might be expectedfrom their rodent origin . Further investigation of this point isongoing. The fact that at least some characteristics ascribed tospecialized bone cells survive in these cloned populations forlong periods of time in vitro provides a new system for studyingdifferentiated functions in this important cell type.
We thank S . Barnes, D. Jez, and K.-L . Yao for excellent technicalassistance .
Receivedforpublication 24April 1981, andin revisedform 11 September1981 .

Note Added in Proof:
Further experiments have indicated that notonly growth properties, but also hormone response, may change withextended time in culture . In addition, some clones acquire the propertyoftumorigenicity .
REFERENCES
1 . Breen, M � H. G . Weinstein, M . Andersen, and A. Veis. 1970 . Microanalysis and charac-terization of acidic glycosaminoglycans in human tissues. Anal. Biochem . 35 :146-159 .
2 . Brown, B. L., J . D. M. Albano, R. P. Elkins, and M . A. Szherzi . 1971 . A simple andsensitive saturation assay method for the measurement of adenosine 3'5'-cyclic mono-phosphate . Biochem . J. 121 :561-573 .
3 . Cetta, G., L. Lenzi, C. Balduini, M . Valli, R. Tenni, C. De Luca, and A. Castellan. 1980 .Glyoosaminoglycan alterations in osteogenesis imperfecta . Ital. J. Biochem. (Engl. Ed.).29J37-350.
4 . Fisher, L . W ., and H. Schraer . 1980. The glycosaminoglycans of estrogen-induced med-ullary bone in Japanese quail. Arch . Biochem. Biophys. 205 :396--003 .
5 . Goldstein, S . 1979. Senescence. In Endocrinology . L . J, Degroot, L. Martinit, 1 . Potts, D.Nelson,A. Winegrad, W . Odell, E. Steinberger, and G . Cahill, editors. Grime & Stratton,Inc ., New York . Vol. 3. 2001-2028 .
6 . Hayflick, L. 1977. The cellular basis for biological aging . In TheHandbook of the Biologyof Aging. E. C . Finch and L. Hayflick, editors . Van Nostrand Reinhold, New York . 159-186 .
7 . Heersche, 1 . N . M., M . P . M . Heyboer, and B. Ng. 1978. Hormone specific suppression ofadenosine 3',5'-monophosphate responses in bone in vitro during prolonged incubationwith parathyroid hormone, prostaglandin E, and calcitonin. Endocrinology. 103 :333-340 .
8 . Heersche, J . N . M., H. K . Moe, D. M. Brunette, A . V . Rao, S . Reimers, and L . G . Rao.1977 . Long term culture of parathyroid hormone and prostaglandin E, responsive bonecells in monolayeres and on artificial capillaries . Calcif. Tissue Res . 22(Suppl):275-282 .
9 . Hronowski, L., and T. P . Anastassiades . 1980. The effect of cell density on net rates ofsynthesis of glycosaminoglycan synthesis and secretion by cultured rat fibroblasts . J. Biol.Chem. 255:10091-10099 .
10 . Kent, G . N., R, J . lilka, and D. V . Cohn. 1980. Homologou s and heterologous control ofbone cell adenosine 3'5'-monophosphate response to hormones by parathormone, pros-taglandin E,, calcitonin and 1-25 dihydroxycholecalciferol. Endocrinology. 107 :1474-1481 .
It . Limeback, H. F., and J . Sodek . 1979 . Procollagen synthesis and processing peroontalligament in vivo and in vitro. A comparative study using slab-gel fluorography . Eur. J.Biochem . 100:541-550 .
12. Littlefield, J. W . 1976. Variation, Senescence, and Neoplasia in Cultured Somatic Cells.Harvard University Press, Cambridge, Mass .
13. Luben, R. A ., G. L. Wong, and D. V . Cohn. 1976 . Biochemica l characterization withparathormone and calcitonin of isolated bone cells : provisional identification of osteoclastsand osteoblasts. Endocrinology. 99 :526-534.
14. Majeska, R . J., S . B . Rodan, and G . A. Rodan. 1980. Parathyroi d hormone responsiveclonal cell lines from rat osteosarcoma . Endocrinology. 107 :1494-1503 .
15 . Mathews, M. B . 1967 . Macromolecular evolution of connective tissue . Biol. Rev. Camb .Philos. Soc. 42 :499-551 .
16 . Merrilees, M . J ., M. A . Merrilees, P. S . Birnbaum, P . J . Scott, and M. H. Flint . 1977 . Theeffect of centrifugal force on glycosaminoglycan production by aortic smooth muscle cells
in culture . Atherosclerosis. 27:259-264 .17 . Miller, E . 1. 1976. Biochemical characteristics and biological significance of the genetically
distinct collagens . Mol. Cell, Biochem. 13 :165-192.18 . Mueller, S. N ., E. M . Rosen, and E . M . Levine . 1980 . Cellular senescence in a cloned
strain of bovine aortic endothelial cells . Science (Wash . D. C.). 207 :889-891 .19. Niebes, P., and M . H. Schifflers . 1975 . Micromethod for the determination of glycosami-
noglycans in the serum. Results from the serum of healthy and varicose subjects. Clin.Chim. Acta. 62 :195-202 .
20 . Pearson, M. L . 1980 . Muscle differentiation in cell culture. A problem in somatic cell andmolecular genetics . In The Molecular Genetics of Development. T . Leighton and W . F .Loonies, editors . Academic Press, Inc ., New York. 3611110 .
21 . Peck, W. A ., S. J . Birge, and S . A. Fedak. 1964 . Bon e cells : biochemical and biologicalstudies after enzymatic isolation. Science (Wash. D. C). 146:1476-1477 .
22 . Peck, W . A ., J. Carpenter, K . Messinger, and D. DeBra . 1973 . Cyclic 3'5' adenosinemonophosphate in isolated bone cells : response to low concentrations of parathyroidhormone . Endocrinology. 92 :692-697 .
23 . Peterkovsky, B., andR . Diegelmann . 1971 . Use ofa mixture of proteinase-free collagenasesfor the specific assay of radioactive collagen in the presence ofother proteins . Biochemistry.10:988-994.
24. Puzas, 1. E., A . Vignery, and H . Rasmussen . 1979 . Isolation of specific bone cell types byfree-flow electrophoresis . Calcif. Tissue Int. 27:263-268 .
25 . Rao, L . G ., B . Ng, D . M . Brunette, and J . N . M . Heersche . 1977 . Parathyroi d hormoneand prostaglandin E,-response in a selected population of bone cells after repeated storageand subculture at -80°C. Endocrinology 100:1223-1241 .
26. Scott, D . M., G . N . Kent, and D . V, Cohn . 1980 . Collagen synthesis a cultured osteoblast-like cells. Arch. Biochem. Biophys. 201 :384-391 .
27. Simonian, M . H ., P . J . Hornsby, C . R . Ill, M . 1 . O'Hare, and G . N . Gill . 1979 .Characterization of cultured bovine adrenacortical cells and derived clonal lines : regula-tion of steroidogenesis and culture life span . Endocrinology. 105:99-108 .
28 . Smith, D . M ., C . C . Johnston, and A . R. Severson . 1973 . Studie s of the metabolism ofseparated bone cells. Calcif. Tissue Res. 11 :56-69 .
29. Sodek, J ., and H . F. Limeback . 1979. Comparison of the rates of synthesis, conversion,and maturation of type I and type III collagens in rat periodontal tissues . J. Biol. Chem.254:10496-10502 .
30. Stern, R ., J . Wilczek, W. P. Thorpe, S . A. Rosenberg, and G . Cannon. 1980 . Procouagensas markers for the cell of origin of human bone tumors. Cancer Res. 40 :325-328 .
31 . Wang, H .-M ., V . Nanda, L . G . Rao, A . H . Melcher, and J . N . M. Heersche . 1980 . Specificimmunohistochemical localization of type III collagen in porcine periodontal tissues usingthe peroxidase-antiperoxidase method . J. Histochem . Cytochem . 28:1215-1223 .
32. Wergedal, J . E., and D . J . Baylink . 1974 . Electro n microprobe measurements of bonemineralization rate in vivo. Am. J. Physiol. 226:345-352 .
33 . Williams, D . C ., G. B . Bader, R . E. Toomey, D . C . Paul, C. C . Hillman, Jr ., K. K. King,R . M . Van Frank, and C. C . Johnston, Jr. 1980 . Mineralization and metabolic response inserially passaged adult rat bone cells . Calcif. Tissue Int. 30:233-246 .
34. Wong, G ., and D . V. Cohn. 1974. Separation of parathyroid hormone and calcitonin-sensitive cells from non-responsive bone cells. Nature (Land.). 252 :713-715 .
35 . Wong, G . L ., and D . V . Cohn. 1975. Target cells in bone for parathormone and calcitoninare different : enrichment for each cell type by sequential digestion of mouse calvaria andselective adhesion to polymeric surfaces. Proc. Nall. A cad. Sci. U. S. A . 72 :3167-3171 .
36. Wong, G . L., and D . V. Cohn . 1978 . The effect of parathormone on the synthesis ofcollagenous matrix by isolated bone cells. In Mechanism of Localized Bone Loss . (Specialsupplement to Calcified Tissue Abstracts). J . E. Horton, T . M . Tarpley, and W. F. Davis,editors. Information Retrieval, Washington, D . C . 47 .
AUBIN ET AL.
Isolation of Bone Cell Clones with Different Properties
461