isolation, molecular characterization of food-borne...
TRANSCRIPT
ISOLATION, MOLECULAR CHARACTERIZATION OF FOOD-BORNE DRUG RESISTANT SALMONELLA spp. AND DETECTION OF CLASS 1 INTEGRONS
A THESIS SUBMITTED TO THE GRADUATE SCHOOL OF NATURAL AND APPLIED SCIENCES
OF MIDDLE EAST TECHNICAL UNIVERSITY
BY
M. DĐLEK AVŞAROĞLU
IN PARTIAL FULFILLMENT OF THE REQUIREMENTS FOR
THE DEGREE OF DOCTOR OF PHILOSOPHY IN
BIOTECHNOLOGY
SEPTEMBER 2007

Approval of the thesis:
ISOLATION, MOLECULAR CHARACTERIZATION OF FOOD-BORNE DRUG RESISTANT SALMONELLA SPP. AND DETECTION OF CLASS 1
INTEGRONS submitted by M. DĐLEK AV ŞAROĞLU in partial fulfillment of the requirements for the degree of Doctor of Philosophy in Biotechnology Program, Middle East Technical University by, Prof. Dr. Canan Özgen Dean, Graduate School of Natural and Applied Sciences, METU Prof. Dr. Fatih Yıldız Head of Department, Biotechnology, METU Prof. Dr. Faruk Bozoğlu Supervisor, Food Engineering Dept., METU Prof. Dr. Mustafa Akçelik Co-Supervisor, Biology Dept., AÜ Examining Committee Members: Prof. Dr. Cumhur Çökmüş Biology Dept., AÜ Prof. Dr. Faruk Bozoğlu Food Engineering Dept., METU Prof. Dr. Gülay Özcengiz Biology Dept., METU Dr. Beatriz Guerra Federal Institute for Risk Assessment, Germany Assoc. Prof. Dr. Candan Gürakan Food Engineering Dept., METU
Date: 3 September 2007

iii
I hereby declare that all information in this document has been obtained and presented in accordance with academic rules and ethical conduct. I also declare that, as required by these rules and conduct, I have fully cited and referenced all material and results that are not original to this work. Name, Last Name: M. Dilek, AVŞAROĞLU
Signature:

iv
ABSTRACT
ISOLATION, MOLECULAR CHARACTERIZATION OF FOOD-BORNE DRUG RESISTANT SALMONELLA spp. AND DETECTION OF CLASS 1
INTEGRONS
AVŞAROĞLU, M. Dilek
Ph.D., Biothecnology Program
Supervisor: Prof. Dr. Faruk BOZOĞLU
Co-Supervisor: Prof. Dr. Mustafa AKÇELĐK
September 2007, 153 pages In this study, 59 epidemiologically unrelated Salmonella strains isolated from foods
in Türkiye and 49 Salmonella strains obtained from National Salmonella Reference
Laboratories of Germany were analysed. For the characterization of strains, analyses
such as serotyping, phage typing, antibiotyping and molecular biological
characterization were done. The strains exhibited 17 different serotypes with S.
Enteritidis serotype and PT21 phage type being the most prevalent in Turkish
isolates. The highest antimicrobial resistance was observed against NAL for Turkish
strains, whereas it was against SUL for strains from German origin. Molecular typing
of all strains exhibited different plasmid profiles and PFGE patterns. There were
1-4 plasmids/profile for Turkish strains and 1-7 plasmids/profile for German strains.
The PFGE patterns revealed 42 different subgroups, having two major clusters with
44,3% arbitrary homology. Among 72 resistant strains, the most prevalent resistance
genotypes were observed as blatem-1 (%56, AMP resistance); floR (%100, CHL and
FFC resistance); aphA1 (%100, KAN and NEO resistance); tet(A) (%53, TET
resistance); aadA1 (%82, SPE and STR resistance); sulI (%78, SUL resistance). The
class I integron variable region analyses exhibited 700 bp (1 strain), 1000 bp (37
strain), 1200 bp (16 strain) and 1600 bp (3 strain) integrons.
Keywords: Salmonella, antimicrobial resistance, lateral gene transfer

v
ÖZ
ĐLAÇ D ĐRENÇLĐLĐĞĐ GÖSTEREN GIDA KAYNAKLI SALMONELLA spp. SUŞLARININ ĐZOLASYONU, MOLEKÜLER KARAKTER ĐZASYONU VE
SINIF 1 ĐNTEGRONLARIN ARA ŞTIRILMASI
AVŞAROĞLU, M. Dilek
Doktora, Biyoteknoloji Enstitü Anabilim Dalı
Tez Yöneticisi: Prof. Dr. Faruk BOZOĞLU
Ortak Tez Yöneticisi: Prof. Dr. Mustafa AKÇELĐK
Eylül 2007, 153 sayfa
Bu çalışmada, Türkiye’de gıdalardan izole edilen 59 adet epidemiyolojik açıdan
farklı Salmonella suşu ve Almanya Ulusal Salmonella Referans Laboratuvarlarından
elde edilen 49 adet Salmonella suşu analiz edilmiştir. Suşların karakterizasyonu için
serotiplendirme, faj tiplendirmesi, antibiyotiplendirme ve moleküler biyolojik
karakterizasyon gibi analizler yapılmıştır. Türk izolatları en yaygını S. Enteritidis
serotipi ve PT21 faj tipi olmak üzere 17 farklı serotip göstermiştir. En yüksek
dirençlilik Türk suşları için nalidiksik asite karşı gözlenirken Alman suşları için
sulfonamid bileşenlerine karşı olmuştur. Suşların moleküler tiplendirmesi farklı
plazmid ve PFGE profilleri göstermiştir. Türk suşları için 1-4 adet plazmid/profil ve
Alman suşları için ise 1-7 adet plazmid/profil elde edilmiştir. PFGE profilleri 42 ayrı
altgrup oluşturarak 44,3% homoloji ile iki ana grupta toplanmıştır. 72 adet dirençli
suşta en yaygın olarak blatem-1 (%56, AMP direnç); floR (%100, CHL ve FFC
direnç); aphA1 (%100, KAN ve NEO direnç); tet(A) (%53, TET direnç); aadA1
(%82, SPE ve STR direnç); sulI (%78, SUL direnç) antibiyotik direnç genleri
gözlenmiştir. Çalışmada 700 bç (1 suş), 1000 bç (37 suş), 1200 bç (16 suş) ve1600
bç (3 suş)’lik sınıf I integronlara ait farklılaşmış bölgeler elde edilmiştir.
Anahtar Kelimeler: Salmonella, antimikribiyel dirençlilik, lateral gen transferi

vi
To Whom I Love;
Annem, Babam ve Abime

vii
ACKNOWLEDGMENTS
I wish to express my deepest gratitude to my supervisors Prof. Dr. Faruk BOZOĞLU
and Prof. Dr. Mustafa AKÇELĐK for their guidance, advice, criticism,
encouragements and insight throughout the research. I would also like to appreciate
Dr. Beatriz GUERRA who was abundantly helpful, and supported me for this study.
It was a pleasure for me not only to work with but also to know her personally.
I would like to gratitude Dr. Reiner HELMUTH, Dr. Andreas SCHROETER and Dr.
Karsten NOECKLER for their critical discussions and advices and for their support
on my thesis by allowing me to work in their laboratories. I would also like to thank
Assoc. Prof. Dr. Çağla TÜKEL both for her contribution to my PhD. project and for
her encouraging and supportive friendship. I would like to thank to TIK Committee
members, Prof. Dr. Cumhur ÇÖKMÜŞ and Assoc. Prof. Dr. Candan GÜRAKAN for
their support and criticism about this study.
I would like to thank all the people I know in Federal Institute for Risk Assessment
in Germany namely Cornelia, Ernst, Manu, Franzi, Gaby, Burkhard and Stephan; Dr.
Christina Dorn, Dr. Angelika Miko and Karin; Dr. Stephan Hertwig and Jens; Britta,
Christina and Antje; Istvan, Kathrine, Alessandro, Angelika, Enno, Gaby, Peter,
Barny and Janine for making easy and enjoyable to work in a foreign country, where
I did not feel lonely with their supports. I would like to thank my colleagues Banu
and Nefise for their helps and for making a good working atmosphere. I would also
thank to my father and my brother for their support and unshakable faith in me
throughout this hard working period. I thank to my beloved friends Neslihan, Aycan
and Elif for their understanding, encouragements and being always by my side.
This study was supported by the Middle East Technical University, Scientific
Researches Directorate Grant No: BAP-08 -11-DPT-2002K120510.

viii
TABLE OF CONTENTS
ABSTRACT............................................................................................................... .iv ÖZ ................................................................................................................................ v ACKNOWLEDGEMENTS....................................................................................... vii TABLE OF CONTENTS.......................................................................................... viii LIST OF TABLES ..................................................................................................... xii LIST OF FIGURES .................................................................................................. xiv ABBREVIATOINS .................................................................................................. xvi CHAPTER
1. INTRODUCTION.............................................................................................. 1 2. LITERATURE SURVEY..................................................................................3
2.1 General Properties of the Genus Salmonella.......................................... 4 2.2 Salmonella Typing .................................................................................. 5
2.2.1 Serotyping ................................................................................ 8 2.2.2 Phage Typing ........................................................................... 9 2.2.3 Molecular Methods ................................................................ 10
2.3 Salmonella Pathogenicity and Risk of Food Contaminations............... 12 2.4 Salmonella Infections in Türkiye .......................................................... 14
2.5 Antimicrobials and Antimicrobial Resistance ...................................... 15
2.6 Antimicrobial Patterns of Salmonella Isolates in Türkiye .................... 25
2.7 Horizontal Transfer of Antimicrobial Resistance................................. 25
2.7.1 Plasmids ................................................................................. 26

ix
2.7.2 Transposons ........................................................................... 26
2.7.3 Integrons................................................................................. 26
2.7.4 Genomic Islands..................................................................... 28 2.8 Aims of the Present Study .................................................................... 29
3. MATERIALS AND METHODS................................................................... 30
3.1 Bacterial Strains and Bacteriophages.................................................... 31 3.2 Bacterial Isolations................................................................................ 31 3.3 Serotyping ............................................................................................. 36 3.4 Phage Typing ........................................................................................ 38 3.5 Plasmid Profiling................................................................................... 39
3.5.1 Plasmid Isolation .................................................................... 39 3.5.2 Agarose Gel Electrophoresis and Gel Documentation ........... 39
3.6 Pulsed Field Gel Electrophoresis (PFGE) ............................................ 40 3.6.1 Preparation of PFGE Plugs From Agar Cultures.................... 40 3.6.2 Lysis of Cells in Agarose Plugs.............................................. 40 3.6.3 Washing of Agarose Plugs...................................................... 40
3.6.4 Restriction Enzyme Digestion with XbaI ............................... 41
3.6.5 Casting Pulsed Field Agarose Gel .......................................... 41
3.6.6 Electrophoresis Staining and Documentation of Pulsed Field
Agarose Gel ............................................................................ 41
3.6.7 Cluster Analysis...................................................................... 41
3.7 Antimicrobial Susceptibility Testing .................................................... 42 3.7.1 Disk Diffusion Method........................................................... 42 3.7.2 Minimal Inhibitory Concentration (MIC) Method................. 42
3.8 Genotypic Characterization of Antimicrobial Resistance .................... 43

x
3.8.1 Raw-DNA Isolation................................................................ 43 3.8.2 PCR Amplifications................................................................ 43
3.8.3 Agarose Gel Electrophoresis and Gel Documentation ........... 44 3.8.4 DNA Sequence Analysis ........................................................ 44
3.9 Detection of Class 1 Integrons.............................................................. 50 3.10 Conjugation........................................................................................... 50
3.11 Southern-Blotting and DNA-Hybridization Analysis........................... 51
3.11.1 Southern-Blotting ................................................................. 51 3.11.2 DNA Probe Preparation ....................................................... 51
3.11.3 DNA Hybridization .............................................................. 52
3.11.4 Post-Hybridization Process .................................................. 52
3.12 Cloning ............................................................................................... 53
3.12.1 Restriction Analyses............................................................. 53 3.12.2 Ethanol Precipitation ............................................................ 53
3.12.3 Ligation ................................................................................ 54
3.12.4 Tranformation....................................................................... 54
3.12.5 DNA Sequencing by Primer Walking.................................. 54
3.13 Plasmid Incompatibility Group Detection.......................................... 55
4. RESULTS ...................................................................................................... 59
4.1 Isolation and Typing of Salmonella Samples..................................... 60
4.1.1 Isolation and Biochemical Characterization of the Strains .. 60
4.1.2 Serotyping and Phage Typing .............................................. 60
4.1.3 Selected Strains from Germany............................................ 66
4.2 Antibiotic Susceptibilities of the Strains ............................................ 68
4.3 Molecular Typing of the Strains......................................................... 79

xi
4.3.1 Plasmid Profiles.................................................................... 79 4.3.2 PFGE Profiles....................................................................... 89
4.4. Genetic Determinants of Antimicrobial Resistance ........................... 93
5. DISCUSSION .............................................................................................. 106 6. RECOMMENDATIONS ............................................................................. 116
7. CONCLUSION............................................................................................ 117
REFERENCES......................................................................................................... 118 WEB REFERENCES............................................................................................... 132 APPENDIX I............................................................................................................ 133 CURRICULUM VITAE .......................................................................................... 153

xii
LIST OF TABLES
Table 2.1. Phenotypic methods for typing of Salmonella isolates (modified from Yan
et al., 2003)................................................................................................ 6
Table 2.2. Molecular methods for differentiation of Salmonella isolates (modified
from Yan et al., 2003) ............................................................................... 7
Table 2.3. Examples for the antigenic formulas of selected Salmonella enterica
subsp. enterica serotypes according to Kaufmann-White scheme(Poppoff
and Le Minor, 2001).................................................................................. 8
Table 3.1. Biochemical reactions involved in API 20E (bioMérieux, Inc., France)
test kits and typical Salmonella reactions ............................................... 34
Table 3.2. Primer pairs and PCR conditions .............................................................45
Table 3.3. Primer pairs used for the replicon typing analyses ..................................57
Table 4.1. Biochemical analysis results of the strains isolated .................................61
Table 4.2. Serotyping and phage typing results of the strains isolated......................64
Table 4.3. Serotyping and phage typing results strains obtained from Germany......67
Table 4.4. Antibiotic susceptibilities of the strains by disk diffusion method ..........70
Table 4.5. Antibiotic susceptibilities of the strains by MIC values (µg/mL) ............74
Table 4.6. PFGE profile groups of the strains ...........................................................90

xiii
Table 4.7. Genetic determinants obtained from the antimicrobial resistant strains ..94
Table A.I.1. Antimicrobial disks and their contents used in the study (Oxoid Ltd.,
UK)....................................................................................................... 134
Table A.I.2. Antimicrobial content of microtiter plates used in the analyses of
minimal inhibitory concentration ......................................................... 135
Table A.I.3. Isolation material, date, place and results .......................................... 136

xiv
LIST OF FIGURES
Figure 2.1. Schematic representation of the mechanisms of antimicrobial resistance
(modified from http://www.chembio.uoguelph.ca/merrill/research/
enzyme_mechanisms. html) .................................................................... 17
Figure 2.2. Typical structure of a class 1 integron (modified from Carattoli et al.,
2001)........................................................................................................ 28
Figure 3.1. Schematic representation of serotyping analyses of Salmonella............ 32
Figure 3.2. Typical Salmonella reaction of API 20E test kit .................................... 33
Figure 3.3. Serotyping analysis scheme for Salmonella........................................... 37
Figure 4.1. Plasmid profiles of Turkish origin S. Montevideo, S. Thompson and
S. subsp. I Roughform strains.................................................................. 80
Figure 4.2. Plasmid profiles of Turkish origin S. Virchow strains............................ 81
Figure 4.3. Plasmid profiles of Turkish origin S. Enteritidis strains......................... 82
Figure 4.4. Plasmid profiles of Turkish origin S. Infantis strains ............................. 83
Figure 4.5. Plasmid profiles of German origin S. Agona, S. subsp. I Rough form, S.
Kentucky, S. Thompson, S.Virchow ve S. Enteritidis strains ................. 84
Figure 4.6. Plasmid profiles of German origin S. Infantis strains............................. 85
Figure 4.7. Plasmid profiles of German origin S. Typhimurium strains................... 86

xv
Figure 4.8. Dendogram showing the similarities between the strains having different
PFGE patterns .........................................................................................92
Figure 4.9. Results of the integron analysis of antimicrobial resistant strains from
Turkish origin.......................................................................................... 97
Figure 4.10. Results of the integron analysis of antimicrobial resistant strains from
German origin .........................................................................................98
Figure 4.11. PCR-RFLP analysis of Turkish origin integron containing strains .... 100
Figure 4.12. blaCTX-M3 hybridization of the plasmid pBD2006. P: plasmid pBD2006;
M1: marker (169 kb; 93,93 kb; 54,54 kb; 6,36 kb);
C1: positive control 1; C2: positive control 2; M2: marker (Roche
GmbH., Germany) .............................................................................. 101
Figure 4.13. Restriction digestion of pRQ2006; 1: Marker (λ DNA-PstI), 2: DMC9
plazmid DNA, 3: BamHI, 4: EcoRI, 5: HindIII, 6: PstI, 7: PvuI, 8: SalI,
9: Marker, 10: DMC9 plasmid DNA, 11: HindIII, 12: HincII, 13: XbaI,
14: SmaI, 15: EcoRV, 16: SacI, 17: Bsp120-I, 18: XhoI....................... 103
Figure 4.14. Restriction digestion of the vector plasmid from the transformant strains
having 1-5: EcoRV restriction digest, 6: HindIII restriction digest, 7:
Marker (Lambda DNA EcoRI-digest)................................................... 104
Figure 4.15. Restriction and hybridisation analysis of the plasmid pRQ2006. 1:
HincII; 2: HindIII; 3: EcoRI; 4: EcoRV; M: Molecular weight marker
used phage lambda DNA digested with HindIII; and P: undigested
pRQ2006.......................................................................................... 105

xvi
ABBREVIATIONS
°C Degree Celcius
AFLP Amplified Fragment Length Polymorphism
AMC Amoxicillin/clavulanic acid
AMP Ampicillin
ATM Aztreonam
BPW Buffered Peptone Water
BSA Bismuth Sulfite Agar
CAZ Ceftazidime
CDC Centers for Disease Control and Prevention
CHL Chloramphenicol
CIP Ciprofloxacin
CLSI Clinical Laboratory Standards Institute
COL Colistin
CPD Cefpodoxime
CRO Ceftriaxone
CTX Cefotaxime
CXM Cefuroxime
DNA Deoxyribonucleic Acid
DT Definitive Type
EFT Ceftiofur
EMB Eosin Methylene Blue
ESBL Extended Spectrum β-Lactamase
FFC Florfenicol
FOX Cefoxitine
GEN Gentamicin
h Hour
IMP Imipenem
Inc Incompatibility

xvii
IS Insertion Sequence
KAN Kanamycin
kb Kilobase
LB Luria Bertani
MIC Minimum Inhibitory Concentration
min Minute
MKKTTn Müller Kauffmann Thetrathionate Novobiocin Broth
MLST Multilocus Sequence Typing
NAL Nalidixic acid
NEO Neomycin
NT Non-Typable
PCR Polymerase Chain Reaction
PFGE Pulsed Field Gel Electrophoresis
PT Phage Type
QRDR Quinolone Resistance Determining Region
RAPD Randomly Amplified Polymorphic DNA
RDNC Reacting with the typing phage, but lytic pattern Did Not Correspond to
any recognized phage types
RFLP Restriction Fragment Length Polymorphism
RNA Ribonucleic Acid
RVB Rappaport Vassiliadis Broth
SGI1 Salmonella Genomic Island 1
SPT Spectinomycin
STR Streptomycin
SUL Sulfonamide compounds
SXT Trimethoprim/sulfamethoksazol
TET Tetracycline
TMP Trimethoprim
Tn Transposon
WHO World Health Organization
XLD Xylose Lysine Deoxycholate

1
CHAPTER 1
INTRODUCTION
Salmonella infections are one of the most prevalent food-borne infections both in
Türkiye and worldwide. Infections via animal origin foods especially poultry, meat,
egg, and raw milk are the sources of the illness that Salmonella cause so called
“salmonellosis”. The patient has the symptoms stomachache, fever, diarrhoea, nausea
and vomiting whereas life-threatening for the infants, elderly and
immunocompromised patients.
There are over 2500 serotypes among Salmonella and to track the epidemics, it is
needed to perform detailed characterization by different typing methods. Among
Salmonella serotypes S. Enteritidis, S. Typhimurium and S. Virchow share the first
three places in the Top10 list of Salmonella infections in Europe.
Since 1950s antimicrobial resistance among Salmonella serotypes has became
prevalent. Due to the common use of antimicrobials not only for treatment of
infections but also for using as animal growth promoters, selective pressure is
established where antimicrobial resistant strains overcome and maintain growth.
Acquired resistance causes serious problems in the treatment of severe cases of
salmonellosis.
Either by mutations or by lateral gene transfer, bacteria acquire resistance. Especially
through plasmids, transposons and integrons lateral gene transfer maintains the quick
spread of resistance. One of these mobile genetic elements, the integrons, is the main
subject of the research on antimicrobial resistance, since they maintain a platform for
gene cassettes encoding antimicrobial resistance. In Salmonella genus, multidrug
resistance is related to class I integrons.

2
The thesis concerns characterization of antimicrobial resistant serotypes of
Salmonella and the prevalence of class I integrons. For this aim, food samples of
animal origin were collected from several different markets and from one dairy
factory from which Salmonella strains were isolated and characterized. In addition to
this isolates, a number of other strains added from the culture collection of
Salmonella Reference Laboratories in Germany. Strains were characterized by
serotyping, phage typing, plasmid profiling and pulsed field gel electrophoresis. The
antimicrobial susceptibilities were analysed by both disk diffusion and minimal
inhibitory concentration studies. The genotypic properties of the resistance obtained
were detected by PCR amplification and DNA sequence analysis. To reveal the
relation of resistance with mobile genetic elements and lateral gene transfer,
conjugation, transformation and class I integron detection was performed. This study
exhibited the prevalent serotypes and their antimicrobial resistance of Turkish food
origin Salmonella strains and their similarities with German Salmonella isolates.

3
CHAPTER 2
LITERATURE SURVEY
In this chapter, a review of current knowledge in the literature about Salmonella and
antimicrobial resistance is given. The genus Salmonella is discussed by its genus
properties, infections and epidemiology. To provide an overview of characterization
of Salmonella, typing techniques are described. Thereafter, the dimensions of
Salmonella infections both worldwide and in Türkiye are argued. Subsequently,
antimicrobial resistance of Salmonella is discussed. The most common antimicrobial
groups are presented and resistance mechanisms reported for Salmonella against
those groups of antimicrobials are explained. Later, the spread of antimicrobial
resistance are detailed with a special focus on horizontal gene transfer. Finally, the
aim of the study is explained.

4
2.1. General Properties of the Genus Salmonella
The genus Salmonella belongs to the family Enterobacteriaceae whose members are
Gram-negative, nonspore-forming, facultatively anaerobic, glucose fermenting,
nitrate reducing, oxidase-negative, and straight rods of about 0.7-1.5 X 2.0-5.0 µm.
Most Salmonella are motile via peritrichous flagellae except S. Gallinarum and
S. Pullorum. The chromosome of type strain S. Typhimurium LT2 is 4857 kilobases
(kb) with the G+C% content of 53%. Genetic relatedness of the genus is 85-100%.
Based on their biochemical capacities; members of the genus Salmonella can be
differentiated from other genera within the family Enterobacteriaceae (Le Minor,
1984; McClelland et al., 2001).
Salmonella nomenclature has changed many times and still is not stable. The genus
Salmonella was previously differentiated into two species: Salmonella enterica and
Salmonella bongori. However, a new species, S. subterranea was identified and
validated (Shelobolina et al., 2004; Validation List No: 102, 2005). Among them, the
species Salmonella enterica (S. enterica) is further divided into the six subspecies S.
enterica subsp. enterica (I), S. enterica subsp. salamae (II), S. enterica subsp.
arizonae (IIIa), S. enterica subsp. diarizonae (IIIb), S. enterica subsp. houtenae (IV),
and S. enterica subsp. indica (VI). Formerly, S. bongori was the subspecies V, but
later considered as a separate species (Fluit, 2005; Tindall et al., 2005).
Fermentation of selected substances, such as dulcitol, malonate, sorbitol, d-tartrate,
galacturonate, mucate, salicine, ONPG, and lactose, as well as production of
enzymes such as gelatinase, γ-glutamyl-transferase or β-glucuronidase, but also lysis
by phage O1 allow a differentiation between the different species and subspecies (Le
Minor 1984).
Furthermore, the genus composed of over 2500 serotypes differentiated according to
three different types of surface antigens discussed in section 2.2.1 in more detail.
99% of these serotypes belong to S. enterica and nearly 60% of them are in
S. enterica subsp. enterica. The average DNA sequence similarity between
Salmonella serotypes is 96-99% (Edwards et al., 2002).

5
2.2. Salmonella Typing
Salmonella outbreaks often result from the spread of a strain whose progeny are
genetically closely related. Thus, a better understanding of Salmonella epidemiology
to control Salmonella infections is essential. The determination of the relatedness of
strains within a Salmonella serotype is a prerequisite for the identification of the
sources of infection and for tracing the routes of Salmonella dissemination in
outbreaks. Since biochemical analysis did not further differentiate between the
bacteria assigned to the same S. enterica subspecies, other methods have been used
including serotyping, phage typing, and molecular analyses (Olsen, 2000; Riley,
2004).
For the purpose of strain differentiation a number of typing methods have been
improved. In general, they are classified into two major groups that are conventional
(=phenotypic) methods, such as serotyping and phage typing (Table 2.1) and
molecular (=genotypic) methods, such as plasmid profiling, insertion sequence (IS)
typing, ribotyping, randomly amplified polymorphic DNA analysis (RAPD),
amplified fragment length polymorphism (AFLP), pulsed field gel electrophoresis
(PFGE) and multilocus sequence typing (MLST) (Table 2.2). An ideal typing method
should fulfil the following six criteria: typeability, reproducibility, discriminatory
power, and ease of interpretation, easy to use, and low cost. Any method used
currently for typing of Salmonella strains is an ideal method alone in terms of these
criteria, but all methods exhibit benefits and also limitations (Olive and Bean, 1999;
Aarts et al., 2001; Yan et al., 2003; Lukinmaa et al., 2004). In the choice of the most
suitable methods for a typing system, besides considering the limitations, the aims of
the studies (e.g. identification of the sources of infections, reconstruction of the
chains of infection, distinguishing between an outbreak-related and –unrelated strain,
global epidemiological studies) can play an important role (Riley, 2004).
It is obvious that it is difficult to find a single method, which is most suitable for
typing of Salmonella strains. As a consequence, typing systems – consisting of
several different methods – are preferentially used. In such complex typing systems,
individual methods may serve to answer different questions and limitations of one
method may be compensated by other methods.

6
Table 2.1. Phenotypic methods for typing of Salmonella isolates (modified from Yan et al., 2003).
Method Typeability* Reproducibility Discrimination Comments Biotyping All Very good Poor Relatively cost-effective, easy and fast to
perform highly discriminative systems are not available for all different types of bacterial
pathogens
Serotyping Variable Good – very good Good Easy and fast to perform (slide agglutination), standardised antisera are only commercially available for a subset of bacterial pathogens
Phage typing Variable Good Good Results are difficult to interpret, performance
of the tests can be only carried out in the National Reference Laboratories,
international standardised typing phages are only available for few bacterial pathogens
Antimicrobial resistance pattern All Good – very good Good Easy to perform according to standardised
protocols; results are easy to interpret, large variation in the discriminatory power
Whole cell protein profiles All Poor – good Poor Difficult interpretation of the mostly very
complex fragment patterns, patterns can vary according to the cultivation conditions
Multilocus-Enzyme-Electrophoresis All Good Good Difficult to standardise
* All organisms within a species must be typeable by the method used.

7
Table 2.2. Molecular methods for differentiation of Salmonella isolates (modified from Yan et al., 2003).
Method Typeability* Reproducibility Discrimination Comments Plasmid analysis Variable Poor – good Poor – good Relatively cost-effective, easy and fast to perform
instability of plasmid profiles
Ribotyping All Good – very good Good Time-consuming, no specific gene probes commercially available
IS typing Variable Poor – very good Poor – good Time-consuming, no specific gene probes
commercially available
PFGE Almost all Good – very good Good – very good Time-consuming, expensive equipment and chemicals; considerable experimental experience needed
RAPD All Poor Very good Difficult to standardise; interpretation of the results
often highly problematic, reproducibility is influenced by many different factors
AFLP All Good – very good Very good Time-consuming, expensive equipment and chemicals;
considerable experimental experience needed
MLST All Good – very good Good – very good Time-consuming, expensive * All organisms within a species must be typeable by the method used.
8
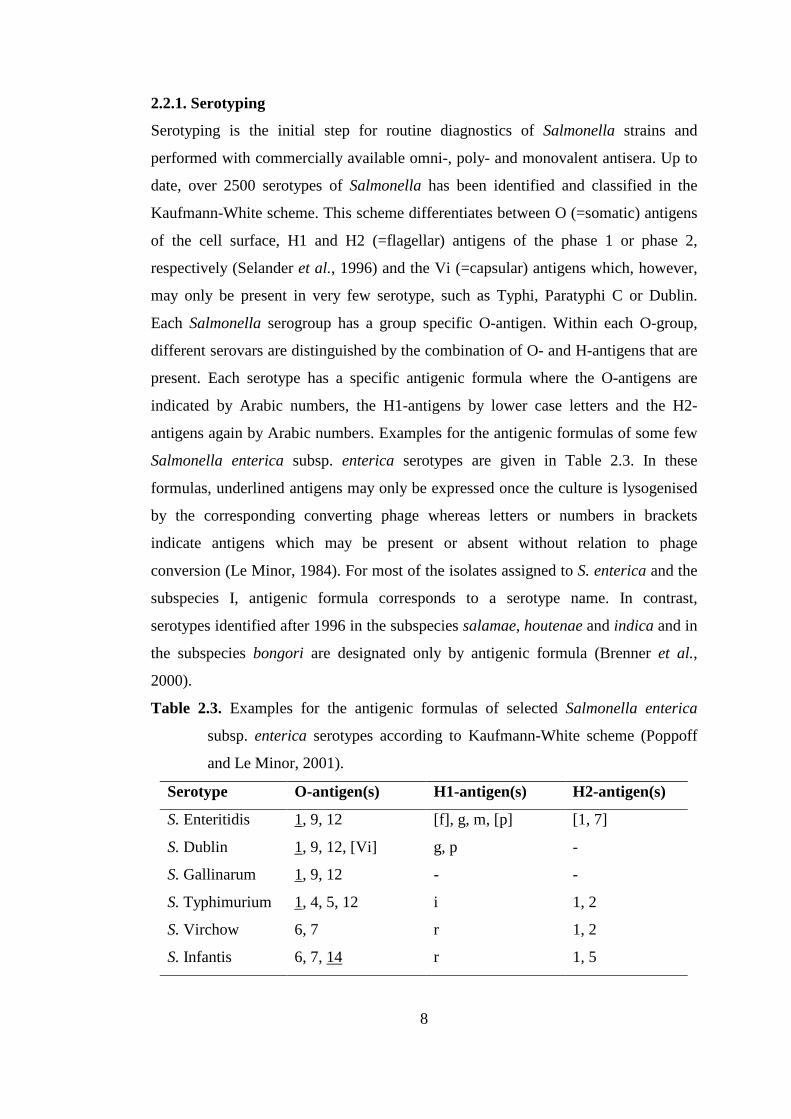
2.2.1. Serotyping
Serotyping is the initial step for routine diagnostics of Salmonella strains and
performed with commercially available omni-, poly- and monovalent antisera. Up to
date, over 2500 serotypes of Salmonella has been identified and classified in the
Kaufmann-White scheme. This scheme differentiates between O (=somatic) antigens
of the cell surface, H1 and H2 (=flagellar) antigens of the phase 1 or phase 2,
respectively (Selander et al., 1996) and the Vi (=capsular) antigens which, however,
may only be present in very few serotype, such as Typhi, Paratyphi C or Dublin.
Each Salmonella serogroup has a group specific O-antigen. Within each O-group,
different serovars are distinguished by the combination of O- and H-antigens that are
present. Each serotype has a specific antigenic formula where the O-antigens are
indicated by Arabic numbers, the H1-antigens by lower case letters and the H2-
antigens again by Arabic numbers. Examples for the antigenic formulas of some few
Salmonella enterica subsp. enterica serotypes are given in Table 2.3. In these
formulas, underlined antigens may only be expressed once the culture is lysogenised
by the corresponding converting phage whereas letters or numbers in brackets
indicate antigens which may be present or absent without relation to phage
conversion (Le Minor, 1984). For most of the isolates assigned to S. enterica and the
subspecies I, antigenic formula corresponds to a serotype name. In contrast,
serotypes identified after 1996 in the subspecies salamae, houtenae and indica and in
the subspecies bongori are designated only by antigenic formula (Brenner et al.,
2000).
Table 2.3. Examples for the antigenic formulas of selected Salmonella enterica
subsp. enterica serotypes according to Kaufmann-White scheme (Poppoff
and Le Minor, 2001).
Serotype O-antigen(s) H1-antigen(s) H2-antigen(s)
S. Enteritidis 1, 9, 12 [f], g, m, [p] [1, 7]
S. Dublin 1, 9, 12, [Vi] g, p -
S. Gallinarum 1, 9, 12 - -
S. Typhimurium 1, 4, 5, 12 i 1, 2
S. Virchow 6, 7 r 1, 2
S. Infantis 6, 7, 14 r 1, 5

9
Serotyping is easy to perform and standardized antisera are commercially available.
However, it only allows the assignment of Salmonella strains to a specific serotype,
and no further differentiation between strains of the same serotype is achieved.
Besides, a small number of S. enterica serotypes are responsible for a majority of
infections; hence subdivision of strains within a serotype is necessary.
Throughout the thesis the complete serotype designation name was replaced by an
internationally accepted abbreviated designation for the ease of reading. As an
example, instead of Salmonella enterica subsp. enterica serovar Typhimurium
(complete designation), only S. Typhimurium (abbreviated designation) was used.
2.2.2. Phage Typing
Phage typing reflects the different susceptibilities to a lytic pattern between two
strains within a serotype. A Salmonella strain is subjected to a specified set of typing
phages and the lytic pattern obtained commonly allows the assignment to a specific
phage type. The strains exhibiting a lytic pattern that does not correspond to a known
phage type are classified as RDNC (= Reacting with the typing phage, but lytic
pattern Did Not Correspond to any recognized phage types). Phage typing is mostly
performed for serotypes such as S. Typhimurium, S. Enteritidis, S. Typhi or
S. Paratyphi, although phage typing systems are also available for a number of
additional serotypes, including S. Virchow. In general, phage typing is only
performed by the National Reference Centers, since only these institutions have
access to the defined sets of typing phages. The interpretation of the results requires
considerable experience (Riley, 2004). Although, phage typing in Salmonella
epidemiology has been used since the 1950s, the stability of phage types can be
limited by phage type conversion (Rabsch et al., 2002), even during an outbreak
(Mmolawa et al., 2002). This is due to the acquisition of a temperate phage or a
plasmid. Besides, host-controlled phage defence mechanisms such as
restriction/modification systems and phage adsorption inhibition are also responsible
for the phage typing difficulties of a Salmonella strain.

10
2.2.3. Molecular Methods
The drawbacks of phenotypic typing methods have led to the development of typing
methods based on genotypic information. Currently used molecular typing methods
are based on restriction endonuclease digestion, nucleic acid amplification, or
nucleotide sequencing techniques.
One of the molecular typing methods effectively in use is plasmid analysis. It is
particularly important, since most of the plasmids harbour virulence and
antimicrobial resistance properties in Salmonella. Plasmid content of the host within
the same serotype reveals the differentiation according to the profile (the number and
molecular sizes of plasmids) obtained. The different plasmid profiles within a
serotype points the lateral transfer by gaining or loosing the plasmid(s). The plasmids
found in Salmonella differ in size 2 – 200 kb with different functionalities (Aarts et
al., 2001; Porwollik and McClelland, 2003; Rychlik et al., 2006).
Insertion sequence (IS) typing is based on the variation of insertion sequences from
strain to strain. Insertion sequences are mobile DNA elements that are able to
integrate within the bacterial genome. This diversity has been used for Salmonella
with IS200 fingerprinting (Aarts et al., 2001). Ribotyping describes the
hybridization of restriction-digested DNA fragments with probes specific for rDNA.
It results in profiles only consisting of a small number of bands, which are easy to
interpret. However, this feature also limits the ability to distinguish between closely
related strains. Therefore, ribotyping is considered not suitable for local
epidemiological studies or surveillance studies in a restricted region (Aarts et al.,
2001; Riley, 2004).
DNA amplification-based typing methods which use either specific or non-specific
primers, yield amplicon patterns exhibiting discriminations. RAPD (randomly
amplified polymorphic DNA) is performed with short (10 bases in length) random
primers at low annealing temperatures to amplify multiple fragments of bacterial
DNA. Due to the amplification conditions, this method is sensitive to slight changes
within amplification parameters, thus it is hard to achieve reproducibility. However,
ribotyping is a supplementary tool in conjunction with other typing methods (Olive

11
and Bean, 1999; Aarts et al., 2001; Yan et al., 2003). Another method, the AFLP
(amplified fragment length polymorphism) analysis combines digestion of whole
cell DNA with two suitable restriction endonucleases, ligation of suitable adapters
and subsequent PCR amplification. The resulting amplicons are labelled by
fluorescent tags and analysed using an automated sequencer. It has been considered a
highly discriminative, but labour- and cost-intensive method (Riley, 2004).
MLST (multilocus sequence typing) is a method based on the partial sequencing of
a set of housekeeping genes, which varies due to mutation or recombination events.
Nucleotide differences in the individual genes are combined and used to determine
the differentiation of strains (Yan et al., 2003). This method is extremely useful for
long-term epidemiological studies or phylogenetic analyses; however, its
discriminatory power is insufficient for short-term epidemiological studies or
outbreak investigations. The reason for this is based on the relatively high stability of
the sequenced housekeeping genes within short periods of time. Consequently,
MLST does not allow a differentiation among such strains. Besides, the costs for
MLST are still high (Enright and Spratt, 1999).
PFGE (pulsed field gel electrophoresis) has been considered as the “gold standard”
among other molecular typing methods. It has a considerable discriminatory power,
which also fulfils the criteria of typeability and reproducibility, since it is the best
standardized method (Olive and Bean, 1999; Aarts et al., 2001). By cutting the
bacterial DNA with rare-cutting restriction endonucleases and running with special
electrophoresis separation technique, it separates the large fragments of DNA
up to 12000 kb) and yields strain specific patterns. It avoids the deficiency of
common agarose-based DNA electrophoresis in separating large DNA fragments
(>50 kb). However, this method requires the presence of expensive specialized
equipment, high quality chemicals, and a considerable experience in the preparation
of the DNA-containing agarose slices. Moreover, single genetic events, such as point
mutations, integration, deletion or recombination events, can result in differences in
the fragment patterns (Tenover et al., 1995; Riley, 2004; Herschleb et al., 2007).

12
Among the molecular typing methods, PFGE is usually considered as the method of
choice to determine the molecular relatedness among Salmonella strains. It has also
been recommended as one of the methods to be used to achieve global
standardization and exchange of molecular typing data via the Internet (Lindsay et
al., 2002).
2.3. Salmonella Pathogenicity and Risk of Food Contaminations
Salmonella strains are zoonotic that infects a wide range of host organisms from
reptiles to human (Selander et al., 1996; Tükel et al., 2005; Tükel et al., 2006; Tükel
et al., 2007). Serotypes differ in their host adaptations and virulence that can be
classified into different groups (Uzzau et al., 2000). Isolates, which are pathogenic to
man belong to subspecies I (Fluit, 2005). Human-adapted serotypes, such as S. Typhi
and S. Paratyphi, cause severe typhoidal disease in humans, and not pathogenic to
animals. Contrary to this, serotypes adapted to animals such as S. Gallinarum
(poultry), S. Choleraesuis (swine), S. Abortusovis (sheep) or S. Dublin (cattle) are the
ones that cause systemic illness in their primary hosts. Non-host adapted serotypes
also differ in their virulence properties with high virulence, such as S. Enteritidis and
S. Typhimurium, or low virulence, such as S. Agona, S. Derby and S. Hadar. Despite
this classification, all animal origin serotypes are considered as potential pathogen in
humans (Giannella, 1996).
The major sources of Salmonella are mainly beef, poultry and eggs, pork and dairy
products. Once the contaminated food is ingested and Salmonella survive the acidic
environment of stomach, it colonizes in the gastrointestinal tract. Adherence of
intestinal epithelium is followed by entry to lamina propria. At this site, the bacteria
may replicate and establish a local infection, or they may be ingested by
macrophages, which may disseminate the Salmonella to deeper tissues such as
regional lymph nodes, liver, and spleen to establish a systemic infection
(Selander et al., 1996). While thyphoidal diseases occur with the invasion to blood,
gastroenteritis causing Salmonella rarely invade blood. However, this invasion also
leads to a systemic disease, which requires antimicrobial treatment of the patient.

13
The term “salmonellosis” comprises for the clinical disease gastroenteritis.
Salmonella gastroenteritis is characterized by a sudden onset of diarrhoea, headache,
abdominal pain, vomiting and fever. The incubation period is 6-72 h depending on
host and inoculum. Certain serotypes, such as S. Typhi and S. Paratyphi are the
causative agents of typhoid fever. Patients usually have fever as high as high as 40°C
in addition those mentioned symptoms. Risk factors for salmonellosis include
extremes of age, alteration of the endogenous flora of the intestine (e.g. as a result of
antimicrobial therapy or surgery), diabetes, malignancy, rheumatologic disorders,
infections like HIV, and therapeutic immunosuppressant of all types (Hohmann,
2001). The mild cases of gastroenteritis are treated by dehydration with commercial
dehydration solutions, whereas in severe gastroenteritis, septicaemia or typhoid fever
requires antimicrobial drug treatment where β-lactam and quinolone group of
antimicrobials are used.
The surveillance studies are done worldwide to control the Salmonella epidemics.
The most extensive global statistics are from World Health Organization (WHO) and
the most prevalent serotype reported is S. Enteritidis (61%) from human and
S. Typhimurium (23%) from non-human sources between the years 2000-2005
(http://www.who.int/salmsurv/links/GSSProgressReport2005.pdf). In the regional
bases, Centres for Disease Control and Prevention (CDC) and Health Protection
Agency (HPA) are the institutions conducting the survey of Salmonella epidemics in
United States and Europe, respectively. According to CDC annual report on 2005,
the number of cases of typhoid fever has been relatively small and constant, mostly
associated with travel outside the United States. S. Typhi isolates are reported
through the National Salmonellosis Surveillance System; 348 isolates were reported
in 2005. On the other hand, a total of 35.836 non-typhoidal Salmonella isolates were
reported in 2005. The national rate was 12.2 per 100.000 population. The thirty most
common serotypes of Salmonella in 2005 represent 82% of all Salmonella isolates
where S. Typhimurium, S. Enteritidis, S. Newport, and S. Heidelberg; (52% of all
isolates) were the four most common serotypes
(http://www.cdc.gov/ncidod/dbmd/phlisdata/salmtab/2005/SalmonellaAnnualSumma
ry2005.pdf). On the other hand, HPA carry out a project leading by the European

14
Commission called Enter-Net, where the international surveillance network for
human gastrointestinal infections is conducted
(http://www.hpa.org.uk/hpa/inter/enter-net_menu.htm). Enter-Net gives quarterly
reports about Salmonella every year. According to the latest quarterly report from
January-March 2007, the total number of human Salmonella isolates are 16.488 with
11.059 (67,1%) being S. Enteritidis, S. Typhimurium or S. Virchow
(http://www.hpa.org.uk/hpa/inter/enter-net/07q1summ.pdf).
2.4 Salmonella Infections in Türkiye
As in whole world, Salmonella infections are also common in Türkiye. However,
there is no national Salmonella reference centre to provide reliable statistical data
neither for outbreaks nor for isolates. Thus, tracing of Salmonella infections,
epidemics or serotype prevalence in clinical, animal or food isolates is not possible.
Attempts are made in the institute laboratories belonging to Turkish Ministry of
Agriculture to establish the routine serotyping and antibiotyping of Salmonella
isolates from foods. In a study performed by two Veterinary Research Institutes (in
Ankara and Adana, respectively) of the ministry, in the isolates from neck and wing
samples of poultry, the most prevalent serotypes were reported as S. Enteritidis
(32%), S. Virchow (31%), and S. Typhimurium (Yazıcıoğlu et al., 2005).
In the annual reports of the year 2005 of Turkish Ministry of Health, biological
infections are given in groups where 1806 cases of S. Typhi with the morbidity level
of 7,17 per 100.000 population are recorded. The other salmonellosis causative
agents has been serogrouped but not serotyped and among them the highest cases
observed is Salmonella serogroup O:9 (D1) with 100 cases. It must be noted that in
this serogroup S. Enteritidis is the most prevalent one in worldwide.
Other epidemiological data on Salmonella strains isolated in Türkiye can be obtained
only through the collection of findings from individual studies. There is only one
study in the literature found as having the most extensive scope of surveillance
conducted by Erdem et al. (2005). The research covering clinical samples from 10

15
Turkish provinces collected over 2000-2002 years period. The most prevalent
serotypes were found to be S. Enteritidis (47,7%) and S. Typhimurium (34,7%). On
the other hand, the information on food isolates is poorer in comparison to clinical
isolates. In a recent study, 75,4% of isolates from infected chickens was reported as
seogroup D1 where 71,7% was typed S. Enteritidis and as 28,3% S. Gallinarum. The
rest of the isolates were found to be S. Typhimurium (24,6%) (Kılınç and Aydın,
2006).
2.5. Antimicrobials and Antimicrobial Resistance
Antimicrobials used in the therapy of infectious diseases are the drugs that either kill
or suppress microorganisms such as bacteria, viruses and parasites. Antibiotics are
the subgroup of antimicrobials that act only against bacteria. The actions of
antibiotics are (i) inhibition of cell wall synthesis, (ii) inhibition of protein synthesis,
(iii) inhibition of DNA/RNA precursor (folate) synthesis, (iv) inhibition of
DNA/RNA synthesis, and (v) disruption of membrane proteins (Walsh, 2003).
Antimicrobials have not only been used for therapy of diseases but also have been
used in food animal production for prophylaxis, metaphylaxis and as growth
promoters. Even though all growth promoters with antimicrobial activity have been
banned since 1999 in the Europe – especially for prophylactic and metaphylactic
applications – they still constitute a major selective pressure, which affects resistance
development not only in Salmonella, but also in many other bacteria (Schwarz and
Chaslus-Dancla, 2001). The selective pressure refers to the impact of antimicrobial
use on a microbial population, in which resistant organisms gain a survival advantage
over those susceptible ones (Furuya and Lowy, 2006). According to Clinical
Laboratory Standards Institute (CLSI), resistance designates the isolates that are not
inhibited by “usually achievable systemic concentration of the agent with normal
dosage schedules and/or fall in the range where specific antimicrobial resistance
mechanisms are likely (e.g. beta-lactamases) and clinical efficacy has not been
reliable in treatment studies” (CLSI, 2006).

16
A constant increase in the numbers of resistant strains has been observed since the
1950s. This is based on the distinctly higher selective pressure as imposed by the use
of antimicrobial agents for various purposes in human and veterinary medicine,
aquaculture and horticulture during the last 60 years (Helmuth, 2000; Schwarz and
Chaslus-Dancla, 2001). According to the bulletin of WHO in 2002, the mortality rate
in outbreaks involving resistant strains of Salmonella spp. was found to be 3,4%,
whereas it was only 0,2% in those sensitive strains (Smith and Coast, 2002).
Another concerning aspect of antimicrobial resistance is the multidrug resistance of
pathogens, which makes the selection of antimicrobials more difficult in the clinical
treatment of the disease. The most common Salmonella serotype having multidrug
resistance is S. Typhimurium definitive phage type DT104. It acquired multiple drug
resistance, with an isolate from the United Kingdom found to display a phenotype of
resistance to ampicillin, chloramphenicol, streptomycin, sulfonamides, and
tetracycline (ACSSuT) so called penta-resistance. The zoonotic nature of DT104
may have provided the environment for the acquisition of the ACSSuT resistance
phenotype since this resistance includes four of the five most common drug classes
used in veterinary medicine (Mulwey et al., 2006). Later, it was seen that multidrug
resistance phenotype is emerging in other Salmonella serotypes too. In the recent
studies, serotypes such as S. Typhi, S. Paratyphi, S. Infantis, S. Uganda, S. Agona,
and S. Newport, S. Hadar, S. Heidelberg are exhibited multidrug resistance in
addition to S. Typhimurium (Martinez et al., 2005; Velge et al., 2005; Pokharel et
al., 2006; Holt et al., 2007; Nógrády et al., 2007; Zhao et al., 2007).
The resistance mechanisms can be classified as (i) destruction or modification of the
antimicrobial agent, (ii) pumping the antimicrobial agent out from the cell by efflux
pumps, (iii) replacement or modification of the antibiotic target, and (iv) reduction in
cell membrane permeability (Fig. 2.1). Microorganisms are developing resistance
mechanisms by accumulating mutations in the gene locations of target proteins or
acquiring mobile genetic elements carrying resistance genes (Walsh, 2003).

17
Figure 2.1. Schematic representation of the mechanisms of antimicrobial resistance
(modified from http://www.chembio.uoguelph.ca/merrill/research/
enzyme_mechanisms. html).
There are several antimicrobial drug classes, however it is not the purpose to classify
all antimicrobial groups in detail, but to classify the most common antimicrobials
that Salmonella have been developed resistance in present thesis. They are namely β-
lactams, quinolones/fluoroquinoles, aminoglycosides, phenicols, tetracyclines,
sulfonamides and trimethoprim.
ββββ-lactams are one of the critically important antibiotics in both human and
veterinary medicine. Penicillins are also used for growth promoters of animals (Li et
al., 2007). β-lactams are bacteriocidal by blocking the transpeptidations
peptidoglycan layer of bacterial cell wall where they bind to penicillin binding-
proteins.
Antibiotic degrading enzyme
Antibiotic 1
Antibiotic modifying enzyme
Antibiotic 2
Antibiotic 3
Antibiotic target modification
Antibiotic 4
Efflux pumps

18
There are three major groups of β-lactams: penicillins, cephalosporins, and
carbapenems. Possibly because of the widespread clinical use of penicillins,
resistance to drugs such as ampicillin and methicillin has become common. In
response to this problem, second class of β-lactams, the cephalosporins, was
developed. Penicillins have a five-member thiazolidine ring fused to the β-lactam
ring. Cephalosporins are the enzymatically converted form of penicillins by a ring
expandase enzyme forming a six-member ring (a dihydrothiazine ring) fused to the
β-lactam ring (Walsh, 2003; Alcaine et al., 2007). These changes provide
cephalosporins with a broader range of activity and greater stability in the presence
of β-lactamases. Both penicillins and cephalosporins are fungal secondary
metabolites produced by Penicillium chrysogenum (Walsh, 2003). There are four
generations of cephalosporins, and each progressive generation is effective against a
broader range of organisms. Although Salmonella isolates may appear susceptible to
first- and second-generation of cephalosporins in vitro, the CLSI cautions that this
antimicrobial drug class may not be clinically effective against Salmonella soon
(Alcaine et al., 2007).
The latest discovered group of β-lactams is carbapenems, which differs from
penicillins and cephalosporins by lacking sulphur in five-membered ring fused to the
four-member β-lactam ring. These β-lactams are sometimes paired with β-lactamase
inhibitors. Carbapenems have a much broader range of activity against both
Gram-negative and Gram-positive bacteria than do other β-lactams and are more
stable against β-lactamases. Nevertheless, Salmonella isolates that possesses
resistance to carbapenems such as imipenem already have been reported (Singh et
al., 2007).
β-lactam resistance mechanism in Salmonella is mostly mediated by the production
of the enzymes β-lactamase. These enzymes work by hydrolysing the β-lactam ring
structure, yielding beta-amino acids with no antimicrobial activity. The genes
encoding for β-lactamases produced by Salmonella are typically carried on plasmids,
although most of these genes are chromosomally encoded in other bacterial species.

19
β-lactamases are classified by two schemes called Ambler classes A-D (Ambler,
1980) and Bush classes 1-4 (Bush et al., 1995). Ambler’s classification scheme is
based on the primary structure and amino acid sequence identity of β-lactamases.
According to Ambler’s classification scheme there are class A, B, C, and D beta-
lactamases (Alcaine et al., 2007; Li et al., 2007):
• In general, class A ββββ-lactamases are the most commonly reported class of
β-lactamases in Salmonella. They are plasmid encoded and provide a range
of resistance against penicillins, early generation cephalosporins, and
carbapenems. There are several different gene families encoding for enzymes
in this class, and blaTEM-1 is the most prevalent among Salmonella isolates.
Other Class A β-lactamase gene such as blaPSE-1 also has been found in a
number of Salmonella isolates and chromosomally encoded (Li et al., 2007).
The emergence of cefotaximases (CTX-M), which are class A β-lactamases
conferring resistance pirmarily to ceftiofur, is an important trend to watch.
Variants of blaCTX-M have been identified in isolates of Salmonella serotypes
(Livermore et al., 2007).
• Class B ββββ-lactamases are metallo-β-lactamases which are not commonly
found in Salmonella.
• Class C ββββ-lactamases are typically encoded by chromosomal ampC genes
and provide resistance against cephalosporins and ceftiofur. Salmonella has
no chromosomal ampC gene; instead, these genes are harboured in plasmids.
Currently researches are primarily focused on blaCMY-2, which has been
associated with resistance primarily to cephoxitin. The spread of blaCMY-2 is a
public health concern because the presence of this gene appears to mediate
resistance or at least reduced susceptibility to ceftriaxone, another extended
spectrum cephalosporin that is the drug of choice for the treatment of
Salmonella infections in children.
• Class D ββββ-lactamases appear to be rare among Salmonella isolates. This
class of enzymes provides resistance to β-lactams closely related to oxacillin
and methicillin. The chromosomally encoded gene blaoxa-1 (=blaoxa-30) was
found in a S. Paratyphi, S. Muenchen and S. Typhimurium. This group is

20
resistant to inhibitors such as clavulanic acid (Hall and Collis, 1998; Alcaine
et al., 2007).
Quinolones and fluoroquinolones are synthetic bacteriocidal drugs. In 1962,
nalidixic acid became the first quinolone approved for medical use. Several
generations of quinolones have been developed, with each new generation having
improved action against bacterial infections. The early generation quinolones target
DNA gyrase, and the late generation quinolones both DNA gyrase and
topoisomerase IV. The mode of action for quinolones is quite complex and not
completely understood. Although quinolones target topoisomerases, they do not
actually bind to the topoisomerase but to the double stranded DNA in the
topoisomerase complex (Alcaine et al., 2007).
There are documented cases of Salmonella isolates with resistance to nalidixic acid
and low-level resistance to fluoroquinolones and high-level resistance to quinolones
to be emerging. Quinolone resistance of Salmonella isolates has been linked to two
mechanisms, target gene mutations and active efflux. The first mechanism is
mediated by target mutations in the quinolone resistance determining region (QRDR)
of gyrA and gyrB, the two genes that encode the subunits of DNA gyrase, and in the
parC subunit of topoisomerase IV. The most frequently amino acid substitutions
observed in gyrA are Ser-83 (to Phe, Tyr, or Ala) or Asp-87 (to Gly, Asn, or Tyr) and
in parC is Thr-57 (to Ser) (Cloeckaert and Chaslus-Dancla, 2001). The second
mechanism involves changes in the expression of the AcrAB-TolC efflux system,
mostly due to mutations in the genes encoding regulators of this system
(e.g., marRAB) that results in overexpression and consequently decreased quinolone
sensitivity. No single mutation confers high-level resistance to fluoroquinolones but
resistance results from the accumulation of multiple mutations. The facts that
Salmonella isolates must acquire multiple unlinked mutations and that some of those
mutations reduce fitness, particularly those involved in the regulation of the efflux
pump, may explain why this kind of resistance is so infrequent (Alcaine et al., 2007).

21
Quinolone resistance also has been linked to the expression of the plasmid-mediated
qnr gene. This gene codes for a protein that appears to bind to DNA gyrase and
protect it from quinolone inhibition. Research conducted on plasmids harbouring qnr
revealed that this gene could be transferred from other bacterial species to
Salmonella via conjugation. Although documented cases of plasmid-mediated
quinolone resistance in Salmonella isolates are rare, a recent study indicated that the
spread of such plasmids to Salmonella isolates has also occurred (Kehrenberg et al.,
2007). The appearance of plasmid-mediated quinolone resistance in Salmonella
isolates is a very important emerging public health concern. Plasmids harbouring qnr
also can harbour other resistance genes, suggesting that the treatment of infections
with Salmonella strains containing this plasmid may be increasingly difficult. In a
recent study, reduced susceptibility ciprofloxacin was conferred by a variant of the
gene encoding aminoglycoside acetyltransferase AAC(6’)-Ib. Even if the gene was
detected among other Enterobacteriaceae, it has to the best of our knowledge that
this gene has not been identified yet in Salmonella isolates (Kehrenberg et al., 2007).
Aminoglycosides were first discovered in 1944 from Streptomyces griseus and since
have been widely used. Other aminoglycosides are kanamycin, neomycin, amikacin,
and gentamicin. They are hydrophilic sugars with multiple amino groups and target
16S rRNA on the 30S ribosome from the A site of aminoacyl-tRNA binding which
leads to codon misreading and translation inhibition. Most aminoglycosides are
bactericidal (destructive), with the exception of spectinomycin, which has a
bacteriostatic (growth inhibiting) mode of action. (Walsh, 2003; Alcaine et al.,
2007).
Resistance to aminoglycosides in Salmonella is mainly associated with the
modification of aminoglycoside molecules by enzymes (Sørum and L’Abée-Lund,
2002). These enzymes fall into three groups that are named according to the types of
reactions they catalyse (Alcaine et al., 2007):
• Aminoglycoside acetyltransferases are enzymes that primarily acetylate
aminoglycoside-amino groups. Genes encoding these enzymes are typically
designated aac and these genes have been found as part of Salmonella

22
genomic islands, integrons and plasmids. Aminoglycoside acetyltransferases
provide resistance to gentamicin, tobramycin, and kanamycin.
• Aminoglycoside phosphotransferases are enzymes that catalyse
ATP-dependent phosphorylation of specific aminoglycoside hydroxyl groups.
Most genes encoding these enzymes are designated as aph provide resistance
to kanamycin and neomycin. The genes aph(3’)-Ib and aph(6)-Id are
commonly referred in the literature as strA and strB, respectively and provide
resistance to streptomycin.
• Nucleotidyltransferases also target the hydroxyl groups. Genes encoding
nucleotidyltransferases are usually designated aad (for aminoglycoside
adenyltransferases), although some are also designated as ant (for
aminoglycoside nucleotidyltransferase). The aadA gene [or ant(3’)] provides
streptomycin resistance in Salmonella isolates. The aadB gene [or ant(2’)-Ia]
contributes resistance to gentamicin and tobramycin. Both aadA and aadB
have been found as integron-borne gene cassettes.
Phenicols include chloramphenicol and florfenicol. Chloramphenicol was once the
drug of choice for the treatment of typhoid fever. Production of chloramphenicols by
Streptomyces venezuelae was discovered in 1947. Chloramphenicol works by
binding to the peptidyltransferases centre of the 50S ribosomal unit, thus preventing
formation of peptide bonds. Chloramphenicol’s broad range activity against Gram-
positive and Gram-negative bacteria and its ability to cross the blood-brain barrier
make it a powerful choice for the treatment of systemic infections. Its toxicity, which
can lead to bone marrow damage and aplastic anemia, and widespread resistance
have generally limited chloramphenicol use to occasions where the risk of the
infection, such as bacterial meningitis, is greater than the risk of adverse effects from
the drug. Chloramphenicol is still widely used in developing countries because of its
low cost (Walsh, 2003; Alcaine et al., 2007).
Chloramphenicol resistance in Salmonella isolates is conferred through two
mechanisms: (i) the enzymatic inactivation of the antibiotic via chloramphenicol
O-acetyltransferase (CAT) and (ii) the removal of the antibiotic via an efflux pump.

23
The genes encoding for CAT are plasmid-borne and commonly found in S. Typhi
isolates. CAT genes, such as cat1 and cat2, have also been found in nontyphoidal
Salmonella serotypes. Chloramphenicol efflux pumps in Salmonella isolates have
been reported to be encoded by two closely related genes, cmlA and floR. The floR
gene appears to be widespread in Salmonella isolates, whereas cmlA is less widely
distributed. The highly mobile floR gene has been found in Salmonella genomic
islands and in many different plasmids. It appears to be associated with multidrug
resistance.
Tetracyclines were discovered in the 1940s. The first tetracycline,
chlorotetracycline, was isolated from Streptomyces aerofaciens. Tetracyclines were
popular because of their minimal adverse effects and broad-spectrum activity. They
were effective against most bacteria, including chlamydias and mycoplasm, and even
some protozoa. Tetracyclines act by preventing the binding of tRNA to the A site of
the 30S ribosomal subunit, thus inhibiting protein synthesis. Unfortunately, the rise
of resistant bacteria has severely limited the use of tetracyclines (Walsh, 2003;
Alcaine et al., 2007).
Tetracycline resistance of Salmonella isolates is attributed to production of an
energy-dependent efflux pump, which removes this antimicrobial drug from the
bacterial cell. Other mechanism of resistance, such as modification of the ribosomal
target and enzymatic inactivation of tetracycline, have been attributed to other
bacterial species but have yet to be reported in Salmonella isolates. Deletion or
inactivation of marRAB operon also has been linked to the reduced susceptibility to
tetracycline.
There are at least 32 different genes that confer resistance to tetracycline and
oxytetracycline. Of these, tet(A), tet(B), tet(C), tet(D), tet(G), and tet(H) have been
found in Salmonella isolates. The most commonly reported one of these genes is
tet(A). It has been found in Salmonella genomic island 1, on integrons, and on
transferable plasmids. The tet(A) gene has been detected in isolates of Salmonella
serotypes. Like tet(A), tet(B) has also been located on transferable plasmids. These

24
genes appear to be easily transferred and widespread among Salmonella isolates.
They also tend to be found in isolates that display multidrug resistance, making them
an important marker in identifying potentially serious Salmonella infections. tet(G) is
linked to Salmonella Genomic Island 1 (SGI1).
Sulfonamides and Trimethoprim prescribed separately and has been used in
combination for the treatment of bacterial infection since the late 1960s. These
compounds are bacteriostatic antimicrobial drugs that act by competitively inhibiting
enzymes involved in the synthesis of tetrahydrofolic acid. Sulfonamides inhibit
dihydropteroate synthetase (DHPS), and trimethoprim by inhibiting dihydrofolate
reductase (DHFR). The combination of a sulfonamide and trimethoprim has been a
popular form of treatment for decades, and although resistance among Salmonella
isolates has emerged, this resistance does not appear to be common (Walsh, 2003;
Alcaine et al., 2007).
Sulfonamide resistance in Salmonella isolates has been attributed to the presence of
an extra sul gene, which expressed an insensitive form of DHPS. Three main sul
genes have been identified: sul1, sul2, sul3. The sul1 gene has been found in a wide
range of Salmonella serotypes. This gene is often associated with class I integrons
that contain other resistance genes. These integron-borne gene cassettes have been
found on transferable plasmids and as part of Salmonella genomic island variants.
Although sometimes found in Salmonella isolates also harbouring sul1, sul2 appears
to be associated with plasmids, but not with class I integrons. Isolates of Salmonella
serotypes Agona, Enteritidis, Typhimurium have been reported to carry sul2. The
sul3 gene has been identified only recently in Salmonella, and it has been associated
with plasmids and class I integrons, suggesting that there may be further
dissemination of this gene within Salmonella populations (Guerra et al., 2004a).
Deletion or inactivation of the marRAB also has been linked to reduced sulfonamide
susceptibility.
Similar to sulfonamide resistance, trimethoprim resistance is attributed to the
expression of DHFR that does not bind trimethoprim. There are minivariants of the

25
dhfr and dfr genes that encode this resistance, such as dhfr1, dfrA1, and dhfr12.
These genes have been found as part of integron borne gene cassettes also associated
with sul1 and sul3, on transferable plasmids carrying other resistance genes, and
Salmonella genomic islands.
2.6. Antimicrobial Patterns of Salmonella Isolates in Türkiye
Although there is limited information about the antimicrobial resistances of the
Salmonella isolates in Türkiye, there are studies, which performed the antimicrobial
susceptibility analysis. In a study from 13 S. Typhimurium and 22 S. Enteritidis
clinical isolates, 10 different resistance patterns among S. Typhimurium and 4
different resistance patterns among S. Enteritidis were detected. ESBL production
was also detected in 10 of S. Typhimurium and 3 of S. Enteritidis isolates
(Anğ-Küçüker et al., 2000). Resistance to multiple antimicrobials and reduced
susceptibility to fluoroquinolones was also reported from the clinical Salmonella
isolates (Erdem et al. 2005). Yazıcıoğlu et al. (2005) found that among 58
Salmonella isolates of avian origin, the most common resistances were against
nalidixic acid in 26 strains (48,1%) and streptomycin in 10 strains (17,2%).
2.7. Horizontal Transfer of Antibiotic Resistance
The spreading of resistance genes between members of different bacterial species
and genera under natural conditions requires a horizontal transmission by
conjugation, mobilization, transduction or to a lesser extent by transformation. For
efficient horizontal gene transfer, two key factors are of importance: (1) a sufficiently
high bacterial density, which enables the close contact of the partners between which
genes are exchanged, and (2) the location of the transferred genes on mobile genetic
elements. Such elements include plasmids, transposons, integrons and gene cassettes,
and chromosomal genomic islands (Schwarz et al., 2006). Studies have shown that
one or more of these elements may be present in antimicrobial resistant Salmonella
strains.

26
2.7.1. Plasmids
Plasmids are double-stranded DNA elements of variable in size. Due to their
replication system, they can replicate independently from the chromosomal DNA in
the bacterial cell. Plasmids may be present in single or multiple copies per bacterial
cell. They can harbour resistance genes, but also virulence genes or the genes for
metabolic activities. Large plasmids may also carry the tra gene complex, which
enables the transfer of plasmid horizontally by conjugation. Plasmids can act as
vectors for transposons and integrons/gene cassettes (Guerra et al., 2000b; Schwarz
et al., 2006). Plasmids are classified based on their replication origin into
incompatibility (Inc) groups. Plasmids having same replication origin are
“incompatible” whereas plasmids with different replication origin are “compatible”
(Carattoli et al., 2005).
2.7.2. Transposons
Transposons are also double-stranded DNA elements of variable in size, which – in
contrast to plasmids – cannot replicate autonomously. Since they lack an own
replication system, they have to integrate into a replication-proficient molecule in the
bacterial cell, such as the chromosomal DNA or plasmids. Large transposons have
also been identified to be conjugative whereas small transposons can only change
their host cell as part of a plasmid into which they have integrated. Transposons can
change their location within the bacterial cell by transposition (Schwarz et al., 2006).
In this regard, transposons integrate into very specific sites whereas others just
integrate into host DNA without any known preference (Waturangi et al., 2003).
2.7.3. Integrons
Integrons are known as natural cloning and expression vectors that mediate the
integration or excision of gene cassettes (Recchia and Hall, 1995; Carattoli, 2001,
Rowe-Magnus and Mazel, 2002; Mazel, 2006). Gene cassettes are small, double-
stranded mobile genetic elements. A resistance gene cassette consists of a resistance
gene and a recombination site, designated attC. This site can vary in size and
contains the binding sites for the integrase which catalyses the integration and
excision of the gene cassettes. After excision and before integration, gene cassettes

27
form an intermediate circular form (Fig. 2.2). The attC sites commonly have a
central axis of symmetry and represent imperfectly inverted repeats. A gene cassette
usually does not have its own promoter, but its cassette-borne gene is transcribed
from a promoter located in the 5’ conserved segment of the integron. Class 1 and 2
integrons of commonly consist of two conserved segments (CS), 5’-CS and 3’-CS,
which bracket a variable region that can contain one or more gene cassettes (Schwarz
et al., 2006). The essential components of an integron are the integrase gene (intI),
the attachment site (attI) and the promoter, which is essential for the expression of
the integrated gene cassettes (Carattoli, 2001). Different classes of integrons have
been defined based on the homology of the integrase proteins. Classes 1 and 2 are
most commonly found in Gram-negative bacteria. The 5’-CS part contains the
integrase gene, the attachment site and the promoter. The 3’-CS harbours the qacE∆1
gene, a semi-functional derivative of the quaternary ammonium compounds
resistance gene qacE, the sulfonamide gene sul1 and an open reading frame of
unknown function named ORF5 in class 1 integrons whereas it contains transposition
genes in class 2 integrons. The development of multiple resistance is based on the
capacity of integrons to cluster the gene cassettes and to express antimicrobial
resistance genes (Recchia and Hall, 1995; Carattoli, 2001; Schwarz et al., 2006).
Integrons are not mobile by themselves, but may be integrated into transposable
elements, such as Tn1696 (Partridge et al., 2001), or located on plasmids, and then
can spread with these elements. Moreover, integrons can also be located on
chromosomal DNA or in chromosomal genomic islands, such as the Salmonella
Genomic Island 1 (SGI1) (Boyd et al., 2001).

28
Figure 2.2. Typical structure of a class 1 integron (modified from Carattoli et
al.,2001).
2.7.4. Genomic Islands
Genomic islands are large elements found in the chromosomal DNA of bacteria. The
best studied genomic islands associated with antimicrobial resistance are the 43-kb
Salmonella genomic island 1 (SGI1) in various Salmonella serotypes (Boyd et al.,
2001), the 100-kb SXT element of Vibrio cholerae (Hochhut et al., 2001), and
SCCmec elements of different sizes and structures in Staphylococcus aureus
(Katayama et al., 2000). These genomic islands integrate site-specifically into the S.
Typhimurium DT104 (Boyd et al., 2001). In the meantime SGI1 was also identified
in other Salmonella enterica serovars, including Agona, Albany, Newport,
Meleagridis, and Paratyphi B (Boyd et al., 2001; Doublet et al., 2003; Doublet et al.,
2004a; Doublet et al., 2004b; Ebner et al., 2004; Meunier et al., 2002). SGI1 is
5’ conserved segment 3’ conserved segment
P qacE∆1 sul1 ORF5
attI attC1
gene cassette 1
Int1
P1 and P2
gene cassette 2
P
attI attC1 attC2
gene gene cassette 1 cassette 2
P1 and P2

29
horizontally transferable and has been identified as an integrative mobilizable
element (Doublet et al., 2005). The 14 kb antibiotic resistance gene cluster within
SGI1 (Briggs and Fratamico, 1999) consists of a complex integron related to the IN4
group of integrons. In most known cases, the pentaresistance phenotype associated
with SGI1 includes ampicillin resistance via blapse-1, chloramphenicol/florfenicol
resistance via floR, streptomycin/spectinomycin resistance via aadA2, sulfonamide
resistance via sul1, and tetracycline resistance via tet(R)-tet(G). During recent years,
variant clusters have been identified containing additional or other resistance genes
such as dfrA1 and dfrA10 conferring resistance to trimethoprim, aadA7 conferring
resistance to streptomycin, and aac(3)-Id conferring resistance to gentamicin (Boyd
et al., 2002; Doublet et al., 2003; Doublet et al., 2004a; Doublet et al., 2004b ).
Currently, research activities on antimicrobial resistance in Salmonella isolates from
animal sources focus on quinolone/fluoroquinolone resistance – with particular
emphasis on transferable qnr-based quinolone resistance – the detection of
transferable genes coding for extended-spectrum β-lactamases, as well as the
identification of the genetic basis of multi-resistance due to either SGI1 variants or
multi-resistance integrons.
2.7. Aims of the Present Study
There is still considerable lack of information with regard to (i) the prevalent
serotypes, (ii) the molecular characteristics (iii) the antimicrobial patterns, and
(iv) the genetic basis of antimicrobial resistances of Salmonella strains isolated from
foods in Türkiye. The objective of the present study was to contribute some
information to close the gaps in these areas of research. Besides, it was also aimed to
search for the genetic basis of horizontal gene transfer, based primarily on class 1
integrons, of antimicrobial resistances found in Turkish isolates. The second part of
the study was to perform the same determinations with the German isolates of
Salmonella to form a comparative base of the current situations in both countries.

30
CHAPTER 3
MATERIALS AND METHODS
This chapter explains the materials and the methods used throughout the thesis in
detail. Collection of food samples, isolation of Salmonella strains of Türkiye origin,
and biochemical confirmations were performed in Ankara University, Department of
Biology, Prokaryotic Genetics Laboratories, whereas serotyping, phage typing
antibiotyping and all the molecular biological analyses were done in Federal Institute
of Risk Assessment, Salmonella Reference Laboratories in Germany. Salmonella
strains, which constitute the base material of the thesis, were isolated from foods of
animal origin. Their confirmation was done first by biochemical analyses.
Furthermore, in the frame of the objectives of the thesis strains were characterized by
selected methods covering both phenotypic and genotypic analysis namely
serotyping, phage typing, and plasmid profiling and pulsed field gel electrophoresis.
Subsequently, strains were examined for their antimicrobial susceptibilities by both
disk diffusion and minimal inhibitory concentration analysis. When the resistance
was observed, the genotypic properties of the phenotypes were investigated. In order
to associate the resistance genotype with mobile genetic elements, thesis focused on
class 1 integrons. To characterize the important plasmids obtained, plasmid
incompatibility group detection was done. For genotypic analysis, in general,
polymerase chain reaction, southern-blotting, DNA-hybridization and
DNA-sequencing methods were used. All the materials other than biological
materials were given in Appendix I.

31
3.1. Bacterial Strains and Bacteriophages
59 epidemiologically unrelated Salmonella enterica subsp. enterica serovars were
isolated from foods of avian and bovine origin and 49 Salmonella enterica subsp.
enterica serovars together with 17 control strains were obtained from Federal
Institute of Risk Assessment, Salmonella Reference Laboratories Culture Collection.
The bacteria were routinely grown in Luria Bertani (LB) broth at 37ºC with shaking
at 200 rpm when necessary. The bacteria were stored at -80ºC in 60% glycerol
containing LB broth. Bacteriophages (phages) for phage typing sets were obtained
as stock cultures from Health Protection Agency, Specialist and Reference
Microbiology Division, Centre for Infections, Laboratory of Enteric Pathogens
(HPA, London, UK) and kept as concentrated high titre stocks at +4ºC. The stocks
were diluted to appropriate concentrations when they were used.
3.2. Bacterial Isolations
To isolate Salmonella spp., food samples were collected from free-markets,
supermarkets and one dairy market in Türkiye. The food samples were from animal
origin namely poultry meat (85 samples), minced meat (44 samples), raw milk
(53 samples) and mayonnaise containing salads (13 samples). They were kept at
+4ºC until they were analysed. The isolation was done in four steps by following the
ISO 6579 manual of detection of Salmonella spp. from food and animal feeding staff
(Figure 3.1):

32
Figure 3. 1. Schematic representation of serotyping analyses of Salmonella.
1. Pre-enrichment in non-selective liquid media: 225 mL buffered peptone water
(BPW) was inoculated at ambient temperature with the test portion of 25 g
(1/10, w/v), then incubated at 37ºC ± 1 ºC for 18 ± 1h to permit the detection
of low numbers of Salmonella or injured Salmonella.
2. Enrichment in selective liquid media: Rappaport-Vassiliadis (RVS) and
Müller-Kauffmann-tetrathionate/novobiocin (MKTTn) broths were
inoculated respectively with the culture obtained from pre-enrichment.
0,1 mL of the culture was transferred to 10 mL of the RVS broth and
incubated at 41,5ºC ± 1 ºC for 24 ± 3h. In parallel to this, 1 mL of the culture
25 g sample + 225 mL BPW Incubation: 18 ± 3 h; 37 oC ± 1oC
0,1 mL culture + 10 mL RVS Incubation: 24 ± 1 h; 41.5 oC ± 1oC
1 mL culture + 10 mL MKTTn Broth Incubation: 24 ± 1 h; 37 oC ± 1oC
Growth on XLD and BSA Incubation: 24 ± 1h; 37 oC ± 1oC
Biochemical analyses
Pre-enrichment
Selective enrichment
Identification
Confirmation

33
was inoculated into 10 mL MKTTn broth and incubated at 37ºC ± 1 ºC for
24 ± 3h.
3. Identification: From the cultures grown in the enrichment step, two selective
media were inoculated: xylose lysine deoxycholate (XLD) agar and bismuth
sulphite agar (BSA). Both solid media were streaked with the cultures
obtained from enrichment broths making four solid media plates for one
sample and incubated at 37ºC ± 1 ºC for 24 ± 3h. After incubation typical
Salmonella colonies which were black centred and slightly transparent zone
of reddish colour on XLD agar and black centred, light edges surrounded by a
black precipitate with metallic sheen (so-called rabbit's or fish-eye) on BSA
agar were selected.
4. Confirmation: Selected colonies of presumptive Salmonella were
sub-cultured in LB broth containing 60% glycerol to possess pure cultures
and stored at -20ºC until the confirmation which was done by means of
Gram-staining, oxidase test and other biochemical tests. Gram staining was
performed according to the conventional method. Gram-negative strains were
analysed by oxidase test performed with 1% solution of
N,N,N’,N’-tetramethyl-p-phenylenediamine.2HCL. Both Gram-negative and
oxidase-negative isolates were further tested. Biochemical tests other than
oxidase test were done by using API 20E test kit (bioMérieux, Inc., France).
The plastic strips holding twenty mini-test tubes were inoculated with the
saline suspensions of the cultures according to manufacturer's directions. This
process also rehydrated the desiccated medium in each tube. A few tubes
were completely filled (CIT, VP and GEL), and some tubes were overlaid
with mineral oil such that anaerobic reactions could be carried out (ADH,
LDC, ODC, H2S, URE) (Figure 3.2).
Figure 3.2. Typical Salmonella reaction of API 20E test kit.

34
After incubation in a humidity chamber for 18-24 hours at 37°C, the colour
reactions were read (some with the aid of added reagents as supplied by the kit).
The data were analysed by the manufacturer’s software and positive results with
≥89% probabilities were confirmed as Salmonella. The list of the biochemical
tests performed by API 20E test kit and typical reactions exhibited by Salmonella
spp. are given in Table 3.1.
Table 3.1. Biochemical reactions involved in API 20E (bioMérieux, Inc., France)
test kits and typical Salmonella reactions.
Tests Substrate Reaction (-) Results (+) Results Salmonella
spp.
ONPG ONPG beta-
galactosidase
colorless yellow -
ADH arginine arginine
dihydrolase
yellow red/orange -
LDC lysine lysine
decarboxylase
yellow red/orange +
ODC ornithine ornithine
decarboxylase
yellow red/orange +
CIT citrate citrate
utilization
pale to
green/yellow
blue-green/
blue
-
H2S Na-
thiosulfate
H2S
production
colorless/gray black
deposit
+
URE urea urea
hydrolysis
yellow red/orange -
TDA tryptophan deaminase yellow brown-red -
IND tryptophan indole
production
yellow red
(in 2 min)
-
VP Na-
pyruvate
acetoin
production
colorless pink/red
(in 10 min)
-
GEL charcoal
gelatin
gelatinase no diffusion
of black
black
diffusion
-

35
Table 3.1. Biochemical reactions involved in API 20E (bioMérieux, Inc., France)
test kits and typical Salmonella reactions (continued).
Tests Substrate Reaction (-) Results (+) Results Salmonella
spp.
GLU glucose fermentation/oxidation blue/
blue-green
yellow +
MAN mannitol fermentation/oxidation blue/
blue-green
yellow +
INO inositol fermentation/oxidation blue/
blue-green
yellow -
SOR sorbitol fermentation/oxidation blue/
blue-green
yellow +
RHA rhamnose fermentation/oxidation blue/
blue-green
yellow +
SAC sucrose fermentation/oxidation blue/
blue-green
yellow -
MEL melibiose fermentation/oxidation blue/
blue-green
yellow +
AMY amygdalin fermentation/oxidation blue/
blue-green
yellow -
ARA arabinose fermentation/oxidation blue/
blue-green
yellow +

36
3.3. Serotyping
Serotype assessments were done in Salmonella Reference Laboratories (Federal
Institute for Risk Assessment, Berlin Germany). The detection of the presence of
Salmonella O- and H- antigens were tested by slide agglutination with the
commercially available antisera. One loop of appropriate antisera was dropped onto a
cleaned glass slide. One loop of overnight culture grown on agar was dispersed in the
drop to obtain a homogeneous and turbid suspension. The slide was rocked gently for
30 s and clumping was monitored by a magnifying glass. The scheme to obtain the
serotype was given in Figure 3.3. To detect the O-group antigens, cultures were
grown on Gassner agar (Merck KGaA., Germany) for overnight at 37°C; while
semi-solid agar was the media for the determination of H-antigens with the same
incubation conditions. To find out phase-2 flagellar antigens (H2), detected phase-1
flagellar antigens (H1) was suppressed by adding the appropriate antiserum to the
semi-solid agar and the culture grown on it for overnight at 37°C. Slide agglutination
was performed again to determine the H2 antigens. Antisera set used for the analyses
were as follows:
a) Salmonella polyvalent I (A-E) (Sifin, Germany; Statens, Denmark),
b) Salmonella somatic (O) group A, B, C, D, and E (Sifin, Germany; Statens,
Denmark),
c) Salmonella flagellar (H) antisera set (Sifin, Germany; Statens, Denmark).

37
Figure 3.3. Serotyping analysis scheme for Salmonella.
Salmonella group A, B, C, D and E
Non-Salmonella
Detection of Salmonella somatic with monovalent antisera
Detection of Salmonella flagellar antisera
Serotype definition
+ -
Salmonella polyvalent antisera (A-E)
38
3.4. Phage Typing
Phage typing analyses were performed in Salmonella Reference Laboratories
(Federal Institute for Risk Assessment, Berlin Germany). Typing phage sets were
obtained as stock cultures from Health Protection Agency, Specialist and Reference
Microbiology Division, Centre for Infections, Laboratory of Enteric Pathogens
(HPA, London, UK).
By means of a sterile inoculation loop, the test culture was inoculated into a test tube
containing 4 mL double strength nutrient broth with a special care for heavy
inoculum to give visible turbidity for S. Enteritidis and a very light inoculum for S.
Typhimurium to give a barely visible turbidity. The culture was incubated by shaking
at 200 rpm at 37°C for 1-1,5 h for S. Enteritidis and for S. Typhimurium 1,5 h
without agitation to obtain a very light growth in early log phase. After incubation, it
was flooded over the surface of double strength nutrient agar using a flooding pipette
and the excess of culture was removed. As soon as the surface of agar dried, the
appropriate typing phages at routine test dilutions were applied to the dried surface
by a multipoint inoculation loop. When the phage spots dried, the agar plate was
incubated at 37°C for 18 h. At the end of the incubation, the agar plate was read
using a magnifying glass through the bottom of the plate (Anderson et al., 1977;
Ward et al., 1987).
Phage susceptibilities were evaluated by means of the plaque number, size and
transparency. The pattern was compared with known phage type patterns in the
database and defined. If the culture did not react with any of the typing phages, it
was defined as non-typable (NT); and if the culture reacted with the typing phages,
but gave a different pattern other than those in the database, it was considered as
reacting with the typing phages, but lytic pattern did not correspond to any
recognized phage types, so called RDNC (= Reacting with the typing phage, but lytic
pattern Did Not Correspond to any recognized phage types).

39
3.5. Plasmid Profiling
3.5.1. Plasmid Isolation
Plasmid analysis was performed with the modification of method described by Kado
and Liu (Kado and Liu, 1981; Helmuth et al., 1985). 2 mL LB-broth was inoculated
with one loop of LB-agar culture and incubated at 37ºC for 18h. 1,5 mL of the
culture transferred into a microcentrifuge tube and centrifuged at 14.000 rpm for 5
min at room temperature. The supernatant was discarded and the pellet was dried by
aspiration. Bacterial pellet was resuspended in 20 µL of KADO-buffer by vigorous
shaking. Freshly prepared 100 µL Lysis Mix solution was added to the suspension
and mixed very gently by inverting the tubes until a homogenous mixture was
obtained. Than the tubes were placed into a water-bath and incubated 27 min at 58ºC.
Right after the incubation, freshly prepared 100 µL phenol:chloroform (1:1) solution
was added and again mixed gently until a uniform white colour was formed.
Thereafter, it was centrifuged at 14.000 rpm for 30 min at room temperature. 90 µL
supernatant was mixed with 10 µL DNA-sample-buffer by flicking the tubes and
kept in ice-bath for 10 min.
3.5.2. Agarose Gel Electrophoresis and Gel Documentation
The plasmid DNAs were run on 2 mm-thick vertical 0,8% agarose gel in
1XTBE-buffer solution under 50 V/15 min followed by 100 V/2 h electrophoresis
conditions. To view the plasmid pattern, agarose gel was stained with ethidium
bromide solution (0,5 µg/mL) for 20 min and after washing with sterile bidest water
for 15 min, it was visualised by Stratagene EagleEye II Imaging System (Stratagene,
USA) under UV light.

40
3.6. Pulsed Field Gel Electrophoresis (PFGE)
PFGE analyses were carried out following the method suggested by PulseNet
(http://www.cdc.gov/pulsenet/protocols/ecoli_salmonella_shigella_protocols.pdf).
3.6.1. Preparation of PFGE Plugs From Agar Cultures
The culture grown on LB-agar plates at 37ºC for overnight was transferred to 4 mL
cell suspension buffer solution by means of a sterile plastic loop. The optic density of
the suspension was adjusted to 1,3-1,4 absorbance at 610 nm (Ultraspec 2000
Spectrophotometer; Amersham Pharmacia Biotech. Inc., Sweden). The suspensions
were kept in ice-bath until the preparation of agarose plugs. 300 µL cell suspension,
15 µL proteinase K (end concentration of 0,5 mg/mL), and 300 µL Seakem Agarose
(1%)-SDS was mixed in a pre-warmed (50ºC) 1,5 mL microcentrifuge tubes. As
quick as possible, it was transferred to the PFGE-molds with a special care to avoid
bubble formation. During this step, in order not to solidify the agarose, the mixture
was prepared in the waterbath (50ºC). The PFGE-molds were kept at +4 ºC for 30
min and the plugs were solidified.
3.6.2. Lysis of Cells in Agarose Plugs
The agarose plugs were removed from the mold by means of a sterile thin spatula
and transferred to 5 mL cell lysis buffer solution in tubes. The lysis was performed at
54ºC for 2 h in shaking waterbath (175-200rpm).
3.6.3. Washing of Agarose Plugs
The washing process was carried out at 50ºC in shaking incubator (175-200 rpm). It
was carried out with pre-warmed (50ºC) sterile bidest water twice (~10-15 mL and
15 min intervals) and pre-warmed (50ºC) TE-buffer solution four times (~10-15 mL
and 15 min intervals). After washing process, the plugs were cut by means of a
scalpel to 2,5 mm slices and kept in a fresh TE-buffer solution at +4ºC in a
microcentrifuge tube.

41
3.6.4. Restriction Enzyme Digestion with XbaI
One of the 2,5 mm slices was kept in 120 µL SureCut H-buffer solution (Roche
GmbH., Germany) for 15 min to maintain the solution balance and replaced by 100
µL XbaI (50U/cell) enzyme solution(Roche GmbH., Germany). Restriction reaction
was carried out at 37ºC in waterbath for 4 h. To stop the enzyme activity, enzyme
solution was discarded and 500 µL 0,5XTBE solution was added.
3.6.5. Casting Pulsed Field Agarose Gel
2,5 mm agarose slices was placed onto the teeth of horizontally positioned
electrophoresis comb by means of a sterile spatula and the excess of buffer solution
was removed by the help of a pipette. The slices were kept for 5 min horizontally on
the teeth to dry and the comb was placed into the gel mold tray with 90ºA. The
Seakem Agarose (1%)-TBE at 50ºC was poured into the tray slowly with a special
care not to replace the agarose slices from the teeth. It was kept at room temperature
for 30 min to solidify.
3.6.6. Electrophoresis, Staining and Documentation of Pulsed Field Agarose Gel
Pulsed Field chamber (CHEF-DR II, Variable Angle System, BioRad, USA) was
filled with 2,5 L of 0,5XTBE solution (with 0,016 g thiourea) and cooled down to
14ºC. When the Pulsed Field agarose gel solidified, it was placed into the chamber
and electrophoresis was performed under 6V/cm (200V), 2-64 s and 120ºA
conditions for 20 h. Later, the gel was stained with ethidium bromide solution (0,5
µg/mL) and destained with sterile bidest water for 20 min each. PFGE pattern was
documented under UV light by EagleEye II (Strartagene, USA).
3.6.7 Cluster Analysis
PFGE results were analysed by using BioNumerics Software (Applied-Maths,
Kortrijk, Belgium). The banding patterns were compared using Dices coefficient
with a 1,5% band position tolerence and unweighted pair group method with
arithmetic averages (UPGMA) (Zhao et al., 2007)

42
3.7. Antimicrobial Susceptibility Testing
3.7.1. Disk Diffusion Method
The cultures were inoculated into 4 mL LB-broth by the aid of a sterile plastic loop
and incubated at 37ºC for 18 h. After incubation, they were diluted in the range of
1:100 with sterile bidest water and 100 µL were spread on Müller-Hinton agar
(Oxoid, UK) plates. 6 mm paper disks containing antimicrobial agents (Oxoid, UK)
were placed onto the agar surface and incubated at 37ºC for 18 h. For disk diffusion,
16 different antimicrobials were used and 11 additional β-lactams were tested when
β-lactam resistance was obtained. The table showing used antimicrobial disks
(Table A.I.1) is given in Appendix I. When the incubation was complete, the zone
diameters around the disks were measured and compared with the break points of
Clinical Laboratory Standards Institute (CLSI) and decided as susceptible (S),
intermediate (I), and resistant (R).
3.7.2. Minimal Inhibitory Concentration (MIC) Metho d
Müller-Hinton agar plate was streaked with the culture to be tested and incubated at
37ºC for 18 h. The culture was taken by the aid of a sterile plastic loop and
suspended in 5 mL sterile saline solution (0,85% NaCl). Then the turbidity of
suspensions were measured to achieve 0,5 McFarland turbidity in Sensititer System
(Autoinoculator INO2, Trek Diagnostic Systems Ltd., UK). From the suspension 15
µL was transferred into 11 mL Müller-Hinton-broth (Oxoid, UK) and mixed. 100 µL
from the inoculated Müller-Hinton Broth was dispensed in microtiter plates
(NLMV1A, Trek Diagnostic Systmes Ltd., UK) having different lyophilized
antimicrobial agent with different concentrations in its each well. 17 antimicrobials
were the same set of those used for disk diffusion with the addition of Colistin. Table
showing antimicrobial concentrations of the microtiter plate used (Table A.I.2) is
given in Appendix I. Thereafter, the plates were covered with a plastic sticker and
incubated at 37ºC for 18 h. After incubation the plate was read under semi-automatic
Sensitouch System (Accumed International Ltd., UK) and the antimicrobial
concentration corresponding the first well where there was any growth determined as
the MIC value. The concentrations (µg/mL) obtained for the culture was compared
with the CLSI breakpoints and concluded as S, I, and R.

43
3.8. Genotypic Characterization of Antimicrobial Resistance
3.8.1. Raw-DNA Isolation
Raw-DNA of the culture was isolated using DNA-boiling method suggested by
Sambrook et al. (1989). 1 mL fresh culture (grown at 37ºC for 18 h) was transferred
to a microcentifuge tube and centrifuged for 6 min at 14.000 rpm (Model 5415D,
Eppendorf GmbH., Germany). The supernatants were discarded and the pellets were
dried by aspiration. Dried pellets were resuspended in 300 µL TE-buffer solution.
Then the suspension was boiled in waterbath (100 ºC) for 10 min and immediately
transferred into ice-bath. When it cooled down, it was centrifuged at 14.000 rpm for
2 min and the supernatant (or raw-DNA) was transferred into a new sterile 1,5 mL
microcentrifuge tube. The raw-DNA was dispensed in aliquots and stored at -20ºC
and used in all PCR amplifications.
3.8.2. PCR Amplifications
GeneAmp9700 Thermocycler (Applied Biosystems, USA) was used for PCR
amplifications. The specific primers used for the antimicrobial resistance gene
amplifications are given in Table 3.2. The reaction mixture and conditions for the
amplifications are as follows:
PCR reaction mixture (for single reaction):
- 12 µL sterile dH2O (Merck KGaA., Germany)
- 2,5 µL 10X PCR buffer solution (Finnzyme Oy, Finland)
- 2,5 µL dNTP mix, 200µM end concentration (dNTP Set 1, Roth GmbH.,
Germany)
- 2,5 µL Forward primer, 1ρmol end concentration (Table 3.2)
- 2,5 µL Reverse primer, 1 ρmol end concentration (Table 3.2)
- 0,5 µL DyNazyme II DNA-polymerase (2U/µl) (Finnzyme Oy, Finland)
- 2,5 µL Raw-DNA
PCR amplification conditions:
- 94oC, 5 min
- 30 cycle; 94oC/30 s; Ta/30 s; 72oC/te
- 72oC, 5 min
- 4oC, ∞

44
Ta (annealing temperature, oC) was calculated from the formula Ta = [2 X (A + T)] +
[4 X (G +T)] whereas te (elongation time, s) was determined according to the
expected PCR product size in terms of base pairs (bp) i.e. for an expected PCR
product of ≤500 bp, te was adjusted to 30s, 500-700 bp to 40 s, and ≥1000 bp to 60 s
or more.
3.8.3. Agarose Gel Electrophoresis and Gel Documentation
When the PCR amplification completed, 8 µL PCR product and 2 µL
DNA-sample-buffer were mixed and load on 1,5% agarose gel together with the
DNA-size ladder (Hyperladder II, Bioline, Germany). The buffer used for the gel
preparation and electrophoresis was 1XTBE solution and the running condition was
50 V/15 min followed by 80 V/45 min (power supply: PowerPac 300, BioRad,
USA). After electrophoresis, the gel was stained with ethidium bromide solution (0,5
µg/mL) and washed with sterile bidest water for 15 min each. Gel documentation
was done with EagleEye II (Stratagene, USA) under UV light.
3.8.4. DNA Sequence Analysis
DNA Sequence analysis was done to detect the mutation type resistance. In order to
sequence DNA fragments, PCR amplification of the fragment was performed with
100 µL of total reaction volume. Thereafter, it was purified by GFX PCR DNA/Gel
Band Purification Kit (GE, Healthcare, UK) to 50 µL in TE-buffer solution.
Sensitivity of purification was controlled by running 10 µL purified DNA on 1,5%
agarose gels as described above. To sequence the purified DNA, 10 µL volume (20
ng DNA/µL) was mixed with 4 µL forward primer (5 pmol/µL) and sent to AGOWA
GmbH., Germany. When the results were received, they were analysed by SeqMan
Pro software program (DNAStar Inc., USA) and by BLAST
(http://www.ncbi.nlm.nih.gov/BLAST/).

45
Table 3.2. Primer pairs and PCR conditions.
Resistance Gene/Region Control
Strain Primer pair (Forward/Reverse) Ta/te
PCR Product Reference
Class I Integron 5’-3’CS SUO1 GGCATCCAAGCAGCAAGC/
AAGCAGACTTGACCTGAT 58oC / 02:30 min variable
Guerra et al.,
2004b
Sulfonamides sul 1 SUO1 CTTCGATGAGAGCCGGCGGC/
GCAAGGCGGAAACCCCGCC 65oC / 00:30 min 436 bp
Guerra et al.,
2004b
sul 2 SUO5 TCAACATAACCTCGGACAGT/
GATGAAGTCAGCTCCACCT 60oC / 00:40 min 707 bp
Guerra et al.,
2004b
sul 3 S65
GAGCAAGATTTTTGGAATCG/
CATCTGCAGCTAACCTAGGGC
TTTGGA
51oC / 00:40 min ~ 750 bp Perreten,
2003
β-lactams blatem-1 SUO8 TTGGGTGCACGAGTGGGT/
TAATTGTTGCCGGGAAGC 55oC / 00:30 min 503 bp
Guerra et al.,
2004b
blaoxa-1 SUO5 AGCAGCGCCAGTGCATCA/
ATTCGACCCCAAGTTTCC 60oC / 00:30 min 708 bp
Guerra et al.,
2004b
blapse-1 SUO1 CGCTTCCCGTTAACAAGTAC/
CTGGTTCATTTCAGATAGCG 60oC / 00:30 min 419 bp
Guerra et al.,
2004b
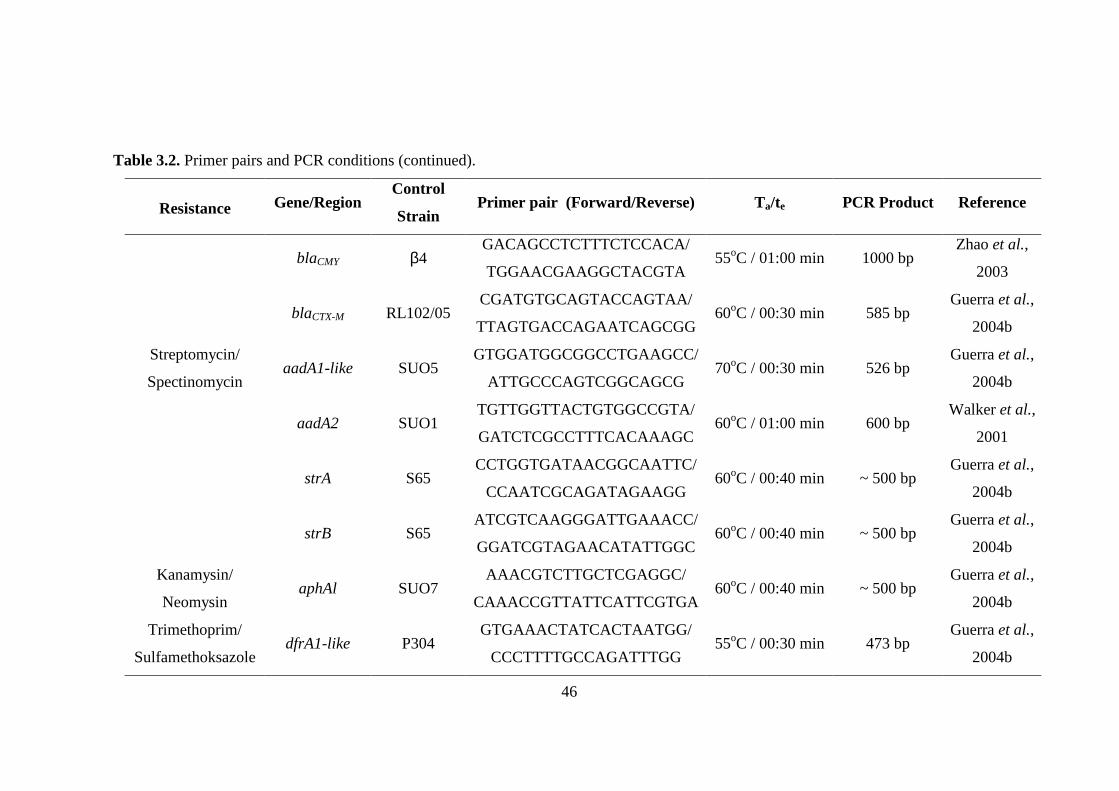
46
Table 3.2. Primer pairs and PCR conditions (continued).
Resistance Gene/Region Control
Strain Primer pair (Forward/Reverse) Ta/te
PCR Product Reference
blaCMY β4 GACAGCCTCTTTCTCCACA/
TGGAACGAAGGCTACGTA 55oC / 01:00 min 1000 bp
Zhao et al.,
2003
blaCTX-M RL102/05 CGATGTGCAGTACCAGTAA/
TTAGTGACCAGAATCAGCGG 60oC / 00:30 min 585 bp
Guerra et al.,
2004b
Streptomycin/
Spectinomycin aadA1-like SUO5
GTGGATGGCGGCCTGAAGCC/
ATTGCCCAGTCGGCAGCG 70oC / 00:30 min 526 bp
Guerra et al.,
2004b
aadA2 SUO1 TGTTGGTTACTGTGGCCGTA/
GATCTCGCCTTTCACAAAGC 60oC / 01:00 min 600 bp
Walker et al.,
2001
strA S65 CCTGGTGATAACGGCAATTC/
CCAATCGCAGATAGAAGG 60oC / 00:40 min ~ 500 bp
Guerra et al.,
2004b
strB S65 ATCGTCAAGGGATTGAAACC/
GGATCGTAGAACATATTGGC 60oC / 00:40 min ~ 500 bp
Guerra et al.,
2004b
Kanamysin/
Neomysin aphAl SUO7
AAACGTCTTGCTCGAGGC/
CAAACCGTTATTCATTCGTGA 60oC / 00:40 min ~ 500 bp
Guerra et al.,
2004b
Trimethoprim/
Sulfamethoksazole dfrA1-like P304
GTGAAACTATCACTAATGG/
CCCTTTTGCCAGATTTGG 55oC / 00:30 min 473 bp
Guerra et al.,
2004b

47
Table 3.2. Primer pairs and PCR conditions (continued).
Resistance Gene/Region Control
Strain Primer pair (Forward/Reverse) Ta/te
PCR Product Reference
dfrA12 SUO8 ACTCGGAATCAGTACGCA/
GTGTACGGAATTACAGCT 55oC / 00:30 min 462 bp
Guerra et al.,
2004b
dfrA5-14 SUO6 GATTGGTTGCGGTCCA/
CTCAAAAACAACTTCGAAGG 55oC / 00:30 min 379 bp
Guerra et al.,
2004b
dfrA7-17 NRL1 CAGAAAATGGCGTAATCG/
TCACCTTCAACCTCAACG 55oC / 00:30 min 345 bp
Guerra et al.,
2004b
Tetracycline tet(A) SUO8 GCTACATCCTGCTTGCCT/
CATAGATCGCCGTGAAGA 60oC / 00:30 min 210 bp
Guerra et al.,
2004b
tet(B) SUO5 TTGGTTAGGGGCAAGTTTTG/
GTAATGGGCCAATAACACCG 60oC / 00:30 min 600 bp
Guerra et al.,
2004b
tet(G) SUO1 GCTCGGTGGTATCTCTGC/
AGCAACAGAATCGGGAAC 60oC / 00:30 min 500 bp
Guerra et al.,
2004b
Phenicols cat SUO5 CCTGCCACTCATCGCAGT/
CCACCGTTGATATATCCC 60oC / 00:30 min 623 bp
Guerra et al.,
2004b
cmlA SUO8 TGTCATTTACGGCATACTCG/
ATCAGGCATCCCATTCCCAT 55oC / 00:30 min 435 bp
Guerra et al.,
2004b

48
Table 3.2. Primer pairs and PCR conditions (continued).
Resistance Gene/Region Control Strain Primer pair (Forward/Reverse) Ta/te PCR Product Reference
floR SUO1 CACGTTGAGCCTCTATAT/
ATGCAGAAGTAGAACGCG 55oC / 00:40 min 868 bp
Guerra et al.,
2004b
Gentamicin aac(3)-IV SUO8 GTTACACCGGACCTTGGA/
AACGGCATTGAGCGTCAG 60oC / 00:40 min 674 bp
Guerra et al.,
2004b
aac(3)-II 99-4068 ATTCGAAAACTCGGAGTC/
CGGAGTGGCTCCGAAGTG 60oC / 00:40 min 800 bp
Guerra et al.,
2004b
Quinolones gyrA S. Typhimurium
LT2
TGTCCGAGATGGCCTGAAGC/
TACCGTCATAGTTATCCACG 60oC / 00:30 min 346 bp
Guerra et al.,
2003
parC S. Typhimurium
LT2
TCGTGCGTTGCCGTTTATTG/
CATGGTGCCGTCGAAGTTTG 60oC / 00:30 min 369 bp
Guerra et al.,
2003
qnrA E. coli pMG252 TCAGCAAGAAGGATTTCTCA/
GGCAGCACTATTACTCCCAA 60oC / 00:30 min 627 bp
Wang et al.,
2003
qnrB - ATGACGCCATTACTGTATAA/
GATCGCAATGTGTGAAGTTT 55oC / 00:30 min 562 bp
Jacoby et al.,
2006
qnrS - ACGACATTCGTCAACTGCAA/
TAAATTGGCACCCTGTAGGC 60oC / 00:30 min 416 bp
Gay et al.,
2006

49
Table 3.2. Primer pairs and PCR conditions (continued).
Resistance Gene/Region Control Strain Primer pair (Forward/Reverse) Ta/te PCR Product Reference
Sequencing
pRQ2006
pre-qnrS1 /
qnrS-B1 -
CTGATAACACTTCAACCATC/
TGGAAACTTGCATCACGAAG 60oC / 00:30 min 621
Poirel et al.,
2006; present
study
Sequencing
pRQ2006
qnrS-F /
pre-qnrS2 -
ACGACATTCGTCAACTGCAA/
TCGTTTTATAAATTTGAGCG 60oC / 00:30 min 579
Gay et al.,
2006; Poirel
et al., 2006
Sequencing
pRQ2006
post-qnrF1-
F/B -
GAAGCACTGGGTATTGTTGT/
GCTTGTCTTCGGTATCTTTG 55oC / 00:30 min 639 present study
Sequencing
pRQ2006
post-qnrF2-
F/B -
GGCAGAATATCTTTCAGCAG/
AGATAGTCATCCACCACAGC 60oC / 00:30 min 482 present study
Sequencing
pRQ2006 tnpIS26-F/B -
CAGGGGATCACCATAATAAA/
AACCTACGTGAAGGTCAATG 58oC / 00:30 min 420 present study
pIV2 vector primer M13-1224S - CGCCAGGGTTTTCCCAGTCAC
GAC - -
New England
Biolabs
pIV2 vector primer M13-1233S - AGCGGATAACAATTTCACACA
GGA - -
New England
Biolabs

50
3.9. Detection of Class I Integrons
The universal class I integron primers designed for the conserved regions
(5CS’/3CS’; Table 3.2) was used to detect class 1 integrons for the antimicrobial
resistant strains. DNA amplification, agarose gel electrophoresis and gel
documentation was done as described in Section 3.8. Detected integrons were
subjected to PCR-RFLP analysis. For this aim, TaqI endonuclease (Roche GmbH.,
Germany) enzyme was used. After the DNA amplification of integron with the
primers, 100 µL end volume of the PCR product was purified by PCR DNA/Gel
Band Purification Kit (GE, Healthcare, UK) to 50 µL in 1XTE buffer solution. 8 µL
purified PCR product mixed with 1,5 µL buffer-B (Roche GmbH., Germany), 0,5 µL
TaqI endonuclease (5U/mL; Roche GmbH., Germany), and 5 µL PCR grade water to
obtain 15 µL mix. The mixture was incubated at 65oC for 1 h in the waterbath.
Immediately after incubation, it was transferred to ice-bath in order to stop the
enzyme reaction. Agarose gel electrophoresis and gel documentation was performed
as given in Section 3.8.3. When the difference was detected, DNA sequence analyses
were performed in order to reveal the gene cassette in variable region of the class I
integron. DNA sequence analyses were done by the method explained in
Section 3.8.4.
3.10. Conjugation
E. coli J53 (RifR) strain was used as the recipient of conjugation analyses. From fresh
cultures of donor and recipient strains, 10 mL LB-broth was inoculated in
1/20 (vol/vol) range and incubated in a shaking incubator at 37oC until 95-110 Klett
Unit (~1,2X10⁸) was achieved. The strains were mixed 1:2 (donor:recipient) in two
parallels and filtered through 0,45 µm pore-sized membrane filters. Then the filters
were placed onto the surface of LB-agar plates and one was incubated at room
temperature whereas the other at in parallel for 6 h to conjugate. At the end of
incubation, the filter was transferred into 2 mL LB-broth and washed by vigorous
agitation. Eosin Methylene Blue (EMB) agar plates containing ampicillin
(100 µg/mL) and rifampicin (50 µg/mL) was inoculated with serial dilutions of the
culture for 24-48 h at 37oC and typical E. coli colonies (if any) were selected as
conjugants. The conjugants were characterized by means of plasmid analysis and

51
PCR amplification of the gene expected to be transferred. After these confirmations,
conjugants were stored at -20oC in LB-broth containing 60% glycerol.
3.11. Southern-Blotting and DNA-Hybridization Analysis
3.11.1. Southern-Blotting
Southern-Blotting was performed following the method suggested by Sambrook et
al. (1989). The plasmid was isolated, run and documented as described in
Section 3.5. Later, the plasmid gel was transferred to a tank containing sterile bidest
water and washed twice to remove the ethidium bromide from agarose gel. After
washing, 250 mL HCl solution (0,25 N) was applied 15 min on a shaker in order to
perform depurination. To stop depurination the gel was washed with sterile bidest
water for 5 min and denatured with 250 mL NaOH solution (0,5 N) for 30 min on a
shaker. To discard NaOH completely, the gel was washed 5 min more and left in
10XSSC for 2 min to maintain the solution balance. Thereafter, the gel was placed
on to the vacuum blotter (Model 785, BioRad, USA) in such away that a filter paper
(Whatmann No. 1) at the bottom, a positively charged nylon membrane (Roche
GbmH., Germany) in the middle, and the gel to be blotted on the top. The blotting
was performed in 10XSSC solution (~500 ml) at 5 Hg-vacuum for 2 h. Right after
blotting, the membrane was dried by aspiration at room temperature and cross-linked
under UV-light for 2 min. The membrane was kept at in a plastic bag +4oC until
DNA hybridization assay.
3.11.2. DNA Probe Preparation
DNA fragment was amplified by PCR as described in Section 3.8.2 with the
exception by using digoxigenin-labelled dNTPs (PCR-DIG Labelling Mix, Roche
GmbH., Germany). The PCR product was run on agarose gel as explained before and
the band of concern was cut under UV-light by means of a scalpel. The DNA
fragment was purified from the agarose by GFX PCR DNA/Gel Band Purification
Kit (GE, Healthcare, UK). The purified DNA probe was than kept at - 20oC.

52
3.11.3. DNA Hybridization
Hybridization solution prepared with hybridization solution (Roche GmbH.,
Germany) was prewarmed to 42oC in waterbath (GFL 1002, GFL GmbH., Germany).
The plastic bag containing the membrane was filled with this solution (~15-30 mL)
and incubated at 42oC for 30-60 min in a shaking waterbath (GFL 1083, GFL
GmbH., Germany). Just before to the end of the incubation, 3 µL DNA-probe mixed
with 80 µL hybridization solution and denatured at 100ºC for 5 min in the
Thermocycler (GenAmp9700, Thermocycler, Applied Biosystems, USA). When the
denaturation of DNA-probe was completed, it was cooled in ice-bath immediately
and applied to the membrane in plastic bag. Hybridization was carried out for
overnight at 42ºC in shaking incubator.
3.11.4. Post-Hybridization Process
Following the incubation the membrane was performed to a series of washing steps
by shaking in each step of post-hybridization. Initially the membrane was washed
with post-hybridization-wash solution-I (~100 mL) twice for 5 min each. In the
meanwhile, post-hybridization-wash solution-II was pre-warmed to 68ºC in
waterbath. Thereafter, the membrane was transferred, to a new plastic bag together
with ~15-30 mL post-hybridization washing solution-II and washed twice at 68ºC for
15 min each in waterbath.
After washing the membrane ~100 mL 1Xblocking reagent (Roche GmbH.,
Germany) was applied at room temperature for 30 min. DIG-AP antibody solution
(Roche GmbH., Germany) was diluted with 1Xblocking reagent in the range of
1:5000, the membrane was transferred into this solution (~100 mL) and kept at room
temperature for 30 min. In order to remove antibody solution, the membrane was
washed with detection-wash solution (~100 mL) following maleic acid buffer
solution (~100 mL) for 15 min each at room temperature. The membrane was kept in
the detection-buffer solution (~100 mL) for 2 min to maintain the solution balance
and transferred to a new plastic bag. ~15-30 mL NBT/BCIP-mix (NBT/BCIP Stock
Solution, Roche GmbH., Germany) was prepared by adding 200 µL NBT/BCIP
stock solution to each 10 mL detection-buffer solution. The membrane was kept in
dark, at room temperature with this solution without shaking. When the hybridization

53
was developed, the reaction was stopped by washing the membrane with sterile
bidest water. After documentation, the membrane was kept in a new plastic bag with
1XTE solution at +4ºC.
3.12. Cloning
3.12.1. Restriction Analyses
The plasmid to be cloned was first subjected to restriction cutting with 13 different
restriction enzymes not only to define the restriction profile appropriate for the aim
of cloning but also to characterize the plasmid. The culture having the plasmid was
inoculated (1%, vol/vol) into 200 mL LB-broth containing ampicillin (end
concentration of 100 µg/mL) and incubated at 37ºC for 18 h. Plasmid isolation was
done by using commercially available Qiagen MidiPrep kit (Qiagen, Germany). The
set of enzymes used for restriction digestion analysis were BamHI, EcoRI, HindIII,
PstI, PvuI, SalI, HincII, XbaI, SmaI, EcoRV, SacI, Bsp 120-I, and XhoI
(Fermentas, Germany). The restriction mixture was prepared for each enzyme
contained 2 µL plasmid DNA, 6 µL sterile bidest water, 1 µL buffer solution of the
enzyme used, and 1 µL restriction enzyme. The mix was incubated at 37ºC for 2 h
for each of the restriction reaction. Following the reaction, 8 µL restriction product
with 2 µL loading buffer solution was loaded on 0,8% horizontal agarose gel in TBE.
Electrophoresis and gel documentation was performed as described in Section 3.5.
3.12.2. Ethanol Precipitation
When the restriction enzyme was selected for cloning, the restriction digestion was
carried out once more with a mixture having 50 µL end volume. 47 µL restriction
product, 4.7 µL sodium acetate (3M) and 120 µL ice-cold pure ethanol was mixed
and DNA was precipitated at -20ºC for 1 h. Thereafter, the mixture was centrifuged
at 14.000 rpm for 20 min. The pellet was resuspended in 800 µL ice-cold ethanol
(80%) and centrifuged again at 14.000 rpm for 15 min to get rid of the salt
contamination. The supernatant was discarded, pellet was dried by aspiration and
then dissolved in 20 µL sterile bidest water. Besides the plasmid to be cloned, the
vector plasmid (pIV2, KanR) was also subjected to the same treatments.

54
3.12.3. Ligation
The vector plasmid and the plasmid to be cloned were treated with T4 DNA-ligase
(Fermentas, Germany). 8 µL plasmid of concern, 8 µL vector plasmid, 2 µL T4
DNA-ligase buffer solution, and 2 µL T4 DNA-ligase enzyme were mixed and
incubated at room temperature for 18 h to perform the ligation.
3.12.4. Tranformation
For transformation, competent E. coli cell preparation (NEB 5α, Biolabs Inc. USA)
was used. 5 µL ligation mix, 50 µL competent cell preparation, and 50 µL SOC
medium was mixed and incubated 30 min in ice-bath. To maintain the heat shock,
immediately after incubation, the mixture was incubated in a waterbath at 42ºC for
30 s and transferred to the ice-bath. 900 µL SOC medium was added and incubated
at 37ºC for 1 h in a shaking incubator (200 rpm). Thereafter, the culture was
centrifuged at 5000 rpm for 5 min and the supernatant was removed by leaving
100 µL to resuspend the pellet. The suspension was spread on the surface of LB-agar
plates containing ampicillin (100 µg/mL). After incubation at 37ºC for 18 h,
transformant colonies were selected, grown in 5 mL LB-broth containing ampicillin
(100 µg/mL) at 37ºC for 18 h, and plasmid analysis was performed with the
commercial plasmid isolation kit (Qiagen MiniPrep Kit, Qiagen, Germany). The
cloned DNA fragment was detected with restriction digestion with the restriction
enzyme used in cloning.
3.12.5. DNA Sequencing by Primer Walking
DNA sequence of the cloned DNA fragment was analysed by primer walking
method. First the DNA fragment was sequenced with the primers designed for vector
plasmid’s multiple cloning site (MCS) from both 5’ and 3’ sites by forward and
reverse primers (Table 3.2). When the sequence obtained, the end of the sequenced
fragment was used as the primer for the next part of the fragment sequence. This was
repeated until the both sequences from left- and right-hand sides were overlapped.
The complete sequence was analysed by SeqMan Pro software program (DNAStar
Inc., USA) and by BLAST (http://www.ncbi.nlm.nih.gov/BLAST/).
55
3.13. Plasmid Incompatibility Group Detection
Plasmid incompatibility group detection was performed following the method
suggested by Carattoli et al. (2005). The boiled DNA’s (Section 3.8.1) were used as
the template DNA, the known plasmids having the corresponding incompatibility
group as (+) control and sterile PCR grade water as (-) control (Table 3.3). The list of
the primers used in plasmid incompatibility studies is given in Table 3.3. The control
plasmids were obtained from Federal Institute of Risk Assessment, Salmonella
Reference Laboratories with the permission of Dr. Alessandra Carattoli (Department
of Infectious, Parasitic, Immune-mediated Diseases, Istituto Superiore di Sanità
Roma, Italy).
To detect the incompatibility group, PCR amplification was done with the primers
specially designed corresponding to 18 different replication origins of each
incompatibility group as given in the method and performed with GeneAmp9700
Thermocycler (Applied BioSystems, USA). Reaction mixture and amplification
conditions are given below. By following the method, 5 multiplex- and 3 simplex-
PCR analyses were carried out (Table 3.3). While simplex-PCR reaction mix was
used as described in Section 3.8.2, multiplex-PCR was performed with the mixture as
described below. Except FrepB incompatibility group, PCR conditions were the same
for both multiplex- and simplex-PCR analyses. The FrepB-simplex-PCR was
performed with the same amplification program but at an annealing temperature of
52 °C. If any positive result was obtained from the multiplex-PCR, in order to
confirm the PCR product, simplex-PCR was performed with the corresponding
primers.
56
Multiplex-PCR reaction mixture (for single reaction):
- 2µL sterile dH2O (Merck KGaA., Germany)
- 2,5µL 10X PCR buffer solution (Finnzyme Oy, Finland)
- 2,5µL dNTP mix, 200µM end concentration (dNTP Set 1, Roth GmbH.,
Germany)
- 2,5µL Forward primerI, 1ρmol end concentration
- 2,5µL Reverse primerI, 1ρmol end concentration
- 2,5µL Forward primerII, 1ρmol end concentration
- 2,5µL Reverse primerII, 1ρmol end concentration
- 2,5µL Forward primerIII, 1ρmol end concentration
- 2,5µL Reverse primerIII, 1ρmol end concentration
- 0,5µL DyNazyme II DNA-polymerase (2U/µL) (Finnzyme Oy, Finland)
- 2,5µL Raw-DNA
Multiplex- ve Simplex-PCR amplification conditions:
- 94oC, 5 min
- 30 cycle: 94oC/1 min; 60 oC/30 s; 72oC/1 min
- 72oC, 5 min
- 4oC, ∞

57
Table 3.3. Primer pairs used for the replicon typing analyses (Carattoli et al., 2005).
Multiplex
PCR Group
Incompatibility
Group
Primer Pair (Forward/Reverse) PCR
Product
1 HI1 GGAGCGATGGATTACTTCAGTAC/TGCCGTTTCACCTCGTGAGTA 471 bp
HI2 TTTCTCCTGAGTCACCTGTTAACAC/GGCTCACTACCGTTGTCATCCT 644 bp
I1 CGAAAGCCGGACGGCAGAA/TCGTCGTTCCGCCAAGTTCGT 139 bp
2 X AACCTTAGAGGCTATTTAAGTTGCTGAT/GAGAGTCAATTTTTATCTCATGTTTTAGC 376 bp
L/M GGATGAAAACTATCAGCATCTGAAG/CTGCAGGGGCGATTCTTTAGG 785 bp
N GTCTAACGAGCTTACCGAAG/GTTTCAACTCTGCCAAGTTC 559 bp
3 FIA CCATGCTGGTTCTAGAGAAGGTG/GTATATCCTTACTGGCTTCCGCAG 462 bp
FIB GGAGTTCTGACACACGATTTTCTG/CTCCCGTCGCTTCAGGGCATT 702 bp
W CCTAAGAACAACAAAGCCCCCG/GGTGCGCGGCATAGAACCGT 242 bp
4 Y AATTCAAACAACACTGTGCAGCCTG/GCGAGAATGGACGATTACAAAACTTT 765 bp
P CTATGGCCCTGCAAACGCGCCAGAAA/TCACGCGCCAGGGCGCAGCC 534 bp
FIC GTGAACTGGCAGATGAGGAAGG/TTCTCCTCGTCGCCAAACTAGAT 262 bp

58
Table 3.3. Primer pairs used for the replicon typing analyses (continued) (Carattoli et al., 2005).
Multiplex
PCR Group
Incompatibility
Group
Primer Pair (Forward/Reverse) PCR
Product
5 A/C GAGAACCAAAGACAAAGACCTGGA/ACGACAAACCTGAATTGCCTCCTT 465 bp
T TTGGCCTGTTTGTGCCTAAACCAT/CGTTGATTACACTTAGCTTTGGAC 750 bp
FIIS CTGTCGTAAGCTGATGGC/CTCTGCCACAAACTTCAGC 270 bp
Simplex-1 FrepB TGATCGTTTAAGGAATTTTG/GAAGATCAGTCACACCATCC 270 bp
Simplex-2 K/B GCGGTCCGGAAAGCCAGAAAAC/TCTTTCACGAGCCCGCCAAA 160 bp
Simplex-3 B/O GCGGTCCGGAAAGCCAGAAAAC/TCTGCGTTCCGCCAAGTTCGA 159 bp

59
CHAPTER 4
RESULTS
The results of the study are given through this chapter. Briefly there were 203 food
samples obtained from Turkish markets analysed and from those 59
epidemiologically unrelated strains were obtained. In addition to these strains, 49
strains originated from Germany were added to the analyses. The antimicrobial
resistances of the isolates were found to be variable. Among Turkish strains the
highest antimicrobial resistance was observed against NAL, whereas it was against
SUL for strains from German origin. Molecular typing of all strains exhibited
different plasmid profiles and PFGE patterns. There were 1-4 plasmids/profile for
Turkish strains and 1-7 plasmids/profile for German strains. The PFGE patterns
revealed 42 different groups, having two major clusters with 44,3% arbitrary
homology. The genetic determinants of the antimicrobial resistance were shown
similar results to those reported in the literature by the antimicrobial resistance genes,
integron analyses, DNA sequencing and lateral gene transfer studies.

60
4.1. Isolation and Typing of the Strains
4.1.1. Isolation and Biochemical Characterization of Strains
Out of 203 food samples collected 108 Salmonella isolates were obtained
(Table A.I.3). The rate of isolation was 71% for poultry, 60% for meat and 33% for
raw milk. There was only 2 isolates from 18 mayonnaise-based salad samples.
Biochemical test results exhibited 100 of the isolates as Salmonella spp. strains with
89,4-99,9% probability (Table 4.1). These strains have shown differences in their
biochemical pattern in arginine dihydrolysis, lysine decarboxylation, ornithin
decarboxylation, gelatinase activity, inositol-oxidation, and mellibiose-fermentation.
In comparison with the control strain S. Typhimurium ATCC 14028, 14 strains were
arginine dihydrolysis, 2 strains were lysine decarboxylation, 2 strains were ornithine
decarboxylation, 50 strains were inositol-oxidation, and 1 strain was mellibiose-
fermentation deficient. On the other hand, 2 strains were gelatinase positive. These
strains revealed the atypic biochemical characteristics of Salmonella spp.
4.1.2. Serotyping and Phage Typing
Serological analysis revealed that the most prevalent serotype in the food samples
analysed were S. Enteritidis (16 isolates) and followed by S. Virchow (14 isolates),
S. Kentucky (11 isolates), and S. Infantis (12 isolates). The rest of the isolates
exhibited 13 different serotypes corresponding 47% of total isolates (Table 4.2). The
DMC52 and DMC85 were found to be mixed culture and two different serotypes
were obtained for each. Hence these isolates were renamed as DMC52a
(S. Kentucky), DMC52b (S. subsp. I Roughform), DMC85a (S. Kentucky) and
DMC85b (S. subsp. I Roughform). Phage typing results are given in Table 4.2.
Among S. Enteritidis serotypes PT21 was the most prevalent but PT3 and PT6 phage
types were also detected. The two S. Typhimurium isolates were found not to
correspond any phage type in the database so called RDNC phage type.
According to the results, out of 100 isolates, 59 were considered as
epidemiologically unrelated strains by comparing isolation date, isolation source,
serotype and phage type. The rest of the study was performed with these 59
epidemiologically unrelated strains.

61
Table 4.1. Biochemical analyses results of the strains isolated.
Strain ONPG ADH LDC ODC CIT H 2S URE TDA IND VP GEL GLU MAN INO SOR RHA SAC MEL AMY ARA Computer Analysis Conrtol* - + + + + + - - - - - + + + + + - + - + Salmonella spp.(99.9%)
DMC1 - + + + + + - - - - - + + + + + - + - + Salmonella spp.(99.9%) DMC2 - + + + + + - - - - - + + + + + - + - + Salmonella spp.(99.9%) DMC3 - + + + + + - - - - - + + - + + - + - + Salmonella spp.(89.4%) DMC4 - + + + + + - - - - - + + - + + - + - + Salmonella spp.(89.4%) DMC5 - + + + + + - - - - - + + + + + - + - + Salmonella spp.(99.9%) DMC6 - + + + + + - - - - - + + - + + - + - + Salmonella spp.(89.4%) DMC7 - + + + + + - - - - - + + + + + - + - + Salmonella spp.(99.9%) DMC8 - + + + + + - - - - - + + - + + - + - + Salmonella spp.(89.4%) DMC9 - + + + + + - - - - - + + + + + - + - + Salmonella spp.(99.9%)
DMC10 - + + + + + - - - - - + + + + + - + - + Salmonella spp.(99.9%) DMC11 - + + + + + - - - - - + + - + + - + - + Salmonella spp.(89.4%) DMC12 - + + + + + - - - - - + + + + + - + - + Salmonella spp.(99.9%) DMC13 - - + + + + - - - - - + + - + + - + - + Salmonella spp.(95.1%) DMC14 - + + + + + - - - - - + + - + + - + - + Salmonella spp.(89.4%) DMC15 - + + + + + - - - - - + + - + + - + - + Salmonella spp.(89.4%) DMC16 - + + + + + - - - - - + + + + + - + - + Salmonella spp.(99.9%) DMC17 - + + + + + - - - - - + + + + + - + - + Salmonella spp.(99.9%) DMC18 - + - - + + - - - - - + + + + + - - - + Salmonella spp.(93.8%) DMC19 - + + + + + - - - - - + + + + + - + - + Salmonella spp.(99.9%) DMC20 - + + + + + - - - - - + + + + + - + - + Salmonella spp.(99.9%) DMC21 - + + + + + - - - - + + + - + + - + - + Salmonella spp.(89.4%) DMC22 - + + + + + - - - - + + + - + + - + - + Salmonella spp.(89.4%) DMC23 - + + + + + - - - - - + + + + + - + - + Salmonella spp.(99.9%) DMC24 - + + + + + - - - - - + + - + + - + - + Salmonella spp.(89.4%) DMC25 - - + + + + - - - - - + + - + + - + - + Salmonella spp.(95.1%) DMC26 - - + + + + - - - - - + + - + + - + - + Salmonella spp.(95.1%) DMC27 - + + + + + - - - - - + + + + + - + - + Salmonella spp.(99.9%) DMC28 - - + + + + - - - - - + + - + + - + - + Salmonella spp.(95.1%) DMC29 - - + + + + - - - - - + + - + + - + - + Salmonella spp.(95.1%) DMC30 - - + + + + - - - - - + + - + + - + - + Salmonella spp.(95.1%) DMC31 - - + + + + - - - - - + + - + + - + - + Salmonella spp.(95.1%) DMC32 - + + + + + - - - - - + + + + + - + - + Salmonella spp.(99.9%) DMC33 - + + + + + - - - - - + + + + + - + - + Salmonella spp.(99.9%) DMC34 - + + + + + - - - - - + + - + + - + - + Salmonella spp.(89.4%)

62
Table 4.1. Biochemical analyses results of the strains isolated (continued).
Strain ONPG ADH LDC ODC CIT H2S URE TDA IND VP GEL GLU MAN INO SOR RHA SAC MEL AMY ARA Computer Analysis DMC35 - + + + + + - - - - - + + - + + - + - + Salmonella spp.(89.4%) DMC36 - + + + + + - - - - - + + - + + - + - + Salmonella spp.(89.4%) DMC37 - + + + + + - - - - - + + + + + - + - + Salmonella spp.(99.9%) DMC38 - + + + + + - - - - - + + + + + - + - + Salmonella spp.(99.9%) DMC39 - + + + + + - - - - - + + + + + - + - + Salmonella spp.(99.9%) DMC40 - + + + + + - - - - - + + + + + - + - + Salmonella spp.(99.9%) DMC41 - + + + + + - - - - - + + + + + - + - + Salmonella spp.(99.9%) DMC42 - + + + + + - - - - - + + + + + - + - + Salmonella spp.(99.9%) DMC43 - + + + + + - - - - - + + - + + - + - + Salmonella spp.(89.4%) DMC44 - + + + + + - - - - - + + + + + - + - + Salmonella spp.(99.9%) DMC45 - + + + + + - - - - - + + + + + - + - + Salmonella spp.(99.9%) DMC46 - + + + + + - - - - - + + + + + - + - + Salmonella spp.(99.9%) DMC47 - + + + + + - - - - - + + + + + - + - + Salmonella spp.(99.9%) DMC48 - + + + + + - - - - - + + + + + - + - + Salmonella spp.(99.9%) DMC49 - + + + + + - - - - - + + + + + - + - + Salmonella spp.(99.9%) DMC50 - + - + + + - - - - - + + + + + - + - + Salmonella spp.(99.8%) DMC51 - - + + + + - - - - - + + + + + - + - + Salmonella spp.(99.8%) DMC52 - + + + + + - - - - - + + - + + - + - + Salmonella spp.(89.4%) DMC53 - - + + + + - - - - - + + - + + - + - + Salmonella spp.(95.1%) DMC54 - + + + + + - - - - - + + - + + - + - + Salmonella spp.(89.4%) DMC55 - + + + + + - - - - - + + - + + - + - + Salmonella spp.(89.4%) DMC56 - + + + + + - - - - - + + - + + - + - + Salmonella spp.(89.4%) DMC57 - + + + + + - - - - - + + + + + - + - + Salmonella spp.(99.9%) DMC58 - + + + + + - - - - - + + + + + - + - + Salmonella spp.(99.9%) DMC59 - + + + + + - - - - - + + + + + - + - + Salmonella spp.(99.9%) DMC60 - + + + + + - - - - - + + + + + - + - + Salmonella spp.(99.9%) DMC61 - - + + + + - - - - - + + + + + - + - + Salmonella spp.(99.9%) DMC62 - + + + + + - - - - - + + + + + - + - + Salmonella spp.(99.9%) DMC63 - + + + + + - - - - - + + - + + - + - + Salmonella spp.(89.4%) DMC64 - + + + + + - - - - - + + + + + - + - + Salmonella spp.(99.9%) DMC65 - + + + + + - - - - - + + - + + - + - + Salmonella spp.(89.4%) DMC66 - + + + + + - - - - - + + - + + - + - + Salmonella spp.(89.4%) DMC67 - + + + + + - - - - - + + - + + - + - + Salmonella spp.(89.4%) DMC68 - + + + + + - - - - - + + + + + - + - + Salmonella spp.(99.9%) DMC69 - + + + + + - - - - - + + + + + - + - + Salmonella spp.(99.9%)

63
Table 4.1. Biochemical analyses results of the strains isolated (continued).
Strain ONPG ADH LDC ODC CIT H2S URE TDA IND VP GEL GLU MAN INO SOR RHA SAC MEL AMY ARA Computer Analysis DMC70 - + + + + + - - - - - + + + + + - + - + Salmonella spp.(99.9%) DMC71 - + + + + + - - - - - + + + + + - + - + Salmonella spp.(99.9%) DMC72 - + + + + + - - - - - + + - + + - + - + Salmonella spp.(89.4%) DMC73 - + + + + + - - - - - + + - + + - + - + Salmonella spp.(89.4%) DMC74 - + + + + + - - - - - + + - + + - + - + Salmonella spp.(89.4%) DMC75 - + + + + + - - - - - + + + + + - + - + Salmonella spp.(99.9%) DMC76 - + + + + + - - - - - + + + + + - + - + Salmonella spp.(99.9%) DMC77 - + + + + + - - - - - + + + + + - + - + Salmonella spp.(99.9%) DMC78 - + + + + + - - - - - + + + + + - + - + Salmonella spp.(99.9%) DMC79 - + + + + + - - - - - + + - + + - + - + Salmonella spp.(89.4%) DMC80 - + + + + + - - - - - + + - + + - + - + Salmonella spp.(89.4%) DMC81 - + + + + + - - - - - + + - + + - + - + Salmonella spp.(89.4%) DMC82 - + + + + + - - - - - + + + + + - + - + Salmonella spp.(99.9%) DMC83 - + + + + + - - - - - + + + + + - + - + Salmonella spp.(99.9%) DMC84 - + + + + + - - - - - + + + + + - + - + Salmonella spp.(99.9%) DMC85 - + + + + + - - - - - + + - + + - + - + Salmonella spp.(89.4%) DMC86 - + + + + + - - - - - + + - + + - + - + Salmonella spp.(89.4%) DMC87 - + + + + + - - - - - + + - + + - + - + Salmonella spp.(89.4%) DMC88 - + + + + + - - - - - + + - + + - + - + Salmonella spp.(89.4%) DMC89 - + + + + + - - - - - + + - + + - + - + Salmonella spp.(89.4%) DMC90 - + + + + + - - - - - + + + + + - + - + Salmonella spp.(99.9%) DMC91 - + + + + + - - - - - + + - + + - + - + Salmonella spp.(89.4%) DMC92 - + + + + + - - - - - + + - + + - + - + Salmonella spp.(89.4%) DMC93 - + + + + + - - - - - + + + + + - + - + Salmonella spp.(99.9%) DMC94 - + + + + + - - - - - + + - + + - + - + Salmonella spp.(89.4%) DMC95 - - + - + + - - - - - + + - + + - + - + Salmonella spp.(98.2%) DMC96 - - + + + + - - - - - + + - + + - + - + Salmonella spp.(95.1%) DMC97 - - + + + + - - - - - + + - + + - + - + Salmonella spp.(95.1%) DMC98 - - + + + + - - - - - + + - + + - + - + Salmonella spp.(95.1%) DMC99 - + + + + + - - - - - + + - + + - + - + Salmonella spp.(89.4%)
DMC100 - + + + + + - - - - - + + - + + - + - + Salmonella spp.(89.4%) ONPG: β -galactosidase; ADH: arginine dihydrolase; LDC: lysine decarboxylase; ODC: ornithine decarboxylase; CIT: citrate utilization; H2S: H2S production; URE: urea hydrolysis; TDA: deaminase; IND: indole production; VP: acetoin production; GEL: gelatinase; GLU: glucose-; MAN: mannitol-; INO: inositol-; SOR: sorbitol-; RHA: rhamnose-; SAC: sucrose-; MEL: melibiose-; AMY: amygdalin-; ARA: arabinose-fermentation/oxidation. *Control Strain: S. Typhimurium ATTC 14028.

64
Table 4.2. Serotyping and phage typing results of the strains isolated.
Strain Serotype O Antigen* H1 Antigen* H2 Antigen* Phage type**
DMC 1 S. Group C1 6,7 k -
DMC 2 S. Group C1 6,7 k -
DMC 3 S. Enteritidis 9,12 g,m - PT1
DMC 4 S. Typhimurium 1,4,[5],12 i 1,2 RDNC
DMC 5 S. Virchow 6,7 r 1,2
DMC 6 S. Virchow 6,7 r 1,2
DMC 7 S. Infantis 6,7 r 1,5
DMC 8 S. Enteritidis 9,12 g,m - PT6
DMC 9 S. Virchow 6,7 r 1,2
DMC 10 S. Virchow 6,7 r 1,2
DMC 11 S. Virchow 6,7 r 1,2
DMC 12 S. Infantis 6,7 r 1,5
DMC 13 S. subsp. I Roughform - - -
DMC 14 S. Enteritidis 9,12 g,m - PT6
DMC 15 S. Nchanga 3,10 l,v 1,2
DMC 16 S. Virchow 6,7 r 1,2
DMC 17 S. Virchow 6,7 r 1,2
DMC 18 S. Virchow 6,7 r 1,2
DMC 19 S. Virchow 6,7 r 1,2
DMC 20 S. Infantis 6,7 r 1,5
DMC 22 S. Enteritidis 9,12 g,m - PT21
DMC 23 S. Infantis 6,7 r 1,5
DMC 24 S. Enteritidis 9,12 g,m - PT21
DMC 25 S. Enteritidis 9,12 g,m - PT21
DMC 26 S. Enteritidis 9,12 g,m - PT21
DMC 27 S. Group C1 6,7 k -
DMC 28 S. Enteritidis 9,12 g,m - PT21
DMC 29 S. Enteritidis 9,12 g,m - PT21
DMC 30 S. Enteritidis 9,12 g,m - PT21
DMC 31 S. Enteritidis 9,12 g,m - PT21
DMC 32 S. Virchow 6,7 r 1,2
DMC 33 S. Virchow 6,7 r 1,2
DMC 34 S. Kentucky 8,20 i z6
DMC 35 S. Kentucky 8,20 i z6
DMC 36 S. Corvallis 8,20 z4,z23 -
DMC 37 S. Group C1 6,7 k -
DMC 38 S. Group C1 6,7 k -
DMC 39 S. Thompson 6,7 k 1,5

65
Table 4.2. Serotyping and phage typing results of the strains isolated (continued).
Strain Serotype O Antigen* H1 Antigen* H2 Antigen* Phage type**
DMC 40 S. Infantis 6,7 r 1,5
DMC 41 S. Infantis 6,7 r 1,5
DMC 42 S. Virchow 6,7 r 1,2
DMC 43 S. Enteritidis 9,12 g,m - PT3
DMC 44 S. Thompson 6,7 k 1,5
DMC 45 S. Thompson 6,7 k 1,5
DMC 46 S. Group C1 6,7 k -
DMC 47 S. Thompson 6,7 k 1,5
DMC 48 S. Thompson 6,7 k 1,5
DMC 49 S. Group C1 6,7 k -
DMC 50 S. Group C1 6,7 k -
DMC 51 S. Thompson 6,7 k 1,5
DMC 52a S. Kentucky 8,20 i z6
DMC 52b S. subsp. I Roughform - - -
DMC 53 S. Enteritidis 9,12 g,m - PT21
DMC 54 S. subsp. I Roughform - - -
DMC 55 S. Senftenberg 1,3,19 g,[s],t -
DMC 56 S. Kentucky 8,20 i z6
DMC 57 S. Infantis 6,7 r 1,5
DMC 58 S. Infantis 6,7 r 1,5
DMC 59 S. Agona 4,12 f,g,s -
DMC 60 S. Agona 4,12 f,g,s -
DMC 61 S. Agona 4,12 f,g,s -
DMC 62 S. Agona 4,12 f,g,s -
DMC 63 S. subsp. I Roughform - - -
DMC 64 S. Agona 4,12 f,g,s -
DMC 65 S. Kentucky 8,20 i z6
DMC 66 S. Telaviv 28 y e,n,z15
DMC 67 S. Telaviv 28 y e,n,z15
DMC 68 S. Virchow 6,7 r 1,2
DMC 69 S. Virchow 6,7 r 1,2
DMC 70 S. Infantis 6,7 r 1,5
DMC 71 S. Infantis 6,7 r 1,5
DMC 72 S. Kentucky 8,20 i z6
DMC 73 S. Kentucky 8,20 i z6
DMC 74 S. Kentucky 8,20 i z6
DMC 75 S. Infantis 6,7 r 1,5
DMC 76 S. Infantis 6,7 r 1,5
DMC 77 S. Infantis 6,7 r 1,5
DMC 78 S. Bispebjerg 4,[5[,12 a e,n,x

66
Table 4.2. Serotyping and phage typing results of the strains isolated (continued).
Strain Serotype O Antigen* H1 Antigen* H2 Antigen* Phage type**
DMC 79 S. Kentucky 8,20 i z6
DMC 80 S. Kentucky 8,20 i z6
DMC 81 S. Montevideo 6,7 g,m,[p],s [1,2,7]
DMC 82 S. Montevideo 6,7 g,m,[p],s [1,2,7]
DMC 83 S. Virchow 6,7 r 1,2
DMC 84 S. Virchow 6,7 r 1,2
DMC 85a S. Kentucky 8,20 i z6
DMC 85b S. subsp. I Roughform - - -
DMC 86 S. Corvallis 8,20 z4,z23 z6
DMC 87 S. Corvallis 8,20 z4,z23 z6
DMC 88 S. Montevideo 6,7 g,m,[p],s [1,2,7]
DMC 89 S. Montevideo 6,7 g,m,[p],s [1,2,7]
DMC 90 S. Anatum 3,10 e,h 1,6
DMC 91 S. Anatum 3,10 e,h 1,6
DMC 92 S. Anatum 3,10 e,h 1,6
DMC 93 S. Salford 16 l,v e,n,x
DMC 94 S. Enteritidis 9,12 g,m - PT21
DMC 95 S. Typhimurium 1,4,[5],12 i 1,2 RDNC
DMC 96 S. Enteritidis 9,12 g,m - PT21
DMC 97 S. subsp. I Roughform - - -
DMC 98 S. Enteritidis 9,12 g,m - PT21
DMC 99 S. Nchanga 3,10 l,v 1,2
DMC 100 S. Corvallis 8,20 z4,z23 -
*Antigens are numbered by following Kauffmann-White scheme. ** PT: Phage Type; RDNC: React but Does Not Conform.
4.1.3. Selected Strains from Germany
In addition to those isolated, 49 antibiotic resistant strains were added from Germany
(Table 4.3). These strains were selected from the culture collection of Salmonella
Reference Laboratories by considering the period of isolation (2005-2006), the
isolation material (food of avian origin) and the serotypes of the strains originated
from Türkiye. Serotyping and phage typing of the selected strains had been done
previously when they were added to the culture collection. The serotype distribution
was S. Agona, S. Enteritidis, S. Infantis (15 strains), S. Kentucky (2 strains), S. subsp.
I Roughform (2 strains), S. Thompson (2 strains), S. Typhimurium (25 strains), and
S. Virchow (2 strains). The most common phage type for S. Typhimurium strains
were DT104, whereas the only S. Enteritidis strain was PT4 phage type.

67
Table 4.3. Serotyping and phage typing results strains obtained from Germany.
Strain Serotype O Antigen* H1 Antigen* H2 Antigen* Phage type**
BFR1 S. Agona 4,12 f,g,s -
BFR2 S. Enteritidis 9,12 g,m - PT4
BFR3 S. Kentucky 8,20 i z6
BFR4 S. Kentucky 8,20 i z6
BFR5 S. subsp. I Roughform - - -
BFR6 S. subsp. I Roughform - - -
BFR7 S. Thompson 6,7 k 1,5
BFR8 S. Virchow 6,7 r 1,2
BFR9 S. Virchow 6,7 r 1,2
BFR10 S. Infantis 6,7 r 1,5
BFR11 S. Infantis 6,7 r 1,5
BFR12 S. Infantis 6,7 r 1,5
BFR13 S. Infantis 6,7 r 1,5
BFR14 S. Infantis 6,7 r 1,5
BFR15 S. Infantis 6,7 r 1,5
BFR16 S. Infantis 6,7 r 1,5
BFR17 S. Infantis 6,7 r 1,5
BFR18 S. Infantis 6,7 r 1,5
BFR19 S. Infantis 6,7 r 1,5
BFR20 S. Infantis 6,7 r 1,5
BFR21 S. Infantis 6,7 r 1,5
BFR22 S. Infantis 6,7 r 1,5
BFR23 S. Infantis 6,7 r 1,5
BFR24 S. Infantis 6,7 r 1,5
BFR25 S. Typhimurium 1,4,[5],12 i 1,2 DT104L
BFR26 S. Typhimurium 1,4,[5],12 i 1,2 NT
BFR27 S. Typhimurium 1,4,[5],12 i 1,2 DT104L
BFR28 S. Typhimurium 1,4,[5],12 i 1,2 U302
BFR29 S. Typhimurium 1,4,[5],12 i 1,2 DT104L
BFR30 S. Typhimurium 1,4,[5],12 i 1,2 DT104B low
BFR31 S. Typhimurium 1,4,[5],12 i 1,2 DT104L
BFR32 S. Typhimurium 1,4,[5],12 i 1,2 DT104L
BFR33 S. Typhimurium 1,4,[5],12 i 1,2 DT104B low
BFR34 S. Typhimurium 1,4,[5],12 i 1,2 DT120
BFR35 S. Typhimurium 1,4,[5],12 i 1,2 RDNC
BFR36 S. Typhimurium 1,4,[5],12 i 1,2 RDNC
BFR37 S. Typhimurium 1,4,[5],12 i 1,2 RDNC
BFR38 S. Typhimurium 1,4,[5],12 i 1,2 RDNC
BFR39 S. Typhimurium 1,4,[5],12 i 1,2 RDNC

68
Table 4.3. Serotyping and phage typing results strains obtained from Germany
(continued).
Strain Serotype O Antigen* H1 Antigen* H2 Antigen* Phage type**
BFR40 S. Typhimurium 1,4,[5],12 i 1,2 DT104B low
BFR41 S. Typhimurium 1,4,[5],12 i 1,2 DT104L
BFR42 S. Typhimurium 1,4,[5],12 i 1,2 DT104L
BFR43 S. Typhimurium 1,4,[5],12 i 1,2 DT104L
BFR44 S. Typhimurium 1,4,[5],12 i 1,2 DT104L
BFR45 S. Typhimurium 1,4,[5],12 i 1,2 DT104L
BFR46 S. Typhimurium 1,4,[5],12 i 1,2 RDNC
BFR47 S. Typhimurium 1,4,[5],12 i 1,2 DT104L
BFR48 S. Typhimurium 1,4,[5],12 i 1,2 DT104L
BFR49 S. Typhimurium 1,4,[5],12 i 1,2 DT104L *Antigens are numbered by following Kauffmann-White scheme. ** PT: Phage Type; DT : Definitive Type; RDNC: React but Does Not Conform.
4.2. Antibiotic Susceptibilities of the Strains
Antibiotic susceptibility results of the strains are given in Table 4.4 for disk diffusion
and in Table 4.5 for MIC values. The Turkish origin strains gave 39% resistance (23
out of 59 strains) for the tested antibiotics. The most prevalent resistance profile was
KAN-NEO-NAL-STR-SPE-SUL-TET-TMP-SXT (8 strains), which was obtained
only from S. Infantis strains. Other resistance profiles were AMP-EFT-NAL-STR-
SUL-TMP-SXT (DMC 19), NAL-STR-SPE-SUL-TET-TMP-SXT (DMC40), AMP-
SUL-TMP-SXT (DMC15), STR-SPE-SUL (DMC34), AMP- NAL (3 strain), NAL
(6 strain).
Among 19 strains resistant to NAL, 7 had reduced susceptibility to CIP (MIC value
of 0.5-1 µg/mL). Besides, 7 strains had intermediate STR resistance (16 µg/mL). The
antimicrobials CHL (≤ 2-8 µg/mL), FFC (≤ 2-8 µg/mL) and COL (≤ 4 µg/mL) were
found to be effective against Salmonella strains from Türkiye. On the other hand, the
highest resistance was obtained against NAL with MIC value of >128 µg/mL. This
corresponded to 82% of resistance strains and 32% of epidemiologically unrelated
strains.
69
Antibiotic resistance profiles among German strains were variable (Table 4.4). Out
of 49 strains, 12 exhibited NAL-TET-STR-SPE-SUL which were all S. Infantis
serotype. In addition, 6 strains had AMP-CHL-FFC-TET-STR-SPE-SUL; 5 strains
had AMP-TET-STR-SUL; 5 strains had AMP-CHL-FFC-NAL-TET-STR-SPE-SUL;
4 strains had AMP-SUL-TMP-SXT; 3 strains had AMP-SUL and 3 strains had only
NAL resistance phenotype. One strain exhibited resistance to extended spectrum
β-lactams (BFR3).
As shown in Table 4.5, reduced susceptibilty to CIP (0.5-1 µg/mL) was also found in
12 German strains. Intermediate resistance to AMC (16/8 µg/mL) in 19 strains and
CHL (16 µg/mL) in 5 strains were detected. The most effective antibiotic was COL
(≤ 4 µg/mL), where there was no resistance observed among German strains.
Subsequently, the least effective antibiotic was found as SUL (>512 µg/mL)
corresponding 91% of the German origin strains.

70
Table 4.4. Antibiotic susceptibilities of the strains by disk diffusion method.
Strain AMP AMC EFT CHL FFC KAN NEO GEN NAL CIP TET STR SPE SUL TMP SXT DMC1 S S S S S S S S S S S S S S S S DMC3 S S S S S S S S S S S S S S S S DMC4 S S S S S S S S S S S S S S S S DMC5 S S S S S S S S R S S I S S S S DMC7 S S S S S R R S R I R R R R R R DMC8 S S S S S S S S S S S S S S S S DMC9 R S S S S S S S R I S S S S S S DMC12 S S S S S R R S R S R R R R R R DMC13 S S S S S S S S S S S S S S S S DMC14 S S S S S S S S S S S S S S S S DMC15 R S S S S S S S S S S S S R R R DMC16 R S S S S S S S R I S S S S S S DMC18 S S S S S S S S R S S I S S S S DMC19 R I R S S S S S R S S R S R R R DMC20 S S S S S R R S R I R R R R R R DMC22 S S S S S S S S S S S S S S S S DMC23 S S S S S R R S R S R R R R R R DMC24 S S S S S S S S R S S S S S S S DMC25 S S S S S S S S S S S S S S S S DMC27 S S S S S S S S S S S S S S S S DMC28 S S S S S S S S S S S S S S S S DMC31 S S S S S S S S S S S S S S S S DMC32 S S S S S S S S R S S I S S S S DMC34 S S S S S S S S S S S R R R S S DMC36 S S S S S S S S S S S S S S S S DMC37 S S S S S S S S S S S S S S S S DMC39 S S S S S S S S S S S S S S S S DMC40 S S S S S S S S R I R R R R R R

71
Table 4.4. Antibiotic susceptibilities of the strains by disk diffusion method (continued).
Strain AMP AMC EFT CHL FFC KAN NEO GEN NAL CIP TET STR SPE SUL TMP SXT DMC42 S S S S S S S S R S S I S S S S DMC43 S S S S S S S S S S S S S S S S DMC44 S S S S S S S S S S S S S S S S DMC46 S S S S S S S S S S S S S S S S DMC49 S S S S S S S S S S S S S S S S DMC52a S S S S S S S S S S S S S S S S DMC52b S S S S S S S S S S S S S S S S DMC53 S S S S S S S S S S S S S S S S DMC55 S S S S S S S S S S S S S S S S DMC56 S S S S S S S S S S S S S S S S DMC57 S S S S S R R S R S R R R R R R DMC58 S S S S S R R S R S R R R R R R DMC59 S S S S S S S S S S S S S S S S DMC63 S S S S S S S S S S S S S S S S DMC65 S S S S S S S S S S S S S S S S DMC66 S S S S S S S S S S S S S S S S DMC68 R S S S S S S S R I S I S S S S DMC70 S S S S S R R S R I R R R R R R DMC72 S S S S S S S S S S S S S S S S DMC75 S S S S S R R S R S R R R R R R DMC78 S S S S S S S S S S S S S S S S DMC79 S S S S S S S S S S S S S S S S DMC81 S S S S S S S S S S S S S S S S DMC83 S S S S S S S S R S S S S S S S DMC85a S S S S S S S S S S S S S S S S DMC85b S S S S S S S S S S S S S S S S DMC86 S S S S S S S S S S S S S S S S DMC88 S S S S S S S S S S S S S S S S

72
Table 4.4. Antibiotic susceptibilities of the strains by disk diffusion method (continued).
Strain AMP AMC EFT CHL FFC KAN NEO GEN NAL CIP TET STR SPE SUL TMP SXT DMC90 S S S S S S S S S S S I S S S S DMC91 S S S S S S S S S S S I S S S S DMC93 S S S S S S S S S S S S S S S S BFR1 S S S S S S S S S I R S S R R R BFR2 R S S S S S S S R S R R R R R R BFR3 R R R S S S S S S S S R S R S S BFR4 R S S S S S S S S S R R R R R R BFR5 S S S S S S S S R S S S S R S S BFR6 R I S I S I S I R I R R R R S S BFR7 S S S S S R R S R I R S S S S S BFR8 S S S S S S S S R S S S S S S S BFR9 S S S S S S S S R S S S S S S S BFR10 S S S S S S S S R S R R R R S S BFR11 S S S S S S S S R I R R R R S S BFR12 S S S S S S S S R I R R R R S S BFR13 R S S S S S S S S S S S S R R R BFR14 S S S I S S S S R I R R R R S S BFR15 S S S I I S S S R I R R R R S S BFR16 R S S S S S S S S S S S S R R R BFR17 S S S S S S S S R S R R R R S S BFR18 S S S S S S S S R I R R R R S S BFR19 S S S S S S S S R I R R R R S S BFR20 S S S I S S S S R I R R R R S S BFR21 S S S S S S S S R S R R R R S S BFR22 S S S S S S S S R I R R R R S S BFR23 R S S S S S S S S S S I S R R R BFR24 S S S I S S S S R I R R R R S S BFR25 R I S S S S S S S S S S S R S S

73
Table 4.4. Antibiotic susceptibilities of the strains by disk diffusion method (continued).
Strain AMP AMC EFT CHL FFC KAN NEO GEN NAL CIP TET STR SPE SUL TMP SXT BFR26 R I S R R R R S R S R R R R S S BFR27 R I S R R S S S S S R R R R S S BFR28 R I S R R S S S R S R R R R S S BFR29 R I S S S S S S S S S S S R S S BFR30 R I S S S S S S S S R R S R S S BFR31 R I S R R S S S R S R R R R S S BFR32 R I S R R S S S R S R R R R S S BFR33 R I S R R S S S S S R R R R S S BFR34 R S S S S S S S S S R R S R S S BFR35 R S S S S S S S S S R R S R S S BFR36 R S S S S S S S S S R R S R S S BFR37 R S S S S S S S S S S S S R R R BFR38 R S S S S S S S S S R R S R S S BFR39 R S S S S S S S S S R R R R S S BFR40 R I S R R S S S S S R R R R S S BFR41 R I S R R R R S S S R R R R S S BFR42 R I S R R S S S S S R R R R S S BFR43 R I S R R S S S S S R R R R S S BFR44 R I S S S S S S S S R R S R S S BFR45 R I S R R S S S R S R R R R S S BFR46 R S S R R S S S S S R R S R S S BFR47 R I S R R S S S R S R R R R S S BFR48 R I S S S S S S S S S S S R S S BFR49 R I S R R S S S S S R R R R S S AMP: Ampicillin; AMC: Amoxicillin/clavulonic acid; CIP: Ciprofloxacin; CHL: Chloramphenicol; EFT: Ceftiofur; FFC: Florfenicol; GEN: Gentamicin; KAN: Kanamycin; NEO: Neomycin; NAL: Nalidixic acid; STR Streptomycin; SPE: Spectinomycin; SUL: Sulfonamide compounds; TET: Tetracycline; TMP: Trimethoprim; SXT: Sulfamethoxazole/Trimethoprim; S: Susceptible; I: Intermediate; R: Resistant.

74
Table 4.5. Antibiotic susceptibilities of the strains by MIC values (µg/mL).
Strain AMP AMC EFT CHL FFC KAN NEO GEN NAL CIP TET STR SPE SUL TMP SXT COL DMC5 S
(2) S
(≤2/1) S
(≤0.5) S
(8) S
(8) S
(≤4) S
(≤2) S
(≤1) R
(>128) S
(0.12) S
(≤2) I
(16) S
(32) S
(64) S
(≤4) S
(≤1/19) S
(≤4) DMC7 S
(≤1) S
(≤2/1) S
(≤0.5) S
(4) S
(4) R
(>64) R
(32) S
(≤1) R
(>128) I
(0.5) R
(>32) R
(32) R
(>128) R
(>512) R
(>32) R
(>8/152) S
(≤4) DMC9 R
(>32) S
(8/4) S
(≤0.5) S
(8) S
(4) S
(≤4) S
(≤2) S
(≤1) R
(>128) I
(1) S
(≤2) S
(8) S
(32) S
(≤32) S
(≤4) S
(≤1/19) S
(≤4) DMC12 S
(≤1) S
(≤2/1) S
(1) S
(4) S
(4) R
(>64) R
(>32) S
(≤1) R
(>128) S
(0.25) R
(>32) R
(32) R
(>128) R
(>512) R
(>32) R
(>8/152) S
(≤4) DMC15 R
(>32) S
(8/4) S
(≤0.5) S
(4) S
(4) S
(≤4) S
(≤2) S
(≤1) S
(≤4) S
(≤0.03) S
(≤2) S
(8) S
(32) R
(>512) R
(>32) R
(>8/152) S
(≤4) DMC16 R
(>32) S
(8/4) S
(1) S
(8) S
(4) S
(≤4) S
(≤2) S
(≤1) R
(128) I
(1) S
(≤2) S
(8) S
(32) S
(≤32) S
(≤4) S
(≤1/19) S
(≤4) DMC18 S
(2) S
(≤2/1) S
(≤0.5) S
(8) S
(8) S
(≤4) S
(≤2) S
(≤1) R
(128) S
(0.25) S
(≤2) I
(16) S
(32) S
(64) S
(≤4) S
(≤1/19) S
(≤4) DMC19 R
(>32) I
(16/8) R
(>8) S
(8) S
(8) S
(≤4) S
(≤2) S
(≤1) R
(128) S
(0.25) S
(≤2) R
(>64) S
(32) R
(>512) R
(>32) R
(>8/152) S
(≤4) DMC20 S
(2) S
(≤2/1) S
(1) S
(8) S
(8) R
(>64) R
(32) S
(≤1) R
(>128) I
(1) R
(>32) R
(32) R
(>128) R
(>512) R
(>32) R
(>8/152) S
(≤4) DMC23 S
(≤1) S
(≤2/1) S
(≤0.5) S
(8) S
(8) R
(>64) R
(>32) S
(≤1) R
(>128) S
(0.25) R
(>32) R
(32) R
(>128) R
(>512) R
(>32) R
(>8/152) S
(≤4) DMC24 S
(≤1) S
(≤2/1) S
(1) S
(8) S
(4) S
(≤4) S
(≤2) S
(≤1) R
(>128) S
(0.25) S
(≤2) S
(≤4) S
(16) S
(64) S
(≤4) S
(≤1/19) S
(≤4) DMC32 S
(≤1) S
(≤2/1) S
(≤0.5) S
(8) S
(4) S
(≤4) S
(≤2) S
(≤1) R
(>128) S
(0.25) S
(≤2) I
(16) S
(32) S
(64) S
(≤4) S
(≤1/19) S
(≤4) DMC34 S
(≤1) S
(≤2/1) S
(1) S
(4) S
(4) S
(≤4) S
(≤2) S
(≤1) S
(≤4) S
(0.12) S
(≤2) R
(32) R
(>128) R
(>512) S
(≤4) S
(≤1/19) S
(≤4) DMC40 S
(2) S
(≤2/1) S
(1) S
(8) S
(8) S
(≤4) S
(≤2) S
(≤1) R
(>128) I
(1) R
(>32) R
(32) R
(>128) R
(>512) R
(>32) R
(>8/152) S
(≤4) DMC42 S
(≤1) S
(≤2/1) S
(≤0.5) S
(8) S
(4) S
(≤4) S
(≤2) S
(≤1) R
(>128) S
(0.25) S
(≤2) I
(16) S
(32) S
(64) S
(≤4) S
(≤1/19) S
(≤4)

75
Table 4.5. Antibiotic susceptibilities of the strains by MIC values (µg/mL) (continued).
Strain AMP AMC EFT CHL FFC KAN NEO GEN NAL CIP TET STR SPE SUL TMP SXT COL DMC57 S
(≤1) S
(≤2/1) S
(≤0.5) S
(8) S
(4) R
(>64) R
(>32) S
(≤1) R
(>128) S
(0.25) R
(>32) R
(64) R
(>128) R
(>512) R
(>32) R
(>8/152) S
(≤4) DMC58 S
(≤1) S
(≤2/1) S
(≤0.5) S
(≤2) S
(≤2) R
(>64) R
(>32) S
(≤1) R
(>128) S
(0.25) R
(>32) R
(32) R
(>128) R
(>512) R
(>32) R
(>8/152) S
(≤4) DMC68 R
(>32) S
(8/4) S
(≤0.5) S
(8) S
(4) S
(≤4) S
(≤2) S
(≤1) R
(>128) I
(1) S
(≤2) I
(16) S
(64) S
(64) S
(≤4) S
(≤1/19) S
(≤4) DMC70 S
(2) S
(≤2/1) S
(1) S
(8) S
(4) R
(>64) R
(>32) S
(≤1) R
(>128) I
(0.5) R
(>32) R
(32) R
(>128) R
(>512) R
(>32) R
(>8/152) S
(≤4) DMC75 S
(≤1) S
(≤2/1) S
(≤0.5) S
(8) S
(4) R
(>64) R
(>32) S
(≤1) R
(>128) S
(0.25) R
(>32) R
(64) R
(>128) R
(>512) R
(>32) R
(>8/152) S
(≤4) DMC83 S
(≤1) S
(≤2/1) S
(1) S
(8) S
(8) S
(≤4) S
(≤2) S
(≤1) R
(>128) S
(0.25) S
(≤2) S
(8) S
(32) S
(≤32) S
(≤4) S
(≤1/19) S
(≤4) DMC90 S
(≤1) S
(≤2/1) S
(≤0.5) S
(4) S
(4) S
(≤4) S
(≤2) S
(≤1) S
(≤4) S
(≤0.03) S
(≤2) I
(16) S
(32) S
(≤32) S
(≤4) S
(≤1/19) S
(≤4) DMC91 S
(≤1) S
(≤2/1) S
(≤0.5) S
(8) S
(4) S
(≤4) S
(≤2) S
(≤1) S
(≤4) S
(≤0.03) S
(≤2) I
(16) S
(64) S
(≤32) S
(≤4) S
(≤1/19) S
(≤4)
BFR1 S
(≤1) S
(≤2/1) S
(1) S
(8) S
(8) S
(≤4) S
(≤2) S
(≤1) S
(16) I
(0.5) R
(>32) S
(8) S
(32) R
(>512) R
(>32) R
(>8/152) S
(≤4)
BFR2 R
(>32) S
(8/4) S
(1) S
(4) S
(4) S
(≤4) S
(≤2) S
(≤1) R
(>128) S
(0.25) R
(>32) R
(>64) R
(>128) R
(>512) R
(>32) R
(>8/152) S
(≤4)
BFR3 R
(>32) R
(32/16) R
(>8) S
(≤2) S
(≤2) S
(≤4) S
(≤2) S
(≤1) S
(≤4) S
(≤0.03) S
(≤2) R
(64) S
(32) R
(128) S
(≤4) S
(≤1/19) S
(≤4)
BFR4 R
(>32) S
(8/4) S
(≤0.5) S
(4) S
(≤2) S
(≤4) S
(≤2) S
(≤1) S
(≤4) S
(≤0.03) R
(>32) R
(64) R
(>128) R
(>512) R
(>32) R
(>8/152) S
(≤4)
BFR5 S
(≤1) S
(≤2/1) S
(≤0.5) S
(4) S
(4) S
(≤4) S
(≤2) S
(≤1) R
(>128) S
(0.25) S
(≤2) S
(≤4) S
(16) R
(64) S
(≤4) S
(≤1/19) S
(≤4)
BFR6 R
(>32) I
(16/8) S
(2) I
(16) S
(8) I
(32) S
(≤2) I
(8) R
(>128) I
(1) R
(>32) R
(64) R
(>128) R
(>512) S
(≤4) S
(≤1/19) S
(≤4)
BFR7 S
(≤1) S
(≤2/1) S
(≤0.5) S
(8) S
(4) R
(>64) R
(>32) S
(≤1) R
(>128) I
(0.5) R
(>32) S
(8) S
(64) S
(64) S
(≤4) S
(≤1/19) S
(≤4)

76
Table 4.5. Antibiotic susceptibilities of the strains by MIC values (µg/mL) (continued).
Strain AMP AMC EFT CHL FFC KAN NEO GEN NAL CIP TET STR SPE SUL TMP SXT COL
BFR8 S
(≤1) S
(≤2/1) S
(≤0.5) S
(4) S
(4) S
(≤4) S
(≤2) S
(≤1) R
(>128) S
(0.25) S
(≤2) S
(≤4) S
(32) S
(64) S
(≤4) S
(≤1/19) S
(≤4)
BFR9 S
(≤1) S
(≤2/1) S
(1) S
(8) S
(8) S
(≤4) S
(≤2) S
(≤1) R
(>128) S
(0.25) S
(≤2) S
(8) S
(32) S
(64) S
(≤4) S
(≤1/19) S
(≤4)
BFR10 S
(≤1) S
(≤2/1) S
(≤0.5) S
(≤2) S
(4) S
(≤4) S
(≤2) S
(≤1) R
(>128) S
(0.25) R
(>32) R
(32) R
(>128) R
(>512) S
(≤4) S
(≤1/19) S
(≤4)
BFR11 S
(≤1) S
(≤2/1) S
(≤0.5) S
(8) S
(4) S
(≤4) S
(≤2) S
(≤1) R
(>128) I
(0.5) R
(>32) R
(32) R
(>128) R
(>512) S
(≤4) S
(≤1/19) S
(≤4)
BFR12 S
(≤1) S
(≤2/1) S
(≤0.5) S
(8) S
(4) S
(≤4) S
(≤2) S
(≤1) R
(>128) I
(0.5) R
(>32) R
(64) R
(>128) R
(>512) S
(≤4) S
(≤1/19) S
(≤4)
BFR13 R
(>32) S
(8/4) S
(≤0.5) S
(8) S
(4) S
(≤4) S
(≤2) S
(≤1) S
(≤4) S
(≤0.03) S(≤2)
S (8)
S (64)
R (>512)
R (>32)
R (>8/152)
S (≤4)
BFR14 S
(2) S
(≤2/1) S
(2) I
(16) S
(8) S
(≤4) S
(≤2) S
(≤1) R
(>128) I
(1) R
(>32) R
(32) R
(>128) R
(>512) S
(≤4) S
(≤1/19) S
(≤4)
BFR15 S
(2) S
(≤2/1) S
(1) I
(16) I
(16) S
(≤4) S
(≤2) S
(≤1) R
(>128) I
(1) R
(>32) R
(32) R
(>128) R
(>512) S
(≤4) S
(≤1/19) S
(≤4)
BFR16 R
(>32) S
(4/2) S
(≤0.5) S
(4) S
(4) S
(≤4) S
(≤2) S
(≤1) S
(≤4) S
(≤0.03) S
(≤2) S
(8) S
(32) R
(>512) R
(>32) R
(>8/152) S
(≤4)
BFR17 S
(≤1) S
(≤2/1) S
(1) S
(8) S
(8) S
(≤4) S
(≤2) S
(≤1) R
(>128) S
(0.25) R
(>32) R
(32) R
(>128) R
(>512) S
(≤4) S
(≤1/19) S
(≤4)
BFR18 S
(≤1) S
(≤2/1) S
(1) S
(8) S
(4) S
(≤4) S
(≤2) S
(≤1) R
(>128) I
(0.5) R
(>32) R
(32) R
(>128) R
(>512) S
(≤4) S
(≤1/19) S
(≤4)
BFR19 S
(≤1) S
(≤2/1) S
(≤0.5) S
(8) S
(4) S
(≤4) S
(≤2) S
(≤1) R
(>128) I
(0.5) R
(>32) R
(32) R
(>128) R
(>512) S
(≤4) S
(≤1/19) S
(≤4)
BFR20 S
(2) S
(≤2/1) S
(1) I
(16) S
(8) S
(≤4) S
(≤2) S
(≤1) R
(>128) I
(1) R
(>32) R
(32) R
(>128) R
(>512) S
(≤4) S
(≤1/19) S
(≤4)
BFR21 S
(≤1) S
(≤2/1) S
(1) S
(4) S
(4) S
(≤4) S
(≤2) S
(≤1) R
(>128) S
(0.25) R
(>32) R
(32) R
(>128) R
(>512) S
(≤4) S
(≤1/19) S
(≤4)
BFR22 S
(≤1) S
(≤2/1) S
(1) S
(4) S
(4) S
(≤4) S
(≤2) S
(≤1) R
(>128) I
(0.5) R
(>32) R
(>64) R
(>128) R
(>512) S
(≤4) S
(≤1/19) S
(≤4)

77
Table 4.5. Antibiotic susceptibilities of the strains by MIC values (µg/mL) (continued).
Strain AMP AMC EFT CHL FFC KAN NEO GEN NAL CIP TET STR SPE SUL TMP SXT COL
BFR23 R
(>32) S
(8/4) S
(1) S
(4) S
(4) S
(≤4) S
(≤2) S
(≤1) S
(≤4) S
(≤0.03) S
(≤2) I
(16) S
(32) R
(>512) R
(>32) R
(>8/152) S
(≤4)
BFR24 S
(≤1) S
(≤2/1) S
(2) I
(16) S
(8) S
(≤4) S
(≤2) S
(≤1) R
(>128) I
(0.5) R
(>32) R
(32) R
(>128) R
(>512) S
(≤4) S
(≤1/19) S
(≤4)
BFR25 R
(>32) I
(16/8) S
(1) S
(4) S
(4) S
(≤4) S
(≤2) S
(≤1) S
(≤4) S
(≤0.03) S
(≤2) S
(8) S
(32) R
(>512) S
(≤4) S
(≤1/19) S
(≤4)
BFR26 R
(>32) I
(16/8) S
(≤0.5) R
(>64) R
(>32) R
(>64) R
(>32) S
(≤1) R
(>128) S
(0.25) R
(32) R
(>64) R
(>128) R
(>512) S
(≤4) S
(≤1/19) S
(≤4)
BFR27 R
(>32) I
(16/8) S
(1) R
(>64) R
(64) S
(≤4) S
(≤2) S
(≤1) S
(≤4) S
(≤0.03) R
(32) R
(>64) R
(>128) R
(>512) S
(≤4) S
(≤1/19) S
(≤4)
BFR28 R
(>32) I
(16/8) S
(1) R
(>64) R
(64) S
(≤4) S
(≤2) S
(≤1) R
(>128) S
(0.25) R
(32) R
(64) R
(>128) R
(>512) S
(≤4) S
(≤1/19) S
(≤4)
BFR29 R
(>32) I
(16/8) S
(≤0.5) S
(8) S
(4) S
(≤4) S
(≤2) S
(≤1) S
(≤4) S
(≤0.03) S
(≤2) S
(8) S
(32) R
(>512) S
(≤4) S
(≤1/19) S
(≤4)
BFR30 R
(>32) I
(16/8) S
(≤0.5) S
(8) S
(4) S
(≤4) S
(≤2) S
(≤1) S
(≤4) S
(≤0.03) R
(>32) R
(>64) S
(32) R
(>512) S
(≤4) S
(≤1/19) S
(≤4)
BFR31 R
(>32) I
(16/8) S
(1) R
(>64) R
(>64) S
(≤4) S
(4) S
(≤1) R
(>128) S
(0.25) R
(>32) R
(>64) R
(>128) R
(>512) S
(≤4) S
(≤1/19) S
(≤4)
BFR32 R
(>32) I
(16/8) S
(≤0.5) R
(>64) R
(64) S
(≤4) S
(≤2) S
(≤1) R
(>128) S
(0.25) R
(32) R
(64) R
(>128) R
(>512) S
(≤4) S
(≤1/19) S
(≤4)
BFR33 R
(>32) I
(16/8) S
(1) R
(>64) R
(64) S
(≤4) S
(≤2) S
(≤1) S
(≤4) S
(≤0.03) R
(32) R
(64) R
(>128) R
(>512) S
(≤4) S
(≤1/19) S
(≤4)
BFR34 R
(>32) S
(8/4) S
(≤0.5) S
(8) S
(4) S
(≤4) S
(≤2) S
(≤1) S
(≤4) S
(≤0.03) R
(>32) R
(>64) S
(32) R
(>512) S
(≤4) S
(≤1/19) S
(≤4)
BFR35 R
(>32) S
(8/4) S
(≤0.5) S
(8) S
(4) S
(≤4) S
(≤2) S
(≤1) S
(8) S
(≤0.03) R
(>32) R
(>64) S
(32) R
(>512) S
(≤4) S
(≤1/19) S
(≤4)
BFR36 R
(>32) S
(4/2) S
(1) S
(8) S
(4) S
(≤4) S
(≤2) S
(≤1) S
(≤4) S
(≤0.03) R
(>32) R
(>64) S
(32) R
(>512) S
(≤4) S
(≤1/19) S
(≤4)
BFR37 R
(>32) S
(8/4) S
(≤0.5) S
(8) S
(4) S
(≤4) S
(≤2) S
(≤1) S
(≤4) S
(≤0.03) S
(≤2) S
(8) S
(32) R
(>512) R
(>32) R
(>8/152) S
(≤4)

78
Table 4.5. Antibiotic susceptibilities of the strains by MIC values (µg/mL) (continued).
Strain AMP AMC EFT CHL FFC KAN NEO GEN NAL CIP TET STR SPE SUL TMP SXT COL
BFR38 R
(>32) S
(8/4) S
(1) S
(8) S
(4) S
(≤4) S
(≤2) S
(≤1) S
(≤4) S
(≤0.03) R
(>32) R
(>64) S
(32) R
(>512) S
(≤4) S
(≤1/19) S
(≤4)
BFR39 R
(>32) S
(8/4) S
(≤0.5) S
(8) S
(4) S
(≤4) S
(≤2) S
(≤1) S
(≤4) S
(≤0.03) R
(>32) R
(>64) R
(>128) R
(>512) S
(≤4) S
(≤1/19) S
(≤4)
BFR40 R
(>32) I
(16/8) S
(≤0.5) R
(>64) R
(64) S
(≤4) S
(≤2) S
(≤1) S
(≤4) S
(≤0.03) R
(32) R
(64) R
(>128) R
(>512) S
(≤4) S
(≤1/19) S
(≤4)
BFR41 R
(>32) I
(16/8) S
(1) R
(>64) R
(64) R
(>64) R
(>32) S
(≤1) S
(≤4) S
(≤0.03) R
(32) R
(64) R
(>128) R
(>512) S
(≤4) S
(≤1/19) S
(≤4)
BFR42 R
(>32) I
(16/8) S
(≤0.5) R
(>64) R
(64) S
(≤4) S
(≤2) S
(≤1) S
(≤4) S
(≤0.03) R
(>32) R
(64) R
(>128) R
(>512) S
(≤4) S
(≤1/19) S
(≤4)
BFR43 R
(>32) I
(16/8) S
(≤0.5) R
(>64) R
(64) S
(≤4) S
(≤2) S
(≤1) S
(≤4) S
(≤0.03) R
(>32) R
(64) R
(>128) R
(>512) S
(≤4) S
(≤1/19) S
(≤4)
BFR44 R
(>32) I
(16/8) S
(1) S
(8) S
(4) S
(≤4) S
(≤2) S
(≤1) S
(≤4) S
(≤0.03) R
(>32) R
(>64) S
(32) R
(64) S
(≤4) S
(≤1/19) S
(≤4)
BFR45 R
(>32) I
(16/8) S
(≤0.5) R
(>64) R
(64) S
(≤4) S
(≤2) S
(≤1) R
(>128) S
(0.25) R
(32) R
(64) R
(>128) R
(>512) S
(≤4) S
(≤1/19) S
(≤4)
BFR46 R
(>32) S
(8/4) S
(1) R
(>64) R
(>64) S
(≤4) S
(≤2) S
(≤1) S
(≤4) S
(≤0.03) R
(>32) R
(>64) S
(64) R
(>512) S
(≤4) S
(≤1/19) S
(≤4)
BFR47 R
(>32) I
(16/8) S
(1) R
(>64) R
(64) S
(≤4) S
(≤2) S
(≤1) R
(>128) S
(0.25) R
(32) R
(64) R
(>128) R
(>512) S
(≤4) S
(≤1/19) S
(≤4)
BFR48 R
(>32) I
(16/8) S
(1) S
(8) S
(4) S
(≤4) S
(≤2) S
(≤1) S
(≤4) S
(≤0.03) S
(≤2) S
(8) S
(64) R
(>512) S
(≤4) S
(≤1/19) S
(≤4)
BFR49 R
(>32) I
(16/8) S
(1) R
(>64) R
(64) S
(≤4) S
(≤2) S
(≤1) S
(≤4) S
(≤0.03) R
(32) R
(64) R
(>128) R
(>512) S
(≤4) S
(≤1/19) S
(≤4) ATTC 200406*
S (2)
S (≤2/1)
S (≤0.5)
S (4)
S (4)
S (≤4)
S (≤2)
S (≤1)
S (≤4)
S (≤0.03)
S (≤2)
S (≤4)
S (16)
S (≤32)
S (≤4)
S (≤1/19)
S (≤4)
* ATTC 200406: Control E. coli strain. AMP: Ampicillin; AMC: Amoxicillin/clavulonic acid; CIP: Ciprofloxacin; CHL: Chloramphenicol; EFT: Ceftiofur; FFC: Florfenicol; GEN: Gentamicin; KAN: Kanamycin; NEO: Neomycin; NAL: Nalidixic acid; STR Streptomycin; SPE: Spectinomycin; SUL: Sulfonamide compounds; TET: Tetracycline; TMP: Trimethoprim; SXT: Sulfamethoxazole/Trimethoprim; S: Susceptible; I: Intermediate; R: Resistant.

79
4.3. Molecular Typing of the Strains
4.3.1. Plasmid Profiles
The plasmid profiles for the strains are given in Figure 4.1-4.7. The molecular typing
of the strains by plasmid profiling revealed that 36 Turkish origin and 45 German
origin strains had plasmid content out of 108 strains studied. There were
1-4 plasmids/profile ranging in size <5-206 kb for Turkish strains and
1-7 plasmids/profile with <5-238 kb size for German strains. Plasmid contents were
variable not only between serotypes but also some strains of the same serotypes. The
distribution of different plasmid profiles of the serotypes was S. Montevideo (2), S.
subsp. I Roughform (3), S. Virchow (4), and S. Enteritidis (5) for Turkish origin
strains; whereas S. Kentucky (2), S. Infantis (2), and S. Typhimurium (13) for
German origin strains. On the other hand, the strains DMC 1, DMC27, DMC37,
DMC46, DMC49 DMC88, DMC39, DMC44, DMC85a, DMC85b, DMC18,
DMC83, DMC36, DMC86, DMC34, DMC52, DMC56, DMC65, DMC72, DMC79,
DMC90, DMC92, DMC66, BFR8, BFR9, BFR29, and BFR 46 did not possess any
plasmid.
S. Infantis strains of Turkish origin did not differ in plasmid content having the
~206 kb size plasmid. S. Virchow strains had the ~45 kb plasmid in common. The
S. Infantis strains of German origin were divided into two groups one having ~238
kb plasmid and the other having ~108,6 kb plasmid. Besides, almost all the
S. Typhimurium strains had the big plasmid varying in size between ~85-112 kb
which is suspected to be previously described virulence plasmid psLT90.

80
Figure 4.1. Plasmid profiles of Turkish origin S. Montevideo, S. Thompson and
S. subsp. I Roughform strains.
Lane Strain Serotype Plasmid(s) in kb
1 Marker - 169; 93,93; 54,54; 6,36
2 DMC81 S. Montevideo 116,5; 54,03; 50,95
3 DMC88 S. Montevideo -
4 DMC39 S. Thompson -
5 DMC44 S. Thompson -
6 DMC52b S. subsp. I Roughform 51,98; <5
7 DMC13 S. subsp. I Roughform 51,98; <5
8 DMC63 S. subsp. I Roughform <5
9 DMC85b S. subsp. I Roughform -
10 (+) control S. Typhimurium 86
1 2 3 4 5 6 7 8 9 10 169 kb→
93,93 kb→54,54 kb→
chromosomal DNA→
6,36 kb→

81
Figure 4.2. Plasmid profiles of Turkish origin S. Virchow strains.
Lane Strain Serotype Plasmid(s) in kb
1 Marker - 169; 93,93; 54,54; 6,36
2 (+)control S. Typhimurium 86
3 DMC5 S. Virchow 5,5; <5 (3 small ones)
4 DMC9 S. Virchow 50,3
5 DMC16 S. Virchow 50,3; <5 (3 small ones)
6 DMC18 S. Virchow -
7 DMC19 S. Virchow 50,3
8 DMC32 S. Virchow 5,5; <5 (2 small ones)
9 DMC42 S. Virchow 5,5; <5
10 DMC68 S. Virchow 50,3
11 DMC83 S. Virchow -
12 Marker - 169; 93,93; 54,54; 6,36
1 2 3 4 5 6 7 8 9 10 11 12
169 kb→93,93 kb→54,54 kb→
chromosomal DNA→
6,36 kb→
RNA→

82
Figure 4.3. Plasmid profiles of Turkish origin S. Enteritidis strains.
Lane Strain Serotype Plasmid(s) in kb
1 DMC3 S. Enteritidis 57,57; <5
2 DMC8 S. Enteritidis 57,57; 48,66; <5
3 DMC14 S. Enteritidis 57,57; <5
4 DMC21 S. Enteritidis <5
5 DMC22 S. Enteritidis 57,57; <5
6 Marker - 169; 93,93; 54,54; 6,36
7 DMC24 S. Enteritidis 57,57; <5
8 DMC28 S. Enteritidis 57,57; <5
9 DMC30 S. Enteritidis 57,57; <5 (2 small ones)
10 DMC43 S. Enteritidis 57,57; <5 (2 small ones)
11 DMC53 S. Enteritidis 57,57
1 2 3 4 5 6 7 8 9 10 11
169 kb→93,93 kb→54,54 kb→
chrımosomalDNA→
6,36 kb→

83
Figure 4.4. Plasmid profiles of Turkish origin S. Infantis strains.
Lane Strain Serotype Plasmid(s) in kb
1 DMC7 S. Infantis 206,5
2 DMC12 S. Infantis 206,5
3 DMC20 S. Infantis 206,5
4 Marker - 169; 93,93; 54,54; 6,36
5 DMC23 S. Infantis 206,5
6 DMC40 S. Infantis 206,5
7 DMC57 S. Infantis 206,5
8 DMC58 S. Infantis 206,5
9 DMC70 S. Infantis 206,5
10 DMC75 S. Infantis 206,5
1 2 3 4 5 6 7 8 9 10
169 kb→93,93 kb→54,54 kb→
chromosomalDNA→
6,36 kb→

84
Figure 4.5. Plasmid profiles of German origin S. Agona, S. subsp. I Rough form,
S. Kentucky, S. Thompson, S.Virchow and S. Enteritidis strains.
Lane Strain Serotype Plasmid(s) in kb
1 BFR1 S. Agona 46,66; 7,41; 2,70; 0,95
2 BFR5 S. subsp. I Roughform 56,87
3 BFR4 S. Kentucky 143,99; 114,24; 51,52
4 BFR7 S. Thompson 35,22
5 BFR3 S. Kentucky 220,72; 104,52; 49,59
6 Marker - 169; 93,93; 54,54; 6,36
7 BFR8 S. Virchow -
8 BFR6 S. subsp. I Roughform 116,30; 59,30
9 BFR2 S. Enteritidis 110; 54,54
10 BFR9 S. Virchow -
1 2 3 4 5 6 7 8 9 10 169 kb→
93,93 kb→54,54 kb→
kromozomal DNA→
6,36 kb→
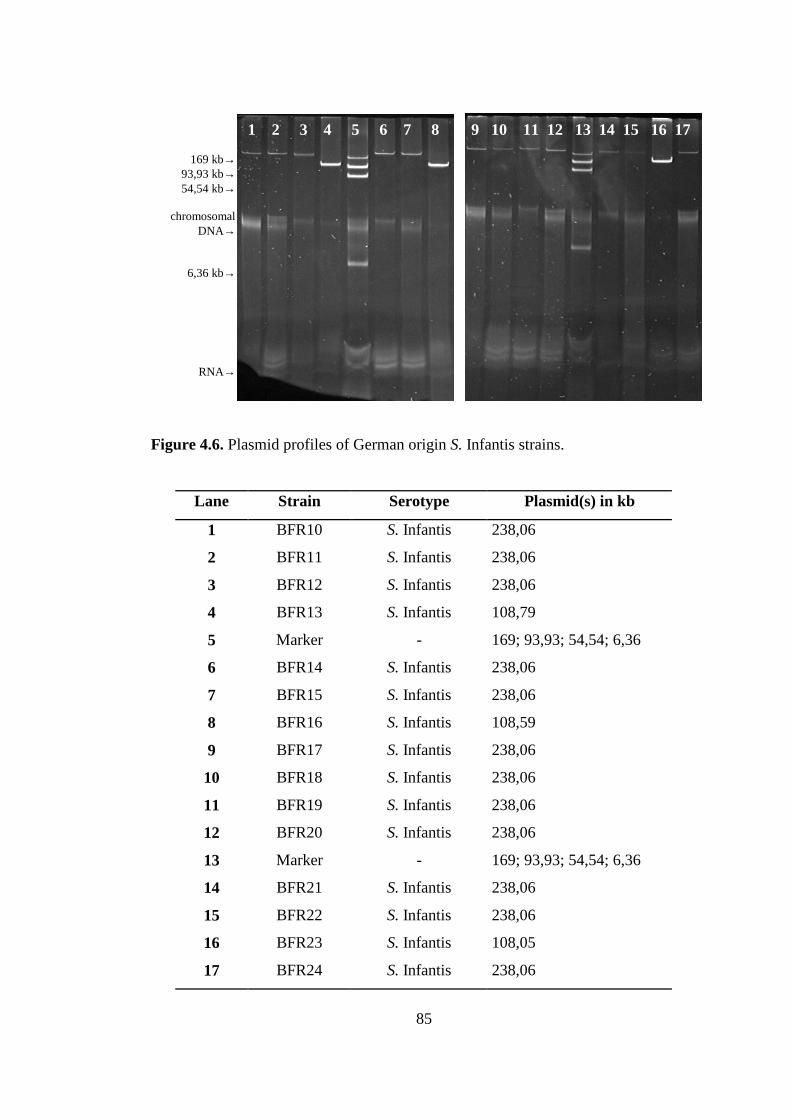
85
Figure 4.6. Plasmid profiles of German origin S. Infantis strains.
Lane Strain Serotype Plasmid(s) in kb
1 BFR10 S. Infantis 238,06
2 BFR11 S. Infantis 238,06
3 BFR12 S. Infantis 238,06
4 BFR13 S. Infantis 108,79
5 Marker - 169; 93,93; 54,54; 6,36
6 BFR14 S. Infantis 238,06
7 BFR15 S. Infantis 238,06
8 BFR16 S. Infantis 108,59
9 BFR17 S. Infantis 238,06
10 BFR18 S. Infantis 238,06
11 BFR19 S. Infantis 238,06
12 BFR20 S. Infantis 238,06
13 Marker - 169; 93,93; 54,54; 6,36
14 BFR21 S. Infantis 238,06
15 BFR22 S. Infantis 238,06
16 BFR23 S. Infantis 108,05
17 BFR24 S. Infantis 238,06
1 2 3 4 5 6 7 8 9 10 11 12 13 14 15 16 17
169 kb→93,93 kb→54,54 kb→
chromosomalDNA→
6,36 kb→
RNA→

86
Figure 4.7. Plasmid profiles of German origin S. Typhimurium strains.
Lane Strain Serotype Plasmid(s) in kb
1 BFR25 S. Typhimurium 99,08; 1,94
2 BFR26 S. Typhimurium 99,08; 3,44; 2,64; 1,94
3 BFR27 S. Typhimurium 99,08; 2,64; 1,94
4 BFR28 S. Typhimurium 99,08; 43,55; 2,64; 1,94
5 Marker - 169; 93,93; 54,54; 6,36
6 BFR29 S. Typhimurium -
7 BFR30 S. Typhimurium 99,08; 3,44
8 BFR31 S. Typhimurium 99,08; 3,44; 1,94
9 BFR32 S. Typhimurium 99,08
1 2 3 4 5 6 7 8 9 169 kb→
93,93 kb→54,54 kb→
chromosomall DNA→
6,36 kb→
RNA→

87
Figure 4.7. Plasmid profiles of German origin S. Typhimurium strains (continued).
Lane Strain Serotype Plasmid(s) in kb
1 BFR33 S. Typhimurium 118,81; 53,24
2 BFR34 S. Typhimurium 3,92; 1,26
3 BFR35 S. Typhimurium 3,92; 1.26
4 BFR36 S. Typhimurium 5,12
5 Marker - 169; 93,93; 54,54; 6,36
6 BFR37 S. Typhimurium 99,08; 42,84; 38,90; 4,12; 2,36; 0,88; 0,61
7 BFR38 S. Typhimurium 11,92; 3,83; 2,60; 0,84
8 BFR39 S. Typhimurium 99,08
9 BFR40 S. Typhimurium 112,03; 80,99; 6,06; 1,07
1 2 3 4 5 6 7 8 9 169 kb→
93,93 kb→54,54 kb→
chromosomal DNA→
6,36 kb→
RNA→
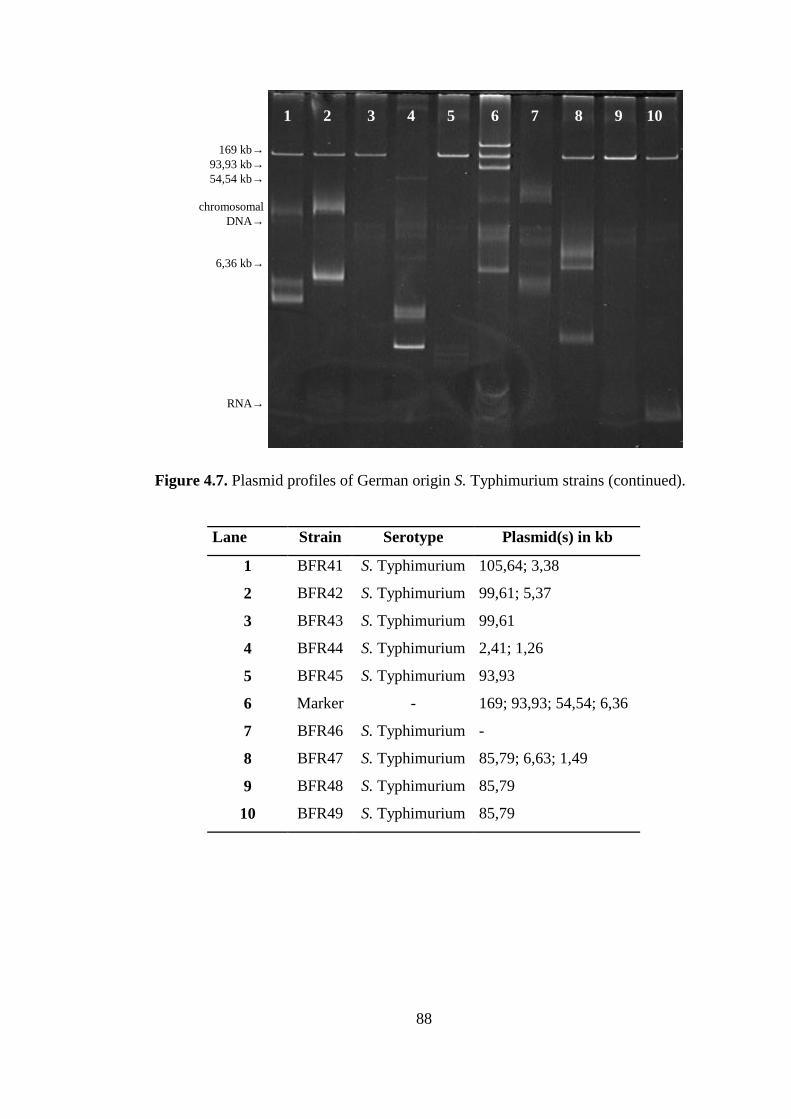
88
Figure 4.7. Plasmid profiles of German origin S. Typhimurium strains (continued).
Lane Strain Serotype Plasmid(s) in kb
1 BFR41 S. Typhimurium 105,64; 3,38
2 BFR42 S. Typhimurium 99,61; 5,37
3 BFR43 S. Typhimurium 99,61
4 BFR44 S. Typhimurium 2,41; 1,26
5 BFR45 S. Typhimurium 93,93
6 Marker - 169; 93,93; 54,54; 6,36
7 BFR46 S. Typhimurium -
8 BFR47 S. Typhimurium 85,79; 6,63; 1,49
9 BFR48 S. Typhimurium 85,79
10 BFR49 S. Typhimurium 85,79
1 2 3 4 5 6 7 8 9 10
169 kb→93,93 kb→54,54 kb→
chromosomalDNA→
6,36 kb→
RNA→

89
4.3.2. PFGE Profiles
108 strains were analysed for their PFGE profiles. The profiles obtained were
compared and they were grouped according to the difference between the profiles
where any band difference in the pattern was considered as one profile (Table 4.6).
There were 42 groups obtained and each group had given a profile name. According
to this groups, the serotypes having different profiles were S. Montevideo (2); S.
Virchow (4); S. Infantis (4); S. Enteritidis (3); S. Kentucky (5l); S. Thompson (2); S.
Typhimurium (11). The highest profile variabilities obtained among the serotypes
were 55% for S. Kentucky and 42% for S. Typhimurium. Within these groups, the
most common profiles among serotypes were V-X1 and V-X2, I-X3, K-X1, E-X1,
Ty-X1, and Th-X1.
The strains DMC13, DMC52 and DMC63 were considered as rough strains of S.
subsp. I, and exhibited 100% same PFGE profiles with S. Enteritidis serotype. Thus,
these strains were confirmed by phage typing analyses and shown susceptibility
pattern with S. Enteritidis typing phages revealing PT35 phage type. S. Group C1
serotyped strains DMC1, DMC27, DMC37, and DMC46 were exhibited one of the
characteristic PFGE pattern (TH-X1) obtained from S. Thompson strains. DMC85b,
which was serotyped as S. subsp. I Roughform also exhibited the same pattern as
one of the S. Kentucky PFGE profile (K-X1). All these strains were serotyped once
more to rule out the experimental error.

90
Table 4.6. PFGE profile groups of the strains.
Serotype Profile Name Strain
S. Virchow V-X1 DMC9, DMC16, DMC18, DMC68
V-X2 DMC19, DMC32, DMC42, DMC83
V-X3 DMC5
V-X4 BFR8, BFR9
S. Infantis I-X1 DMC20, DMC23, DMC40, DMC57, DMC58, DMC70
I-X2 DMC7, DMC12, DMC75
I-X3 BFR10, BFR11, BFR12, BFR14, BFR15, BFR16, BFR17, BFR18, BFR19, BFR20, BFR21, BFR22, BFR24
I-X4 BFR13, BFR23
S. Kentucky K-X1 DMC52a, DMC56, DMC65, DMC72, DMC85a
K-X2 DMC79
K-X3 DMC34
K-X4 BFR3
K-X5 BFR4
S. Enteritidis E-X1 DMC3, DMC22, DMC24, DMC25, DMC31, DMC43, DMC 53
E-X2 DMC8, DMC14, BFR2
E-X3 DMC 28
S. Thompson Th-X1 DMC39, DMC44
Th-X2 BFR7
S. Typhimurium Ty-X1 BFR25, BFR27, BFR31, BFR32, BFR40, BFR41, BFR42, BFR43, BFR45, BFR47, BFR48, BFR49
Ty-X2 BFR26
Ty-X3 BFR46
Ty-X4 BFR34, BFR35, BFR36, BFR38, BFR39
Ty-X5 BFR44
Ty-X6 BFR28
Ty-X7 BFR29
Ty-X8 BFR33
Ty-X9 BFR30
Ty-X10 BFR37
Ty-X11 DMC4
S. Group C1 Th-X1 DMC1, DMC27, DMC37, DMC46
GC-X1 DMC49

91
Table 4.6. PFGE profile groups of the strains (continued).
Serotype Profile Name Strain
S. subsp. I Roughform E-X1 DMC13
E-X2 DMC52B, BFR5
E-X3 DMC63
K-X1 DMC85b
R-X1 BFR6
S. Agona Ag-X1 DMC59
Ag-X2 BfR1
S. Anatum An-X1 DMC90, DMC91
S. Bispebjerg B-X1 DMC78
S. Corvallis C-X1 DMC36, DMC86
S. Montevideo M-X1 DMC81
M-X2 DMC88
S. Nchanga N-X1 DMC15
S. Salford Sa-X1 DMC93
S. Senftenberg Se-X1 DMC55
S. Telaviv Te-X1 DMC66
The dendogram showing the cluster analysis of the PFGE profile groups is given in
Figure 4.8. Cluster analysis of the PFGE profiles showed the genetic variability
within 42 different groups. The similarity level ranged from 44,3-100%. The major
clusters were obtained by considering an arbitrary homology of about 60% and
below, but the clusters were dispersed and minor cluster were obtained above this
homology. The similarities among serotypes were 80,1% for S. Infantis, 91,8% for
Turkish S. Virchow strains, which represented 67,7% similarity with German S.
Virchow strain, and 68,5% for S. Typhimurium strains. Any of the subtypes were
found to be in 100% similarity.
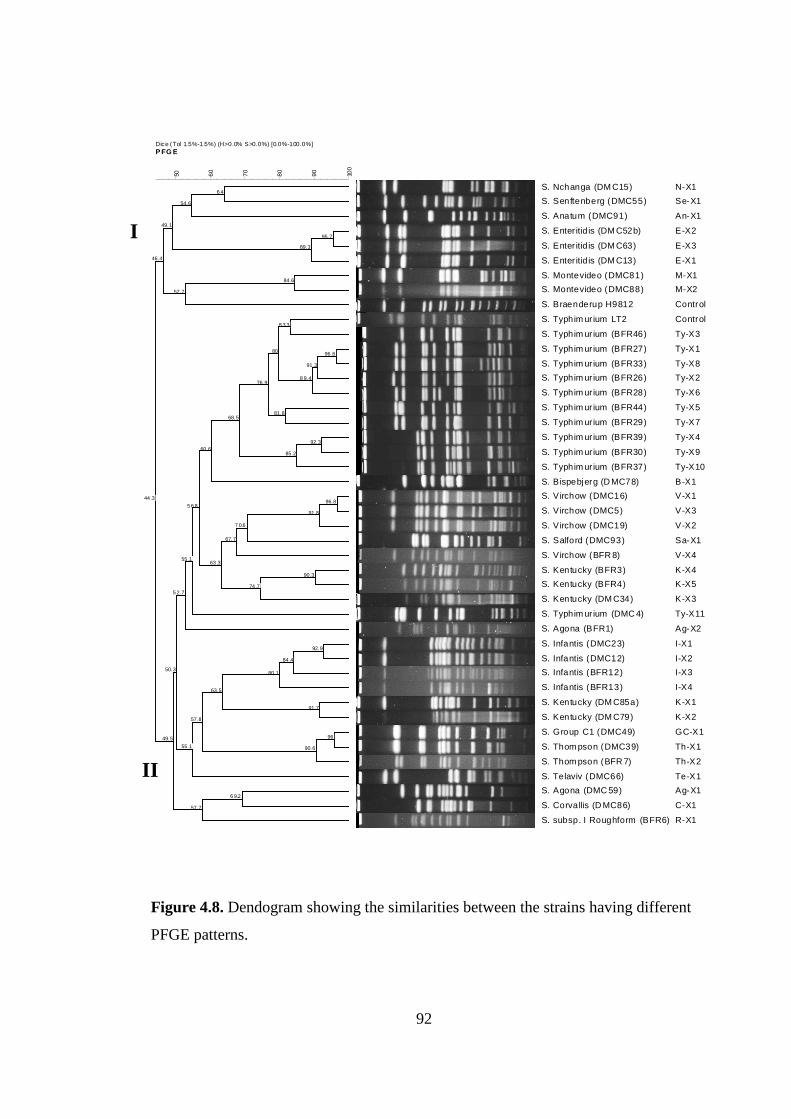
92
Figure 4.8. Dendogram showing the similarities between the strains having different
PFGE patterns.
Dice (Tol 1.5%-1.5%) (H>0.0% S>0.0%) [0.0%-100.0%]P FG E
100
9080706050
6 4
54.6
95.7
89.3
49.1
84 .6
52.7
46.4
8 3.3
96 .6
91 .3
8 9.4
80
81.8
76 .9
92.3
85 .2
68.5
60 .6
96.8
91 .8
7 0.6
67.7
90.3
74 .7
63 .3
5 6.8
55 .1
5 2.7
92.9
84 .4
80.1
91.7
63.5
96
90.6
57.8
55 .1
50.3
6 9.2
57.7
49.5
44 .3
PFGE
S. Nchanga (DM C15)
S. Senftenberg (DMC55)
S. Anatum (DMC91)
S. Enter itid is (DM C52b)
S. Enter itid is (DM C63)
S. Enter itid is (DM C13)
S. Montevideo (DMC81)
S. Montevideo (DMC88)
S. Braenderup H9812
S. Typhim ur ium LT2
S. Typhim ur ium (BFR46)
S. Typhim ur ium (BFR27)
S. Typhim ur ium (BFR33)
S. Typhim ur ium (BFR26)
S. Typhim ur ium (BFR28)
S. Typhim ur ium (BFR44)
S. Typhim ur ium (BFR29)
S. Typhim ur ium (BFR39)
S. Typhim ur ium (BFR30)
S. Typhim ur ium (BFR37)
S. Bispebjerg (D MC78)
S. Virchow (DMC16)
S. Virchow (DMC5)
S. Virchow (DMC19)
S. Salford (DMC93)
S. Virchow (BFR 8)
S. Kentucky (BFR3)
S. Kentucky (BFR4)
S. Kentucky (DM C34)
S. Typhim ur ium (DMC 4)
S. Agona (BFR1)
S. Infantis (DMC23)
S. Infantis (DMC12)
S. Infantis (BFR12)
S. Infantis (BFR13)
S. Kentucky (DM C85a)
S. Kentucky (DM C79)
S. Group C1 (DMC49)
S. Thom pson (DMC39)
S. Thom pson (BFR 7)
S. Telaviv (DMC66)
S. Agona (DMC 59)
S. Corvallis (D MC86)
S. subsp. I Roughform (BFR6)
N-X1
Se-X1
An-X1
E-X2
E-X3
E-X1
M-X1
M-X2
Control
Control
Ty-X3
Ty-X1
Ty-X8
Ty-X2
Ty-X6
Ty-X5
Ty-X7
Ty-X4
Ty-X9
Ty-X10
B-X1
V-X1
V-X3
V-X2
Sa-X1
V-X4
K-X4
K-X5
K-X3
Ty-X11
Ag-X2
I-X1
I-X2
I-X3
I-X4
K-X1
K-X2
GC-X1
Th-X1
Th-X2
Te-X1
Ag-X1
C-X1
R-X1
II
I

93
4.4. Genetic Determinants of Antimicrobial Resistance
The antimicrobial resistance genes observed from Salmonella strains are given in
Table 4.7. The strains having intermediate resistance to GEN and STR revealed no
antibiotic resistance genes tested. Besides, in the strain BFR1, the TMP-SXT
resistance phenotype did not correspond to any of the analysed genes.
Among 72 resistant strains, the most prevalent resistance genotypes were observed as
blatem-1 (56%, AMP resistance); floR (100%, CHL and FFC resistance); aphA1
(100%, KAN and NEO resistance); tet(A) (53%, TET resistance); aadA1 (82%, SPE
and STR resistance); sulI (78%, SUL resistance). Besides, one strain (DMC19) had
blaCTX-M3 type and one strain (BFR3) had blaCMY-2 type ESBL (Extended Spectrum
Beta-Lactamase) gene and 3 strains (DMC9, DMC16 and DMC68) had qnrS1
(plasmid encoded quinolone resistance) gene. All the NAL resistant strains had
mutation in QRDR (Quinolone Resistance Determining Region). The most prevalent
mutation was Ser83 amino acid substitution in gyrA region (55% among NAL
resistant strains). Besides this mutation type, Asp87 amino acid substitution was also
observed. Only BFR7 had a double mutation in gyrA region with both Ser83 and
Asp87 amino acid substitutions. All the mutants of parC region (51%) had Thr57
amino acid substitution. There were 22 strains obtained carrying mutations in both
gyrA and parC regions.

94
Table 4.7. Antimicrobial resistance genes obtained from the antimicrobial resistant
strains.
Strain Gene(s) and/or Mutation(s)* DMC5 gyrA (Asp87�Tyr87) DMC7 aadA1-like; aphA1; sul1; tet(A); dfr5-14; gyrA (Ser83�Tyr83);
parC (Thr57�Ser57) DMC9 blatem-1; gyrA (Asp87�Tyr87); qnrS1 DMC12 aadA1-like; aphA1; sul1; tet(A); dfr5-14; gyrA (Ser83�Tyr83);
parC (Thr57�Ser57) DMC15 blatem-1; sul2; dfrA1-like DMC16 blatem-1; gyrA (Asp87�Tyr87); qnrS1 DMC18 gyrA (Asp87�Tyr87) DMC19 blatem-1; blaCTX-M9; strA; strB; sul2; dfr5-14; gyrA (Asp87�Tyr87) DMC20 aadA1-like; aphA1; sul1; tet(A); dfr5-14; gyrA (Ser83�Tyr83);
parC (Thr57�Ser57) DMC23 aadA1-like; aphA1; sul1; tet(A); dfr5-14; gyrA (Ser83�Tyr83);
parC (Thr57�Ser57) DMC24 gyrA (Asp87�Asn87) DMC32 gyrA (Asp87�Tyr87) DMC34 aadA1-like; sul1 DMC40 aadA1-like; sul1; tet(A); dfr5-14; gyrA (Ser83�Tyr83);
parC (Thr57�Ser57) DMC42 gyrA (Asp87�Tyr87) DMC57 aadA1-like; aphA1; sul1; tet(A); dfr5-14; gyrA (Ser83�Tyr83);
parC (Thr57�Ser57) DMC58 aadA1-like; aphA1; sul1; tet(A); dfr5-14; gyrA (Ser83�Tyr83);
parC (Thr57�Ser57) DMC68 blatem-1; gyrA (Asp87�Tyr87); qnrS1 DMC70 aadA1-like; aphA1; sul1; tet(A); dfr5-14; gyrA (Ser83�Tyr83);
parC (Thr57�Ser57) DMC75 aadA1-like; aphA1; sul1; tet(A); dfr5-14; gyrA (Ser83�Tyr83);
parC (Thr57�Ser57) DMC83 gyrA (Asp87�Tyr87) BFR1 sul1; tet(A); dfr25 BFR2 blatem-1; aadA1-like; strA; strB; sul1; sul2; tet(A); dfrA1-like;
gyrA (Asp87�Tyr87) BFR3 blaCMY2; strA; strB BFR4 blatem-1; aadA1-like; strA; strB; sul1; tet(A); tet(B); dfrA1-like BFR5 gyrA (Asp87�Phe87) BFR6 blatem-1; aadA1-like; aadA2; aadB; sul1; tet(B); gyrA (Asp87�Phe87) BFR7 aphA1; tet(A); gyrA (Ser83�Phe83; Asp87�Tyr87);
parC (Thr57�Ser57) BFR8 gyrA (Ser83�Phe83) BFR9 gyrA (Ser83�Phe83) BFR10 aadA1-like; sul1; tet(A); gyrA (Ser83� Tyr 83); parC (Thr57�Ser57) BFR11 aadA1-like; sul1; tet(A); gyrA (Ser83� Tyr 83); parC (Thr57�Ser57) BFR12 aadA1-like; sul1; tet(A); gyrA (Ser83� Tyr 83); parC (Thr57�Ser57) BFR13 blatem-1; sul2; dfrA1-like

95
Table 4.7. Antimicrobial resistance genes obtained from the antimicrobial resistant
strains (continued).
Strain Gene(s) and/or Mutation(s)* BFR14 aadA1-like; sul1; tet(A); gyrA (Ser83� Tyr 83); parC (Thr57� Ser57) BFR15 aadA1-like; sul1; tet(A); gyrA (Ser83� Tyr 83); parC (Thr57� Ser57) BFR16 blatem-1; sul2; dfrA1-like BFR17 aadA1-like; sul1; tet(A) ; gyrA (Ser83� Tyr 83);
parC (Thr57� Ser57) BFR18 aadA1-like; sul1; tet(A) ; gyrA (Ser83� Tyr 83);
parC (Thr57� Ser57) BFR19 aadA1-like; sul1; tet(A) ; gyrA (Ser83� Tyr 83);
parC (Thr57� Ser57) BFR20 aadA1-like; sul1; tet(A) ; gyrA (Ser83� Tyr 83);
parC (Thr57� Ser57) BFR21 aadA1-like; sul1; tet(A) ; gyrA (Ser83� Tyr 83);
parC (Thr57� Ser57) BFR22 aadA1-like; sul1; tet(A) ; gyrA (Ser83� Tyr 83);
parC (Thr57� Ser57) BFR23 blatem-1; sul2; dfrA1-like BFR24 aadA1-like; sul1; tet(A) ; gyrA (Ser83� Tyr 83);
parC (Thr57� Ser57) BFR25 blapse-1; sul1 BFR26 blapse-1; floR; aadA1-like; aadA2; aphA1; sul1; tet(G);
gyrA (Asp87� Tyr87) BFR27 blapse-1; floR; aadA1-like; aadA2; sul1; tet(G) BFR28 blatem-1; blapse-1; floR; aadA1-like; aadA2; sul1; tet(G);
gyrA (Asp87� Asn87) BFR29 blapse-1; sul1 BFR30 blatem-1; aadA1-like; strA; strB; sul2; tet(B) BFR31 blapse-1; floR; aadA1-like; aadA2; sul1; tet(G); gyrA (Asp87� Tyr87) BFR32 blapse-1; floR; aadA1-like; aadA2; sul1; tet(G); gyrA (Asp87� Asn87) BFR33 blapse-1; floR; aadA1-like; aadA2; sul1; tet(G) BFR34 blatem-1; strA; strB; sul2; tet(B) BFR35 blatem-1; strA; strB; sul2; tet(B) BFR36 blatem-1; strA; strB; sul2; tet(B) BFR37 blatem-1; sul2; dfrA1-like BFR38 blatem-1; aadA2; strA; strB; sul2; tet(B) BFR39 blatem-1; aadA1-like; strA; strB; sul1; sul2; tet(B) BFR40 blapse-1; floR; aadA1-like; aadA2; sul1; tet(G) BFR41 blapse-1; floR; aadA1-like; aadA2; aphA1; sul1; tet(G) BFR42 blapse-1; floR; aadA1-like; aadA2; sul1; tet(G) BFR43 blapse-1; floR; aadA1-like; aadA2; sul1; tet(G) BFR44 blatem-1; strA; strB; tet(B) BFR45 blapse-1; floR; aadA1-like; aadA2; sul1; tet(G); gyrA (Asp87� Asn87) BFR46 blatem-1; floR; strA; strB; sul2; tetB BFR47 blapse-1; floR; aadA1-like; aadA2; sul1; tet(G); gyrA (Asp87� Asn87) BFR48 blapse-1; sul1 BFR49 blapse-1; floR; aadA1-like; aadA2; sul1; tet(G)
*Mutations are indicated in parenthesis as amino acid substitutions.

96
The integron variable region analyses exhibited 700 bp (1 strain), 1000 bp
(37 strain), 1200 bp (16 strain) and 1600 bp (3 strain) integrons (Figure 4.9 and
4.10). DNA sequence analyses of these integrons for their gene cassette(s) indicated
that they were variable.
The Turkish origin strains which had 1000 bp variable region integron were all S.
Infantis (9 strains) and one S. Kentucky (DMC33) serotype. In order to deduce the
difference between these integrons, PCR-RFLP analysis was carried out. The results
indicated that the variable region of these integrons were similar and produced the
same fingerprint with four different sized fragments. Thus, only DMC33 and
DMC58 were sequenced for their integron variable regions. Results exhibited that
both serotypes had the same gene (aadA1) determining STR-SPE resistance.
The strain BFR1 had the 700 bp integron and the gene cassette observed was dfr25.
This result explained the TMP-SXT resistance of the strain and determined the
genotype that was not confirmed by the genes screened. The other 1000 bp integron
cassettes were belonging German origin strains BFR14 and BFR39 having aadA1
gene cassette. BFR25 was one of the strain having 1200 bp integron cassette which
showed blaPSE-1 gene cassette confering AMP resistance. The last integron variable
region was the 1600 bp in BFR6 having two gene cassettes, namely aadA1 and aadB
(confering GEN resistance). The aadB gene explains the intermediate resistance in
this strain.

97
*M: Marker (50-2000 bp; Hyperladder II, Bioline, UK). Figure 4.9. Results of the integron analysis of antimicrobial resistant strains from
Turkish origin.
Lane Strain PCR product (bp) Lane Strain PCR product (bp)
1: DMC5 - 14: DMC40 1000
2: DMC7 1000 15: DMC42 -
3: DMC9 - 16: DMC57 1000
4: DMC12 1000 17: DMC58 1000
5: DMC15 - 18: DMC68 -
6: DMC16 - 19: DMC70 1000
7: DMC18 - 20: DMC75 1000
8: DMC19 - 21: DMC83 -
9: DMC20 1000 22: DMC90 -
10: DMC23 1000 23: DMC91 -
11: DMC24 - 24: (+)control 1200; 1000
12: DMC31 - 25: (-)control -
13: DMC34 1000
M* 1 2 3 4 5 6 7 8 9 10 11 12 13 14 15 16 17 18 M*
M* 19 20 21 22 23 24 25 M*
1000bp
300bp

98
*M: Marker (50-2000 bp; Hyperladder II, Bioline, UK).
Figure 4.10. Results of the integron analysis of antimicrobial resistant strains from
German origin.
Lane Strain PCR product (bp) Lane Strain PCR product (bp)
1: BFR1 700 13: BFR13 -
2: BFR2 1600 14: BFR14 1000
3: BFR3 - 15: BFR15 1000
4: BFR4 1600 16: BFR16 -
5: BFR5 - 17: BFR17 1000
6: BFR6 1600 18: BFR18 1000
7: BFR7 - 19: BFR19 1000
8: BFR8 - 20: BFR20 1000
9: BFR9 - 21: BFR21 1000
10: BFR10 1000 22: BFR22 1000
11: BFR11 1000 23: BFR23 -
12: BFR12 1000 24: BFR24 1000
M* 1 2 3 4 5 6 7 8 9 10 11 12 13 14 15 16 17 18 19 20 21 22 23 24 M*

99
*M: Marker (50-2000 bp; Hyperladder II, Bioline, UK).
Figure 4.10. Results of the integron analysis of antimicrobial resistant strains from
German origin (continued).
Lane Strain PCR product (bp) Lane Strain PCR product (bp)
1: BFR25 1200 15: BFR39 1000
2: BFR26 1200; 1000 16: BFR40 1200; 1000
3: BFR27 1200; 1000 17: BFR41 1200; 1000
4: BFR28 1200; 1000 18: BFR42 1200; 1000
5: BFR29 1200 19: BFR43 1200; 1000
6: BFR30 - 20: BFR44 -
7: BFR31 1200; 1000 21: BFR45 1200; 1000
8: BFR32 1200; 1000 22: BFR46 -
9: BFR33 1200; 1000 23: BFR47 1200; 1000
10: BFR34 - 24: BFR48 1200
11: BFR35 - 25: BFR49 1200; 1000
12: BFR36 - 26: (+)control 1000
13: BFR37 - 27: (-)control -
14: BFR38 -
M* 25 26 27 M*
M* 1 2 3 4 5 6 7 8 9 10 11 12 13 14 15 16 17 18 19 20 21 22 23 24 M*
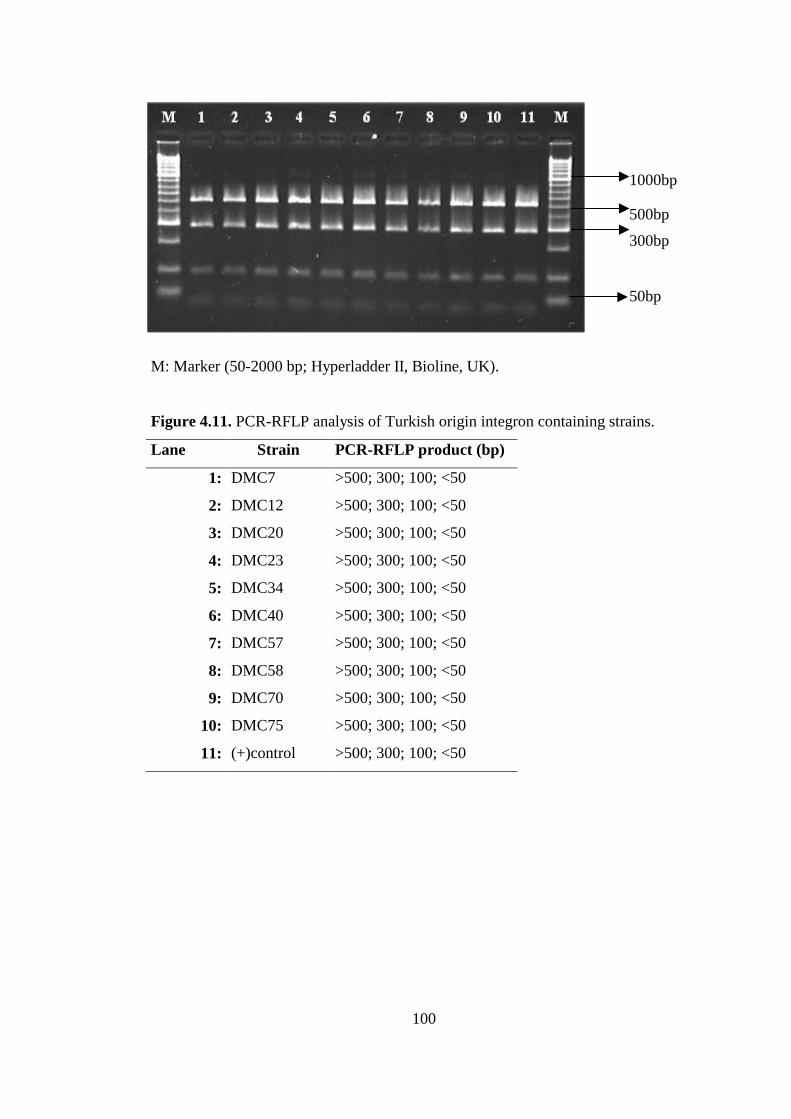
100
M: Marker (50-2000 bp; Hyperladder II, Bioline, UK).
Figure 4.11. PCR-RFLP analysis of Turkish origin integron containing strains.
Lane Strain PCR-RFLP product (bp)
1: DMC7 >500; 300; 100; <50
2: DMC12 >500; 300; 100; <50
3: DMC20 >500; 300; 100; <50
4: DMC23 >500; 300; 100; <50
5: DMC34 >500; 300; 100; <50
6: DMC40 >500; 300; 100; <50
7: DMC57 >500; 300; 100; <50
8: DMC58 >500; 300; 100; <50
9: DMC70 >500; 300; 100; <50
10: DMC75 >500; 300; 100; <50
11: (+)control >500; 300; 100; <50
1000bp
500bp
300bp 50bp

101
qnrS1 (DMC9) and blaCTX-M3 (DMC19) genes were selected to be further
characterized for their location since they were important antimicrobial resistance
gene cassettes. To find out the location of the genes, Southern-blot and
DNA-hybridization experiments were conducted (Figure 4.12 and 4.15). It was
observed that both genes were plasmid encoded in the strains they belonged to. The
plasmids were ~45 kb for both the qnrS1 carrying one (pRQ2006) and the blaCTX-M3
carrying one (pBD2006). To reveal the lateral gene transfer of these genes,
conjugation analyses were carried out in two different incubation temperatures (room
temperature and 37°C, respectively). The pRQ2006 was found to be conjugative in
both temperatures, whereas any conjugants were not obtained for pBD2006.
The plasmid incompatibility groups were also studied for these two plasmids.
pBD2006 was found to have IncN type replication origin, whereas pRQ2006 did not
have any convenience with any of the 18 replicon studied.
Figure 4.12. blaCTX-M3 hybridization of the plasmid pBD2006. P: plasmid pBD2006;
M1: marker (169 kb; 93,93 kb; 54,54 kb; 6,36 kb);
C1: positive control 1; C2: positive control 2; M2: marker (Roche
GmbH., Germany).
P M1 C1 C2 M2 P M1 C1 C2 M2

102
Thus, the pRQ2006 plasmid was further studied by its restriction pattern, cloning and
DNA sequencing analysis. blaTEM-1 gene was also found to be encoded by this
plasmid (Figure 4.15). Restriction analysis of pRQ2006 was performed using several
endonucleases, which is given in Figure 4.13. The restriction enzymes BamHI,
EcoRI, SalI, XbaI, SmaI, Bsp120-I, XhoI and SacI yielded fragments bigger than 14
kb. On the other hand, PstI and PvuI enzymes did not give the fragments proper for
cloning experiments. For these reasons, HindIII, HincII ve EcoRV enzymes were
selected for cloning experiments. The transformation efficiency was very low, since
only 6 transformants were obtained (Figure 4.14). From those transformants, 5 were
the result of EcoRV and 1 was HindIII restriction cutting. There was not any colony
obtained from HincII restriciton cutting.
The presence of a Tn3-like transposon (accession no. AB187515.1), which contained
the blaTEM-1 gene was confirmed by partial sequencing of a HindIII (8 kb fragment)
and EcoRV (2,7 kb fragment) restriction fragments that had been inserted into the
vector pIV2 and introduced into the E. coli strain NEB5 (Fig 4.14).
With the transformants, a region of about 3,430 bp of pRQ2006 was sequenced and
found to carry the blaTEM-1 gene, the tnpR gene (encoding the resolvase) and part of
the tnpA gene (encoding the transposase) of the Tn3-like transposon. This region
included a TAAAA direct repeat at the boundaries of the Tn3 element. Then, a
pRQ2600 region of about 1,677 bp containing qnrS1 was sequenced and compared
with the database. No homology was observed with the known qnrS1 carrying
plasmids.
RFLP-hybridisation with qnrS1 and blaTEM-1-probes had been carried out
(Figure 4.15). qnrS1 is located on a 2,6 kb HindIII-fragment of pRQ2006 and the
blaTEM-1 gene is located on an 8.4 kb fragment.

103
Figure 4.13. Restriction digestion pRQ2006; 1: Marker (λ DNA-PstI), 2: DMC9
plazmid DNA, 3: BamHI, 4: EcoRI, 5: HindIII, 6: PstI, 7: PvuI, 8: SalI,
9: Marker, 10: DMC9 plasmid DNA, 11: HindIII, 12: HincII, 13: XbaI,
14: SmaI, 15: EcoRV, 16: SacI, 17: Bsp120-I, 18: XhoI.
1 2 3 4 5 6 7 8 9 10 11 12 13 14 15 16 17 18
14,17 kb 5,08 kb 2,84 kb 2,58 kb 2,44 kb 1,7 kb 1,16 kb 0,81 kb

104
Figure 4.14. Restriction digestion of the vector plasmid from the transformant strains
having 1-5: EcoRV restriction digest, 6: HindIII restriction digest, 7:
Marker (Lambda DNA EcoRI-digest).
1 2 3 4 5 6 7
Vector plasmid
2,7 kb fragment

105
Figure 4.15. Restriction and hybridization analysis of the plasmid pRQ2006. 1: HincII; 2: HindIII; 3: EcoRI; 4: EcoRV; M: Molecular weight
marker used phage lambda DNA digested with HindIII; and P: undigested pRQ2006.
Plasmid-RFLP qnrS-Hybridization blatem-1 -Hybridization
M P 1 2 3 4 M M P 1 2 3 4 M M P 1 2 3 4 M

106
CHAPTER 5
DISCUSSION
In this chapter, the results of the thesis are discussed in relation to the current
literature. The isolation rate of Salmonella from Turkish food markets was found to
be high, especially in poultry. Although biochemical reaction composition among
isolated strains was not highly variable, a few atypical strains were also obtained.
The serotype distribution of Salmonella in Türkiye was consistent with the literature
by S. Enteritidis being the most common serotype. However, S. Typhimurium is a
prevalent serotype worldwide, this observation was not reflected in our results. The
epidemiology of the German strains was not discussed, since they were not randomly
selected. Except S. Infantis strains no plasmid profile was predominated. On the
other hand, there were unique plasmids, which were seen in all isolates of the
serotypes they belonged. PFGE patterns revealed 42 different subgroups. The cluster
analysis of subtypes exhibited two main clusters with 44,3% homology, where the
majority of the strains belonged to the second cluster. Mostly, the subtypes of the
same serotypes clustered together, but some exceptions were observed. The
antimicrobial resistance exhibited by Turkish strains was remarkable. The high NAL
resistance and reduced susceptibility to CIP is very worrisome, since quinolones are
the antibiotic of choice for the treatment of such infectious diseases. The high SUL
resistance of German strains showed that the isolates of both country origins differ in
their antibiotic regimes. The genotypic analyses of antimicrobial resistance
phenotype exhibited similar results with those explained in the literature. There were
two important observations that are currently emerging worldwide, the presence of
qnrS1 and blaCTX-M3. Class I integrons were obtained from both country origin strains
and found to be consistent to those that reported in the literature.

107
The isolation data exhibited that Salmonella contaminations were high in poultry
products followed by meat products in Türkiye. There were also considerable
amount of isolation from raw milk, whereas mayonnaise-based salads did not exhibit
an important result. This findings are due to the fact that of all the food samples other
than salads were in raw form and did not have any sanitation process. However,
ready-to-eat salads contained food additives that suppress the microbial flora. The
contamination rates were quite high considering that the microbial load of the foods
must be zero especially in terms of Entereobacteriaceae. The results found indicates
the poor sanitation conditions in the Turkish food market.
The isolation rate (Anon. BS EN ISO 6579, 2002) was quite high since out of 108
isolates 100 were confirmed as Salmonella spp. Serotypes in Salmonella enterica
subsp. I, do not differ in biochemical reactions. They exhibit variability in arginine
dihydrolysis and inositol-oxidation. In our results this variability is also observed
(Table 4.2). On the other hand, there were a few strains showing difference in other
biochemical reactions, namely lysine decarboxylation, ornithine decarboxylation,
mellibiose-fermentation and gelatinase activity. These isolates are considered as
atypic strains of Salmonella enterica subsp. I.
Although there are not much studies, serotype prevalence of Salmonella isolates in
Türkiye was reported by a few authors (Erol, 1999; Erdem et al., 2005; Goncagül et
al., 2005; Yazcıoğlu et al., 2005). Our results indicated that the most prevalent
serotype was S. Enteritidis followed by S. Virchow, S. Infantis and S. Kentucky
among foods tested. These results are consistent with the literature where S.
Enteritidis was reported as the most prevalent strain in chicken meat (Goncagül et
al., 2005). In addition, it was also found in higher rates (47,7%) from human isolates
(Erdem et al., 2005). The same study was also reported the prevalence of S.
Typhimurium isolates as 34,7%. S. Enteritidis and S. Typhimurium share the first
two places in prevalence of Salmonella serotypes in Europe
(http://www.hpa.org.uk/hpa/inter/enter-net_menu.htm). Since the rate of isolation of
S. Typhimurium serotype was very low a partial consideration was given for this
strain. This low rate isolation may be due to the cross contaminations of other
serotypes in the food chain. Serdaroğlu et al. (1996) reported the evaluation of

108
salmonellosis cases between 1989-1993 and obtained S. Typhimurium as the
causative agent in 104 out of 110 isolates. The findings, that S. Virchow, S. Kentucky
and S. Infantis were also in high prevalence, were in parallel with the Enter-Net
results (http://www.hpa.org.uk/hpa/inter/enter-net/07q1summ.pdf). As in the results
of this study, other serotypes were also reported to be isolated in Türkiye such as S.
Anatum (Küplülü, 1999), S. Telaviv (Küplülü, 1999), and S. Group C1 (Erdem et al.,
2005).
Phage typing data on 16 S. Enteritidis strains in our studies have indicated the
prevalence of PT21 phage type among Turkish isolates. But, the only S. Enteritidis
strain in German isolates exhibited the PT4 phage type. PT4 phage type is common
in Germany as reported in the literature (Schroeter et al., 1994). Some other phage
types were also detected from Turkish isolates (PT1, PT3 and PT6), however no
observation of PT4 phage type indicates the lack of correlation between Turkish and
German S. Enteritidis strains. There are reports indicating that the PT4 phage type is
a common phage type in human isolates of S. Enteritidis from Türkiye (Anğ-Küçüker
et al., 2000), which was not observed by the strains used in our study for food
isolates. Studies with human isolates also showed the other phage types such as PT1,
PT6, PT7, PT8, PT18 and in all studies PT4 was the most prevalent phage type Anğ-
Küçüker et al., 2000). Our study is the first study that reveals the PT21 phage type
prevalence in S. Enteritidis.
Because of there was only two S. Typhimurium isolates in Turkish origin strains, it
was not logical to discuss the prevalence of the phage type for those isolates. These
isolates did not exhibit any relation neither with the phage types, which were
recorded in the database of Salmonella Reference Laboratories (Berlin, Germany)
nor with the published ones. There are no available reports that study the prevalence
of S. Typhimurium phage types in Türkiye and in some studies were reported as
untypable (not react with any of the typing phages) strains (Anğ-Küçüker et al.,
2000). The phage types were not untypable in our study suggesting that the prevalent
S. Typhimurium isolates in Türkiye exhibit different phage susceptibility patterns
other than those in Europe. The German strains exhibited mainly DT104 phage type
which showed a clonally spread in Germany and Europe (Schroeter et al., 2004;

109
Helms et al., 2005). There were also RDNC phage type strains among German origin
ones, indicating the change in phage susceptibilities in strains and thus the limited
differentiation capacity of phage typing method.
The use of Kado and Liu (1981) for the plasmid isolation experiments was due to the
method’s specificity to isolate the plasmids up to 350 MDa. The plasmids obtained in
this study were in the range of <5-238 kb and the majority of the strains (58,3%) had
plasmids >50 kb, so the method allowed the differentiation of related serotypes.
Some of the serovars of Salmonella were found not to possess any plasmids (Rychlik
et al., 2006). The results showed that some of the strains belonging to S. Montevideo,
S. Thompson, S. subsp. I Roughform, S. Virchow, S. Group C1, S. Kentucky, S.
Corvallis, S. Anatum, S. Telaviv and S. Typhimurium serotypes did not exhibit
plasmid content. However, it cannot be suggested that there was a serotype
specificity in having no plasmid at all. Since, most of the S. Virchow and S.
Typhimurium strains possessed at least one plasmid, and there were strains of above
mentioned serotypes exhibiting plasmid content.
The known plasmids found in Salmonella are 2-200 kb in size with a special
emphasis on biological properties which they bring to host (Guerra et al., 2000;
Rychlik et al., 2006). They control medically important properties including
virulence factors, resistance to heavy metals, antibiotics and phages or utilization
alternative carbon sources. Since plasmids code for genes dispensable for the
functioning of the host cell, they represent genetic information under a lower
selection pressure, which can be subjected to an accelerated evolution. Therefore
acquisition of a plasmid allows its host to adapt to changing environments easily.
Proof of this statement is the relevant appearance of R-plasmids (resistance plasmids)
with spv or rck genes originating from the Salmonella serovar specific virulence
plasmid allowing for the evolution of highly virulent and antibiotic resistant clones to
S. enterica (Guerra et al., 2002; Rychlik et al., 2006). The virulence characteristics
were not studied in the thesis and need to be investigated.

110
Plasmids are classified into incompatibility groups according to their mode of
replication and maintenance in the bacterial cell. Plasmids, which confer different
replication origin, are able to reside in the same bacterial cell. Moreover, plasmids,
which confer the same replication origin, cannot be replicated in the same cell, thus
termed as incompatible. The replication origins of two important plasmids were
investigated. The plasmid carrying ESBL gene (blaCTX-M3), pBD2006, was IncN
incompatibility group. There are reports about incompatibility groups of ESBL
encoding plasmids. Carattoli et al. (2006) demonstrated dominance of
incompatibility IncA/C or IncN-related plasmids carrying some emerging resistance
determinants to extended-spectrum cephalosporins and carbapenems. However, there
was no observation with the plasmid carrying qnrS1 gene, pRQ2006, with the
incompatinilities analysed. The incompatibility of this plasmid should be futher
investigated by cloning analysis with a set of incompatibility groups in addition to
those tested.
PFGE is one of the most powerful DNA fingerprinting method that distinguishes
closely related serotypes and phage types of Salmonella (Olive and Bean, 1999;
Guerra et al., 2000a; Yan et al., 2003). The PFGE experiments of the strains revealed
variability of the serotypes in different homology among subtypes. There were 42
subgroups out of 108 strains obtained. These subgroups exhibited two main clusters
with 44,3% homology. 81% of the subgroups formed the cluster II. Mainly, the
subgroups of the same serotypes were clustered together. However, it is notable that
the strains belonging to different country origins were in far branches of the
dendogram, especially for serotypes S. Enteritidis, S. Kentucky, and S. Typhimurium.
The major clusters were formed below 60% homology and after that the dispersion
into minor clusters was observed. These results indicated the high sensitivity of
PFGE in the differentiation of Salmonella serotypes. Besides, when S. subsp.I
Roughform strains were serotyped and gave reaction with all polyvalent O-group
antigens, so called rough strains. The PFGE analyses allowed these strains to be
assigned to a specific serotype. Similarly, the strains serotyped as S. Group C1 did
not exhibited any reaction with polyvalent H-group antigens, although they were
motile. Thus, they are named as O-group antigen that they have reacted. In our
results, these strains were also assigned to a serotype by comparing the PFGE
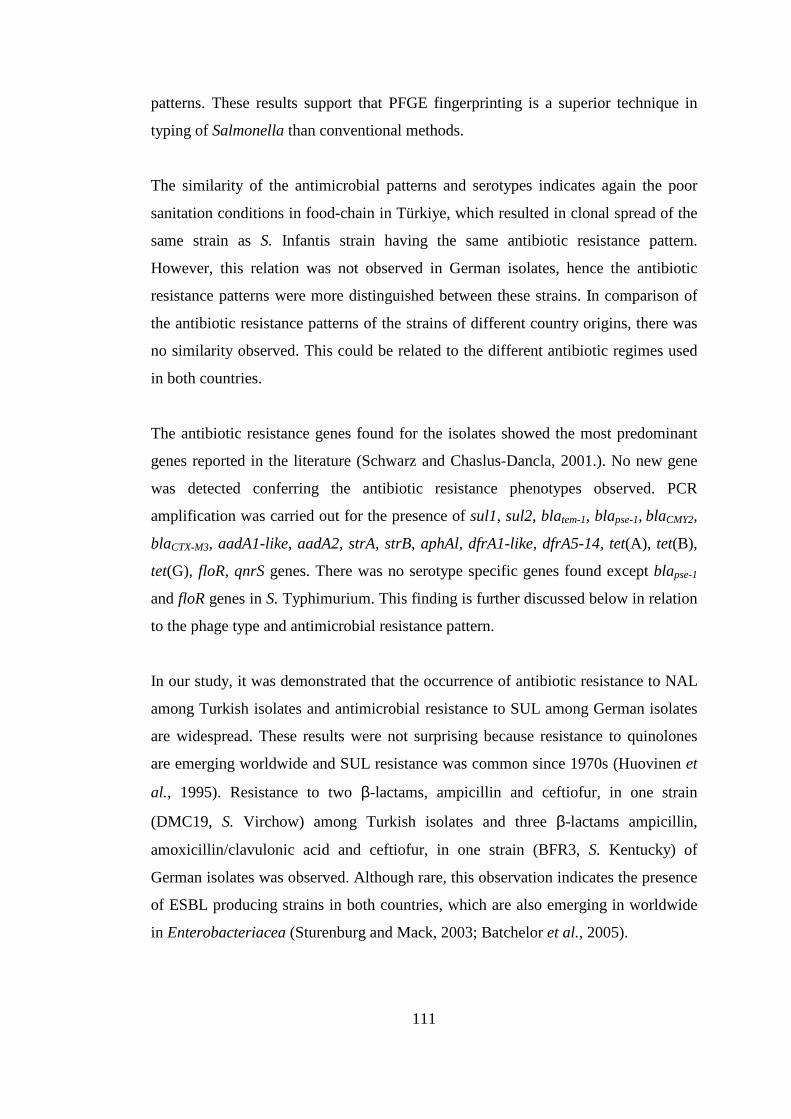
111
patterns. These results support that PFGE fingerprinting is a superior technique in
typing of Salmonella than conventional methods.
The similarity of the antimicrobial patterns and serotypes indicates again the poor
sanitation conditions in food-chain in Türkiye, which resulted in clonal spread of the
same strain as S. Infantis strain having the same antibiotic resistance pattern.
However, this relation was not observed in German isolates, hence the antibiotic
resistance patterns were more distinguished between these strains. In comparison of
the antibiotic resistance patterns of the strains of different country origins, there was
no similarity observed. This could be related to the different antibiotic regimes used
in both countries.
The antibiotic resistance genes found for the isolates showed the most predominant
genes reported in the literature (Schwarz and Chaslus-Dancla, 2001.). No new gene
was detected conferring the antibiotic resistance phenotypes observed. PCR
amplification was carried out for the presence of sul1, sul2, blatem-1, blapse-1, blaCMY2,
blaCTX-M3, aadA1-like, aadA2, strA, strB, aphAl, dfrA1-like, dfrA5-14, tet(A), tet(B),
tet(G), floR, qnrS genes. There was no serotype specific genes found except blapse-1
and floR genes in S. Typhimurium. This finding is further discussed below in relation
to the phage type and antimicrobial resistance pattern.
In our study, it was demonstrated that the occurrence of antibiotic resistance to NAL
among Turkish isolates and antimicrobial resistance to SUL among German isolates
are widespread. These results were not surprising because resistance to quinolones
are emerging worldwide and SUL resistance was common since 1970s (Huovinen et
al., 1995). Resistance to two β-lactams, ampicillin and ceftiofur, in one strain
(DMC19, S. Virchow) among Turkish isolates and three β-lactams ampicillin,
amoxicillin/clavulonic acid and ceftiofur, in one strain (BFR3, S. Kentucky) of
German isolates was observed. Although rare, this observation indicates the presence
of ESBL producing strains in both countries, which are also emerging in worldwide
in Enterobacteriacea (Sturenburg and Mack, 2003; Batchelor et al., 2005).

112
DNA sequencing results exhibited that the amino acid changes observed in the
QRDRs, gyrA and parC, were consistent with the previously described mutations
(Malorny et al., 2003). No other mutation was determined for the isolates. For parC
mutants, the mutation was by the Thr57�Ser57 amino acid substitution. There was
also a correlation between S. Infantis strains from both country origin isolates. The
double Ser83 and Thr57 type mutation affecting both gyrA and parC was only seen
in S. Infantis strains of all except BFR24 strain. However these strains differ in their
susceptibilities and none was resistant to CIP (0,25-1 µg/mL). Our results showed no
correlation between mutation number and the resistance to quinolones, especially
reduced susceptibility to CIP. The strain BFR7 having three mutations two in gyrA
(Ser83�Phe83; Asp87�Tyr87) and one in parC (Thr57�Ser57) also obey the fact
by showing intermediate susceptibility to CIP with 0,5 µg/mL MIC value which
confer only intermediate resistance. The S. Virchow strains from both country origins
showed no mutation in parC region, and they differ in gyrA mutations. The strains
from Türkiye exhibited Asp87�Tyr87 amino acid substitution, whereas
Ser83�Phe83 was shown by German origin strains. All S. Typhimurium strains
resistant to NAL had the mutation in only gyrA region at Asp87.
Consistent with previous reports, resistant phenotypes which the isolates are only
associated with some strains of phage types, namely S. Typhimurium DT104. This
indicates the dynamic nature of antimicrobial resistance spread. S.Typhimurium
DT104 has spread worldwide. This Salmonella type has emerged within last few
years as one of the most common causes of human salmomellosis in several
countries. The majority of the DT104 isolates have multidrug resistance phenotype
and abbreviated as ACSSuT; which means that they are resistant to ampicillin,
chloramphenicol, streptomycin, sulphonamides and tetracycline (Ahmed et al.,
2005). 6 strains showed typical multidrug resistant phenotype. These strains were
found to have 1 and 1,2 kb integrons carrying gene cassettes blapse-1 and aadA2,
respectively. These two integrons are characteristic for the S. Typhimurium DT104.
The genetic makeup of many isolates of S. Typhimurium DT104 with ACSSuT
resistance phenotype is similar, comprising floR and tet(G) genes bracketed by two
class 1 integrons. These are carrying blapse-1 and aadA2 gene cassettes clustered on

113
14 kb region of Salmonella genomic island 1 (SGI1). These antibiotic resistance
genes are an integral part of the chromosome (Threlfall, 1994; Briggs and Fratamico,
1999; Boyd et al., 2001; Boyd et al., 2002; Randall et al., 2004). 6 German origin S.
Typhimurium DT104 strains studied had the typical genetic determinants, which
indicated the presence of SGI1 in these strains. Previous workers have shown that
serotypes beyond S. Typhimurium can have integrons ranging in size from 0,65-2,7
kb and these integrons were associated with the presence of various resistance genes
(White et al., 2001; Orman et al., 2002; Lindstedt et al., 2003; Randall et al., 2004).
In this study, PCR screening results of 72 antibiotic resistant strains showed class I
integrons in 44 isolates (61% of the antibiotic resistant strains) of different
Salmonella serovars, which are S. Infantis (21 strains), S. Typhimurium (17), S.
Agona (1), S. Enteritidis (1), S. Kentucky (1), and S. subsp I Roughform (1). These
serotypes showed 5 profiles of class I integrons. Thus, the data indicated that the
gene cassettes aadA1, aadB and blapse-1 are still predominant among Salmonella
strains. The gene cassettes carried by the integrons mentioned are commonly found
ones, except dfr25 found in S. Agona (BFR1). This gene cassette has been published
by Agerso et al. (2006) in S. Agona too and confers resistance to TMP and SXT.
The isolates carrying qnrS1 gene were further analysed. Sequences of the PCR
products of the gene were identical to qnrS1 that confirms the result of PCR
amplification (Genbank accession no. AB187515). Further, PCR amplifications
which performed by pre-qnrS primers (Poirel et al., 2006) showed the presence of
the qnrS1 gene (656 bp) found in different Enterobacteriaceae (Robicsek et al.,
2006).
Southern hybridization of plasmid DNA revealed that both the qnrS1 and the
blaTEM-1-like probes hybridized with a ∼45 kb a plasmid, designated pRQ2006, were
present in the three qnrS1-positive isolates. Conjugation experiments using an E. coli
J53 rifampicin-resistant strain as recipient were performed. To avoid the selection of
J53 gyrA mutants, selection was made on EMB-agar plates with ampicillin and
rifampicin (200 and 100 mg/L, respectively). Six selected transconjugants showed
low resistance to nalidixic acid (8-16 mg/L) and a decreased susceptibility to

114
ciprofloxacin (0.5 mg/L). They were positive for the qnrS1 and blaTEM-1 genes and
did not show any chromosomal mutation affecting the QRDR of the gyrA gene.
Restriction analysis of pRQ2006 was performed using several endonucleases.
Restriction fragments generated with HincII, HindIII, EcoRV and EcoRI which were
chosen for DNA- hybridisation with blaTEM-1 and qnrS1 probes. Only in case of
restriction with EcoRI, both probes hybridised to the same fragment (∼20 kb).
The presence of a Tn3-like transposon (acc. no AB187515.1), which contained the
blaTEM-1 gene was confirmed by partial sequencing of a HindIII (8 kb fragment) and
EcoRV (2.7 kb fragment) restriction fragments that had been inserted into the vector
pIV2 and introduced into the E. coli strain NEB5 (New England Biolabs, UK).
Only a few qnrS1-carrying plasmids have been described so far. They differ in their
molecular sizes, resistance genes (i.e. for ß-lactamases) and bacterial host. The 47 kb
plasmid pAH0376 (acc. no. AB187515.1) was the first qnrS1-carrier plasmid
described. It was found in a human clinical isolate of Shigella flexneri in Japan and
carries a Tn3-like transposon (Hata et al., 2005). The 58 kb pINF5 plasmid (acc. no.
AM234722.1) also carries the Tn3-like transposon, and was isolated from
Salmonella Infantis recovered from poultry in Germany (Kehrenberg et al., 2006).
The pK245 plasmid (acc. no. JQ449578.1) is a 98 kb plasmid, which carries a blaSHV-
2 (ampicillin-resistance) gene found in a clinical isolate of Klebsiella pneumoniae
(Chen et al., 2006). In Enterobacter cloacae isolated in France and Vietnam, several
plasmids with sizes between 50 kb (p287) and 100 kb (ie. pS3-5) have been
described and some of them carry a new blaLAP-1 gene (Poirel et al., 2007). Recently,
Hopkins et al. (2007) identified in the UK several qnrS1-plasmids, including the 44
kb IncN plasmid TPqnrS-2a/b, which also carries the blaTEM-1 gene, in S. Virchow
PT8 isolated from Thai cooked chicken.
The plasmid pRQ2006 was compared to pINF5 from S. Infantis and pAH0376 from
S. flexneri by primer walking and/or amplification using primers deduced from the
published sequences of pINF5 (13,389 bp) and pAH0376 (11,002 bp), as well as by
comparison of RFLP- hybridisation patterns.

115
First, a region of about 3,430 bp of pRQ2006 was sequenced. This region matched
with nucleotides 915-3,093 from pINF5 and 2,114-5,545 from pAH0376 and
contained the blaTEM-1 gene, the tnpR gene (encoding the resolvase) and part of the
tnpA gene (encoding the transposase) of the Tn3-like transposon. The region located
upstream of Tn3 only matched with pAH0376 from S. flexneri (nucleotides 2,114 to
2,909). This region included a TAAAA direct repeat at the boundaries of the Tn3
element, which differs from the TTATT repeat part of an IS26 relic found in pINF5.
Secondly, a pRQ2600 region of about 1,677 bp containing qnrS1 was sequenced.
This sequence was similar to the sequences described for pINF5 and pAH0376
(nucleotides 6,871-8,547 from pINF5 and 9,661-10,132 from pAH0376). Based on
the sequence of pINF5, amplification experiments targeting other genes/sequences
located downstream of qnrS1 were carried out. Using primers designed for the CS12
fimbrial gene cluster of E. coli present in pINF5 (nucleotides 9,661 to 10,143) a
100% homologous PCR product of 482 bp was amplified (Kehrenberg et al., 2006).
In contrast, no product targeting the tnp gene encoding the transposase of IS26 of
pINF5 (expected size of 429 bp corresponding to nucleotides 11,591-12,020) was
obtained, indicating the lack of the IS26 in pRQ2006.
Kehrenberg et al. (2006) reported that pINF5 and pAH0376 have different HindIII
restriction patterns. RFLP-hybridisation with qnrS1 and blaTEM-1-probes had been
carried out. The results are similar to those obtained with pRQ2006: qnrS1 is located
on a 2.6 kb HindIII-fragment of pRQ2006 (as described for pINF5 and pAH0376)
and the blaTEM-1 gene is located on an 8.4 kb fragment (as described for pAH0376).
Furthermore, both genes are located on a ∼20 kb EcoRI fragment (as described for
pAH0376).
The pRQ2006 qnrS1-plasmid differs from the other described plasmids found in
Salmonella, and seems to be related to the plasmid pAH0376 found in S. flexneri
isolated from human clinical samples in Japan. The presence of these plasmids in
Salmonella isolates from food producing animals is another threatening step in the
increasingly observed fluoroquinolone-resistance.

116
CHAPTER 6
RECOMMENDATIONS
Epidemiological studies for Salmonella are very important, since it is the causative
agent of food-borne salmonellosis and the majority of Salmonella are acquiring
resistance to one or more antibiotics. This study has limitations from epidemiological
point of view to track Salmonella strains in Türkiye as a whole. Besides, there is lack
of information in this era in both in scientific researches and governmental attempts.
Thus, it is highly recommended that there must be more studies conducted on
Salmonella, its prevalence and antibiotic resistance. Moreover, there must be a
centralized governmental institution which perform the surveillance of Salmonella
like in Europe or other countries. The prevalence of serotypes and phage types of
Salmonella should be studied in detail and a national database must be built to allow
the comparison with those databases from other countries.
Antimicrobial resistance studies exhibit that the acquired resistance among pathogens
are increasing by resistance against not only one antibiotic but also more than one
antibiotic. This is worrisome in that the treatments of infectious diseases are
becoming more difficult. For this reason, antimicrobial drug usage should be
carefully regulated in countries. Unfortunately, in the developing countries like
Türkiye regulations are not enough to prevent uncontrolled use of antibiotics.
Antibiotic resistance studies at the molecular biology level also revealed the dynamic
nature of antimicrobial resistance. The frequent mutations and lateral transfer of
resistance genes accelerate the change in resistance mechanisms, which should be
taken into account in fighting with the resistance.

117
CHAPTER 7
CONCLUSION
Contamination of foods in Turkish markets is high with Salmonella serotypes by S.
Enteritidis being the most prevalent. Multidrug resistant strains of S. Infantis are
clonally distributed in foods indicating the cross-contaminations in the food-chain.
Considerable amount of the strains were confirmed to be antibiotic resistant to one or
more antibiotics. It was revealed that quinolone resistance is emerging in both
countries. However, in the case of the antimicrobial drug showing the highest
resistance, the strains differed in according to their country origin. It can be
concluded that S. Typhimurium DT104 with penta-resistance phenoype is still a
problem in Germany. The presented thesis also gives new information about the
molecular basis of Salmonella isolates from foods in Türkiye with comparative
approach from Germany. There were no correlation between the plasmid profiles
except S. Infantis strains from both countries. The differences in PFGE patterns of
the strains revealed that isolates of the two countries formed different subgroups. On
the other hand, antibiotic resistance genes and the mutations contributed to resistance
does not differ neither in both countries nor with those in the literature. Finally,
lateral gene transfer by mobile genetic elements such as integrons, transposons and
plasmids was presented in the study and concluded that they were common and
found not only for S. Typhimurium but also for S. Enteritidis, S. Infantis, S.
Kentucky, and S. Agona. Similar studies has to be done regularly in order to establish
a control system to pursue the changes in drug resistance pattern before the cases
become epidemic even panepidemic.

118
REFERENCES
Aarts H. J. M. Boumedine K. S., Nesme X. and Cloeckaert A. 2001. Molecular tools for the characterization of antibiotic-resistant bacteria. Veterinary Research, 32:363-380.
Agerso Y., Peirano G. and Aarestrup F. M. 2006. dfrA25, a novel trimethoprim
resistance gene from Salmonella Agona isolated from a human urine sample in Brazil. Journal of Antimicrobial Chemotherapy, 58:1044-1047.
Ahmed A. M., Nakano H. and Shimamoto T. 2005. Molecular characterization of
integrons in non-typhoid Salmonella serovars isolated in Japan: description of an unusual class 2 integron. Journal of Antimicrobial Chemotherapy, 55:371-374.
Alcaine S. D., Warnick L. D. and Wiedmann M. 2007. Antimicrobial resistance in
nontyphoidal Salmonella. Journal of Food Protection, 70:780-790. Ambler R. P. 1980. The structure of beta-lactamases. Philos Trans R Soc Lond B
Biol Sci., 289:321-331. Anderson E. S., Ward L. R., de Saxe M. J. and de Sa J. D. H. 1977. Bacterophage
typing designations of Salmonella typhimurium. Journal of Hygiene, 78: 297-300.
Anğ-Küçüker M., Tolun V., Helmuth R., Rabsch W., Büyükbaba-Boral Ö.,
Törümküney-Akbulut D., Susever S. and Anğ Ö. 2000. Clinical Microbiology and Infection, 6:593-599.
Anon. BS EN ISO 6579:2002(E). Microbilogy of food and animal feeding stuffs -
Horizontal method for the detection of Salmonella spp.

119
Batchelor M., Hopkins K., Threlfall E. J., Clifton-Hadley F. A., Stallwood A. D., Davies R. H. and Liebana E. 2005. blactx-m genes in clinical Salmonella isolates recovered from humans in England and Wales from 1992 to 2003. Antimicrobial Agents and Chemotherapy, 49, 1319-1322.
Boyd D., Peters G. A., Cloeckaert A., Boumedine K. S., Chaslus-Dancla E.,
Imberehcts H. and Mulvey M. R. 2001. Complete nucleotide sequence of a 43-kilobase genomic island associated with the multidrug resistance region of Salmonella enterica serovar Typhimurium DT104 and its identification in phage type DT120 and serovar Agona. Journal of Bacteriology, 183:5725-5732.
Boyd D., Cloeckaert A., Chaslus-Dancla E., and Mulvey M. R. 2002.
Characterization of variant Salmonella genomic island 1 multidrug resistance region from serovars Typhimurium DT104 and Agona. Antimicrobial Agents and Chemotherapy, 46:1714-1722.
Brenner F. W., Villar R. G., Angulo F. J., Tauxe R. And Swaminathan B. 2000.
Salmonella nomenclature. Journal of Clinical Microbiology, 38:2465-2467.
Briggs C. E. and Fratamico P. M. 1999. Molecular characterization of an antibiotic
resistance gene cluster of Salmonella Typhimurium DT104. Antimicrobial Agents and Chemotherapy, 43:846-849.
Bush K., Jacoby G. A. and Medeiros A. A. 1995. A functional classification scheme
for beta-lactamases and its correlation with molecular structure. Antimicrobial Agents and Chemotherapy, 39:1211-1233.
Carattoli A. 2001. Importance of integrons in the diffusion of resistence. Veterinary
Research, 32:243-259. Carattoli A., Bertini A., Villa L., Falbo V., Hopkins K. and Threlfall E. J. 2005.
Identification of plasmids by PCR-based replicon typing. Journal of Microbiological Methods, 63:219-228.
Carattoli A, Miriagou V, Bertini A, Loli A, Colinon C, Villa L, Whichard J. M and
Rossolini G. M. 2006. Replicon typing of plasmids encoding resistance to newer beta-lactams. Emerging Infectious Diseases, 12:1145-1148.

120
Chen Y. T., Shu H. Y., Li L. H., Liao T. L., Wu K. M., Shiau Y. R., Yan J. J., Su I. J., Tsai S. F., Lauderdale T. L. 2006. Complete nucleotide sequence of pK245, a 98-kilobase plasmid conferring quinolone resistance and extended-spectrum-beta-lactamase activity in a clinical Klebsiella pneumoniae isolate. Antimicrobial Agents and Chemotherapy, 50:3861-3866
Clinical and Laboratory Standards Institute (CLSI, formerly NCCLS). 2006.
Methods for dilution antimicrobial susceptibility tests for bacteria that grow aerobically; approved standard – seventh edition (M7-A7), Vol 26, No. 2.
Cloeckaert A. and Chaslus-Dancla E. 2001. Mechanisms of quinolone resistance in
Salmonella. Veterinary Research, 32:291-300. Doublet B., Lailler R., Meunier D., Brisabois A., Boyd D., Mulvey M. R., Chaslus-
Dancla E. and Cloeckaert A. 2003. Variant Salmonella genomic island 1 antibiotic resistance gene clusters in Salmonella enterica serovar Albany. Emerging Infectious Diseases, 9:585-591.
Doublet B., Butaye H., Imberechts H., Boyd D., Mulvey M. R., Chaslus-Dancla E.
and Cloeckaert A. 2004a. Salmonella genomic island 1 multidrug resistance gene clusters in Salmonella enterica serovar Agona isolated in Belgium in 1992 to 2002. Antimicrobial Agents and Chemotherapy, 48:2510-2517.
Doublet B., Weill F. X., Fabre L., Chaslus-Dancla E. and Cloeckaert A. 2004b.
Variant Salmonella genomic island 1 antibiotic resistance gene clusters containin a novel 3'-N-aminoglycoside acetylttransferase gene cassette, acc(3)-ld, in Salmonella enterica serovar Newport. Antimicrobial Agents and Chemotherapy, 48:3806-3812.
Doublet B., Boyd D., Mulvey M. R. and Clockeckaert A. 2005. The Salmonella
genomic island is an integrative mobilizable element. Molecular Microbiology, 55:1911-1924.
Ebner P. K., garner K. and Mathew A. 2004. Class 1 integrons in various Salmonella
enterica serovars isolated from animals and identificaiton of genomic island SGI1 in Salmonella enterica var. Meleagridis. Journal of Antimicrobial Agents and Chemotherapy, 53:1004-1009.

121
Edwards R. A., Olsen G. J. and Maloy S. R. 2002. Comparative genomics of closely related salmonellae. TRENDS in Microbiology, 10:94-99.
Enright M. C. and Spratt B. G. 1999. Multilocus sequence typing. Trends in
Microbiology, 7:482-487. Erdem B., Ercis S., Hasçelik G., Gür D., Gedikoğlu S., Aysev A. D., Sümerkan B.,
Tatman-Otkun M. and Tuncer I. 2005. European Journal of Clinical Microbiology and Infectious Disease, 24:220-225.
Erol Đ. 1999. Hayvansal gıdalardan kaynaklanan Salmonella infeksiyonları.
Đnfeksiyon Dergisi, 13:123-127. Fluit A. C. 2005. Towards more virulent and antibiotic-resistant Salmonella? FEMS
Immunology and Medical Microbiology, 43:1-11. Furuya E. Y. and Lowy F. D. 2006. Antimicrobial-resistant bacteria in the
community setting. Nature Reviews Microbiology, 4:36-45. Gay K., Robicsek A., Strahilevitz J., Park C. H., Jacoby G., Barrett T. J., Medalla F.,
Chiller T. M. and Hooper D. C. 2006. Plasmid mediated quinolone resistance in non-typhi serotypes of Salmonella enterica. Clinical Infectious Diseases, 43: 297-304.
Giannella R. A. 1996. Salmonella. In: Baron S. (eds.), Medical Microbiology.
Galveston, University of Texas Medical Branch [Internet: URL: http://www.ncbi.nlm.nih.gov/books/bv.fcgi?rid=mmed.chapter.1221/ Available at the NCBI homepage].
Goncagül G., Günaydın E. and Carlı K. T. 2005. Prevalence of Salmonella
serogroups in chicken meat. Turkish Journal of Veterinary and Animal Sciences, 29:103-106.
Guerra B., Junker E. and Helmuth R. 2004a. Incidence of the recently described
sulfonamide resistance gene sul3 among German Salmonella enterica strains isolated from livestock and food. Antimicrobial Agents and Chemotherapy, 48:2712-2715.

122
Guerra B., Junker E., Miko A., Helmuth R. and Mendoza M. C. 2004b. Characterization and localization of drug resistance determinants in multi-resistant, integron carrying Salmonella enterica serotype Typhimurium strains. Microbial Drug Resistance-Mechanisms Epidemiology and Disease, 10: 83-91.
Guerra B., Malorny B., Schroeter A. and Helmuth R. 2003. Multiple resistance
mechanisms in fluoroquinolone-resistant Salmonella isolates from Germany. Antimicrobial Agents and Chemotherapy, 47, 2059.
Guerra B., Schrors P. And Mendoza M. C. 2000a. Application of PFGE performed
with XbaI to an epidemiological and phylogenetic study of Salmonella serotype Typhimurium. Relations between genetic types and phage types. Microbiologica, 23:11-20.
Guerra B., Soto S. M., Arguelles J. M. and Mendoza M. C. 2001. Multidrug
resistance is mediated by large plasmids carrying a class 1 integron in the emergent Salmonella enterica serotype [4,5,12:i:-]. Antimicrobial Agents and Chemotherapy, 45:1305-1308.
Guerra B., Soto S., Cal S. and Mendoza M. C. 2000b. Antimicrobial resistance and
spread of class 1 integrons among Salmonella serotypes. Antimicrobial Agents and Chemotherapy, 44, 2166-2169.
Guerra B., Soto S., Helmuth R. and Mendoza M. C. 2002. Characterization of a self-
transferable plasmid from Salmonella enterica serotype Typhimurium clinical isolates carrying two integron gene cassettes together with virulence and drug resistance genes. Antimicrobial Agents and Chemotherapy, 46: 2977-2981.
Hall R. M. and Collis C. M. 1998. Antibiotic resistance in gram-negative bacteria:
the role of gene cassettes and integrons. Drug Resistance Updates, 1:109-119.
Hata M., Suzuki M., Matsumoto M., Takahashi M., Sato K., Ibe S. and Sakae K.
2005. Cloning of a novel gene for quinolone resistance from a transferable plasmid in Shigella flexneri 2b.Antimicrobial Agents and Chemotherapy, 49:801-803.

123
Helms M., Ethelberg S., Molbak K. and the DT104 Study Group. 2005. International Salmonella Typhimurium DT104 Infections, 1992–2001. Emerging Infectious Diseases, 11:859-867.
Helmuth R. 2000. Antibiotic resistance in Salmonella. In: Wray C. and Wray
A.(eds.), Salmonella in Domestic Animals. CABI Publishing, CAB International, Wallingford/UK, pp. 89-106.
Helmuth R., Stephan R., Bunge C., Hoog B., Steinbeck A. and Bulling E. 1985.
Epidemiology of virulence-associated plasmids and outer memrane protein pattenrs within seven common Salmonella serotypes. Infection and Immunity, 48: 175-182.
Herschleb J., Ananiev G. and Schwartz D. C. 2007. Pulsed-field gel electrophoresis.
Nature Protocols, 2:677-684. Hochnut B., Lotfi Y., Mazel D.,Faruque S. M., Woodgate R. and Waldor M. K.
2001. Molecular analysis of antibiotic resistance gene clusters in Vibrio choleraeO139 and O1 SXT constins. Antimicrobial Agents and Chemotherapy, 45:2991-3000.
Hohmann E. L. 2001. Nontyphoidal Salmonellosis. Food Safety, 32:263-269. Holt K. E., Thomson N. R., Wain J., Phan M. D., Nair S., Hasan R., Bhutta Z. A.,
Quail M. A., Norbertczak H., Walker D., Dougan G., Parkhill J. 2007. Multidrug resistant Salmonella enterica serovar paratyphi A harbors IncHI1 plasmids similar to those found in serovar typhi. Journal of Bacteriology, 189:4257-4264.
Hopkins K. L., Wootton L., Day M. R. and Threlfall E. J. Plasmid mediated
quinolone resistance determinant qnrS1 found in Salmonella enterica strains isolated in the UK. Journal of Antimicrobial Chemotherapy, 59:1071-1075.
Huovinen P., Sundstöm L., Swedberg G. and Sköld O. 1995. Trimethoprim and
sulfonamide resistance. Antimicrobial Agents and Chemotherapy, 39:279-289.

124
Jacoby G. A., Walsh K. E., Mills D. M., Walker V. J., Oh H., Robicsek A. and Hooper D. 2006. qnrB, another plasmid-mediated gene for quinolone resistance. Antimicrobial Agents and Chemotherapy, 50, 1178-1182.
Kado C. I. and Liu S. T. 1981. Rapid procedure for detection and isolation of large
and small plasmids. Journal of Bacteriology, 145: 1365-1373. Katayama Y., Ito T. and Hiramatsu K. 2000. A new class of genetic element,
staphlococcus cassette chromosome mec, encodes methicillin resistance in Staphylococcus aureus. Antimicrobial Agents and Chemotherapy, 44:1549-1555.
Kehrenberg C., Friederichs S., de Jong A., Michael G. B. and Schwarz S. 2006.
Identification of the plasmid-borne quinolone resistance gene qnrS in Salmonella enterica serovar Infantis. Journal of Antimicrobial Chemotherapy, 58:18-22.
Kehrenberg C., Hopkins K. L., threlfall E. J. and Schwarz S. 2007. Complete
nucleotide sequence of a small qnrS1 carrying plasmid from Salmonella enterica subsp. enterica Typhimurium DT193. Journal of Antimicrobial Chemotherapy, In press.
Kılınç Ü. and Aydın F. 2006. Kayseri yöresindeki tavukçuluk işletmelerinden
toplanan tavuklardan izole edilen Salmonella türlerinin antibiyotiklere duyarlılıkları. Sağlık Bilimleri Dergisi (Journal of Health Sciences), 15:35-40.
Küplülü Ö. 1999. Sığır karkaslarında Salmonella kontaminasyonu ve serotip
dağılımı. Ankara Üniversitesi Veteriner Fakültesi Dergisi, 46:25-34. Le Minor L. 1984. Facultative anaerobic gram-negative rods. In: Holt J. G. and Krieg
N. R. (eds.), Bergey's Manual of Systematic Bacteriology. Williams and Wilkins, Baltimore, 9th edition, vol:1, pp. 427-458.
Li X.-Z., Mehrotra M., Ghimire S. and Adewoye L. 2007. Beta-lactam resistance and
Beta-lactamases in bacteria of animal origin. Veterinary Microbiology, 121:197-214.

125
Lindsay E. A., Lawson A. J., Walker R. A., Ward L. R., Smith H.R., Scot F. W., O'Brien S. J. O., Fisher I. S. T., Crook P. D., Wilson D., Brown D. J., Hardadottir H., Wannet W. J. B., Tschape H. and Threlfall E. J. 2002. Role of electronic data exchange in an international outbreak caused by Salmonella serotype Typhimurium DT204b. Emerging Infectious Diseases, 8:732-734.
Lindstedt B. A., Heir E., Nygard I. and Kapperud G. 2003. Characterization of class I
integrons in clinical strains of Salmonella enterica subsp. enterica serovar Typhimurium and Enteritidis from Norwegian hospitals. Journal of Medical Microbiology, 52:141-149.
Livermore D. M., Canton R., Gniadkowski M., Nordmann P., Rossolini G. M., Arlet
G., Ayala J., Coque T. M., Kern-Zdanowicz I., Luzzaro F., Poirel L. and Woodford N. 2007. CTX-M: Changing the face of ESBLs in Europe. Journal of Antimicrobial Chemotherapy, 59:165-174.
Lukinmaa S., Nakari U.-M., Eklund M. and Siitonen A. 2004. Application of
molecular genetic methods in diagnostics and epidemiology of food-borne bacterial pathogens. APMIS, 112:908-29.
Malorny B., Schroeter A., Guerra B. and Helmuth R. 2003. Incidence of quinolone
resistance in strains of Salmonella isolated from poultry, cattle and pigs in Germany between 1998 and 2001. The Veterinary Record, 22, 643-648.
Martinez N., Mendoza M. C. Guerra B., Gonzalez-Hevia M. A. and Rodicio M. R.
2005. Genetic basis of antimicrobial resistance in clinical isolates of Salmonella enterica serotype Hadar from a Spanish region. Microbial Drug Resistance-Mechanisms Epidemiology and Disease, 11:185-193.
Mazel D. 2006. Integrons: agents of bacterial evolution. Nature reviews
Microbiology, 4:608-620. McClelland M., Sanderson K. E., Spieth J., Clifton S. W., Latreille P., Courtney L.,
Porwollik S., Ali J., Dante M., Du F., Hou S., Layman D., Leonard S., Nguyen C., Scott K., Holmes A., Grewal N., Mulvaney E., Ryan E., Sun H., Florea L., Miller W., Stoneking T., Nhan M., Waterson R. and Wilson R. K. 2001. Complete genome sequence of Salmonella enterica serovar Typhimurium LT2. Nature, 413:852-856.

126
Meunier D., Boyd D., Mulvey M. R., Baucheron S., Mammina C., Nastasi A., Chaslus-Dancla E. and Cloeckaert A. 2002. Salmonella enterica serotype Typhimurium DT104 antibiotic resistance genomic island I serotype Paratyphi B. Emerging Infectious Diseases, 8:430-433.
Mmolawa P. T., Willmore R., Thomas C. J. and Heuzenroeder M. W. 2002.
Temperate phages in Salmonella enterica serovar Typhimurium: implications for epidemiology. International Journal of Medical Microbiology, 291:633-644.
Mulwey M. R., Boyd D. A., Olson A. B., Doublet B. and Cloeckaert A. The genetics
of Salmonella genomic island 1. Microbes and Infection, 8:1915-1922.
Nògràdy N., Tòth A., Kostyàk A., Pàszti J. and Nagy B. 2007. Emergence of
multidrug resistant clones of Salmonella Infantis in broiler chickens and humans in Hungary.
Olive D. M. and Bean P. 1999. Principles and applications of methods for DNA-
based typing of microbial organisms. Journal of Clinical Microbiology, 37:1661-1669.
Olsen J. E. 2000. Molecular typing of Salmonella. In: Wray C. and Wray A. (eds.),
Salmonella in Domestic Animals. CABI Publishing, CAB International, Wallingford/UK, pp. 429-446.
Orman B. E., Pineiro S. A., and Arduino S. 2002. Evolution of multi-resistance in
non-typhoidal Salmonella serovars from 1984 to 1998 in Argentina. Antimicrobial Agents and Chemotherapy 46:3963-3970.
Partridge S. R., Brown H. J., Stokes H. W. And Hall R. M. 2001. Transposons
Tn1696 and Tn21 and their integrons In4 and In2 have independent origins. Antimicrobial Agents and Chemotherapy, 45:1263-1270.
Perreten V. and Boerlin P. 2003. A new sulfonamide resistance gene (sul3) in E. coli
is widespread in the pig population of Switzerland. Antimicrobial Agents and Chemotherapy, 47:1169-1172.

127
Poirel L, Leviandier C, Nordmann P. Prevalence and genetic analysis of plasmid mediated quinolone resistance determinants qnrA and qnrS in Enterobacteriaceae in a French University Hospital. Antimicrobial Agents Chemotherapy 2006; 50: 3992-3997.
Pokharel B. M., Koirala J., Dahal R. K., Mishra S. K., Khadga P. K. and Tuladhar N.
R. 2006. Multidrug resistant and extended spectrum beta-lactamase (ESBL)-producing Salmonella enterica (serotypes Typhi and Paratyphi A) from blood isolates in Nepal: surveillance of resistance an a search for newer alternatives. International Journal of Infectious Disease, 10:434-438.
Poppoff M. Y. and Le Minor L. 2001. Kauffmann-White Scheme. WHO
Collaborating Centre for Reference and Research on Salmonella, Institut Pasteur, Paris, France.
Porwollik S. and McClelland M. 2003. Lateral gene transfer in Salmonella. Microbes
and Infection, 5:977-989. Rabsch W., Mirols S., Hard W. D. and Tschape H. 2002. The dual role of wild
phages for horizontal gene transfer among Salmonella strains. Berliner und Münchener Tierarztliche Wochenschrift, 115:335-359.
Randall L. P., Cooles S. W., Osborn M. K., Piddock L. J. V. and Woodward M. J.
2004. Antibiotic resistance genes, integrons and multiple antibiotic resistance in thirty-five serotypes of Salmonella enterica isolated from humans and animals in the UK. Journal of Antimicrobial Chemotherapy, 53:208-216.
Recchia G. D. and Hall R. M. 1995. Gene cassettes: a new class of mobile element.
Microbiology, 141:3015-3027. Riley L. W. 2004. Molecular epidemiology of infectious diseases: principles and
practices. ASM Press, Washington, p.337. Robicsek A., Jacoby G. A. and Hooper D. C. 2006. The worldwide emergence of
plasmid mediated quinolone resistance. Lancet Infectious Diseases, 6:629-640.

128
Rowe-Magnus D. A. and Mazel D. 2002. The role of integrons in antibiotic resistance gene capture. International Journal of Medical Microbiology, 292:115-125.
Rychlik I., Gregorova D. and Hradecka H. 2006. Distribution and function of
plasmids in Salmonella enterica. Veterinary Microbiology, 112:1-10. Sambrook J., Fritsch E. F. and Maniatis T. 1989. Molecular cloning. A Laboratory
Manual. 2nd edition. Cold Spring Harbor Laboratory Press, Cold Spring Harbor, NY.
Schroeter A., Ward L. R., Rowe B., Protz D., Hartung M. and Helmuth R. 1994.
Salmonella Enteritidis phage types in Germany. European Journal of Epidemiology, 10:645-648.
Schroeter A., Hoog B., and Helmuth R. 2004. Resistance of Salmonella isolates in
Germany. Journal of Veterinary Medicine Series B, 51:389-392. Schwarz S. and Chaslus-Dancla E. 2001. Use of antimicrobials in veterinary
medeicine and mechanisms of resistance. Veterinary Research, 32:201-225.
Schwarz S., Cloeckaert A.and Roberts M. C. 2006. Mechanisms and spread of
bacterial resistance to antimicrobial agents. In: Aarestrup F. M. (eds.), Antimicrobial resistance in bacteria of animal origin. ASM Press, Washington D. C., pp.73-98.
Selander R. K., Li J. and Nelson K. 1996. Evolutionary genetics of Salmonella
enterica. In: Neidhardt F. C. (eds.), Escherichia coli and Salmonella - Cellular and Molecular Biology. ASM Press, Washington D. C., pp.2691-2707.
Serdaroğlu E., Ersoy B., Atlıhan F., Aydoğan A., and Serçin B. 1996. Salmonella
infeksiyonlu 127 olgunun değerlendirilmesi. Đnfeksiyon Dergisi, 10:333-336.

129
Shelobolina E. S., Sullivan S. A., O'Neill K. R., Nevin K. P. and Lovely D. R. 2004. Isolation, characterization, and U(VI)-reducing potential of a facultatively anaerobic, acid-resistant bacterium from low-pH, nitrate- and U(VI)-contaminated subsurface sediment and description of Salmonella subterranea sp. nov. Applied and Environmental Microbiology, 70:2959-2965.
Singh B. R., Singh P., Agrawal S., Teotia U., Verma A., Sharma S., Chandra M.,
Babu N. and Kant Agarwal R. Prevalence of multidrug resistant Salmonella in Corindare, mint, carrot, and raddish in Bareilly and Kanpur, Northern India. Foodborne Pathogens and Disease, 4:233-240.
Smith R. D. and Coast J. 2002. Antimicrobial resistance: a global response. Bulletin
of the World Health Organization, 80:126-133. Sørum H. and L’Abée-Lund T. M. 2002. Antibiotic resistance in food related
bacteria—a result of interfering with the global web of bacterial genetics. International Journal of Food Microbiology, 78:43-56.
Sturenburg E. and Mack D. 2003. Extended spectrum beta-lactamases: implications
for the clinical microbiology laboratory, therapy, and infection control. Journal of Infection, 47:273-295.
Tenover F. C. Arbeit R. D., Goering R. V., Mickelsen P. A., Murray B. E., Persing
D. H. and Swaminathan B. 1995. Interpreting chromosomal DNA restriction patterns produced by pulsed-field gel electrophoresis: criteria for bacterial strain typing. Journal of Clinical Microbiology, 33:2233-2239.
Tindall B. J., Grimont P. A. D., Garrity G. M. and Euzeby J. P. 2005. Nomenclature
and taxonomy of the genus Salmonella. International Journal of Systematic and Evolutionary Microbiology, 55:521-524.
Threlfall E. J., Frost J. A., Ward L. R. and Rowe B. 1994. Epidemic in cattle and
humans of Salmonella Typhimurium DT104 with chromosomally integrated multiple drug resistance. Veterinary Record, 134:577.

130
Tükel Ç., Raffatellu M., Humphries A. D., Wilson R. P., Andrews-Polymenis H. L., Gull T., Figueiredo J. F., Wong M. H., Michelsen K. S., Akçelik M. and Baumler A. 2005. CsgA is a pathogen associated molecular pattern of Salmonella enterica serotype Typhimurium that is recognized by Toll-like receptor 2. Molecular Microbiology, 58:289-304.
Tükel Ç., Raffatellu M., Chessa D., Wilson R. P., Akçelik M. and Baumler A. J.
2006. Neutrophil influx during non-typhoidal salmonellosis: who is in the driver's seat? FEMS Immunology and Medical Microbiology, 46:320-329.
Tükel Ç., Akçelik M., de Jong M. F. Şimşek Ö., Tsolis R. M. And Baumler A. J.
2007. MarT activates expression of the MisL autotransporter protein of Salmonella enterica serotype Typhimurium. Journal of Bacteriology, 189:3922-3926.
Uzzau S., Brown D. J., Wallis T., Rubino S., Leori G., Bernard S., Casadesus J., Platt
D. J. and Olsen J. E. 2000. Host adapted serotypes of Salmonella enterica. Epidemiology of Infection, 125:225-229.
Validation List No:102. 2005. Validation of publication of new names and new
combinations previously effectively published outside the IJSEM. International Journal of Systemic and Evolutionary Microbiology, 55:547-549.
Velge P., Cloeckaert A. and Barrow P. 2005. Emergence of Salmonella epidemics:
The problems related to Salmonella enterica serotype Enteritidis and multiple antibiotic resistance in other major serotypes. Veterinary Research, 36:267-288.
Walker R. A., Lindsay E., Woodward M. J., Ward L. R. and Threlfall E. J. 2001.
Variation in clonality and antibiotic resistance genes among multiresistant Salmonella enterica serotype Typhimurium phage type U302 (MR U302) from humans, animals, and foods. Microbiological Drug Resistance, 7:13-21.
Walsh C. 2003. Antibiotics: Actions, origins, resistance. 345pp. ASM Press,
Washington, DC.

131
Wang M., Tran J. H., Jacoby G. A., Zhang Y., Wang F., Hooper D. C. 2003. Plasmid mediated quinolone resistance in clinical isolates of E. coli from Shangai, China. Antimicrobial Agents and Chemotherapy, 47, 2242-2248.
Ward L. R., de Sa J. D. H. and Rowe B. 1987. A phage typing scheme for
Salmonella enteritidis. Epidemiology and Infection, 99: 291-294. Waturangi D. E., Schwarz S., Suwanto A., Kehrenberg C. and Erdelen W. 2003.
Identification of a truncated Tn1721-like transposon located on a small plasmid of Escherichia coli isolated from Varanus indicus. Journal of Veterinary Medicine B Infenctious Disesases and Veterinary Public Health, 50:86-89.
White D. G., Zhao S., Sudler R., Ayers S., Friedman S., Chen S., McDermott P.F.,
McDermott S., Wagner D. D. and Meng J. 2001. The isolation of antibiotic resistant Salmonella from retail ground meat. New England Journal of Medicine, 345:1147-1154.
Yan S. S., Pendrak M. L., Abela-Ridder B., Punderson J. W., Fedorko D. P. and
Foley S. L. 2003 An overview of Salmonella typing public health concern. Clinical and Applied Immunology Reviews, 4:189-204.
Yazıcıoğlu N., Kaya K., Ayaz Y., Şen S., Özkök S., Aksoy M., Yavuz M. K., Kaplan
Y. Z., Tunca Ş. T., Vural Ş., Evgin N., Karakoç S. R., Miroğlu M. and Turut N. 2005. Kanatlı kesimhanelerinin parçalama ünitelerinden alınan boyun ve kanat örneklerinden Salmonella izolasyonu, serotiplendirilmesi ve antibiyotik dirençliliğin araştırılması. Etlik Veteriner Mikrobiyoloji Dergisi, 16:23-36.
Zhao S., Qaiyumi S., Friedman S., Singh R., Foley S. L., White D. G., McDermott P.
F., Donkar T., Bolin C., Munro S., Baron E. J. and Walker R. D. 2003. Characterization of Salmonella enterica serotype Newport isolated from human and food animals. Journal of Clinical Microbiology, 41:5366-5371.
Zhao S., McDermott P. F., White D. G., Qaiyumi S., Friedman S. L., Abbott J. W.,
Glenn A., Ayers S. L., Post K. W., Fales W. H., Wilson R. B., Reggiardo C. and Walker R. D. 2007. Characterization of multidrug resistant Salmonella recovered from diseased animals. Veterinary Microbiology, 123:122-132.

132
WEB REFERENCES
http://www.cdc.gov/ncidod/dbmd/phlisdata/salmtab/2005/SalmonellaAnnualSummary2005.pdf http://www.cdc.gov/pulsenet/protocols/ecoli_salmonella_shigella_protocols.pdf http://www.chembio.uoguelph.ca/merrill/research/enzyme_mechanisms. html http://www.hpa.org.uk/hpa/inter/enter-net/07q1summ.pdf http://www.hpa.org.uk/hpa/inter/enter-net_menu.htm http://www.ncbi.nlm.nih.gov/BLAST/ http://www.who.int/salmsurv/links/GSSProgressReport2005.pdf

133
APPENDIX I

134
Table A.I.1. Antimicrobial disks and their contents used in the study (Oxoid Ltd.,
UK).
Antibiotic (Symbol) Disk Content (µg)
Ampicillin (AMP) 10
Amoxicillin/clavulanic acid (AMC) 30
Chloramphenicol (CHL) 30
Florfenicol (FFC) 30
Ceftiofur (EFT) 30
Kanamycin (KAN) 30
Neomycin (NEO) 10
Gentamicin (GEN) 10
Nalidixic acid (NAL) 30
Ciprofloxacin (CIP) 5
Tetracycline (TET) 30
Spectinomycin (SPT) 10
Sulfonamides (SUL) 300
Trimethoprim (TMP) 5
Trimethoprim/sulfamethoksazol
1:19 (SXT)
25
Streptomycin (STR) 10
Ceftazidime (CAZ) 10
Cefotaxime (CTX) 30
Cefoxitine (FOX) 30
Ceftriaxone (CRO) 5
Cefuroxime (CXM) 30
Aztreonam (ATM) 30
Imipenem (IMP) 10
Cefpodoxime (CPD) 10

135
Table A.I.2. Antimicrobial content of microtiter plates used in the analyses of minimal inhibitory concentration. 1 2 3 4 5 6 7 8 9 10 11 12
A CIP 4µµµµg/mL
SPE 128µµµµg/mL
NAL 128µµµµg/mL
AMP 32µµµµg/mL
CHL 64µµµµg/mL
FFC 64µµµµg/mL
GEN 32µµµµg/mL
NEO 32µµµµg/mL
AMC 32/16µµµµg/mL
TET 32µµµµg/mL
STR 64µµµµg/mL
SUL 512µµµµg/mL
B CIP 2µµµµg/mL
SPE 64µg/mL
NAL 64µµµµg/mL
AMP 16µg/mL
CHL 32µµµµg/mL
FFC 32µµµµg/mL
GEN 16µµµµg/mL
NEO 16µµµµg/mL
AMC 16/8µg/mL
TET 16µµµµg/mL
STR 32µµµµg/mL
SUL 256µg/mL
C CIP 1µg/mL
SPE 32µg/mL
NAL 32µµµµg/mL
AMP 8µg/mL
CHL 16µg/mL
FFC 16µg/mL
GEN 8µg/mL
NEO 8µg/mL
AMC 8/4µg/mL
TET 8µg/mL
STR 16µg/mL
SUL 128µg/mL
D CIP 0.5µg/mL
SPE 16µg/mL
NAL 16µg/mL
AMP 4µg/mL
CHL 8µg/mL
FFC 8µg/mL
GEN 4µg/mL
NEO 4µg/mL
AMC 4/2µg/mL
TET 4µg/mL
STR 8µg/mL
SUL 64µg/mL
E CIP 0.25µg/mL
SPE 8µg/mL
NAL 8µg/mL
AMP 2µg/mL
CHL 4µg/mL
FFC 4µg/mL
GEN 2µg/mL
NEO 2µg/mL
AMC 2/1µg/mL
TET 2µg/mL
STR 4µg/mL
SUL 32µg/mL
F CIP 0.12µg/mL
SPE 4µg/mL
NAL 4µg/mL
AMP 1µg/mL
CHL 2µg/mL
FFC 2µg/mL
GEN 1µg/mL
TMP 4µg/mL
TMP 8µg/mL
TMP 16µµµµg/mL
TMP 32µµµµg/mL
POS 0
G CIP 0.06µg/mL
SPE 2µg/mL
COL 4µg/mL
COL 8µg/mL
COL 16µµµµg/mL
COL 32µµµµg/mL
COL 64µµµµg/mL
SXT 1/19µg/mL
SXT 2/38µg/mL
SXT 4/76µµµµg/mL
SXT 8/152µµµµg/mL
POS 0
H CIP 0.03µg/mL
EFT 0.5µg/mL
EFT 1µg/mL
EFT 2µg/mL
EFT 4µg/mL
EFT 8µµµµg/mL
KAN 4µg/mL
KAN 8µg/mL
KAN 16µg/mL
KAN 32µg/mL
KAN 64µµµµg/mL
NEG 0
The cells written in bold face letters indicate Resistance, underlined letters Intermediate, and normal typing letters Susceptible concentrations
of antimicrobials according to CLSI breakpoints.
AMP: Ampicillin; AMC: Amoxicillin/clavulonic acid; CIP: Ciprofloxacin; COL: Colistin; CHL: Chloramphenicol; EFT: Ceftiofur;
FFC: Florfenicol; GEN: Gentamicin; KAN: Kanamycin; NEO: Neomycin; NAL: Nalidixic acid; STR Streptomycin; SPE: Spectinomycin;
SUL: Sulfonamides; TET: Tetracycline; TMP: Trimethoprim; SXT: Sulfamethoxazol/Trimethoprim; POS: Positive control; NEG: Negative
control.

136
Table A.I.3. Isolation material, date, place and results.
Sample Code
Isolation Place
Isolation Date
Isolation Material
Result
DC1 Uşak 07.11.2005 Calf liver - UTT2 Ankara-Ulus 19.10.2005 Chicken gizzard + UTT1 Ankara-Ulus 19.10.2005 Chicken gizzard + UTT5 Ankara-Dikmen 29.10.2005 Chicken gizzard - UTT6 Ankara-Balgat 29.10.2005 Chicken gizzard - UTT7 Ankara-Ulus 15.11.2005 Chicken gizzard + UTT8 Ankara-Ulus 15.11.2005 Chicken gizzard + UTT10 Ankara-Ulus 25.01.2006 Chicken gizzard + UTT9 Ankara-Ulus 25.01.2006 Chicken gizzard + UTT11 Ankara-Ulus 28.01.2006 Chicken gizzard - UTT12 Ankara-Ulus 28.01.2006 Chicken gizzard - UTT4 Ankara-Ulus 19.10.2005 Chicken gizzard + TB3 Ankara-Kızılay 09.11.2005 Chicken leg + TB7 Ankara-Maltepe 11.11.2005 Chicken leg + TB4 Ankara-Balgat 09.11.2005 Chicken leg + TB5 Ankara-Balgat 11.11.2005 Chicken leg + TB6 Ankara-Maltepe 11.11.2005 Chicken leg + TB8 Ankara-Ulus 15.11.2005 Chicken leg + TB12 Ankara-Ulus 25.01.2006 Chicken leg - TB13 Ankara-Ulus 25.01.2006 Chicken leg - TB9 Ankara-Ulus 15.11.2005 Chicken leg + TB10 Ankara-Kızılay 20.01.2006 Chicken leg - TB11 Ankara-Kızılay 20.01.2006 Chicken leg - UC10 Ankara-Maltepe 11.11.2005 Chicken liver + UC14 Ankara-Ulus 25.01.2006 Chicken liver + UC1 Ankara-Ulus 12.09.2005 Chicken liver + UC2 Ankara-Ulus 04.10.2005 Chicken liver + UC3 Ankara-Ulus 04.10.2005 Chicken liver + UC4 Ankara-Ulus 15.10.2005 Chicken liver + UC5 Ankara-Ulus 15.10.2005 Chicken liver + UC6 Ankara-Dikmen 29.10.2005 Chicken liver - UC7 Ankara-Dikmen 29.10.2005 Chicken liver - UC8 Uşak 07.11.2005 Chicken liver + UC11 Ankara-Ulus 15.11.2005 Chicken liver - UC12 Ankara-Ulus 15.11.2005 Chicken liver - UC13 Ankara-Ulus 25.01.2006 Chicken liver + UH1 Ankara-Ulus 23.11.2005 Chicken meat (breast) + UTG1 Ankara-Söğütözü 01.11.2005 Chicken meat (breast) + UTG3 Ankara-Söğütözü 01.11.2005 Chicken meat (breast) + UYT1 Ankara-Ulus 05.09.2005 Chicken meat (mixed) + UYT2 Ankara-Ulus 05.09.2005 Chicken meat (mixed) + UTB2 Ankara-Ulus 19.10.2005 Chicken neck + UB7 Ankara-Ulus 28.01.2006 Chicken neck + TB15 Ankara-Ulus 28.01.2006 Chicken neck + UB8 Ankara-Ulus 28.01.2006 Chicken neck +

137
Table A.I.3. Isolation material, date, place and results (continued).
Sample Code
Isolation Place
Isolation Date
Isolation Material
Result
UB1 Ankara-Ulus 12.09.2005 Chicken neck + UB2 Ankara-Ulus 12.09.2005 Chicken neck + UB3 Ankara-Ulus 15.10.2005 Chicken neck - UB4 Ankara-Ulus 15.10.2005 Chicken neck - UTB1 Ankara-Ulus 19.10.2005 Chicken neck + TB1 Ankara-Söğütözü 01.11.2005 Chicken neck + UB5 Ankara-Ulus 15.11.2005 Chicken neck + TB14 Ankara-Ulus 28.01.2006 Chicken neck + TB2 Ankara-Söğütözü 01.11.2005 Chicken neck + UK2 Ankara-Ulus 05.09.2005 Chicken wing + UK5 Ankara-Ulus 27.09.2005 Chicken wing + UK7 Ankara-Ulus 27.09.2005 Chicken wing + BK1 Ankara-Blagat 26.08.2005 Chicken wing - UK1 Ankara-Ulus 05.09.2005 Chicken wing + UK3 Ankara-Ulus 15.09.2005 Chicken wing - UK4 Ankara-Ulus 15.09.2005 Chicken wing - UK8 Ankara-Ulus 04.10.2005 Chicken wing + UK10 Ankara-Tandoğan 10.10.2005 Chicken wing + UK12 Ankara-Ulus 15.10.2005 Chicken wing - UK13 Ankara-Balgat 29.10.2005 Chicken wing + UK14 Ankara-Söğütözü 01.11.2005 Chicken wing + UK15 Ankara-Söğütözü 01.11.2005 Chicken wing + UK17 Ankara-Kızılay 09.11.2005 Chicken wing + UK16 Ankara-Balgat 09.11.2005 Chicken wing + UK18 Ankara-Maltepe 11.11.2005 Chicken wing + UK20 Ankara-Ulus 15.11.2005 Chicken wing + UK19 Ankara-Ulus 15.11.2005 Chicken wing + UK22 Ankara-Ulus 23.11.2005 Chicken wing - UK21 Ankara-Maltepe 24.11.2005 Chicken wing - UK23 Ankara-Ulus 25.01.2006 Chicken wing - UK24 Ankara-Ulus 25.01.2006 Chicken wing - UK9 Ankara-Ulus 04.10.2005 Chicken wing + AS51 Ankara-Ulus 14.12.2005 Fresh cheese - AS52 Ankara-Ulus 14.12.2005 Fresh cheese - AS53 Ankara-Ulus 23.12.2005 Fresh cheese - UDK1 Ankara-Ulus 05.09.2005 Minced meat + UDK5 Ankara-Ulus 15.10.2005 Minced meat + UDK6 Ankara-Ulus 15.10.2005 Minced meat + UDK15 Ankara-Ulus 15.11.2005 Minced meat + UDK16 Ankara-Ulus 15.11.2005 Minced meat + UDK17 Ankara-Ulus 15.11.2005 Minced meat +

138
Table A.I.3. Isolation material, date, place and results (continued).
Sample Code
Isolation Place
Isolation Date
Isolation Material
Result
UDK18 Ankara-Ulus 15.11.2005 Minced meat + UDK26 Ankara-Ulus 14.12.2005 Minced meat + UDK27 Ankara-Ulus 14.12.2005 Minced meat + UDK43 Ankara-Ulus 07.02.2006 Minced meat + UDK29 Ankara-Ulus 14.12.2005 Minced meat + UDK44 Ankara-Ulus 07.02.2006 Minced meat + UDK45 Ankara-Ulus 07.02.2006 Minced meat + UDK35 Ankara-Ulus 23.12.2005 Minced meat + UDK37 Ankara-Ulus 25.01.2006 Minced meat + UDK2 Ankara-Ulus 05.09.2005 Minced meat + UDK3 Ankara-Tandoğan 10.10.2005 Minced meat + UDK4 Ankara-Tandoğan 10.10.2005 Minced meat + UDK7 Ankara-Dikmen 29.10.2005 Minced meat - UDK8 Ankara-Dikmen 29.10.2005 Minced meat - UDK9 Uşak 07.11.2005 Minced meat - UDK10 Ankara-Balgat 09.11.2005 Minced meat + UDK11 Ankara-Kızılay 09.11.2005 Minced meat - UDK12 Ankara-Balgat 11.11.2005 Minced meat + UDK13 Ankara-Balgat 11.11.2005 Minced meat - UDK14 Ankara-Ulus 15.11.2005 Minced meat - UDK19 Ankara-Ulus 29.11.2005 Minced meat - UDK20 Ankara-Ulus 29.11.2005 Minced meat + UDK21 Ankara-Ulus 29.11.2005 Minced meat - UDK22 Ankara-Ulus 01.12.2005 Minced meat - UDK23 Ankara-Ulus 01.12.2005 Minced meat - UDK24 Ankara-Ulus 01.12.2005 Minced meat + UDK25 Ankara-Ulus 01.12.2005 Minced meat - UDK28 Ankara-Ulus 14.12.2005 Minced meat - UDK30 Ankara-Ulus 23.12.2005 Minced meat - UDK31 Ankara-Ulus 23.12.2005 Minced meat - UDK32 Ankara-Ulus 23.12.2005 Minced meat - UDK33 Ankara-Ulus 23.12.2005 Minced meat + UDK34 Ankara-Ulus 23.12.2005 Minced meat - UDK36 Ankara-Kızılay 20.01.2006 Minced meat - UDK38 Ankara-Ulus 25.01.2006 Minced meat + UDK39 Ankara-Ulus 28.01.2006 Minced meat - UDK40 Ankara-Ulus 28.01.2006 Minced meat - UDK41 Ankara-Ulus 02.02.2006 Minced meat + UDK42 Ankara-Ulus 02.02.2006 Minced meat + UDK46 Ankara-Ulus 07.02.2006 Minced meat + KY1 Ankara-Tandoğan 10.10.2005 Ram's testicles + KY2 Ankara-Tandoğan 10.10.2005 Ram's testicles + AS9 Nevşehir-Avanos 15.09.2005 Raw Milk + AS13 Burdur-Varollar 22.09.2005 Raw Milk + AS20 Nevşehir-Acıgöl 13.10.2005 Raw Milk +

139
Table A.I.3. Isolation material, date, place and results (continued).
Sample Code
Isolation Place
Isolation Date
Isolation Material
Result
AS45 Nevşehir-Avanos 29.11.2005 Raw Milk + AS1 Nevşehir-Avanos 05.09.2005 Raw Milk - AS2 Nevşehir-Acıgöl 05.09.2005 Raw Milk + AS3 Burdur-Varollar 05.09.2005 Raw Milk - AS4 Nevşehir-Avanos 08.09.2005 Raw Milk - AS5 Nevşehir-Acıgöl 08.09.2005 Raw Milk - AS6 Antalya-Bozova 08.09.2005 Raw Milk - AS7 Nevşehir-Avanos 11.09.2005 Raw Milk - AS8 Nevşehir-Acıgöl 11.09.2005 Raw Milk - AS10 Nevşehir-Acıgöl 15.09.2005 Raw Milk - AS11 Ankara 15.09.2005 Raw Milk + AS12 Kayseri 15.09.2005 Raw Milk + AS14 Nevşehir-Avanos 22.09.2005 Raw Milk - AS15 Nevşehir-Avanos 03.10.2005 Raw Milk + AS16 Nevşehir-Acıgöl 03.10.2005 Raw Milk + AS17 Nevşehir-Avanos 10.10.2005 Raw Milk - AS18 Nevşehir-Acıgöl 10.10.2005 Raw Milk - AS19 Nevşehir-Avanos 13.10.2005 Raw Milk - AS21 Burdur-Varollar 13.10.2005 Raw Milk - AS22 Nevşehir-Avanos 19.10.2005 Raw Milk - AS23 Nevşehir-Acıgöl 19.10.2005 Raw Milk - AS24 Nevşehir-Avanos 20.10.2005 Raw Milk - AS25 Nevşehir-Acıgöl 20.10.2005 Raw Milk - AS26 Ankara 20.10.2005 Raw Milk - AS27 Burdur-Varollar 20.10.2005 Raw Milk - AS28 Ankara-Ayaş 20.10.2005 Raw Milk - AS29 Nevşehir-Avanos 24.10.2005 Raw Milk - AS30 Nevşehir-Acıgöl 24.10.2005 Raw Milk - AS31 Ankara 24.10.2005 Raw Milk + AS32 Nevşehir-Avanos 27.10.2005 Raw Milk - AS33 Nevşehir-Acıgöl 27.10.2005 Raw Milk - AS34 Burdur-Varollar 27.10.2005 Raw Milk + AS35 Nevşehir-Avanos 07.11.2005 Raw Milk - AS36 Nevşehir-Avanos 07.11.2005 Raw Milk + AS37 Nevşehir-Avanos 22.11.2005 Raw Milk - AS38 Antalya-Bozova 22.11.2005 Raw Milk - AS39 Ankara 22.11.2005 Raw Milk - AS40 Nevşehir-Acıgöl 22.11.2005 Raw Milk + AS41 Nevşehir-Acıgöl 24.11.2005 Raw Milk - AS42 Nevşehir-Avanos 24.11.2005 Raw Milk - AS43 Burdur-Varollar 24.11.2005 Raw Milk - AS44 Ankara 24.11.2005 Raw Milk - AS46 Nevşehir-Avanos 29.11.2005 Raw Milk + AS47 Nevşehir-Avanos 01.12.2005 Raw Milk -

140
Table A.I.3. Isolation material, date, place and results (continued).
Sample Code
Isolation Place
Isolation Date
Isolation Material
Result
AS48 Nevşehir-Acıgöl 01.12.2005 Raw Milk + AS49 Antalya-Bozova 01.12.2005 Raw Milk - AS50 Burdur-Varollar 01.12.2005 Raw Milk + RS5 Ankara-Kızılay 09.11.2005 Salad - RS8 Ankara-Kızılay 14.11.2005 Salad - RS9 Ankara-Kızılay 14.11.2005 Salad - RS15 Ankara-Kızılay 20.01.2006 Salad - RS1 Ankara-Kızılay 07.10.2005 Salad - RS2 Ankara-Dikmen 29.10.2005 Salad + RS3 Ankara-Kızılay 09.11.2005 Salad - RS4 Ankara-Balgat 09.11.2005 Salad - RS6 Ankara-Maltepe 11.11.2005 Salad - RS7 Ankara-Kızılay 14.11.2005 Salad - RS10 Ankara-Kızılay 14.11.2005 Salad - RS11 Ankara-Kızılay 14.11.2005 Salad + RS12 Ankara-Ulus 14.11.2005 Salad - RS13 Ankara-Ulus 14.11.2005 Salad - RS14 Ankara-Ulus 23.12.2005 Salad - RS16 Ankara-Kızılay 20.01.2006 Salad - RS17 Ankara-Ulus 28.01.2006 Salad - RS18 Ankara-Ulus 28.01.2006 Salad - KE4 Ankara-Söğütözü 01.11.2005 Sheep kidney - KE1 Ankara-Söğütözü 01.11.2005 Sheep meet + KE2 Ankara-Söğütözü 01.11.2005 Sheep meet + KE3 Ankara-Söğütözü 01.11.2005 Sheep meet +

141
0,25 N HCl Solution
Formula mL
5 N HCl 12,5
Sterile dH2O 247,5
0,5 M EDTA, pH 8
Formula
Na2EDTA.2H2O 37.22 g
Sterile dH2O 200 mL
pH was adjusted by using 5 M NaOH and the solution was autoclaved
(121oC/15 min).
0,5 N NaOH Solution
Formula mL
5 N NaOH 25
Sterile dH2O 225
0,5X Tris-Borat-EDTA (TBE) Solution
Formula
10X TBE stock solution 100 mL
Sterile dH2O 1900 mL
1 M Tris-HCl, pH 8
Formula
Trizma-base 24,22 g
Sterile dH2O 200 mL
pH was adjusted by using 5 M HCl and the solution was autoclaved (121oC/15 min).
1X Blocking Reagent (Roche GmbH., Germany)
Formula
10X Blocking Reagent 5 mL
Maleic acid buffer solution 45 mL

142
3 M Sodium Acetate, pH 5,2
Formula
Sodyum asetat.3H2O 40,8 g
H2O 100 mL
pH was adjusted by using glacial acetic acid to 5,2 and the solution was sterilized in
the autoclave (121°C / 15 min).
10X Tris-Borat-EDTA (TBE) Stock Solution
Formula
(0.9 M Trizma-base, 0.9 M Boric acid, 0.02 M EDTA)
Tris-Base 109 g
Na2EDTA.2H2O 9.3 g
Boric acid 55.6 g
Solution was prepared in 1000 mL distilled water and sterilized in autoclave at 121oC
for 15 min.
20X SSC Stock Solution
Formula g/L
NaCl 175,3
Sodium citrate.2H2O 88,2
Solution sterilized in autoclave at 121oC for 15 min.
20% SDS Solution
Formula
SDS 2 g
Sterile dH2O 10 mL

143
Bismuth Sulfite Agar (BSA) (Merck KGaA., Germany)
Formula g/L
Meat extract 5,0
Peptone from meat 10,0
D(+)glucose 5,0
Di-sodium hydrogen phosphate 4,0
Iron (III) sulfate 0,3
Bismuth sulfite indicator 8,0
Brilliant green 0,025
Agar 15,0
pH 7,6 ± 0,2 (before sterilization)
19,0 g dehydrated media was suspended in 400 mL sterile distilled water and agar in
the content was melted by heating in boiling waterbath. Later, it was cooled down to
55oC and poured 25 mL into sterile petri plates to form a thick layer. This media was
not sterilized in autoclave.
Buffered Peptone Water (BPW) (Oxoid Ltd., UK)
Formula g/L
Enzymatic digest of casein 10,0
NaCl 5,0
Disodium hydrogen phosphate 3,5
(anhydrous)
Potassium dihydrogen phosphate 1,5
pH 7,0 ± 0,2 (before sterilization)
Add 4,5 g of BPW was dissolved in 225 mL of distilled water. It was mixed well and
sterilized by autoclaving at 121°C for 15 min.

144
Cell Lysis Buffer Solution
Formula
1 M Tris-HCl, pH 8 25 mL
0,5 M EDTA, pH 8 50 mL
Sarcosyl 5 g
Sterile dH2O 425 mL
Proteinase K (20 mg/mL) 2,5 mL
Cell Suspension Buffer Solution
Formula
(100 mM Tris-HCl, 100 mM EDTA, pH 8)
1 M Tris-HCl, pH 8 10 mL
0,5 M EDTA, pH 8 20 mL
Sterile dH2O 97 mL
Solution sterilized in autoclave at 121oC for 15 min.
Detection Buffer Solution (Roche GmbH., Germany)
Formula
1M Tris/HCl (pH 9.5) 5 mL
5M NaCl 1 mL
1M MgCl2 2,5 mL
Sterile dH2O 41,5 mL
Detection-Wash Solution (Roche GmbH., Germany)
Formula
Maleic acid buffer solution 100 mL
Tween20 200 µL
DNA-Sample-Buffer
Formula mL
15% Ficoll 10
5% Bromphenolblue in bdH2O 0,25

145
Double Strength Bacto-Nutrient Broth and Agar (Difco, USA)
Formula g/L
Beef extract 6
Peptone 10
NaCl 8,5
Agar 13
pH 6,8 ± 0,2 (before strilization)
8 g dehydrated media for broth and 23 g dehydrated media for solid media were
suspended in 1000 mL distilled water. The broth was dispensed into standard glass
tubes and autoclaved at 115°C for 10 min. The solid media was sterilized the same
before dispensing into sterile petri dishes at 55°C.
Eosin Methylene Blue (EMB) Agar
Formula g/L
Peptone 10
Di-potassium hydrogen phosphate 2
Lactose 5
Sucrose 5
Eosin Y, yellowish 0,4
Methylene blue 0,07
Agar 13,5
pH 7,1 ± 0,2 (before sterilization)
36 g dehydtrated media was dissolved in 1000 mL distilled water and sterilized at
121 °C for 15 min in autoclave. Then it was cooled down to 55oC and poured into
sterile petri plates approximately 15-20 mL.

146
Gassner Agar (Merck KGaA., Germany)
Formula g/L
Peptone 14,0
NaCl 5,0
Laktose 43,0
Water blue 0,62
Metachrome yellow 1,25
Agar 13,0
pH 7,2 ± 0,2 (before sterilization)
77,0 g dehydrated media was dissolved in 1000 mL distilled water. It was autoclaved
(121°C / 15 min) and transferred 15-20 mL into sterile petri plates at 55°C.
Hybridization Solution (Roche GmbH., Germany)
Formula
20X SSC 50 mL
10% N-Laurylsarcosine 2 mL
10% SDS 0,4 mL
10% 10X Blocking Solution 20 mL
Iodine-Iodide Solution
Formula g/100mL
Potassium iodide 25,0
Iodine 20,0
25,0 g potassium iodide was dissolved in 10 mL sterile distilled water. 20,0 g iodine
was added and the volume was completed to 100 mL with sterile distilled water.
KADO-Buffer Solution
Formula g/100mL
(50 mM Tris / 1 mM EDTA, pH 8)
Trizma-base 0,6
EDTA 0,03

147
Luria Bertani (LB) Broth and Agar
Formul a g/L
Tryptone 10,0
Yeast extract 5,0
NaCl 10,0
Agar 13,0
pH 7,0± 0,2 (before strailization)
The content was mixed and suspended in 1000 mL distilled water. When the liquid
media was dispensed into tubes and when agar was added to prepare agar media,
they were sterilized in autoclave (121°C / 15 min). Agar was poured 15-20 mL into
sterile petri plates when it was cooled down to 55°C.
Lysis Mix Solution
Formula mL
Steril, bdH2O 11,5
15% SDS 4
250mM Tris 4
5N NaOH 0,3
This solution was freshly prepared in the course of plasmid analyses.
Maleic Acid Buffer Solution, pH 7,5 (Roche GmbH., Germany)
Formula
Maleic acid 23,2 g
NaCl 17,5 g
Sterile dH2O 2000 mL
McFarland Solution
Formula mL
BaCl2.2H2O (1,175% w/v) 0,5
H2SO4 (0,36 N) 99,5

148
Müller-Hinton Agar (Oxoid Ltd., UK)
Formula g/L
Meat extract 300
Casein hydrolysate 17,5
Starch 1,5
Agar 17,0
pH 7,3 ± 0,1 (before sterilization)
38 gram dehydrated media was dissolved in 1000 mL distilled water and starilized at
121°C for 15 min in autoclave. After cooled down to 55°C, 10-15 mL was dispensed
into sterile petri dishes and stored at +4oC.
Müller-Kauffmann Tetrathionate/Novobiocin Broth (MK TTn)
(Oxoid Ltd., UK)
Formula g/L
Meat extract 4,3
Enzymatic digest of casein 8,6
NaCl 2,6
Calcium carbonate 38,7
Sodium thiosulphate (anhydrous) 30,5
Ox bile 4,78
Brilliant green 0,0096
Novobiocin solution (0,8%) 5,0 mL
Iodine-Iodide solution 20,0 mL
pH 8,0 ± 0,2 (before sterilization)
89,5 g of dehydrated media was suspended in 1 L of sterile distilled water. The
suspension mixed well and brought to boil with frequent agitation. When it was
completely dissolved, iodine-iodide and novobiocin (Novobiocin Selective
Supplement, Oxoid Ltd., UK) solutions were added and dispensed into 10 mL sterile
tubes. This media was not sterilized in the autoclave.

149
Phenol/Chloroform Solution
Formula mL
Fenol 1
Chloroform 1
This solution was freshly prepared in the course of plasmid analyses.
Post-Hybridization-Wash Solution-I
Formula
20X SSC 5 mL
10% SDS 50 µL
Sterile dH2O 44,95 mL
Post-Hybridization-Wash Solution-II
Formula
20X SSC 0,5 mL
10% SDS 100 µL
Sterile dH2O 99,4 mL
Rappaport Vassiliadis Broth (RVB) (Merck KGaA., Germany)
Formula g/L
Peptone from soymeal 4,5
Magnesium chloride hexahydrate 29,0
NaCl 8,0
Di-potassium hydrogen phosphate 0,4
Potassium di-hydrogen phosphate 0,6
Malachite-green 0,036
pH 5,2 ± 0,2 (before sterilization)
42,5 g of dehydrated media was suspended in 1 L distilled water. Then it was
dispensed into 10 mL test tubes and sterilized in autoclave (115°C / 15 min).

150
Seakem Agarose (1%)-SDS
Formula
Seakem Agarose 0,25 g
(Biozyme, USA)
Tris-EDTA solution (TE) 23,5 mL
20% SDS solution 1,25 mL
Seakem agarose was molten in TE solution in microwave. Then, in the waterbath
(GFL 1002, GFL GmbH., Germany), it was cooled down to 50oC and mixed with
1,25 mL of prewarmed (50oC) 20% SDS solution.
Seakem Agarose (1%)-TBE
Formula
Seakem Agarose 1 g
0.5X TBE solution 100 mL
Seakem agarose was molten in 0,5X TBE solution in microwave and cooled down to
50oC in waterbath (GFL 1002, GFL GmbH., Germany) before poring into the gel
tray.
Semi-Solid Agar (Swarm-Agar)
Formula g/L
Meat extract 7,0
Peptone 10,0
NaCl 3,0
Di-sodium hydrogen 2,0
phosphate.12 hydrate
Glucose 1,0
Agar 5,0
pH 7,5 ± 0,2 (before sterilizaiton)
The content was suspended in 1000 mL distilled water and autoclaved
(121°C / 15 min). When it was cooled down to 55°C, it was poured into sterile 15mm
petri plates.

151
SOC Medium
Formula g/L
Trypton 20 g
Yeast extract 5 g
5M NaCl 2 mL
1M KCl 2,5 mL
1M MgCl2 10 mL
1M MgSO4 10 mL
1M Glucose 20 mL
The media contents were dissolved in 1000mL sterile water and autoclaved at 121°C
for 15 min.
Tris-EDTA (TE) Buffer Solution
Formula
(10 mM Tris-HCl, 1 mM EDTA, pH 8)
1 M Tris-HCl, pH 8 10 mL
0,5 M EDTA, pH 8 2 mL
Sterile dH2O 988 mL
Solution sterilized in autoclave at 121oC for 15 min.

152
Xylose-Lysin Desoxycholate (XLD) Agar (Oxoid Ltd., UK)
Formula g/L
Yeast extract 3,0
L-Lysine HCl 5,0
Xylose 3,75
Lactose 7,5
Sucrose 7,5
Sodium desoxycholate 1,0
NaCl 5,0
Sodium thiosulphate 6,8
Ferric ammonium citrate 0,8
Fenol red 0,08
Agar 12,5
pH 7,4 ± 0,2 (before sterilization)
26,5 g of dehydrated media was suspended in 500 mL distilled water. The agar in the
composition was melted in the boiling waterbath by avoiding overheating.
Subsequently, it was cooled down to 55oC and transferred 15-20 mL in sterile petri
plates. This media was not sterilized in autoclave.

153
CURRICULUM VITAE
PERSONAL INFORMATION
Surname, Name: Avşaroğlu, M. Dilek
Nationality: Turkish (TC)
Date and Place of Birth: 24 July 1979, Ankara
Phone: +90 533 332 59 97
email: [email protected]
EDUCATION
Degree Institution Year of Graduation MSc METU, Biotechnology, Ankara 2003 BSc AU, Food Engineering, Ankara 2000 High School High School of Ayrancı, Ankara 1996
WORK EXPERIENCE
Year Place Enrolment 2006-2007 Federal Institute for Risk Assessment,
Germany Guest Scientist
2003- Present METU, Natural and Applied Sciences, Biotecnology Program
Research Assistant
2000 July-September Georg-August University of Göttingen, Germany
Intern Student
1999 July-September Georg-August University of Göttingen, Germany
Intern Student
PUBLICATION FROM THE THESIS
AVŞAROĞLU, M. D., HELMUTH, R., JUNKER, E., HERTWIG, S.,
SCHROETER, A., AKÇELĐK, M., BOZOĞLU, F., GUERRA, B. 2007. Plasmid
mediated quinolone-resistance conferred by qnrS1 in Salmonella enterica serovar
Virchow isolated from Turkish food of avian origin. Journal of Antimicrobial
Chemotherapy, In Press.