isolation and molecular production from whey …
TRANSCRIPT

ISOLATION AND MOLECULAR
CHARACTERIZATION OF YEAST STRAINS FROM
KENYAN CHEESE INDUSTRIES AND THEIR
POTENTIAL UTILIZATION IN BIOETHANOL
PRODUCTION FROM WHEY
VIRGINIA WAMBUI KIMANI
MASTER OF SCIENCE
(Biotechnology)
JOMO KENYATTA UNIVERSITY OF
AGRICULTURE AND TECHNOLOGY
2013

Isolation and Molecular Characterization of Yeast Strains from
Kenyan Cheese Industries and their Potential Utilization in
Bioethanol Production from Whey
Virginia Wambui Kimani
A thesis submitted in partial fulfilment for the Degree of Master
of Science in Biotechnology in the Jomo Kenyatta University of
Agriculture and Technology
2013

II
DECLARATION
This research thesis is my original work and has not been presented for a degree in
any other University.
Signature --------------------------------- Date-------------------------------
Virginia Wambui Kimani
This thesis has been submitted for examination with our approval as University
Supervisors:
1. Signature ---------------------------------- Date--------------------------------
Dr. JULIUS MAINA MATHARA
JKUAT, Kenya
2. Signature ---------------------------------- Date--------------------------------
-- Dr. ABD EL-LATIF HESHAM
Assiut University, Egypt.
3. Signature ---------------------------------- Date--------------------------------
Dr. HENRY J.O. OGOLA
JOOUST, Kenya

III
DEDICATION
This work is dedicated to my family especially my parents Mr. and Mrs. George
Kimani Muraga

IV
ACKNOWLEDGEMENT
I take this opportunity to express my appreciation to (KIRDI- Kenya
Industrial Research and Development institute) for funding this research, without
which it would not have been possible to do this work. I would also wish to
acknowledge the Institute of Biotechnology Research and Food Science and
Technology Departments for allowing me to use their resources to carry out this
study.
Special thanks to my supervisors for their support which has made all of this
possible To Dr. Maina, JKUAT, Dr. Abd El-Latif Hesham, Genetics Department,
Assiut University, Egypt and Dr. Ogola, JOOUST, for their guidance, assistance,
encouragement and support throughout the research period. Sincere gratitude to
technicians Muthanga, Rotich, Jennifer and Karanja for teaching me the different
techniques that made this works a success. Utmost appreciation goes to Browns and
KCC industries without whom this work could not have been achieved.
I am most honored to thank my parents (Mr. and Mrs. George Kimani
Muraga), brothers (Muraga and Karanja) and friends (Kuria, Midega, Silo, Ingrid,
Lagat, Kevin Mbogo, Wafula, Faith Mwendwa and Fred Ndonye) for the support.
Each one made a difference making all of this possible. Finally, I give most thanks to
the Almighty God who gave me all the strength and ability to achieve all.

V
TABLE OF CONTENT
DECLARATION ........................................................................................................ II
DEDICATION ........................................................................................................... III
ACKNOWLEDGEMENT ........................................................................................ IV
TABLE OF CONTENT ............................................................................................. V
LIST OF TABLES .................................................................................................... XI
LIST OF FIGURES ................................................................................................ XII
LIST OF FIGURES ................................................................................................ XII
LIST OF APPENDICES ....................................................................................... XIV
LIST OF ABBREVIATIONS ............................................................................... XVI
ABSTRACT .......................................................................................................... XVII
CHAPTER ONE ......................................................................................................... 1
1.0 INTRODUCTION ................................................................................................. 1
1.1 Background Information ..................................................................................... 1
1.2 Problem Statement .............................................................................................. 4
1.3 Justification of the Study ..................................................................................... 4

VI
1.4 General Objective ................................................................................................ 5
1.4.1 Specific Objectives ....................................................................................... 5
1.5 Hypotheses .......................................................................................................... 6
CHAPTER TWO ........................................................................................................ 7
2.0 LITERATURE REVIEW ..................................................................................... 7
2.1 Energy Needs ...................................................................................................... 7
2.2 Bioethanol as renewable energy source .............................................................. 8
2.3 Cheese Whey ..................................................................................................... 10
2.3 Whey-to-Ethanol Process .................................................................................. 12
2.4 Role of Yeast in Fermentative Processes .......................................................... 14
2.4.1 Yeast Ecology ............................................................................................. 15
2.4.2 Lactose Fermenting Yeasts ......................................................................... 16
2.5 Yeast Isolation and Identification ...................................................................... 19
2.5 .1 Yeast Isolation ........................................................................................... 19
2.5.2 Yeast Identification ..................................................................................... 20
VII
CHAPTER THREE .................................................................................................. 23
3.0 MATERIALS AND METHODS ....................................................................... 23
3.1 Study Site .......................................................................................................... 23
3.2 Study Design ..................................................................................................... 23
3.3 Sampling and Collection of Samples ................................................................ 23
3.4 Growth, Isolation and Evaluation of Fermenting Ability of Yeasts .................. 24
3.5 Phenotypic Characterization of Yeast Isolates .................................................. 25
3.5.1 Morphology Characteristics ........................................................................ 25
3.5.2 Cellular Morphology................................................................................... 25
3.6 Physiological Characterization of Yeast Isolates .............................................. 26
3.6.1 Growth at Different Temperature ............................................................... 26
3.6.2 Growth at Different pH Ranges .................................................................. 26
3.7 Biochemical Characterization ........................................................................... 27
3.8: Molecular Genetic Characterization ................................................................. 27
3.8.1 DNA Extraction for PCR ............................................................................ 27
3.8.2 Partial Sequencing of the Gene Coding for 26S rRNA .............................. 29

VIII
3.8.2.1 Phylogenetic Analysis .......................................................................... 29
3.8.3 Amplification of 5.8S-ITS rDNA ............................................................... 30
3.8.4 Purification of Samples for Sequencing ..................................................... 31
3.8.5 Restriction Analysis of the PCR Products .................................................. 31
3.9 Chemical Analysis ............................................................................................. 31
3.9.1 Proximate Composition .............................................................................. 31
3.9.1.1 Crude Protein ....................................................................................... 31
3.9.1.2 Total Carbohydrates ............................................................................. 32
3.9.1.3 Total Ash and Mineral Profiling .......................................................... 33
3.9.2 Chemical Oxygen Demand (COD) ............................................................. 33
3.9.3 pH and Total Titratable Acidity (TTA) ...................................................... 34
3.9.4 Total Soluble Solids (BRIX)....................................................................... 35
4.0 Optimization of Whey Fermentation using Yeast Isolates ................................ 35
4.1 Effect of substrate concentration, Temperature and inoculums size ................. 35
4.2 Ethanol Determination ...................................................................................... 35

IX
CHAPTER FOUR ..................................................................................................... 37
4.0 RESULTS AND DISCUSSION ......................................................................... 37
4.1 Growth, Isolation and Evaluation of Fermenting Ability of Yeasts .................. 37
4.2 Physiological Characterization .......................................................................... 43
4.3 Biochemical Characterization of Dairy Industry Yeasts (API® 20C AUX) ...... 44
4.4 Molecular Genetic Characterization .................................................................. 47
4.4.1 Phylogenetic Analysis of the of D1/D2 domain 26S rDNA and 5.8S-ITS
rDNA region Sequences ...................................................................................... 48
4.4.2 Discrimination of Yeast Species by PCR-RFLPs of the 5.8S-ITS rDNA
Region .................................................................................................................. 55
4.5 Ethanol Fermentation by Isolated Yeast Strains ............................................... 58
4.5.1 Characterization of whey Samples ............................................................. 58
4.5.2 Ethanol Fermentation .................................................................................. 60
4.6. DISCUSSION .................................................................................................. 65
4.6.1 Biochemical and Physiological Characterization of Yeasts ....................... 65
4.6.2 Molecular Characterization of Dairy Yeasts .............................................. 66
X
4.6.3 Conversion of whey to ethanol by isolated Yeast Strains .......................... 70
CHAPTER FIVE ....................................................................................................... 74
5..0 CONCLUSIONS AND RECOMMENDATIONS ........................................... 74
5.1 Conclusions ....................................................................................................... 74
5.2 Recommendations ............................................................................................. 75
REFERENCE ............................................................................................................ 76
APPENDICES ......................................................................................................... 100

XI
LIST OF TABLES
Table 1. Whey Characteristicsa .................................................................................. 11
Table 2. Summary of Sampling done at various sites ................................................ 24
Table 3. Phenotypic characterization of yeast isolates ............................................... 38
Table 4. Mean growth of Yeasts under different pH ranges ...................................... 40
Table 5. Mean growth of Yeasts under different temperature ranges ........................ 41
Table 6. Biochemical characterization of yeast isolates showing their closest relative
on the basis of API kit ................................................................................................. 46
Table 7. Identification of yeast isolates by comparative sequence of the D1/D2
domains of 26S rDNA and the 5.8S-ITS rDNAa region. ............................................ 54
Table 8. Length in bp of the PCR-amplified products of 5.8S-ITS rDNA region and
ITS-RFLP obtained with two restriction endonucleases ............................................. 58
Table 9. Characteristics of whey used for ethanol fermentation ................................ 59
Table 10. Effect of different cultural conditions on ethanol production .................... 62

XII
LIST OF FIGURES
Figure 1. Ethanol fermentation of the yeast strain Kluyveromyces marxianus. . ....... 17
Figure 2. Schematic representation of the internal transcribed spacer (ITS) region of
ribosomal RNA (rRNA) . ............................................................................................ 22
Figure 3. Colony Morphology of strain P2 (Kluyveromyces species)........................ 39
Figure 4. Cellular Morphology of strain P2 (Kluyveromyces species) ...................... 39
Figure 5. Gas production by lactose fermenting yeast grown on YEPL media. ....... 42
Figure 6. Acid production by yeast isolates cultured on MacConkey media ............. 42
Figure 7. Effect of Temperature on growth of dairy industry yeasts ......................... 43
Figure 8. Effect of pH on growth of dairy industry yeasts ......................................... 44
Figure 9. Amplified DNA of D1/D2 domain of isolates run in 2% (W/V) agarose gel.
..................................................................................................................................... 47
Figure 10. Phylogenetic tree for Kluyveromyces marxianus strain BM9 and related
species ......................................................................................................................... 48
Figure 11. Phylogenetic tree for Kluyveromyces marxianus strain BM4 and related
species ......................................................................................................................... 49
Figure 12. Phylogenetic tree for Kluyveromyces lactis strain P41 and related species
..................................................................................................................................... 49
Figure 13. Phylogenetic tree for Pichia norvegensis strain YC1 and related species 50
Figure 14. Phylogenetic tree for Pichia cactophila strain YB2 and related species. . 51

XIII
Figure 15. Phylogenetic tree for Candida inconspicua strain YC5 and related species
..................................................................................................................................... 52
Figure 16. Phylogenetic tree for Candida tropicalis strain P21 and related species . 52
Figure 17. Phylogenetic tree for Yarrowia lipolytica strain M3 and related species . 53
Figure 18. Amplified DNA of 5.8 S ITS DNA of 14 isolates run in 2% (W/V)
agarose......................................................................................................................... 57
Figure 19. Amplicons digested with Hinf1 restriction enzyme. ................................. 56
Figure 20. Amplicons digested with HaeIII restriction enzyme. .............................. 57
Figure 21. Ethanol productivity (■) versus sugar depletion (○) in whey by selected
yeast isolates over varied incubator times. .................................................................. 63

XIV
LIST OF APPENDICES
Appendix 1. Phylogenetic tree for K.marxianus strain BM2 and related species .... 100
Appendix 2. Phylogenetic tree for K. marxianus strain M11and related species .... 100
Appendix 3. Phylogenetic tree for K. marxianus strain P2 and related species ....... 100
Appendix 4. Phylogenetic tree for K. marxianus strain YC4 and related species ... 100
Appendix 5. Phylogenetic for Pichia norvegensis YC6 and related species ............ 101
Appendix 6. Phylogenetic tree for P. norvegensis strain PC2 and related species .. 101
Appendix 7. Phylogenetic tree for Pichia cactophila strain PB9 and related species
................................................................................................................................... 101
Appendix 8. Phylogenetic tree for Pichia cactophila strain PB10 and related species
................................................................................................................................... 102
Appendix 9. Phylogenetic tree for Candida inconspicua strain BM1 and related
species ....................................................................................................................... 102
Appendix 10. Phylogenetic tree for Candida tropicalis strain P22 and related species
................................................................................................................................... 102
Appendix 11. Phylogenetic tree for Yarrowia lipolytica strain P42 and related species
................................................................................................................................... 103
Appendix 12. Phylogenetic tree for Yarrowia lipolytica strain P43 and related
species ....................................................................................................................... 103
Appendix 13. Phylogenetic tree for Yarrowia lipolytica strain P45 and related species
................................................................................................................................... 103

XV
Appendix 14. Phylogenetic tree for K. marxianus strain BS4 and related species .. 104
Appendix 15. Phylogenetic tree for Candida catenulate strain M4 and related species
................................................................................................................................... 104
Appendix 16. Phylogenetic tree for Yarrowia lipolytica strain M5 and related
species ....................................................................................................................... 104
Appendix 17. Phylogenetic tree for Y. lipolytica strain M15 and related species .... 104
Appendix 18. Phylogenetic tree for Yarrowia lipolytica strain P45 and related species
................................................................................................................................... 105
Appendix 19. Phylogenetic tree for Pichia cecembensis strain PC3 and related
species ....................................................................................................................... 105
Appendix 20. Sequence alignment of the isolate BM9 ............................................ 106
Appendix 21. Sequence alignment of the isolate BM4 ............................................ 107
Appendix 22. Sequence alignment of the isolate P41 .............................................. 108
Appendix 23. Sequence alignment of the isolate YB2............................................. 109
Appendix 24. HPLC chromatogram of 6% for ethanol ........................................... 110
Appendix 25. HPLC chromatogram of ethanol yield for BM4................................ 110

XVI
LIST OF ABBREVIATIONS
BLAST – Basic Local Alignment Search Tool
DNA – deoxyribonucleic acid
dNTPs – deoxynucleotide triphosphates
D1/D2 – domain of the 26S nuclear ribosomal RNA (nrRNA)
HPLC – High-Performance Liquid Chromatography
KCC – Kenya Cooperatives Creameries
IBR – Institute of Biotechnology Research
ILRI – International Livestock Research Institute
NCBI – National Center for Biotechnology Information
PCR – Polymerase chain reaction
RFLP – Restriction Fragment Length Polymorphism
RNA – Ribosomal nucleic acid
UV – Ultraviolet
YEPD – Yeast Extract Peptone Dextrose
YEPL – Yeast Extract Peptone Lactose

XVII
ABSTRACT
The use of Bio-wastes like whey as raw materials for production of ethanol is gaining
importance due to the environmental impact and exhaustion of fossil fuel sources
making renewable fuel alternatives highly attractive. The objective of the study
involved the isolation, characterization and identification of yeast strains from the
Kenyan Cheese Industries exhibiting robust whey-lactose fermentation to ethanol and
their potential application in bioethanol production from whey, Yeast strains were
isolated using PDA and YEPL Medias from samples collected from KCC, Sameer
and Browns cheese dairy industries. Genetically, the variable D1/D2 domain of the
large subunit (26S) ribosomal DNA of the isolates were amplified by the polymerase
chain reaction (PCR), sequenced and compared with known 26S rDNA sequences in
the GenBank database, the rDNA fragment containing the internal transcribed spacers
(ITS1 and ITS2) and 5.8S-ITS rDNA were PCR-amplified, sequenced and the PCR
product digested with the enzymes HinfI, and HaeIII. Twenty eight out of forty two
pure isolates were found to have fermentative ability. The sequence analysis of the
variable D1/D2 domain of the 26S rDNA, showed that the isolates belonged to
Kluyveromyces, Yarrowia, Pichia and Candida. In addition, the unique variability in
the size and profiles of the amplified product and in the restriction patterns enabled
differentiation between the isolates. The assessment of fermentative performance of 4
yeast strains showed that K. marxianus strain BM4, K. marxianus strain BM9 and K.
lactis strain P41 had higher ethanol productivity of 5.52, 4.92 and 5.05% w/v,

XVIII
respectively, from whey at pH 4.5 and 30oC while P. cactophila strain YB2 produced
1.40% w/v ethanol at 10% whey sugar and pH 4.5 at 30oC. It was concluded that
molecular methods based on the sequences of the 26S rDNA D1D2 domain and the
ITS region were rapid and precise compared with the physiological method for the
identification and typing of these species, The yeast strains isolated also showed
potential in whey to Bio-ethanol production.

1
CHAPTER ONE
1.0 INTRODUCTION
1.1 Background Information
Recently, there are increased public concerns and ecological awareness on
climate change; air quality issues and security of supply have led to renewed interest
on new less carbon intensive/non-fossil based fuels that are generated in a sustainable
way with minimum greenhouse gas production. In an attempt to meet this goal, the
renewable energy sources that include wind, solar, geothermal and biofuels are being
explored (Pimentel, 2006). Presently, ethanol (ethyl alcohol, bioethanol) is the most
employed liquid biofuel in terms of volume and market value, either as a fuel or as a
gasoline enhancer (Patzek & Pimentel, 2005; Hill et al., 2006; Renewable Fuels
Association, 2011). Furthermore, there are ongoing efforts aiming at increasing yield
and energy efficiency of ethanol production from biomass as a potential fossil fuel
substitute that is both renewable and environmentally friendly (Andrietta et al.,
2007). The world bioethanol production is estimated to reach about 85.2 billion liters
(Renewable Fuels Association, 2012), with USA and Brazil being the highest
producers. On average, 73% of produced ethanol worldwide corresponds to fuel
ethanol, 17% to beverage ethanol and 10% to industrial ethanol (Sanchez & Cardona,
2008).
The massive utilization of fuel ethanol in the world requires that its
production technology be cost-effective and environmentally sustainable. However,

2
the current first generation process of bioethanol production is based on fermentation
of starch and sugar from maize and sugar cane, which only constitutes about 1-2% of
the total plant biomass. Although there has been a steady rise in bioethanol
production, the merits of resource-intensive crops-to-bioethanol process in terms of
net emissions, cost, and energy balance remains under debate (Patzek & Pimentel,
2005; Hill et al., 2006; Fargione et al., 2008). In addition, the “fuel vs. food” debate
that suggests that growing food crops for biofuel negatively impacts the world’s
poorest populations has also risen (Collins, 2008; Mitchell, 2008; Tenenbaum, 2008).
This has led to renewed momentum in the search for new and cost-effective
alternative non-food sources or second generation processes feedstock for bioethanol
production.
In most developing countries, agricultural, industrial and urban wastes have
widespread abundance and relatively cheap procurement cost, and is thus potential
feedstocks for production of cheap bioethanol (Prasad et al., 2006). For example, the
production of ethanol from lignocellulosic biomass (corn stover, wheat straw,
sugarcane bagasse, rice straw, rice hull, corn cob, oat hull, corn fiber, woodchips and
cotton stalk; energy crops such as switch grass and Alfa Alfa, and various weeds such
as Saccharum spontaneum, Lantana camara, Eichhornia crassipes (water hyacinth),
etc.) has become one of the attractive alternatives (Joshi et al., 2011). However, a
major obstacle to industrial-scale utilization of lignocelluloses lies in the inefficient
deconstruction of plant biomass owing to the recalcitrant nature of the lignin and
current pretreatment methods being generally expensive, energy intensive, and

3
relatively inefficient (Lynd et al., 2008). In addition to lignocelluloses, municipal and
agro-industrial wastes such as cotton linters, spent sulfite liquor, wastes from
vegetable and fruit industries, coffee waste and cheese whey have been proposed as
important abundant and cheap feedstocks (Prasad et al., 2006).
Whey as the main by-product of cheese industry is increasingly becoming an
attractive source of many bioactive valuable compounds (Guimaraes et al., 2010). It
is characterized by abundant amounts of lactose (ca. 5% w/v) and other milk
nutrients, which represents a significant environmental problem as a result of its high
biological demand. Consequently, due to the large lactose surplus generated, its
conversion to bio-ethanol has long been considered as a possible solution for whey
bioremediation. The fermentation of whey lactose using yeasts has been frequently
reported (Porro et al., 1992; Compagno et al., 1993; Grba et al., 1998; Barba et al.,
2001) and the ability to metabolize lactose to ethanol has been demonstrated in
Kluyveromyces lactis, K. marxianus, and Candida pseudotropicalis (Breunig et al.,
2000; Fukuhara, 2006). Presently, there are a few established industrial processes to
produce ethanol from whey utilizing these yeast strains, which has been done in some
countries, namely Ireland, New Zealand, United States and Denmark (Siso, 1996;
Pesta et al., 2007). But several challenges and limitations inhibit the process of
utilization of whey lactose to ethanol. Yeast strains exhibiting lactose fermenting
ability are still rare in nature (Fukuhara, 2006), and therefore, there is an urgent
research need to isolate, identify and characterize novel microbial strains that can
ferment lactose to ethanol with very high efficiency to increase the industrial

4
attractiveness of whey-to-ethanol fermentation.
1.2 Problem Statement
Due to high demand for energy in Kenya, there is urgent need to identify and
utilize new renewable energy sources. In Kenya, whey from dairy industry, represent
one of the major environmental pollution agents due to its high lactose and nutrient
content. Whey-to-bioethanol bioprocess represents a novel and attractive way for
industrial cheese waste utilization and bioremediation. However, efficient production
of ethanol from whey is dependent on suitable yeast strains capable of efficient
hydrolysis of whey lactose to its constituent monosaccharides and the subsequent
metabolism to bio-ethanol. Consequently, there is need to research and develop novel
indigenous yeast strains capable of efficient whey-to-bioethanol fermentation and
amenable to local conditions.
1.3 Justification of the Study
The increasing depletion of petroleum fossils and the corresponding spiraling
global price in addition to increased public awareness to conserve environment,
warrants the search for new alternative sources of energy. Ethanol represents one
alternative renewable source of the energies that Kenya can use to mitigate its high
dependence on fossil fuels and help in enhancing the attainment of vision 2030 goals
of energy sustainability. However, for the ethanol to be attractive, it must be cost
effective. Utilization of industrial wastes for bio-ethanol production such as whey, a
byproduct from the dairy industry that contributes to environmental pollution, would

5
help solve disposal problems at the same time provide a source of energy. In Kenya
there are several cheese producing industries, and so far there has been no
documented report on industrial utilization of produced cheese whey. Furthermore,
there is no research report on isolation of novel lactose fermenting yeast strains of
industrial significance. Hence the need to carry out this study on the isolation,
molecular identification and characterization of indigenous yeast strains capable of
converting whey to ethanol.
1.4 General Objective
To produce bioethanol from whey using yeast strains isolated from Kenya’s
cheese industries
1.4.1 Specific Objectives
1. To isolate and characterize yeasts strains exhibiting efficient whey lactose
conversion to bioethanol from Kenya’s cheese industries
2. To identify the ethanol-producing isolates by using sequences of D1/D2
domains of 26S rRNA gene and phylogenetics analysis
3. To differentiate between the isolates by amplifying rDNA fragment
containing the 5.8S ITS1-ITS2 and restriction analysis

6
1.5 Hypotheses
1. There exist yeast strains that can ferment whey lactose as carbon source to
yield bio-ethanol.
2. The yeast strains that ferment whey lactose are not different from already
known yeast strains.
3. The yeast strain that ferment the whey lactose can produce considerable
quantity of ethanol

7
CHAPTER TWO
2.0 LITERATURE REVIEW
2.1 Energy Needs
Fossil fuels, in particular petroleum, have for a long time been an abundant
and cheap raw material for the production of fine chemicals and, more important,
transport fuels (van Maris et al., 2006). However, petroleum is a non renewable
resource and with the depletion of this crucial energy reserve it is clear that current
supply can no longer meet the ever-increasing global energy demands (Sanchez &
Cardona, 2008). Recurring crises in major crude-oil producing areas such as the
Middle East and the Niger delta, and spectacular growth experienced within the major
Asian economies, especially China in recent years, among other factors have helped
push crude-oil prices constantly above $60 per barrel (Skeer & Wang, 2007; Sanchez
& Cardona, 2008). This has raised concerns about the security of oil supplies,
requiring national governments to reconsider their dependence on foreign oil reserves
(van Maris et al., 2006; Fofana et al., 2009). Similarly, Kenya faces a crippling
dependency on petroleum fuel imports, and thus incurs a huge import bill and these
imports account for about 33% of the total import bill (Mohammud, 2011) It is also
forecasted that development projects under Vision 2030 will increase demand on
Kenya’s energy supply (Kenya Vision 2030 document). Thus, the country’s economy
is exposed to global oil supply risk that is unsustainable in the long term.

8
The combustion of fossil fuels has led to a steady increase in the levels of
greenhouse gas emissions which are a major cause of climate change, particularly
global warming (Ragauskas et al., 2006). Currently, motor vehicles account for 70%
of global carbon monoxide emissions and 19% of carbon dioxide emissions
worldwide, and it is projected that the number of motor vehicles are to increase to 1.3
billion by 2030 and to more than 2 billion vehicles by 2050. Such growth will in no
doubt affect the availability of global oil reserves as well as the stability of
ecosystems and global climate (Balat & Balat, 2009). For the world and Kenya to
achieve energy sustainability, these concerns require intensified efforts to diversify
our energy sources and focus more on alternative clean and carbon-neutral fuels that
can be sustainable in the long term.
2.2 Bioethanol as renewable energy source
Among the renewable energy alternatives, one solution is to harness solar
energy in the form of plant biomass to produce biofuels (Sánchez & Cardona, 2008).
Biofuels refers to any solid, liquid or gaseous fuel that is predominantly produced
from biomass through biochemical or thermochemical processes (Balat, 2007).
Biomass sources include plant matter and lignocellulosic residues, such as forestry
and agricultural by-products as well as municipal wastes (Balat & Balat, 2009).
Ethanol produced through the fermentation of sugars is currently the most
predominant liquid biofuel and is already a well-established biofuel in the transport

9
and industry sectors of some countries, notably Brazil, the USA and the European
Union (Galbe & Zacchi, 2007). The world’s ethyl alcohol production has reached
about 70 billion litres per annum, with the USA and Brazil accounting for close to
90% of the global output (Renewable Fuels Association, 2011). The European Union,
China, India, Canada and Thailand are also major bioethanol producing countries.
An in-depth look at the Kenyan bioethanol scenario shows that the concept of
using ethanol as a fuel is not entirely new. Such efforts date back to production of
power alcohol in 1982 up to 1991, where it used to be blended (10%) in premium and
super gasoline. The raw materials, cane molasses, are sourced from the Kisumu
Western Region (Chemilil, Sony, Kibos, Mumias and Nzoia areas). Currently, there
are two large scale producers of bioethanol in Kenya namely: Agro Chemicals and
Food Co. Ltd (AFC) in Muhoroni and Spectre International in Kisumu/Lake Victoria
with a total production capacity of 55,000 and 60,000 litres per day, respectively.
Furthermore, a major expansion that will increase the production capacities to
>230,000 liters per day is underway (GTZ, 2008).
Bioethanol is presently produced from sugar sources such as sugar cane juice
(Brazil), molasses (India, Egypt and Kenya) and sugar beet (France), and also starch
sources such as maize (USA, Canada), wheat (Germany, Spain, and Sweden) and
cassava (Thailand) (Antoni et al., 2007; Purwadi et al., 2007). However, these raw
materials, which require prime agricultural land for cultivation and which are also
used for human food and animal feed, will not be sufficient to meet the rising demand

10
for fuel ethanol (Hahn-Hägerdal et al., 2006; Chang, 2007). Moreover, their
utilization as ethanol feedstock has also led to an increase in global food prices (Frow
et al., 2009).
To its merit, bioethanol production can be considered as a good strategy for
management of agricultural, industrial and urban wastes. Industrial wastes such as
spent sulfite liquor, vegetable and fruit industries wastes, and cheese whey have also
been identified as potential abundant feedstock sources of low cost bioethanol
production (Prasad et al., 2006). To harness the advantages, however, the
technological and economical challenges related increasing yields and energy
efficiency of ethanol production facing the waste-to-ethanol processes must be
addressed.
2.3 Cheese Whey
The dairy industry represents an important part of the food processing
industry and contributes significant liquid process residues that can be used for the
production of ethanol. Cheese whey, a by-product of dairy industries, generally refers
to the watery part that is formed during the coagulation of milk during cheese making
process. It consists of about 85–95% of the milk volume and retains 55% of milk
nutrients that includes lactose (4.5–5% w/v), soluble proteins (0.6–0.8% w/v), lipids
(0.4–0.5% w/v), mineral salts (8–10% of dried extract) and appreciable quantities of
other components, such as lactic (0.05% w/v) and citric acids, non-protein nitrogen
compounds (urea and uric acid) and B group vitamins (Siso, 1996; de Glutz, 2009)

11
(Table 1). Due to high volumes produced and its high organic matter content, cheese
whey represents an important environmental problem. The high biological oxygen
demand (BOD) due to its lactose fraction makes biological treatment of cheese whey
very expensive, particularly for the small cheese factories (Kisaalita et al., 1990;
Saddoud et al., 2007).
Table 1. Whey Characteristicsa
Compound g/kg
Albumin 4.98
Peptides 0.83
Lipids 0.41
Lactose 38.1
Lactic acids 0.08
Citric acids 1.66
Monovalent cationic salts 1.66
Polyvalent cationic salts 1.01
Monovalent ammonium salts 0.92
Polyvalent ammonium salts 0.99
aAdapted from de Glutz (2009)
Whey can be considered to have vast potential as a source of value added
products since it retains most of the milk nutrients, which includes soluble proteins,
peptides, lipids, lactose, minerals and vitamins. There are numerous reports where
cheese whey has been utilized for production of valuable chemicals such as organic
acids (lactic, acetic), bioactive whey proteins and peptides, single cell protein,

12
methane, and cheese whey powder (Yang & Silva, 1995; Siso, 1996; Audic et al.,
2003; Pesta et al., 2007). However, the lactose-rich effluent that remains after
separation of proteins and other interesting bioactive components is still a major
environmental concern and solutions for its bioremediation are needed. Since there is
a large surplus of lactose, its bioconversion to bulk commodities such as bio-ethanol
has long been considered as a possible alternative solution.
2.3 Whey-to-Ethanol Process
The whey-to-ethanol process generally utilizes deproteinated whey from
casein manufacture or total milk protein production as feedstock (Hamilton, 1998).
Prior to fermentation, the feedstock is concentrated, from 4 to 8% lactose, by reverse
osmosis (Gibson, 2009). Fermentation of the concentrate feedstock takes about 24 h
and is achieved using Kluyveromyces spp., to attain an ethanol content of about
4%.w/v Distillation and water removal is then employed to obtain the different
ethanol grades (Gibson, 2009). Fermentation of whey into ethanol involves initial
hydrolysis of the lactose sugar into glucose and galactose, whereby the glucose is
converted into fructose-1,6-bisphosphate implying the utilization of two molecules of
ATP. Fructose-1,6-bisphosphate is then cleaved into two triose phosphate.
Glyceraldehyde-3-phosphate is oxidized by the reduction of NAD+, and then
esterified with inorganic phosphate resulting in 1, 3-bisphosphoglyceric acid which is
then converted to pyruvic acid with the production of two molecules of ATP. NADH,
in the process regenerates NAD required for continued functioning of the glycolytic

13
pathway. Most fermentations result in the production of several major end-products,
the formation of which is influenced by environmental and physiological factors and
is a property of each individual organism. Apart from ethanol other products, such as
acetate, butyrate, butanol, isopropanol, propionate, lactate, glycerol or butanediol, can
be formed by metabolism of pyruvate from multiple microorganisms via different
pathways. (Fernandez et al., 1995).
In Ireland, New Zealand, United States and Denmark, there are established
industrial processes for whey-to-ethanol production (Siso, 1996; Pesta et al., 2007).
For example, Carbery Milk Products Ltd of Ireland has developed a whey-to-ethanol
process for the production of both potable ethanol and fuel ethanol for E85 and E5
petrol blends, with estimated production of about 11 000 mT of ethanol per year
(Doyle, 2005; Ling, 2008). According to Ling (2008), Carbery process was later
adopted by plants in New Zealand and the United States. In New Zealand, Anchor
Ethanol Ltd, operates three whey-to-ethanol plants, which produce around 17 million
liters of ethanol per year; producing eight different ethanol grades that includes
potable ethanol for beverages to anhydrous alcohol for E10 blend petrol fuels (Thiele,
2005). The major markets for produced ethanol ranges from pharmaceutical,
cosmetics, industrial solvents as well as food and beverages applications, with a
substantial proportion of the produce being exported (Hamilton, 1998; Thiele, 2005).
These few examples illustrate the potential utilization of cheese whey as a feedstock
for the industrial production of bioethanol.

14
Despite these examples of industrial implementation, the fermentation
technology must be further improved in order to enhance the attractiveness of whey-
to-ethanol bioprocesses. Although there has been a long research and development
effort in this field, there is still the need to identify and develop microbial strains that
ferment lactose to ethanol with very high efficiency.
2.4 Role of Yeast in Fermentative Processes
Lactose, a major sugar carbohydrate in whey, is a disaccharide consisting of
glucose and galactose. In nature, yeast strains that can assimilate lactose aerobically
are ubiquitous. However, those that ferment lactose are rather rare (Fukuhara, 2006).
A few species that have been reported to ferment lactose includes Kluyveromyces
lactis, K. marxianus, and Candida pseudotropicalis and the fermentation of whey
lactose to ethanol, particularly using these yeasts, has been frequently referred in the
literature (Barba et al., 2001; Ozmihci & Kargi 2007a; Rech & Ayub 2007; Guimares
et al., 2008; Guimares et al., 2010). These yeast strains ability to ferment lactose is
the due to expression of β-galactosidase (-GAL) activity that facilitate initial lactose
hydrolysis to glucose and galactose that are eventually metabolized downstream to
ethanol. Generally, lactose hydrolysis can be achieved by acid hydrolysis,
enzymatically or utilization of yeast strains capable of expressing β-GAL activity.
Unfortunately, acid hydrolysis can form some byproducts that may inhibit the
fermentation, and enzymatic hydrolysis will add expense to the process. Therefore,
there is a great need to isolate yeast strains possessing the β-GAL activity and

15
evaluate their ability to ferment lactose.
Yeasts contribute largely in the production of fermented food products such as
wine, beer and bread. In dairy industry they play an important role in proteolysis,
lipolysis, and fermentation of lactose, ripening of cheese and production of other milk
products such as yoghurt, contributing to their organoleptic properties (Jakobsen &
Narvhus, 1996; Addis et al., 2001). In addition, several yeasts have been proposed as
novel probiotic microorganisms, biocontrol agents and producers of functional
ingredients (Fleet, 2007; Gatesoupe 2007; Chi et al., 2009; Banker et al., 2009).
2.4.1 Yeast Ecology
The probable role of yeasts as probable agents of pollution, bioremediation or
biological pest control, in an environmental ecosystem, has been well studied. For
example, the use of microbial antagonists as agents of protective agents has been
under investigation leading to the use of some naturally occurring yeast such as
Candida oleiphila, C. sake, C. saltoana and Cryptococcus albidus in commercial
products (Brakhage & Turner, 1995; Poggeler, 2001). It is well documented that
yeasts are not arbitrarily distributed throughout the biosphere. However, they form
communities of species as defined by their habitat, which is the actual place where an
assembly of yeasts lives, and by the niches of its component species. The niche
includes all physical chemical or biotic factors required for successful existence. The
nature of yeasts generally limits them in the range of habitats they can occupy. The
mineral, nutrient as well as organic source of carbon and energy differs between

16
habitats and influence the type of yeasts present in that habitat (Phaff & Starmer,
1980; Phaff, 1986; Lachance & Starmer, 1998).
Several reports show that yeasts grow typically in moist environments where
there is an abundant supply of simple, soluble nutrients such as sugars and amino
acids. (Lachance & Starmer 1998) They are found in widely different aquatic and
terrestrial sources, the atmosphere as well as certain restricted habitats. They may
also be found associated with the body of certain animals since they act as intestinal
commensals.
2.4.2 Lactose Fermenting Yeasts
Some of the known lactose fermenting yeasts are C. pseudotropicalis (C.
kefyr) and Kluyveromyces species. K. lactis is one of the mostly studied yeast species
and making it a model system for comparative studies with S. cerevisiae (Breunig et
al., 2000). Although not commonly used for ethanol production, K. lactis has been
exploited for other biotechnological applications such as the production of
heterologous proteins using cheese whey as culture media (Maullu et al., 1999). The
ability of this yeast to metabolise lactose results from the presence of a lactose
permease (encoded by the LAC12 gene) and a β-galactosidase LAC4 gene) (Rubio-
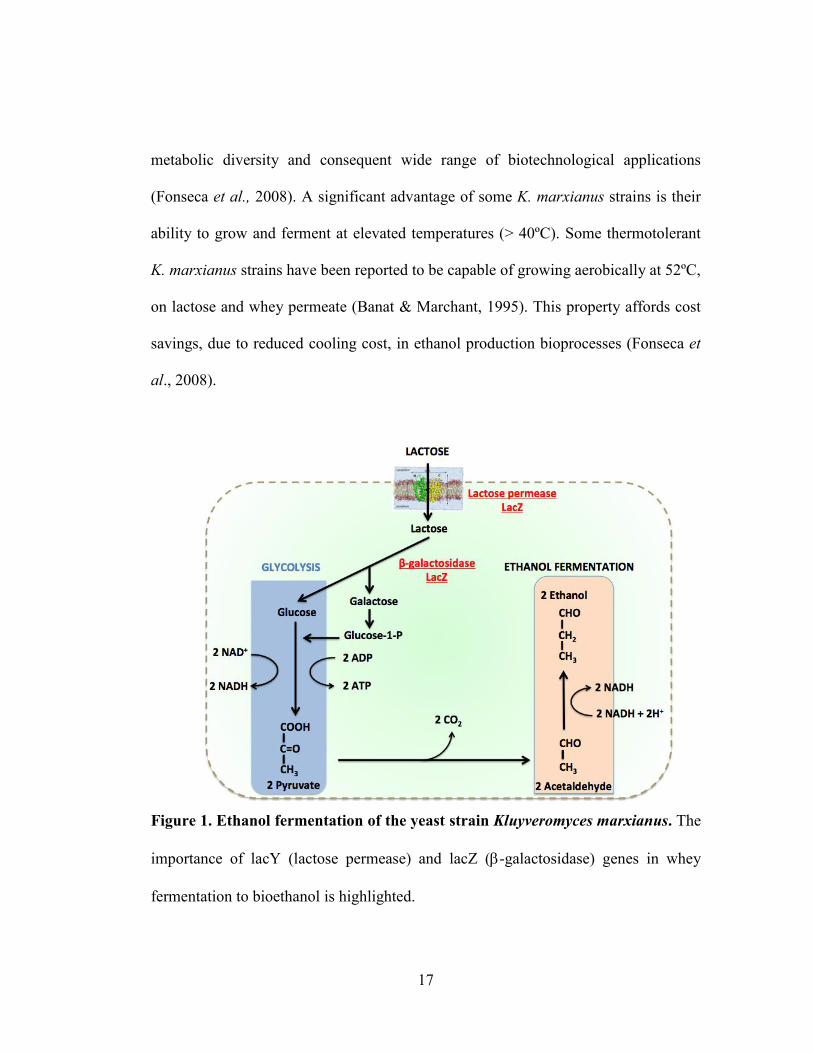
Texeira, 2006) (Figure 1).
In the same genus, K. marxianus has also received attention due to its
biotechnological potential and advantages over K. lactis. K. marxianus isolates
originate from an enormous variety of habitats, accounting for the species broad
17
metabolic diversity and consequent wide range of biotechnological applications
(Fonseca et al., 2008). A significant advantage of some K. marxianus strains is their
ability to grow and ferment at elevated temperatures (> 40ºC). Some thermotolerant
K. marxianus strains have been reported to be capable of growing aerobically at 52ºC,
on lactose and whey permeate (Banat & Marchant, 1995). This property affords cost
savings, due to reduced cooling cost, in ethanol production bioprocesses (Fonseca et
al., 2008).
Figure 1. Ethanol fermentation of the yeast strain Kluyveromyces marxianus. The
importance of lacY (lactose permease) and lacZ (-galactosidase) genes in whey
fermentation to bioethanol is highlighted.
18
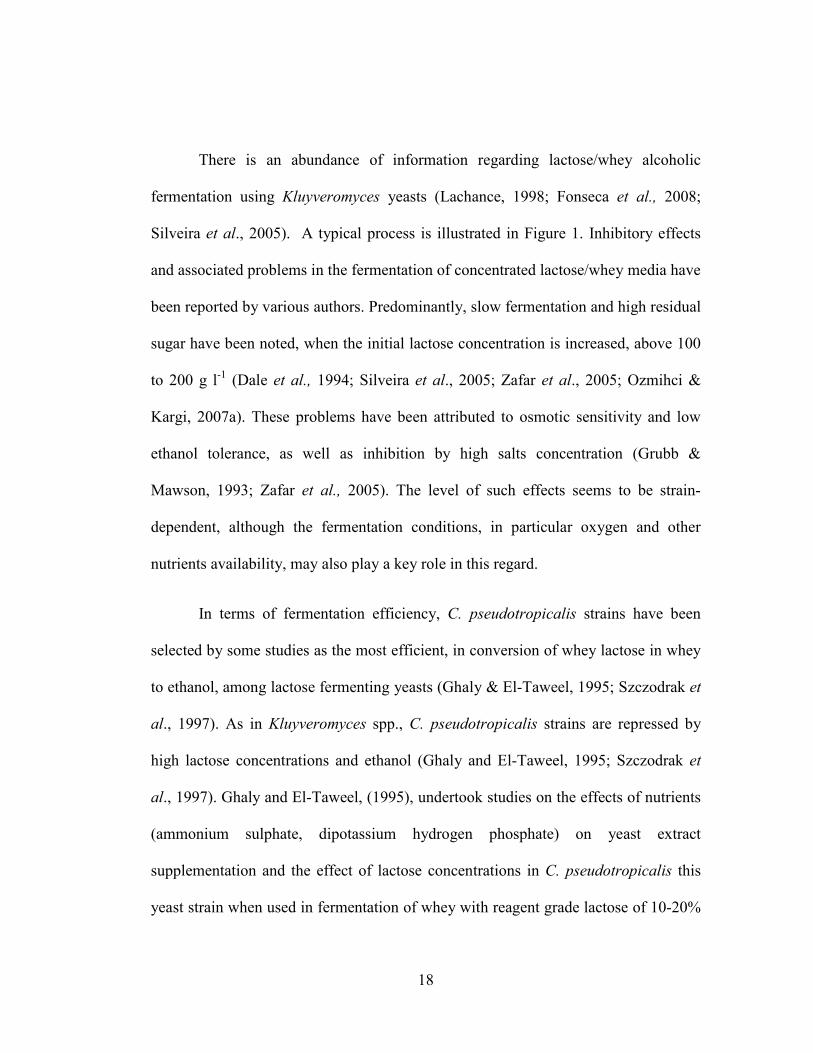
There is an abundance of information regarding lactose/whey alcoholic
fermentation using Kluyveromyces yeasts (Lachance, 1998; Fonseca et al., 2008;
Silveira et al., 2005). A typical process is illustrated in Figure 1. Inhibitory effects
and associated problems in the fermentation of concentrated lactose/whey media have
been reported by various authors. Predominantly, slow fermentation and high residual
sugar have been noted, when the initial lactose concentration is increased, above 100
to 200 g l-1 (Dale et al., 1994; Silveira et al., 2005; Zafar et al., 2005; Ozmihci &
Kargi, 2007a). These problems have been attributed to osmotic sensitivity and low
ethanol tolerance, as well as inhibition by high salts concentration (Grubb &
Mawson, 1993; Zafar et al., 2005). The level of such effects seems to be strain-
dependent, although the fermentation conditions, in particular oxygen and other
nutrients availability, may also play a key role in this regard.
In terms of fermentation efficiency, C. pseudotropicalis strains have been
selected by some studies as the most efficient, in conversion of whey lactose in whey
to ethanol, among lactose fermenting yeasts (Ghaly & El-Taweel, 1995; Szczodrak et
al., 1997). As in Kluyveromyces spp., C. pseudotropicalis strains are repressed by
high lactose concentrations and ethanol (Ghaly and El-Taweel, 1995; Szczodrak et
al., 1997). Ghaly and El-Taweel, (1995), undertook studies on the effects of nutrients
(ammonium sulphate, dipotassium hydrogen phosphate) on yeast extract
supplementation and the effect of lactose concentrations in C. pseudotropicalis this
yeast strain when used in fermentation of whey with reagent grade lactose of 10-20%

19
in a 5 l batch bioreactor yielded an ethanol productivity of 0.7-1.0 g l h-1 and an
ethanol titre of 40-45g l-1while when whey supplemented with yeast extract and 15%
lactose in a continuous bioreactor yielded an ethanol productivity of 1.4 g l h-1 with
an ethanol titre of 58 g l-1. Direct lactose fermenting yeasts generally suffer from low
conversion to ethanol and have poor tolerance to ethanol causing product inhibition
even at concentrations as low as 2%, consequently causing high energy costs due to
distillation required to concentrate the ethanol (Rosa & Sa-Correia 1992; Dale et al.,
1994; Fonseca et al., 2007). Therefore, there is an urgent need to isolate and identify
novel yeast strains or engineer the promising and/or existing strains with robust
fermentative abilities to ensure the achievement of an efficient and optimized whey
fermentation processes.
2.5 Yeast Isolation and Identification
2.5 .1 Yeast Isolation
Yeasts usually occur in the presence of molds and/or bacteria (Yarrow, 1998),
necessitating use of selective techniques for their recovery. Similar to other
heterotrophic living organisms, yeasts require carbon, nitrogen, phosphorous, trace
elements and growth factors as sources of nutrition. In yeast isolation, the media used
should permit the yeast to grow while suppressing molds and bacteria. Most isolation
methods require the use of media, which is acidified using either hydrochloric acid or
phosphoric acid like yeast malt agar acidified to a pH of 3.7. According to Lachance
& Starmer (1998), acidified media is preferred over media incorporated with

20
antibiotics and fungistatic agents; fungistatic agents should be used with caution since
it may also inhibit certain yeasts (Yarrow, 1998).
2.5.2 Yeast Identification
Classical culture-based diagnostic methods use morphological characteristics
of yeasts (size, colour and shape of the colony), as well as biochemical (fermentation
of selected carbohydrates, assimilation of carbon or nitrogen from selected organic
compounds, acid production, etc.). These methods, however, require long time
waiting for the final score, some lasting up to 1–2 weeks. Therefore, laboratories are
increasingly choosing rapid diagnostic tests, such as API® Candida, API® 20C AUX,
and ID32C® that shorten identification time to 24–48 h. Commercial tests are based
on evaluation of selected biochemical properties with assigned values, which in turn
are given a numerical code designating the species (Katarzyna, 2011). The limitation
of rapid diagnostic methods is that they are designed mainly for the identification of
medical yeast isolates (Fricker-Hidalgo et al., 1996). However, yeast identification
using a combination of the laborious and time consuming identification techniques to
molecular taxonomy with improved speed and accuracy in identification due to their
established and comprehensive databases for comparisons of strains have been
reported (Kock et al., 1985; Viljoen et al., 1986; Cottrell & Kock, 1989; Miller et al.,
1989; Botha et al., 1992; Botha & Kock, 1993).
These techniques have also found application in production environments
such as in monitoring the succession of active yeast species during wine production

21
(Guillamón et al., 1998; Esteve-Zarzoso et al., 1999), in analysis of restriction
fragment length polymorphism of the ITS region, allowing for detection and
quantification, of different yeast species (Querrol & Ramon, 1996; Vasdinyei &
Deak, 2003).
Studies by Cai et al. (1996), James et al. (1996), Kurtzman (1992) and
Kurtzman (1993), have demonstrated that the complex ITS (internal transcribed
spacer) regions (non-coding and variable) and the 5.8S rRNA gene (coding and
conserved), are useful in measuring close fungus genealogical relationships (Figure
2). This is due to their ability to exhibit far greater interspecific differences than the
18S and 25S rRNA genes. Ribosomal regions evolve in a concerted fashion and
hence show a low intraspecific polymorphism and a high interspecific variability (Li,
1997). This has proved very useful in the classification of Saccharomyces species
(Huffman et al., 1992; Molina et al., 1992; Valente et al., 1996; Wyder & Puhan,
1997), Kluyveromyces species (Belloch et al., 1998) and, recently, for the
identification of a small collection of wine yeast species (Guillamón et al., 1998).
The use of two universal and two species-specific primers derived from the
D1/D2 region of the 26S rDNA and subsequent sequencing of this domain allows for
rapid and accurate species identification (Hong et al., 2001; Herzberg et al., 2002;
Scorzetti et al., 2002; Daniel & Meyer, 2003). According to Frutos et al. (2004), the
use of D1/D2 domain is generally accepted as the main tool for yeast taxonomy

22
allowing for identification of new ascomycetous yeasts previously not recognized as
novel through use of conventional identification techniques (Kurtzman, 2000).
Figure 2. Schematic representation of the internal transcribed spacer (ITS)
region of ribosomal RNA (rRNA) (Adapted from Gargas & De Priest, 1996).
Databases of the D1/D2 sequences are available for all currently recognized
ascomycetous and basidiomycetous yeasts. This extensive database makes species
identification much easier and could serve as reliable and practical criteria for
identification of most known yeasts (Kurtzman & Robnett, 1998; Kurtzman, 2001;
Wesselink et al., 2002; Abliz et al., 2004; Guffogg et al., 2004; Hesham et al., 2006).

23
CHAPTER THREE
3.0 MATERIALS AND METHODS
3.1 Study Site
The Dairy waste samples (whey, wastewater and swabs) were collected from
KCC, Sameer, and Browns cheese industry in Nairobi and Kiambu counties. Eleven
samples were collected from KCC, four samples from Sameer Dairy Factory Ltd and
six samples from Browns Cheese Industry Ltd (Table 2). Laboratory work was
carried out at Jomo Kenyatta University and Technology (JKUAT) in Kiambu
County, and Kenya Industrial Research and Development institute (KIRDI) in
Nairobi, Kenya.
3.2 Study Design
A cross sectional study which involved purposive sampling was used. The
study area was divided into strata based on the different dairy industries KCC,
Sammer and Brown cheese industries. Samples were collected from various sites that
were chosen purposively based on points of collection and disposal of waste
products.
3.3 Sampling and Collection of Samples
Whey, wastewater and swabs samples were collected from New KCC (Kenya
Cooperatives Creameries), Sameer Agriculture in Industrial Area and Browns Cheese
Industry Ltd in Limuru. Samples were collected randomly at four different points and
24
they were then thoroughly mixed to constitute a composite sample. Collection dates
of the samples were recorded and then transported under cold storage at 4oC in
autoclaved sterile Borosil bottles to the laboratory for analysis.
Table 2. Summary of Sampling done at various sites
Samples KCC Sameer Browns Total
Whey samples 4 3 4 11
Waste water 2
2 4
Swabs 5
5
Total 11 3 6 20
3.4 Growth, Isolation and Evaluation of Fermenting Ability of Yeasts
Collected samples were used for isolating yeast on YEPD (yeast extract
peptone dextrose) agar medium containing yeast extract 1.0%, peptone 2.0%,
dextrose 2.0%, pH 5.5 supplemented with 50 mg chloramphenicol antibiotic and
PDA (potato dextrose agar) media also supplemented with 50 mg chloramphenicol
antibiotic were used in order to inhibit growth of bacteria. Plates were incubated at
30°C for 48 h. After incubation different colonies were picked up (each colony
represented one isolate) on the basis of colony shape and color (Barnett et al., 2000).
The colonies picked were further purified by streaking 3 times on YEPD media.

25
Yeast isolates were evaluated for their ability to ferment lactose by incubating
the cultures at 30oC in test tubes containing YEPL (yeast extract peptone lactose)
medium for selective isolation of lactose utilizing yeasts with inserted Durham tubes.
MacConkey broth supplemented with bromophenol purple dye was used to test for
acid production and fermentation of the yeast isolates. The accumulation of gas in the
Durham tubes and colour change from purple to yellow was used to score for positive
lactose fermenting ability of yeast isolates.
3.5 Phenotypic Characterization of Yeast Isolates
3.5.1 Morphology Characteristics
According to Barnett et al. (2000) and Yarrow (1998), yeast isolates were
identified phenotypically on the basis of colony morphology, colour and elevation on
YEPD (yeast extract peptone dextrose agar) media and photographed under a contrast
microscope.
3.5.2 Cellular Morphology
Preliminary characterization by simple staining (using lactophenol cotton blue
dye and gram iodine solution) of each of the isolates was done (Kango 2010). Briefly,
isolates were picked and suspended on a drop of water on microscope slide on both
sides of the slide followed by flooding with few drops of gram iodine solution on one
side and phenol cotton blue solution on the other side. The slides were then covered

26
with cover slips and incubated at 30oC for 10 min then observed under a light
microscope at ×100 magnification under a microscope.
3.6 Physiological Characterization of Yeast Isolates
3.6.1 Growth at Different Temperature
To determine the ability of the isolates to grow at varied temperature ranges,
each isolate was inoculated in duplicate in 50 ml YEPL (yeast extract peptone
lactose) broth medium containing yeast extract 1.0%, peptone 2.0%, lactose 2.0%,
and incubated at the five different temperatures (25, 30, 35, 42, and 47oC). Two
uninoculated bottles for each temperature were used as controls. Optical densities at
600nm were determined using a spectrophotometer at intervals of 24, 36, and 72 h as
a measure of growth.
3.6.2 Growth at Different pH Ranges
To determine the ability of the isolates to grow at varied pH ranges, YEPL
(yeast extract peptone lactose) broth medium containing yeast extract 1.0%, peptone
2.0%, lactose 2.0%, was prepared separately in conical flasks and the pH adjusted to
3.0, 4.0, 4.5 5.5 and 6.0 using Sulphuric acid. Isolates were inoculated in duplicates
in 50 ml universal bottles containing YEPL broth at different pH and incubated at
30°C. The growth was determined after 24, 36, and 72 h by measuring the
OD600nm.using a spectrophotometer. Two uninoculated bottles for each pH value were
used as negative.

27
3.7 Biochemical Characterization
Biochemical characterization based on the ability of yeast isolates to utilize
various carbon sugars were carried out using API® 20C AUX Kit (bioMérieux,
Marcy l’Etoile, France) according to manufacturer’s instructions. Briefly, using a
wire loop a portion of a 24 h old yeast colony was picked by successive touches and
inoculated in sterile 0.85% NaCl, and 100 µl aliquot of the solution was transferred
into API C medium where it was gently homogenized with a pipette avoiding
formation of bubbles. Each capsule containing the test sugar (D-Glucose, Glycerol,
calcium 2-Keto-Gluconate, L-Arabinose, D-Xylose, Adonitol, Xylitol, D-Galactose,
Inositol, D-Sorbitol, Methyl-αD-Glucopyranoside, N-Acetyl-Glucosamine, D-
Celiobiose, D-Lactose, D-Maltose, D-Sucrose, D-Trehalose, D-Melezitose and D-
Raffinose) was filled with API C medium inoculated with each yeast isolate and
incubated at 30oC for 72 h, utilization of carbon source was seen as change in
turbidity in the ampoules.
3.8: Molecular Genetic Characterization
3.8.1 DNA Extraction for PCR
DNA extraction was carried out using Gentra Puregene® Yeast/Bacteria kit
(Qiagen, USA) according manufacturer`s instructions. 1 ml overnight cell suspension
of the 28 yeast isolates was transferred to a 1.5 ml Eppendorf tube on ice and
centrifuged for 5 s at 13,000 x g to pellet cells and the supernatant carefully discarded
by pouring. 300 l cell suspension solution was added and pipetted prior to the

28
addition of 1.5 µl lytic enzyme solution. The mixture was again mixed by inverting
the tube several times followed by incubation at 37oC for 30 min. After incubation, it
was centrifuged for 60 s at 13,000 x g to pellet cells and the supernatant discarded by
pouring. 300 l cell lysis solution was then added and mixed by pipetting up and
down then 100 l protein precipitation solution was added, vortexed vigorously for
20 s at high speed followed by centrifugation at 13,000 x g for 3 min.
One ml Isopropanol (Scharlab S.L., Spain) was pipetted into a clean 1.5 ml
microcentrifuge tube and the supernatant from previous step added by careful
pouring, mixed by inverting several times, and then centrifuged for 1 min at 13,000 x
g. The supernatant was carefully discarded by draining the tube on a clean piece of
absorbent paper. 300 µl of 70% ethanol (Scharlab S.L., Spain) was added and
inverted several times to wash DNA pellet, centrifuged for 1 min at 13,000 x g and
the supernatant discarded and the tube drained on a clean piece of absorbent paper,
and then air dried for 5 min.
100 µl DNA hydration solution was added and mixed by vortexing for 5 s at
medium speed, 1.5µl RNase solution was added and again mixed by vortexing
followed by pulse spinning to collect liquid. It was then incubated at 37oC for 30 min
followed by further incubation at 65oC for 1 h to dissolve the DNA. The samples
were incubated at room temperature overnight with gentle shaking upon which the
presence of DNA was checked on 1% agarose and visualized under ultraviolet by

29
staining with ethidium bromide. The remaining volume was stored at -20oC. The
genomic DNA was used as template for subsequent PCR amplifications.
3.8.2 Partial Sequencing of the Gene Coding for 26S rRNA
To identify and determine the correct phylogenetic position of the isolates, a
sequence analysis of the variable D1/D2 domain of the large subunit (26S) ribosomal
DNA was performed. Fragments containing about 600 - 650 bp of the 26S rRNA
were amplified by PCR using forward and reverse primers: NL-1 (5’-GCA TAT
CAA TAA GCG GAG GAAAAG- 3’) and NL-4 (5’-GGTCCG TGT TTC AAG
ACG G- 3’) (Hesham et al., 2006). In 50 µl reaction volume containing 2.5 µl of each
forward and reverse primers, 2.0 µl template, 25 µl Taq mix (Roche, USA) and 18 µl
PCR water The PCR was run for 35 cycles with an initial denaturation at 95°C for 4
min, followed by denaturation at 95°C for 60 s, annealing at 52°C for 60 s, an
extension at 72°C for 2 min and a final extension at 72°C for 7 min and holding at
4°C (Ramos et al., 2005). PCR products were separated on a 2% agarose gel
containing 5 μl of ethidium bromide and visualized under UV light. The sizes of the
PCR products were estimated by comparing them to a 100 bp Gel pilot DNA
molecular weight marker (Qiagen, USA).
3.8.2.1 Phylogenetic Analysis
The 26S sequences of isolates were used for a BLAST search in the
EMBL/GenBank databases (www.ncbi.nlm.nih.gov/BLAST/). The 26S sequence of
the isolates were further aligned and compared to published 26S rRNA sequences

30
using the taxonomy browser of the National Center for Biotechnology Information
(NCBI; Bethesda, MD) and GenBank. A phylogenetic tree was constructed with
molecular evolutionary genetic analysis (MEGA), version 4.0 (Tamura et al., 2007)
using a neighbor-joining algorithm and the Jukes–Cantor distance estimation method
with bootstrap analyses where 1000 replicates were performed (Saitou & Nei, 1987).
3.8.3 Amplification of 5.8S-ITS rDNA
Internal transcribed spacer regions (ITS1 and ITS2) and 5.8 S of nuclear
ribosomal DNA was amplified according to method described by White et al. (1990).
The reaction mixture for PCR amplification for all the isolates was prepared using 50
μl volume containing 2.5 µl ITS-1 (5'-TCC GTA GGT GAA CCT GCG G-3'), 2.5 µl
ITS-4 (5'-TCC TCC GCT TAT TGA TAT GC-3'), 2.0 µl template, 25 µl Taq mix
(Roche, USA) and 18 µl PCR water. The PCR conditions was: 40 cycles including an
initial denaturation at 95oC for 4 min, denaturation at 95oC for 30 s, annealing at
50oCfor 30 s and extension at 72oC for 2 min followed by final extension at 72oC for
7 min and holding at 4oC. PCR products were separated on a 2% agarose gel
containing 5 μl of ethidium bromide and visualized under UV light. The sizes of the
PCR products were estimated by comparing them to a 100 bp Gel pilot DNA
Molecular weight marker (Qiagen, USA).
31
3.8.4 Purification of Samples for Sequencing
Amplicons amplified using NLI and ITS primers were purified using Roche
Sequencing Purification kit according to manufacturer`s instructions (Roche, USA)
and taken to ILRI for sequencing.
3.8.5 Restriction Analysis of the PCR Products
Amplified internal transcribed spacer regions (ITS1 and ITS2) and 5.8S of
nuclear ribosomal DNA was used for restriction analysis. An aliquot of PCR product
10 µl were digested with 2 µl buffer, 1 µl enzyme and 9 µl PCR water in 22 µl
reaction volume, according to manufacturer instructions the restriction enzymes used
were HaeIII and Hinf1(Roche USA). PCR aliquots digested with HaeIII were
incubated 37oC for 1 h then deactivated at 65oC for 10 min, Hinf1 was incubated for
fourteen hours then deactivated at 65oC for 10 min. Digested DNA fragments were
separated by gel electrophoresis in 3% (w/v) agarose (Sigma Aldrich, Steinheim,
Germany) gel for 2 h at 80 V and compared to a 100 bp marker from (Promega,
USA).
3.9 Chemical Analysis
3.9.1 Proximate Composition
3.9.1.1 Crude Protein
Crude protein content of whey (N x 6.25) was determined according to the
improved Kjeldahl method (Approved Method 46-12A; AACC, 2000) with slight
modifications. 1 g of dried sample was accurately weighed in a nitrogen free-filter

32
paper and placed in a Kjeldhal flask upon which 1 tablet of Kjeldhal catalyst and 5 ml
of concentrated H2SO4 were added to the flask. The mixture was digested in a fume
cupboard for about 2 h until a clear solution was obtained. A blank sample of only a
filter paper, Kjeldhal catalyst and H2SO4 was also digested. After cooling, distilled
water was added to increase the volume of the mixture to three-quarters of the flask.
The flask was connected to the distillation unit after adding 1 ml phenolphthalein and
10 ml 40% NaOH solution. Distillation was carried out until a drop of distillate did
not react with Nessler’s reagent placed in a test tube. The distillate was collected in a
400 ml conical flask containing 50 ml 0.1 N HCl solution and 2-3 drops methyl
orange indicator. The excess HCl solution in the distillate was back titrated with 0.1
N NaOH. The percent nitrogen was calculated as follows:
Protein content was calculated by multiplying the percent nitrogen by 6.25.
3.9.1.2 Total Carbohydrates
Reagents phenol 80% w/v in water was prepared by adding 20 g water to 80 g
phenol (Ferak, Berlin) and concentrated H2SO4. 1 ml of sample was initially diluted
in a 100 ml volumetric flask. In a test tube, 1 ml of diluted sample, 1 ml of water and
0.05 ml of 80% phenol was added and mixed on a vortex test tube mixer. To each
tube five 5 ml of concentrated H2SO4 was added and mixed on a vortex mixer. The

33
tubes were then allowed to cool and mixed again using the vortex mixer. The
absorbance of the treated samples was read at 490 nm against standards containing
100, 200, 300, 400 and 500-ppm lactose.
3.9.1.3 Total Ash and Mineral Profiling
The ash content of whey was measured according to AOAC Approved
Method 942.05 (AOAC, 1984). Approximately 200 ml of sample was taken and dried
at 105oC overnight then 5 g of each sample was weighed into a porcelain crucible and
placed in a temperature controlled furnace preheated to 550oC. The sample was held
at this temperature for 2 h. The crucible was then transferred directly to a desiccator,
cooled and weighed. Ash content was reported as a percentage of the whole sample.
For mineral profiling of the samples, 10 ml of sample was taken and 20 ml of
50% HCl was added and the sample was heated until a dark color was observed. The
heated sample was filtered and made up to 100 ml using distilled water and the
concentrations of Ca, Fe, Zn, Bo and Co determined using an AA-6300 atomic
absorbance spectrophotometer (Shimadzu Scientific Instruments, Columbia, USA).
3.9.2 Chemical Oxygen Demand (COD)
0.4 g mercuric sulfate (HgSO4) crystals with few granules of anti-bumping, 20
ml of x1000 diluted sample and 10 ml standard potassium dichromate (K2Cr2O7)
solution were placed in a refluxing flask connected to the condenser. 30 ml
concentrated H2SO4 containing silver sulfate (Ag2SO4) was added slowly through the
open end of the condenser and mixed thoroughly by swirling while adding the acid.
The mixture was refluxed for 2 h, cooled and then 90 ml of distilled water added

34
through the condenser. A blank consisting of 20 ml distilled water instead of sample
was treated in the same manner. The excess dichromate was titrated with standard
ferrous ammonia sulfate/Mohr`s salt [(NH4)2Fe(SO4)26H2O] in presence of 2-3 drops
ferroin indicator. The end point was indicated by the sharp colour change from blue-
green to reddish brown.
3.9.3 pH and Total Titratable Acidity (TTA)
The pH meter was calibrated using standardized buffer solutions of acidic and
basic values of 4.01 and 9.08 at 25ºC before use (TOA pH Meter HM–7B, Tokyo,
Japan). The TTA was determined according to Lonner et al. (1986). Briefly,
approximately 10 ml sample was pipetted into a conical flask and 2 drops of
phenolphthalein indicator added. Titration was done using 0.1M NaOH to a faint pink
color for 1 min and compared against a white background. The titre volume was
noted and used for calculations of TTA, which was expressed as percentage lactic
acid as follows;
% Lactic Acid = A 0.009 100/V
where: A = ml of 0.1 NaOH required for the titration; and V =
ml of sample taken for the test.0.009 is a Constant

35
3.9.4 Total Soluble Solids (BRIX)
Total soluble solids of the samples were read using a refractometer, which
was thoroughly cleaned before use. A small amount of distilled water was placed on
the prism of the refractometer and the value read for zeroing machine followed by
drying the lens using tissue paper. For Brix measurement, small amount of sample
placed on the prism and the value read as a percentage, and the refractometer
thoroughly before subsequent reading of samples.
4.0 Optimization of Whey Fermentation using Yeast Isolates
4.1 Effect of substrate concentration, Temperature and inoculums size
Whey collected from Browns Cheese Industry was adjusted to 10, 12 and
15% Brix using commercial lactose (Oxoid) and fermented using various yeast
isolates at 30, 35 and 40oC and at different yeast concentration of 10 and 20% for 120
h. Samples were taken periodically after every 24 h for sugar, Total soluble solids and
pH were determined as described in 3.9.3 and 3.9.4. The remaining samples were
centrifuged at 4000 rpm for 10 min and the supernatant kept in the refrigerator prior
to ethanol determination using HPLC.
4.2 Ethanol Determination
The amount of ethanol in the fermented whey samples was determined in 10
AT High Performance Liquid Chromatograph (Shimadzu Corp., Kyoto, Japan)
equipped with 10 A refractive index detector (Shimadzu Corp., Kyoto, Japan). Using
discovery ® HSC18 (Supelco-USA) reverse phase column at a temperature of 30oC,

36
and 0.005M H2SO4 as a mobile phase at a flow rate of 0.7 ml/min with a refractive
index detector and control temperature of 40oC. Samples were filtered with a 0.45mm
membrane filter prior to injection into the machine with 1, 2, 4, 6 and 10% ethanol
(Scharlab S.L., Spain) as standard.

37
CHAPTER FOUR
4.0 RESULTS AND DISCUSSION
4.1 Growth, Isolation and Evaluation of Fermenting Ability of Yeasts
In this study, 42 different yeast strains were isolated from twenty samples that
included whey, wastewater and swabs. On the basis of morphology characteristics,
the isolates were grouped into 5 groups on the basis of colony morphology (Table 3,
Figure 3 and 4). All the isolates were white to cream in color, with most being round
in form and only seven isolates being undulate. A greater percentage of the isolates
had raised elevation with only two isolates having convex elevation. Also, most of
the isolates had entire margin with seven isolates being undulate (Table 3).
Twenty eight yeast isolates were found to have lactose-fermenting ability due
to their ability to reduce pH of MacConkey media from 7.4 to 5 during fermentation
(figure 6). In addition, these isolates were able to ferment lactose when grown on
YEPL broth producing gas (Figure 5) These strains were further characterized on the
basis of morphological (Table 3) and physiological characteristics (Figure 7 and 8)
and also identified using several biochemical tests, including ability to ferment
different carbon sugars and molecular characteristics.

38
Table 3. Phenotypic characterization of yeast isolates
Group*
Colony characteristics
Form Colour Margin Elevation Identity
I Round White Entire Raised
BM4, BM1, P45,
M4, P2, P43, M11,
BS4
II Round Cream-White Entire Convex P42, YC5
III Round Cream Entire Raised
P3A, PB9, PB10,
PC2, P21, YC1,
YC4, YB2, BM9,
YC2, P3
IV Irregular Cream-White Undulate Raised P41, M3, P44, P22,
M15, YC6
V Round White Undulate Raised M5
NB:* Shows grouping on the basis of colony Morphology

39
Figure 4: Cellular Morphology of strain P2 (Kluyveromyces species)
Figure 3: Colony Morphology of strain P2 (Kluyveromyces species)

40
Table 4. Mean growth of Yeasts under different pH ranges showing significant
differences of the isolates at each pH range
Isolate pH3.0 pH 4.0 pH 4.5 pH 5.5 pH 6
BM1 1.05a 0.84 a 1.26abc 0.93a 0.52bc
BM4 0.91 a 0.50 a 1.01abcdef 0.74 a 0.81abc
BM9 0.47 a 0.61 a 0.91abcdef 1.18 a 0.84abc
BS4 0.73 a 0.56 a 0.82abcdef 0.98 a 1.28ab
M11 1.00 a 0.52 a 1.39ab 0.91 a 1.02abc
M15 0.86 a 0.81 a 1.22abc 0.97 a 1.12abc
M3 0.72 a 0.64 a 1.14abcde 1.16 a 1.24ab
M4 0.53 a 0.57 a 0.64bcdef 1.38 a 1.11abc
M5 1.23 a 0.95 a 1.14abcde 1.22 a 1.64a
P 42 0.87 a 0.52 a 1.14abcd 1.15 a 1.05abc
P2 0.76 a 0.38 a 1.00abcdef 0.79 a 0.96abc
P21 0.68 a 0.82 a 1.19abc 1.23 a 1.02abc
P22 0.99 a 0.62 a 1.20abc 1.23 a 1.17abc
P3A 0.79 a 0.49 a 1.01abcdef 0.77 a 0.86abc
P41 0.70 a 0.49 a 1.32ab 1.13 a 0.97abc
P43 0.91 a 0.67 a 1.55a 1.19 a 1.25ab
P44 1.06 a 0.68 a 0.87abcdef 0.96 a 0.71bc
P45 0.87 a 0.61 a 1.21abc 1.08 a 0.60bc
PB10 0.34 a 0.93 a 0.48cdef 0.90 a 1.01abc
PB9 0.52 a 0.58 a 1.15abcd 0.92 a 0.86abc
PC2 0.57 a 0.93 a 1.09abcdef 0.82 a 0.98abc
PC3 0.84 a 0.60 a 0.97abcdef 1.24 a 0.79abc
YB2 0.25 a 0.61 a 1.40ab 0.96 a 1.03 abc
YC2 0.72 a 0.54 a 0.94abcdef 0.92 a 0.36c
YC4 0.89 a 0.54 a 0.88abcdef 0.75 a 0.76bc
YC5 0.61 a 0.60 a 0.95abcdef 0.91 a 0.87abc
YC6 0.79 a 0.80 a 1.60a 0.75 a 0.97abc
YCI 0.50 a 0.54 a 0.92abcdef 1.02 a 0.83abc

41
Table 5. Mean growth of Yeasts under different temperature ranges showing
significant differences of the isolates at each Temperature
Isolate 25ºC 30ºC 37ºC 42ºC 47ºC
BM1 0.79bcde 1.18a 1.47ab 0.96ab 0.95ab
BM4 0.71cde 1.41 a 1.61a 1.24a 0.78abcd
BM9 1.45a 1.22 a 1.31abcdefg 0.57 ab 0.52bcde
BS4 0.78bcde 1.26 a 0.75fghi 0.48 ab 0.44cde
M11 0.74bcde 1.33 a 1.38abcdef 0.48 ab 0.23 e
M15 1.45a 1.71 a 0.93bcdefgi 0.51 ab 0.54 e
M3 1.44a 1.33 a 1.10abcdefghi 0.75 ab 0.91abc
M4 0.63de 1.12 a 1.32abcdefg 0.65 ab 0.35de
M5 0.68cde 1.63 a 1.27abcdefg 1.19 ab 0.84abcd
P 42 1.28abcd 1.05 a 1.44abcd 0.64 ab 0.43cde
P2 0.89abcde 0.92 a 1.20abcdefgh 1.20 ab 1.02a
P21 0.87abcde 1.37 a 0.56hi 0.55 ab 0.48 e
P22 1.40a 1.45 a 1.42abcde 0.81 ab 0.25e
P3A 0.54e 1.14 a 1.28abcdefg 0.66 ab 0.25e
P41 1.32abc 1.37 a 1.17abcdefghi 0.95 ab 0.51bcde
P43 1.37ab 1.44 a 1.60a 0.85 ab 0.19 e
P44 0.51e 1.56 a 1.44abc 0.53 ab 0.22 e
P45 0.75cde 1.29 a 0.78fghi 0.49 ab 0.50bcde
PB10 0.74bcde 1.13 a 1.04abcdefghi 0.51 ab 0.21 e
PB9 1.08abcde 1.05 a 0.71ghi 0.62 ab 0.40de
PC2 1.13abcde 1.50 a 1.44abc 0.45 ab 0.28e
PC3 0.68cde 0.60 a 0.80cefghi 0.68 ab 0.47cde
YB2 0.68cde 1.27 a 0.77fghi 0.35b 0.17 e
YC2 0.73bcde 1.28 a 0.62hi 0.72 ab 0.34de
YC4 0.75bcde 1.26 a 1.17abcdefghi 0.44 ab 0.59bcde
YC5 0.88abcde 1.04 a 1.44abcd 0.59 ab 0.51bcde
YC6 0.79bcde 1.45 a 1.03abcdefghi 0.69 ab 0.24e
YCI 0.61de 1.30 a 0.93bcdefghi 0.58 ab 0.43cde

42
Figure 5. Gas production by lactose fermenting yeast grown on YEPL media. C
shows a control where there is no gas formation and P showing positive isolates with
gas formation
Figure 6. Acid production by yeast isolates cultured on MacConkey media. C denotes control
while P is positive isolate that changed the colour of the media after fermentation

43
4.2 Physiological Characterization
The ability of yeast isolates exhibiting lactose-fermenting ability to grow
under different temperature levels and pH ranges was evaluated. The mean growth of
the 28 yeasts isolates showed an optimal growth at 30oC and generally good growths
at 25 and 37oC that was observed after 24 and 36 h after incubation (Figure 7 and
Table 5). However, there was minimal growth observed at 42 and 47oC for 24 h and
subsequent decreased growth at 36 and 72 h. Figure 8 and Table 4 depicts the ability
of isolated yeast strains to grow under different pH ranges. It was also observed that
the mean growth of most yeasts isolates was highest at pH range of 4.5-6.0.
Furthermore, yeast isolates were also able to grow at pH 3 and 4.
Figure 7. Effect of Temperature on growth of dairy industry yeasts

44
Figure 8. Effect of pH on growth of dairy industry yeasts
4.3 Biochemical Characterization of Dairy Industry Yeasts (API® 20C AUX)
All the 28 yeast isolates that had showed ability for lactose fermentation were
subjected to various biochemical tests using an API® 20C AUX kit. The API 20C
system (bioMérieux, Marcy l’Etoile, France)
All isolates were able to utilize glucose, glycerol, calcium 2-ceto gluconate,
maltose, saccarose, trehalose and raffinose while only two isolates BM9 and PB9
were not able to assimilate xylitol. Only 6 isolates (PC2, BM4, M11, P2, BM9 and
P21) were able to utilize adonitol (Table 6). Twelve isolates were negative for
inositol and this were YC1, BM1, P41, P42, BM9, YC5, M5, YC6, PC3, P3A, M4
and YC2 whereas isolate BM9 and P3A were negative for sorbitol (Table 6).Three
isolates were negative for MDG namely P41 YC5 and M4. PC2, BM4, BM1, P41,
P42, BM9, P22, YC5, M4, P45, P21, YC2 and PB9 were positive for melezitose
(Table 4). Based on results achieved through the use of AP1 kit, the closest relatives

45
of the yeast isolates were mainly of clinical nature as shown in Table 6, which
differed from the results of molecular characterization.

46
Table 6. Biochemical characterization of yeast isolates showing their closest relative on the basis of API kit
P
C2
BM
4
YC
1
BM
1
M1
1
M1
5
YC
4
P2
P4
1
BS
4
P4
2
BM
9
P2
2
YC
5
M5
YC
6
PC
3
P3
A
M4
P4
5
P2
1
YC
2
PB
9
Assimilation of Carbohydrates
D-Glucose + + + + + + + + + + + + + + + + + + + + + + +
Glycerol + + + + + + + + + + + + + + + + + + + + + + +
Ceto-G + + + + + + + + + + + + + + + + + + + + + + +
L-Arabinose + + + + + + + + + + + + + + + + + + + + + + +
D-Xylose + + + + + + + + + + + - + + + - - + + + - + -
Adonitol + + - - + - - + - - - + - - - - - - - - + - -
Xylitol + + - - + - - + - - - + - - - + + - + - + - -
D-Galactose + + + + + + + + + + + + + + + + + + + + + + +
Inositol + + - - + + + + - + - - + - - - + + - + + - +
D-Sorbitol + + + + + + + + + + + - + + + + + - + + + + +
MDG + + + + + + + + - + + + + - + + + + - + + + +
NAG + + + + + + + + + + + + + + + + + + + + + + +
D-Celiobiose + + + + + + + + + + + + + + + + + + + + + + +
D-Lactose + + + + + + + + + + + + + + + + + + + + + + +
D-Maltose + + + + + + + + + + + + + + + + + + + + + + +
D-Saccharose + + + + + + + + + + + + + + + + + + + + + + +
D-Trehalose + + + + + + + + + + + - + + + + + + + + + + -
D-Melezitose + + - + - - - - + - + + + + - - - - + + + + +
D-Raffinose + + + + + + + + + + + + + + + + + + + + + + +
Iden
tity
by
AP
I
kit
(Clo
sest
rela
tiv
e)
C.
fam
ata
C.
fam
ata
C.
alb
idu
s
C.
alb
idu
s
C.
fam
ata
C.
hu
mic
ola
C.h
um
ico
la
C.
fam
ata
C.q
uil
lier
mo
nd
ii
T.a
sah
ii
C.a
lbid
us
T.
asa
hii
C.
hu
mic
ola
C.l
au
ren
ti
C.l
au
ren
tii
T.
mu
coid
es
T.m
uco
ides
T.m
uco
ides
C.l
au
ren
tii
C.
hu
mic
ola
T.
Mu
coid
es
C.
lau
ren
tii
T.
mu
coid
es

47
4.4 Molecular Genetic Characterization
In order to identify and determine the correct phylogenetic position of the yeast
isolates, molecular genetics identifications were performed. In this way, the genomic
DNA was extracted from the all isolated yeast strains, and primers NL1 and NL4 were
used for the amplification and sequencing of the D1/D2 region of the 26S rRNA gene.
As shown in (Figure 9), the size of the amplified 26S rRNA gene were about 600 to
650 bp for all the yeast isolates, which is the expected size of 26S rRNA regions.
Figure 9. Amplified DNA of D1/D2 domain of isolates run in 2% (W/V) agarose
gel. Lanes: M, 100bp marker; 1, negative control; 1, BM2; 2, PC2; 3, BM1; 4, YC6;
5, PB9; 6, P41; 7, BS4; 8, M11; 9, YB2; and 10, P21.
The obtained sequence data for the yeast isolates were compared with the
sequences of 26S rRNA regions available in Genbank for each by means of BLAST
search of the National Center for Biotechnology Information (NCBI) databases.
Alignment of the 26S rRNA gene sequences of these isolates with sequences obtained

48
by doing a BLAST search showed different similarity to different yeast species (Table
7).
4.4.1 Phylogenetic Analysis of the of D1/D2 domain 26S rDNA and 5.8S-ITS
rDNA region Sequences
To confirm the position of each strain in phylogeny, a number of sequences
were selected from Genbank database for the construction of a phylogenetic tree
using Chromas Pro (Technelysium Ltd) and MEGA4 software (Tamura et al., 2007).
Phylogenetic analysis demonstrated that the isolates belonged to various genera.
As shown in (Figures 10, 11 and Appendices 1-4), the phylogenetic trees
indicated that isolates BM9, BM4, BM2, M11, P2, YC4 and Kluyveromyces marxianus
shared one clade cluster with similarities 99%. Therefore, these isolates were identified
as K. marxianus. In contrast, isolate P41 and K. lactis shared one clade cluster with the
similarity 98% and was thus identified as K. lactis (Figure 12).
Figure 10. Phylogenetic tree for Kluyveromyces marxianus strain BM9 and
related species constructed by the neighbor-joining method based on the D1/D2
domain of LSU rRNA gene sequences. Segments corresponding to an evolutionary
distance of 0.01 are shown with bars. Accession numbers for sequences are also
shown in the phylogenetic tree.

49
Figure 11. Phylogenetic tree for Kluyveromyces marxianus strain BM4 and
related species
Figure 12. Phylogenetic tree for Kluyveromyces lactis strain P41 and related species

50
Figure 13. Phylogenetic tree for Pichia norvegensis strain YC1 and related species
For isolates YC1, YB2, YC6, PC2, PB9, and PB10, the phylogenetic trees
(Figures 13 and 14, and Appendices 5-8) were constructed by selected sequences
representing Pichia sp. from Genbank database. While isolates YC1, YC6 & PC2 and
Pichia norvegensis shared one clade cluster with 99% similarity, isolates YB2, PB9
and PB10 were identified as Pichia cactophila due to sharing of a clade cluster with
99% similarity. On the basis of phylogenetic analysis, isolates YC5, BM1, & P22
were identified to belong to genera Candida, where isolate YC5 and BM1 shared 94
and 99% similarity, respectively, with Candida inconspicua while P22 and P21 had
99% similarity with Candida tropicalis (Figures 15, 16, and 17, and Appendices 9-
13). On the other hand, phylogenetic analysis of isolates M3, P42, P43 and P45
revealed that these isolates were closely related to Yarrowia lipolytica with similarity
99% similarities.

51
Figure 14. Phylogenetic tree for Pichia cactophila strain YB2 and related species.
During the study, some isolates which included isolates BS4, M4, M5, M15,
P45 and PC3 could not be correctly identified using the sequences of the D1/D2
domain of the 26S rDNA gene. It has previously been demonstrated that the 5.8S-ITS
rDNA analysis is a reliable routine technique for the differentiation of yeasts at
species level. Consequently, the sequences of the internal transcribed spacers
(ITS1and ITS2) of 5.8S-ITS rDNA were also performed and the phylogenetic
analysis applied for the identification of the above isolates.

52
Figure 15. Phylogenetic tree for Candida inconspicua strain YC5 and related
species
Figure 16. Phylogenetic tree for Candida tropicalis strain P21 and related species

53
Figure 17. Phylogenetic tree for Yarrowia lipolytica strain M3 and related species
BLAST results revealed that the six isolates BS4, M4, P21, M5, M15, P45
and PC3 were identified as K. marxianus, C. catenulate, C. tropicalis, Y. lipolytica, Y.
lipolytica, Y. lipolytica, and P. cecembensis, respectively, due to homologies >95%
for all the isolates (Table 7 and Appendices 14-19). The results obtained from the ITS
region show that this gene region is a useful marker for identification of yeast species.
The identity of the isolates based on the homologies of the sequences of the
26S rDNA, D1/D2 domain, and ITS region with those deposited in the Genbank
databases is summarized in Table 7. Therefore, the results of the study is consistent
with other studies that have reported that molecular methods based on the
combination of sequences of the 26S rDNA, D1/D2 domain, and ITS region are rapid
and precise tools when compared with physiological methods for the identification
and typing of yeast species (White et al., 1990).

54
Table 7. Identification of yeast isolates by comparative sequence of the D1/D2
domains of 26S rDNA and the 5.8S-ITS rDNAa region.
Isolate Identity (%) Closest Relative (Accession Number)
BM1 99% Candida inconspicua (U71062.1)
BM2 99% Kluyveromyces marxianus(FJ896140.1)
BM4 99% Kluyveromyces marxianus (DQ139802.1)
BM9 99% Kluyveromyces marxianus (AY894820.1)
BS4 a 99% Kluyveromyces marxianus (JX174415.1)
M3 99% Yarrowia lipolytica (FJ480852.1)
M4 a 99% Candida catenulata (JN8370 95.1)
M5 a 95% Yarrowia lipolytica (HE660067.1)
M11a 99% Kluyveromyces marxianus (HQ436414.1)
M15 99% Yarrowia lipolytica (FJ515197.1)
P2 99% Kluyveromyces marxianus (HQ436414.1)
P21 99% Candida tropicalis (FN376412.1)
P22 99% Candida tropicalis (GU373750.1)
P41 98% Kluyveromyces lactis (FJ844399.1)
P42 99% Yarrowia lipolytica (FJ480852.1)
P43 99% Yarrowia lipolytica (GU373759.1)
P45 a 99% Yarrowia lipolytica (DQ659346.1)
PB9 99% Pichia cactophila (GU460184.1)
PB10 99% Pichia cactophila (GU460181.1)
PC2 99% Pichia norvengensis (FJ972223.1)
PC3 a 95% Pichia cecembensis (EU315768.1)
YB2 99% Pichia cactophila (GU460184.1)
YC1 99% Pichia norvengensis (FJ972223.1)
YC4 99% Kluyveromces marxianus (GQ121676.1)
YC5 94% Candida inconspicua (EF550240.1)
YC6
YC2
99%
99%
Pichia norvengensis (AB278168.1)
Pichia norvengensis(FJ972223.1)

55
4.4.2 Discrimination of Yeast Species by PCR-RFLPs of the 5.8S-ITS rDNA
Region
To determine the species, a PCR-RFLP analysis of the 5.8S-ITS rDNA region
was also used to identify 15 yeast isolates (Figure 18, 19 and 20). The 5.8S-ITS
rDNA region was initially PCR-amplified using primers ITS1 and ITS4. As shown in
Figure 14, PCR products showed a unique variation for the different species analysed,
for example, 750 bp for K. marxianus, 500 bp for P. norvergensis and 400 bp for Y.
lipolytica. Fifteen different restriction patterns were generated by using two
restriction enzymes HinfI and HaeIII, whereby the sizes of the PCR product and
restriction fragments were visually estimated by comparison with a 100-bp DNA
ladder (Figure 19 and 20). When using Hinf1, the amplicons of strains P42, P43, M3,
YC6, YB2, YC2 and PB9 gave restriction fragments of 190 and 290 bp, while strain
BM1 gave resultant fragments at 200 and 280 bp from the original 500 bp amplicon.
Similarly, HaeIII digestion of 510 bp amplicon in strain PC3 resulted in two
fragments of 210 and 300 bp. In contrast, the digestion of BM2, M11, BS4, and BM4
PCR product gave fragments of 300, 220, 130 and 100 bp (Table 8). When HaeIII
was used, no restriction digestion was observed for isolate BM1, P42, P43 and M3,
with two fragments of 400 and 110 bp being observed for strain PC3. On the other
hand, YC6 digestion gave two bands at 380 and 100 bp while BM2 gave three bands
at 100, 200 and 350 bp and M11 giving fragments at 100, 210 and 480 bp. Finally,
BS4 and BM4 had fragments of 650 and 100 bp with strains YB2 and YC2 giving
380 and 100 bp, while isolate P3A had fragments 400 and 100 bp (Table 8). These

56
results demonstrated that heterogeneity in the sequence of the 5.8S-ITS rDNA region
can be used for the discrimination between closely related yeast isolates.
Figure 19. Amplicons digested with Hinf1 restriction enzyme. Lanes: A, P42; B,
P43; C, PC3; D, M3;E, BM1; F,P2; G, BM2; H, YC6; I, M4; J, BS4; K, BM4; L,
P21; M, YB2; N, YC2; and O, PB9.
Figure 18. Amplified DNA of 5.8 S ITS DNA of 14 isolates run in 2% (W/V)
agarose gel. Lanes: M, 100 bp marker; -, negative control; A, PB9; B, M15; C, BS4; D,
BM2; E, BM4; F, P2; G, PC2; H, YC2; I, YC1; J,P42; K, P21; L, YB2; M, P45; and N,
P43.

57
Figure 20. Amplicons digested with HaeIII restriction enzyme. Lanes: A, P42; B,
P43; C, PC3; D, M3; E, BM1; F, P2; G, YC6; H, BM2; I, M4; J, BS4; K, BM4;
L, P21; M, YB2; N, PB9; and O, P3A.

58
Table 8. Length in bp of the PCR-amplified products of 5.8S-ITS rDNA region
and ITS-RFLP obtained with two restriction endonucleases
NDa not detected
4.5 Ethanol Fermentation by Isolated Yeast Strains
4.5.1 Characterization of whey Samples
The whey used in the study had a COD of 68 000 mg/l, the protein content
(dry weight basis) of 1.02%, ash content of 0.55%, and lactic acid content of 0.69%
(Table 9). The mineral content included: boron, 40 mg/l; iron, 4.5 mg/l; calcium,

59
28.37 mg/ml and zinc content of 1.52 mg/l. However, no cobalt was detected while
the initial total soluble solid was 5.3% with a total carbohydrate content of 5.3 mg/l
and pH of 5.2.
Table 9. Characteristics of whey used for ethanol fermentation
Properties Amount
Crude protein (dry weight) (%) 1.02
Chemical Oxygen Demand (COD) (mg/l) 68,000
Ash content (%) 0.55
Lactic acid (%) 0.69
Boron (mg/l) 40
Iron (mg/l) 4.5
Calcium (mg/l) 28.37
Zinc (mg/l) 1.52
Cobalt (mg/l) NDa
Total Soluble solids (TSS) (%) 5.3
pH 5.2
Total carbohydrate (mg/ml) 5.9
NDa not detected

60
4.5.2 Ethanol Fermentation
Four yeast strains chosen initially due to their robust lactose fermentation
ability (K. marxianus strain BM9, K. marxianus strain BM4, K. lactis strain P41, and
P. cactophila strain YB2) were used for further bioethanol production experiments
from industrial whey.
As shown in Table 10, fermentation using K. marxianus strain BM9 yielded
an ethanol concentration of 4.91 and 1.28% at pH 4.5 and 6, respectively. At different
sugar concentrations, the strain also yielded ethanol concentrations of 4.08, 2.10, and
1.74% at 10, 12, and 15% Brix sugar concentration, respectively. Culturing at 35oC
resulted in the highest ethanol production compared to a yield of 0.82 and 0.50%
when fermentation was carried at 30oC and 40oC, respectively. Ethanol production of
1.02 and 0.62% was achieved at inoculation rates of 10 and 20% yeast
concentrations, indicating that the rate of yeast inoculation did not result in
significant differences in ethanol production. In contrast, K. marxianus strain BM4
yielded an ethanol concentration of 5.25 and 2.63% at pH 4.5 and 6, respectively. In
addition, ethanol concentration at different sugar concentrations were 4.02, 1.58 and
3.06% when cultured in whey with adjusted Brix at 10, 12 and 15%, respectively.
However, no significant differences were observed at different temperatures (0.84,
0.68, and 0.58 ethanol concentration at temperatures 30, 35 and 40oC, respectively)
and yeast inoculation rates (1.83 and 1.46 % ethanol yield at 10 and 20%,
respectively (Table 10).

61
Similar to K. marxianus strain BM4 and K. marxianus strain BM9, both K.
lactis strain P41 and P. cactophila strain YB2 also showed higher ethanol
productivity at pH 4.5 compared to pH 6.0 (Table 10). At pH 4.5, the ethanol
productivity for K. lactis strain P41 was 5.05% while 3.33% ethanol was realized at
pH 6.0. Likewise, ethanol productivity at pH 4.5 by P. cactophila strain YB2 was
almost double than that at pH 6.0. However, P. cactophila strain YB2 did not show
any significant differences in ethanol productivity at different fermentation
temperatures. In contrast, K. lactis strain P41 gave higher ethanol production (1.91%)
at 30oC compared to lower ethanol values of 0.48 and 0.56% at 35 and 40oC,
respectively. The sugar concentration (% Brix) of whey had similar effect on ethanol
production for the two strains, where higher ethanol productivity was achieved at
when whey was adjusted to 12% Brix.

62
Table 10. Effect of different cultural conditions on ethanol production from
whey by K. marxianus strain BM4, K. marxianus strain BM9, K. lactis strain P41
and P. cactophila strain YB2 after 120 h*
Culture Condition
Ethanol Production (% w/v)
K. marxianus
strain BM4
K. marxianus
strain BM9
K. lactis
strain P41
P. cactophila
strain YB2
Initial pH
4.5
6.0
5.25 0.83
2.63 0.04
4.91 0.86
1.28 0.52
5.05 0.14
3.33 0.58
1.40 0.00
0.77 0.21
Lactose (% Brix)
10
12
15
4.02 0.01
1.58 0.02
3.06 0.01
4.08 0.12
2.10 0.53
1.74 0.03
1.40 0.31
2.21 0.20
1.10 0.12
0.91 0.00
2.72 0.01
0.60 0.01
Temperature (oC)
30
35
40
0.84 0.07
0.68 0.08
0.58 0.08
0.82 0.02
2.79 0.01
0.50 0.04
1.91 0.07
0.48 0.01
0.56 0.15
0.44 0.01
0.47 0.00
0.50 0.05
Yeast (w/v)
10
20
1.83 0.33
1.46 0.01
1.02 0.72
0.62 0.02
0.71 0.01
0.52 0.06
0.30 0.06
0.56 0.15
*The results are the means of three separate experiments consisting of three replicates
each.

63
a)
b)
c
) d)
Figure 21. Ethanol productivity (■) versus sugar depletion (○) in whey by
selected yeast isolates over varied incubator times. The cultural condition
included 10% lactose supplementation, 10% yeast inoculation with whey pH at 4.5

64
Comparatively, the best condition for ethanol fermentation for K. marxianus
strain BM9 was achieved at pH 4.5 with a yield of 4.92% ethanol with concurrent
reduction of the Brix of 5.3 to 0.3% after 120 h of culturing (Figure 21b). In contrast,
the optimum conditions for ethanol production by K. marxianus strain BM4 was
achieved by culturing in whey supplemented with 10% sugar concentration, 10%
yeast concentration at pH of 4.5 and incubated at 30oC temperature. The highest
ethanol production observed (5.05%) for K. lactis strain P41was achieved when the
strain was cultured at pH 4.5 (Figure 21c). Similarly, the best fermentation condition
for P. cactophila strain YB2 was observed at pH 4.5 leading ethanol productivity of
1.40% at 120 h (Figure 21 d).
In summary, all the strains showed high ethanol fermentation and productivity
at pH 4.5 compared pH 6.0 (Table 10). In the terms of ethanol productivity capacity,
K. marxianus strain BM4 had a more robust ethanol production ability compared to
other strains under study, producing the highest ethanol concentration of 5.525% after
120 h fermentation (Figure 21a), followed by 5.05% for K. lactis strain P41, K.
marxianus strain BM9 and P. cactophila strain YB2 with 4.92 and 1.40% ethanol
achieved after 120 h fermentation at pH 4.5 (Table 10 and Figure 21).

65
4.6. DISCUSSION
4.6.1 Biochemical and Physiological Characterization of Yeasts
The aim of this study was to isolate yeast strains from Kenyan dairy industries
for subsequent characterization using cultural, biochemical and molecular genetics
approaches, and to assess their biotechnological potential in production of ethanol.
According to Barnett et al. (2000) Yarrowia species are usually round, walnut hat or
Saturn shaped ascospores usually formed after mating pairs of compatible strains,
while Kluyveromyces species are smooth, round or reniform ascospores while Pichia
species usually have variation in ascospores from round hat or Saturn shaped. The
morphology of Kluyveromyces species have also been described by Kurtzman & Fell
(1998) as ovoidal, ellipsoidal and cylindrical to elongate. They may form
pseudomycelium but true hyphae are not produced.
The yeast strains isolated in this study were evaluated for the ability to grow
under different pH and temperature conditions. The isolates were able to grow
optimally at 25, 30 and 37oC with reduced growth at 42 and 47oC. The best pH for
growth of the strains was at pH 4.5, 5.5 and 6.0. Reports by Soichi et al. (2001) on
early death at medium acidification and survival after low pH adaptation in
Cryptococcus neoformans indicated early growth phase death in susceptible strains at
pH 3 was attributable to release of cytoplasm through weakened parts of the cell wall
and shrinkage due to dysfunction of plasma membrane at low pH. It is well known
that the metabolic activities of yeasts are greatly affected by the temperature at which
they grow, whereby temperatures above the optimum causes lower growth rate,

66
oxygen solubility and change in the cellular composition of yeasts, while an increase
in temperature does not inhibit substrate uptake nor does it significantly alter
enzymes levels (Slapack et al., 1987). Most yeast species are mesophilic, hence
cultures are usually incubated at temperatures of between 20-25oC, although for
taxonomic studies 25oC is preferred. Optimum temperatures for growth are higher for
some yeast and lower for others while higher temperatures in the range of 30-37oC,
are often required for yeasts that are strictly associated with warm-blooded animals
(Yarrow, 1998). According to Priest & Campbell (2002), yeasts grow in simple
media that contains fermentable carbohydrates to supply energy and carbon skeleton
for biosynthesis, adequate nitrogen for protein synthesis, minerals and one or more
growth factors. However, sources of carbon may include monosaccharides,
disaccharides and trisaccharides. Therefore, carbon assimilation is an important
criterion in the taxonomy and identification of yeasts, which depend on organic
carbon sources for the energy supply and growth. For example, galactose as a nutrient
can be utilized by yeasts in the absence of glucose in the medium; the utilization of
galactose indicating the expression of Gal genes, while utilization of carbon sources;
sucrose, lactose and cellobiose show expression of genes that activate the synthesis of
enzymes invertase, beta-galactosidase and beta glucosidase (Ogawa et al., 2000; Yun
et al., 2001; Jimoh et al., 2012).
4.6.2 Molecular Characterization of Dairy Yeasts
Traditionally, yeasts have been identified based on morphological,
physiological and biochemical characteristics. According to Barnett et al. (2000) and

67
Guillamón et al. (1998), morphological traits and physiological abilities used for
identification and characterization of yeast species and strains is strongly influenced
by culture conditions and may consequently give false results. In addition, these
methods are laborious and time consuming. Thus, molecular biology techniques as
alternative and additional methods are increasingly becoming important tools in
solving industrial problems.
It has been reported that molecular methods based on the sequences of the 26S rDNA,
D1/D2 domain, and ITS region are rapid and precise when compared with
physiological methods for the identification and typing of yeast species (Hesham et al.,
2006). Sequencing of the D1/D2 of the large-subunit 26S ribosomal DNA is now
widely accepted as a standard procedure for yeast identification. Moreover, a 600 bp
length of the D1/D2 domain of the 26S rDNA contains sufficient variation to define
individuals at the species level (Kurtzman et al., 1998; Frutos et al., 2004; Hesham et
al., 2006; Hesham et al., 2009; Hesham et al., 2011).In this study a combination of
restriction-fragment length polymorphism (RFLPs) of 5.8S-ITS rDNA region and
sequencing of the domains D1/D2 of the 26S rRNA gene was utilized for the
discrimination and identification of yeast isolates from the Kenyan Cheese Industries.
Consistent with the results of this study, many studies using both cultural and
molecular genetic identification of yeast isolates originating from different dairy
products show that Kluyveromyces species is most predominant (Vasdinyei & Deak,
2003; Lopandic et al., 2006; El-Sharoud et al., 2009). A study by Vallian et al.

68
(2004) isolated 6 isolates of K. lactis and 4 strains of K. marxianus that were
characterized with appreciable β-galactosidase enzyme activity and tested their
potential in single cell proteins (SCP) production. In Brazilian artisanal cheese, K.
lactis has been shown as the dominant yeast species (Borelli et al., 2006), while K.
marxianus has been reported as one of the dominant yeast strains in traditional
Egyptian dairy products (El-Sharoud et al., 2009). Some strains of thermotolerant K.
marxianus species have also been isolated from soil samples and their potential in
industrial ethanol production demonstrated (Hack & Marchart, 1998). Other habitats
where this strain has been isolated include Bantu beer, milk of mastitic cow,
asthmatic expectoration and maize meal. Using sequences of D1/D2 domain of 26S
rRNA gene, Lopandic et al. (2006) showed that K. marxianus was one of the most
frequently isolated species from various farmhouse milk products available on the
Austrian market, although K. lactis was also a common isolate.
Other yeast strains isolated in this study such as Y. lipolytica and C.
catenulata have been isolated in cheese in Brazil (Fadda et al., 2004; Borelli et al.,
2006). Qing et al. (2010) also showed that the dominant species in Qula were P.
fermentas but C. zeylanoides and P. cactophila were the major population in milk
cake from Yunnan in China. Another study by Vasdinyei & Deak (2003), carried out
to check the biodiversity of yeast strains isolated from Hungarian dairy products,
classified 62 yeast strains into 26 species and showed that the major strains were D.
hansenii, G. candidum, Y. lipolytica, K. lactis, and C. catenulata. This study also
showed that P. norvergensis, P. cactophila, P. cecembensis, C. inconspicua, C.

69
tropicalis and Y. lipolytica were also present in Kenyan Cheese Industries and occurs
together with K. marxianus and K. lactis.
The polymorphism of the rDNA internal transcribed spacer (ITS), covering
the conserved 5.8S rRNA gene region and the two variable flanking regions ITS1 and
ITS2, has been used in many studies to identify yeast species through a PCR-RFLP
based method (Guillamón et al., 1998; Esteve-Zarzoso et al., 1999). For example,
amplification of the ITS region of 5.8S ribosomal DNA give unique amplicon sizes
that has been used for rapid identification of yeast strains in dairy products, wine,
honey and various foods (Fernandez-Espinar et al., 2000; Carvalho et al., 2005;
Martin et al., 2007). Using ITS primers to amplify 5.8S rDNA of 92 isolates from
Turkish white cheese, Tansel & Fusun (2009) were able to distinguish between 15
strains of Y. lipolytica, 15 strains of K. marxianus and 25 strains of D. hansenii,
through the resultant single fragments of 360, 740 and 640 bp, respectively.
Consistent with these results, amplification of 5.8S rDNA with ITS primers in this
study gave unique amplified bands of approximately 750, 400 and 500 bp that were
important in discriminating Kluyveromyces, Y .lipolytica and P. norvengensis,
respectively.
A study carried out by Esteve-Zarzoso et al. (1999) showed that
Kluyveromyces species and Y. lipolytica were approximately 740 and 380 bp,
respectively, which compared favorably to approximately 750 and 400 bp,
respectively, observed in this study. Bockelmann et al. (2008), also have reported

70
amplicon sizes of 726, 375 and 500 bp for K. marxianus, Y. lipolytica and P.
norvengensis, respectively, which is consistent with values reported in our study. The
restriction fragments comprising the internal transcribed spacer (ITS) and the 5.8S
rRNA has been used in identification of yeast species where species belonging to the
same genus, show very similar restriction patterns (Carvalho et al., 2005). In this
study, RFLP pattern of the different yeast strains isolated made it possible to
differentiate among the studied species using a pattern of bands which were
characteristic of each genus (Table 6). In a study by Carvalho et al. (2005), RFLP of
ITS region was used in differentiate seven yeast species belonging to six different
yeast genera isolated from honey. In addition, the restriction pattern of the 5.8S-ITS
region has also been used to differentiate 132 yeast species belonging to 25 different
genera isolated from food and related genera (Esteve-Zarzoso et al., 1999).
Consistent with the results of this study, it has been reported that restriction of Y.
lipolytica 5.8S-ITS fragment by enzyme HaeIII results to no fragment being observed
(Esteve-Zarzoso et al., 1999). The analysis of generated RFLP fragments therefore
confirmed that this method could be used to differentiate most of the yeast species
from Kenyan cheese industries.
4.6.3 Conversion of whey to ethanol by isolated Yeast Strains
Waste biomass though widely utilized as a raw material for bioethanol
production (Gong et al., 1999; Hari et al., 2001; Nigam, 2001), presents challenges as
it is deemed expensive. The process is cost intensive as it requires separation of lignin
from cellulose, hydrolysis of cellulose to sugars, fermentation of sugar solution to

71
ethanol and separation of ethanol from water. Therefore, there is an impetus to search
for inexpensive and widely available raw materials for bioethanol production.
Fermentation of cheese whey has been extensively investigated and
credited to several yeasts (Lark et al., 1997; Lukondeh et al. 2005; Ozmihci & Kargi,
2007b; Zhang & Lynd, 2007). For example, K. marxianus strains are already being
employed in commercial production (Ling, 2008). In this study, cheese whey was
fermented at different pH and temperature conditions to yield bioethanol by 4
different yeast strains exhibiting robust lactose-fermenting ability. Our results on
fermentations are comparable to those reported by Kadar et al. (2011) where 0.51 g
ethanol/g lactose yield was achievable by fermentation of whey type 1 at pH 4.5 and
30oC. Thus, the pH has significant effect on the ethanol yield during whey that may
be attributable to the yeast using energy to pump out H+ ions instead of channeling it
for biomass production in response to low whey pH values. Consequently, a higher
ethanol yield is obtained because more lactose is used for production of energy
instead of formation of biomass.
In terms of culturing temperature, K. marxianus strain BM4 and K. lactis
strain P41 exhibited optimal ethanol production at 30°C, while K. marxianus strain
BM9 and P. cactophila strain YB2 were at 35 and 40°C, respectively. These results
slightly deviates from the studies undertaken by Grba et al. (2002), where optimal
temperature was 34 °C for ethanol production with K. marxianus. Ling (2008) and
Grba et al. (2002) investigated the suitability of five different strains of K. marxianus

72
for alcoholic fermentation of deproteinized whey. The selection of yeast strains was
performed at different cultivation conditions: temperature ranging between 30-37°C,
lactose concentration of between 5 and 15%, and pH between 4.5-5.0. High
temperature alcoholic fermentation of whey has also been demonstrated by
Kourkoutas et al. (2002) using K. marxianus strains MB3. However, Zoppellari &
Bardi (2012) found that the best performances for ethanol production by K.
marxianus were reached at low temperatures (28oC), although high temperatures are
also compatible with good ethanol yields in whey fermentations.
Strains of Kluyveromyces have been considered the most appropriate for bio-
conversion of lactose in whey (Barnett et al., 2000; Caralcho & Spencer 1990).
However, incomplete or slow fermentations have been observed for many
Kluyveromyces strains when concentrated whey or lactose-enriched substrates have
been employed (Grubb & Mawson, 1993). This is consistent with results of this study
where increases in lactose concentration (% Brix) were concomitantly associated with
lower ethanol productivity in all the strains tested. These effects have been attributed
to the toxicity of the ethanol produced and/or to inhibition by high salt
concentrations, resulting in elevated osmotic pressure (Grubb & Mawson, 1993).
Furthermore, it has been reported that increases in lactose concentrations can lead to
the accumulation of pyruvate resulting from the greater glycolytic flux in these
yeasts, thereby causing a reduction in final biomass yields.

73
The development of biotechnological applications with K. marxianus has been
motivated by a number of advantages which includes its ability to grow on a wider
range of substrates, at higher temperatures, its specific growth rates (Bellaver et al.,
2004). In this study, it was found that ethanol productivity by two strains of K.
marxianus and one strain of K. lactis from whey was higher than that of P.
cactophila. Several yeasts belonging to the genus Pichia such as P. farinosa, P.
fermentans and P. stipitis are known to produce ethanol from glucose (Ando et al.,
1998).The most promising yeasts that have the ability to use both pentose and hexose
sugars are P. stipites. There are no reports in literature on utilization of P. cactophila
for ethanol production from cheese whey. Therefore, this study represents a first
report whereby P. cactophila strain has been applied in the ethanol production from
cheese whey.

74
CHAPTER FIVE
5..0 CONCLUSIONS AND RECOMMENDATIONS
5.1 Conclusions
1. The isolation of yeasts strains from dairy industry implied that Kenyan cheese
industries harbor novel lactose-fermenting yeasts that are genetically diverse,
albeit, not very different from yeasts isolated by other studies from dairy
products.
2. Using PCR amplification and phylogenetic analysis, the isolates were
clustered into four different genera namely; Kluyveromyces, Pichia, Yarrowia,
and Candida.
3. Restriction pattern analysis of ITS region using HaeIII and HinfI permitted a
fast and effective identification of yeast species under study.
4. The study also demonstrated the potential of whey fermentation to bio-ethanol
by yeast strains K. marxianus strain BM4 yielded an ethanol content of
5.52%, K. marxianus strain BM9 4.91%, K. Lactis strain P41 .5.05% and P.
cactophila strain YB2 yielded an ethanol content of 1.40% at pH 4.5
5. The study highlighted the feasible application of the yeast isolates in
valorization of whey a common pollutant in the local cheese industries.

75
5.2 Recommendations
The findings of this study recommend that:
i. More research needs to be carried out on other parameters that can
enhance ethanol production efficiency of the isolated strains to
maximize their productivity.
ii. Further characterization need to be carried out to determine genetic
differences of the isolates, including characterization of the other
byproducts produced during whey fermentation by the isolated yeasts
to determine the purity of bio-ethanol produced.

76
REFERENCE
AACC International (2000). Approved Methods of the American Association of Cereal
Chemists, 10th Ed. Methods 46-12A, 76-13 and 76-31. St Paul, MN, USA: The
Association.
Abliz P., Fukushima K., Takizawa K. & Nishimura K. (2004). Identification of
pathogenic dematiaceous fungi and related taxa based on large subunit ribosomal
DNA D1/D2 domain sequence analysis. FEMS Immunology & Medical
Microbiology; 40:41-49.
Addis E., Fleet G. H., Cox J. M., Kolak D. & Leung T. (2001). The growth, properties
and interactions of yeasts and bacteria associated with the maturation of Camembert
and blue-veined cheeses. International Journal of Food Microbiology; 69: 25-36.
Ando H., Ikegami T. & Mikata K. (1998). Identification and characteristics of the yeast
strain isolated from sake lees. Reports Kyushu National Industrial Research
Institute. 61: 3817-3825.
Andrietta M. G. S., Andrietta S. R., Steckelbergm C. & Stupiellom E. N. A. (2007).
Bioethanol Brazil, 30 years of Proa´lcool. International Sugar Journal; 109: 195–
200.
Antoni D., Zverlov V. l. & Schwarz W. (2007). Biofuels from microbes. Applied
Microbiology and Biotechnology; 77: 23-35.

77
AOAC (1984). Official methods of analysis, 14th Edition.Methods 14.004, 942.05 and
24.005. Washington DC, USA: Association of Official Analytical Chemists.
Audic J. L., Chaufer B. & Daufin G. (2003). Non-food applications of milk
components and dairy co-products: a review. Lait; 83: 417-38.
Balat M. & Balat H. (2009). Recent trends in global production and utilization of bio-
ethanol fuel. Applied Energy; 86:2273-2282.
Balat M. (2007). An overview of biofuels and policies in the European Union. Energy
Sources B. Energy Economic Planning; 2:167-181.
Banat I. M, Singh D. & Marchant R. (1996). The use of a thermotolerant fermentative
K. marxianus IMB3 yeast strain for ethanol production. Acta Biotechnologica;
16:215–223.
Banat I. M. & Marchant R. (1995). Characterization and potential industrial
applications of five novel, thermotolerant, fermentative, yeast strains. World
Journal of Microbiology and Biotechnology; 11: 304-306.
Banker A. V., Kumar A. R. & Zinjarde S. S. (2009). Environmental and Industrial
applications of Y. lipolytica. Applied Microbiology and Biotechnology; 84:847-865.
Barba D., Beolchini F., Re G.D., Giacomo G.D. & Veglio F. (2001). Kinetic analysis
of Kluyveromyces lactis fermentation of whey: batch and fed-batch operations,
Process Biochemistry; 36: 531–536.
Barnett J. A., Payne R. W. & Yarrow D. (2000). How yeasts are classified. In: Barnett
J. A., Payne R. W. & Yarrow D. (eds), Yeasts: Characteristics and Identification,
3rdedn. Cambridge University Press, Cambridge, 15 – 22.

78
Bellaver L. H., de Carvalho N. M. B., Abrahão-Neto J. & Gombert A. K. (2004).
Ethanol formation and enzyme activities around glucose-6-phosphate in
Kluyveromyces marxianus CBS 6556 exposed to glucose or lactose excess. FEMS
Yeast Research; 4:691–698.
Belloch C., Barrio E., Garcia M. D. & Querol A. (1998). Phylogenetic reconstruction
of the genus Kluyveromyces : restriction map analysis of the 5.8S rRNA gene and
the two ribosomal internal transcribed spacers. System Applied Microbiology;
21:266-273.
Bockelmann W. (2002). Development of defined surface starter cultures for ripening of
smear cheeses. International Dairy Journal; 12: 123–131.
Bockelmann W., Heller M. & Heller K. J. (2008). Identification of yeasts of dairy
origin by amplified ribosomal DNA restriction analysis (ARDRA) International
Dairy Journal; 18: (10–11), 1066–1071.
Borelli B. M., Ferreira E. G., Inayara C. A. L., Franco G. R. & Rosa C.A. (2006).
Yeast populations associated with the artisanal cheese produced in the region of
Serra da Canastra, Brazil. World Journal of Microbiology and Biotechnology;
22:1115–1119.
Botha A. & Kock J. L. F. (1993). Application of fatty acid profiles in the identification
of yeasts. In. Journal of Food Microbiology; 19:39-51.

79
Botha A., Kock J. L. F., Coetzee D. J., Van Dyk M. S., Van der Berg L. & Botes P. J.
(1992). Yeast eicosanoids I. The distribution and taxonomic value of cellular fatty
acids and arachidonic acid metabolites in the Dipodascaceae and related taxa.
System Applied Microbiology; 15: 148 - 154.
Brakhage A. & Turner G. (1995). Biotechnical genetics of antibiotic biosynthesis. In:
Kück U.(ed), The Mycota, II, Genetics and Biotechnology. Springer, Berlin
Heidelburg; 263-285.
Breunig K. D., Bolotin-Fukuhara M., Bianchi M. M., Bourgarel D., Falcone C. &
Ferrero I. (2000) . Regulation of primary carbon metabolism in Kluyveromyces
lactis. Enzyme Microbiology and Technology; 26: 771-80.
Cai J., Roberts I. N. & Collins M. D. (1996). Phylogenetic relationships among
members of the ascomycetous yeast genera Brettanomyces , Debaryomyces,
Dekkera and Kluyveromyces deduced by small- subunit rRNA gene sequences.
International Journal System Bacteriology; 46:542 - 549.
Carvalho C. M., Rocha A., Estevinho M. L. F. & Choupina A. (2005). Identification
of honey yeasts species based on RFLP analysis of the ITS region. Ciencia y
Technologia de los Alimentos; 5 (1):11-17.
Chang M. C. (2007). Harnessing energy from plant biomass. Current Opinion
Chemistry Biology; 11: 677-684.

80
Chi Z. M., Chi Z., Zhang T., Yue L., Li J. & Wang X (2009). Production and
characterization and gene cloning of the extracellular enzymes from marine derived
yeasts and their potential applications. Biotechnology Advances; 27: 236-255.
Collins K. (2008). The role of biofuels and other factors in increasing farm and food
prices. http:// www.foodbeforefuel.org/files/role of biofuels 6:19-08. [Accessed on
January 2013].
Compagno C., Ranzi B. M., Tura A. & Martegani E. (1993). Bioconversion of
lactose/whey to fructose diphosphate with recombinant Saccharomyces cerevisiae
cells. Biotechnology. Bioengineering; 42: 393–400.
Cottrell M. & Kock J. L. F. (1989). The yeast Lipomycetaceae Novák et Zsolt emend.
Van der Walt et al. and the genus MyxozymaVan der Walt et al. A historical
account of its delimitation and the taxonomic relevance of cellular long-chain fatty
acid composition and other phenotypic characters. Systematic Applied
Microbiology; 12: 291-305.
Dale M. C., Eagger A. & Okos M. R. (1994). Osmotic inhibition of free and
immobilized Kluyveromyces-marxianus anaerobic growth and ethanol productivity
in whey permeate concentrate. Process Biochemistry; 29 (7): 535-544.
Daniel H. M. & Meyer W. (2003). Evaluation of ribosomal RNA and actin gene
sequences for the identification of ascomycetous yeasts. International Journal of
Food Microbiology; 86: 61-78.

81
de Glutz F. (2009). Fuel Bioethanol Production from Whey Permeate. Ecole
Polytechnique Federale De Lausanne, PHD thesis no- 4372.
Doyle A. (2005). Another step in biofuel supply. Irish Farmers Journal Interactive.
http://www.farmersjournal.ie/2005/1008/farmmanagement/crops/index.shtmlN
[Accessed 1st June 2009].
El-Sharoud W. M., Belloch C., Peris D. & Querol A. (2009). Molecular Identification
of yeasts associated with traditional Egyptian dairy products. Journal of Food
science; 74(7): M341-6.
Esteve-Zarzoso B., Belloch C., Uruburu F. & Querol A. (1999). Identification of
yeasts by RFLP analysis of the 5.8S rRNA gene and the two ribosomal internal
transcribed spacers. International Journal of Systems and Bacteriology; 49:329-337.
Fadda M. E., Mossa V., Pisano M. B., Delphano M. & Cosentino S. (2004).
Occurrence and characterization of yeast isolated from artisanal Fiore Sardo cheese.
International Journal of Food Microbiology; 95:51–59.
Fargione, J., Hill J., Tilman D., Polasky S. & Hawthorne P. (2008). Land Clearing
and the Biofuel Carbon Debt. Science; 319 (5867): 1235-1238.
Fernandes P. A., Sena-Esteves M. & Moradas-Ferreira P. (1995). Characterization of
the glyceraldehyde-3-phosphate dehydrogenase gene family from Kluyveromyces
marxianus- polymerase chain reaction single-strand conformation polymorphism as
a tool for the study of multigenic families. Yeast, 11: 725-733.
Fernandez-Espinar M. T., Esteve-Zarzoso B., Querol A. & Barrio E. (2000). RFLP
analysis of the ribosomal internal transcribed spacers and 5.8S rRNA gene region of

82
the genus saccharamyces: A fast method for species identification and the
differentiation of flor yeasts. Antonie van leunwenhoek; 78:87-97.
Fleet G. H. (2007). Yeasts in foods and beverages: impact on product quality and safety.
Current Opinion in Biotechnology; 18: 170 – 175.
Fofana I., Chitiga M. & Mabugu R. (2009). Oil prices and the South African economy:
A macro-meso-micro analysis. Energy Policy; 37:5509-5518.
Fonseca G. G., Gombert A. K., Heinzle E. & Wittmann C. (2007). Physiology of the
yeast Kluyveromyces marxianus during batch and chemostat cultures with glucose
as the sole carbon source. FEMS Yeast Research; 7: 422-435.
Fonseca G. G., Gombert A. K., Heinzle E. & Wittmann C. (2008). Physiology of the
yeast Kluyveromyces marxianus during batch and chemostat cultures with glucose
as the sole carbon source. FEMS Yeast Research; 7: 422-435.
Fonseca G. G., Heinzle E., Wittmann C. & Gombert A. K. (2008). The yeast
Kluyveromyces marxianus and its biotechnological potential. Applied Microbiology
and Biotechnology; 79:339-54.
Fricker-Hidalgo H., Vandapel O., Duchesne M.A., Mazoyer M.A., Monget D.,
Lardy B., Lebeau B., Freney J., Ambroise-Thomas P. & Grillot R. (1996).
Comparison of the new API Candida system to the ID32C system for identification
of clinically important yeast species. Journal of Clinical Microbiology; 34: 1846–
1848.

83
Frow E., Ingram D., Powell W., Steer D., Vogel J. & Yearley S. (2009). The politics
of plants. Food Security; 1:17-23.
Frutos R. L., Fernandez-Espinar M. T. & Querol A. (2004). Identification of species
of the genus Candida by analysis of the 5.8S rRNA gene and the two ribosomal
internal transcribed spacers. Antoine von Leeuwenhoek; 85:175-185.
Fukuhara H. (2006). Kluyveromyces lactis- a retrospective FEMS Yeast Research;
6:323-4.
Gadaga T. H., Mytukumira A. N. & Narvus J. A. (2000). Enumeration and
identification of yeasts from Zimbabwean traditional fermented milk. International
Dairy Journal; 10: 456-466.
Galbe M. & Zacchi G. (2007). Pretreatment of lignocellulosic materials for efficient
bioethanol production. Advanced Biochemical Engineering Biotechnology; 108:
41-65.
Gargas A. & De Priest P. T. (1996). A nomenclature for fungal PCR primers with
examples from intron-containing SSU rDNA. Mycology; 88:745-748.
Gatesoupe F. J. (2007). Live yeasts in the gut: natural occurrence, dietary introduction
and their effects on fish health and development. Aquaculture; 267: 20-30.
Ghaly A. E. & El-Taweel A. A. (1995). Effect of nutrient supplements addition on
ethanol production from cheese whey using Candida pseudotropicalis under batch
condition. Applied Biochemical Biotechnology; 53:107-31.
Gong C. S., Cao N. J., Du J. & Tsao G. T. (1999). Ethanol production from renewable
resources. Advanced Biochemistry, Engineering and Biotechnology; 65:207-241.

84
Grba S., Tomas V. S., Stanzer D., Vahcic N. & Skrlin, A. (2002). Selection of yeast
strain Kluyveromyces marxianus for alcohol and biomass production on whey.
Chemical Biochemistry and Engineering; 16:13-16.
Grba S., Vesna T. & Stanzer D. (1998). Selection of yeast strain Kluyveromyces
marxianus for alcohol and biomass production on whey. Journal of Chemical
Biochemistry and Engineering; 45: 24–32.
Grubb C. F. & Mawson A. J. (1993). Effects of elevated solute concentrations on the
fermentation of lactose by Kluyveromyces marxianus Y-113. Biotechnology
Letters; 15: 621-626.
GTZ (2008). A road map for biofuel in Kenya opportunities and obstacles 17th May
2008, a technical report by: Gesellsschaft Fur Technische Zusammenarbeit
(German Technical cooperation) Kenya & ministry of Agriculture
programme(PSDA) GTZ sector project on bioenergy, GTZ, Escborn, Germany.
Guffogg S. P., Thomas-Hall S., Holloway P. & Watson K. (2004). A novel
psychotolerant member of the hymenomycetous yeasts from Antarctica:
Cryptococcus watticus sp. nov. International Journal of System. Evolution and
Microbiology; 54:275-277.
Guillamón J., Sabate J., Barrio E., Cano J. & Querol A. (1998). Rapid identification
of wine yeast species based on RFLP analysis of the ribosomal internal transcribed
spacer (ITS) region. Archives of Microbiology; 169:387-392.

85
Guimaraes P. M. R., Teixeira J. A. & Dominguez L. (2008). Fermentation of high
concentrations of lactose to ethanol by engineered flocculent Saccharomyces
cerevisiae. Biotechnology Letters; 30:1953–1958.
Guimarães, Pedro M. R., Teixeira, J. A., & Domingues L (2010). Fermentation of
lactose to bio-ethanol by yeasts as part of integrated solutions for the valorisation of
cheese whey. Biotechnology advances 28 (3): 375-384.
Hack C. J. & Marchant R. (1998). Characterization of a novel thermotolerant yeast,
Kluyveromyces marxianus var marxianus: development of an ethanol fermentation
process. Journal of Industrial Microbiology and Biotechnology; 20:323-327.
Hahn-Hagerdal B., Galbe M., Gorwa-Grauslund M. F., Lidén G. & Zacchi G.
(2006). Biol-ethanol – the fuel of tomorrow from the residues of today. Trends
Biotechnology; 24: 549–556.
Hamilton R. (1998). The manufacture of ethanol from whey, Chemical Processes in
New Zealand: New Zealand Institute of Chemistry. http://www
nzic.org.nz/ChemProcesses/dairy/3H.pdfN [Accessed on January 2011].
Hari K. S., Janardhan R. T. & Chowdary G. V. (2001). Simultaneous saccharification
and fermentation of lignocellulosic wastes to ethanol using a thermotolerant yeast.
Bioresource Technology; 77:193-196.
Hensing M., Vrouwenvelder H., Hellinga C., Baartmans R. & van Dijken J. P.
(1994). Production of extracellular inulinase in high-cell-density fed-batch cultures

86
of Kluyveromyces marxianus. Applied Microbiology and Biotechnology; 42:516–
521.
Herzberg M., Fischer R. & Titze A. (2002). Conflicting results obtained by RAPD-
PCR and large subunit rDNA sequences in determining and comparing yeast
isolates isolated from flowers: a comparison of two methods. International Journal
of System Evolution and Microbiology; 52: 1423-1433.
Hesham A. & Mohamed H. (2011). Molecular genetic identification of yeast strains
isolated from Egyptian soils for solubilization of inorganic phosphates and growth
promotion of corn plants. Journal of Microbiology and Biotechnology; 21: 55-61.
Hesham A., Alamri S. A., Khan S., Elsayed M. & Mahmoud H. M. (2009). Isolation
and molecular genetic characterization of a yeast strain able to degrade petroleum
polycyclic aromatic hydrocarbons. African journal of biotechnology; 8 (10): 2218-
2223.
Hesham A., Khan S., Liu X., Zhang Y., Wang Z. & Yang M. (2006). Application of
PCR–DGGE to analyse the yeast population dynamics in slurry reactors during
degradation of polycyclic aromatic hydrocarbons in weathered oil. Yeast; 23: 879-
887.
Hill J., Nelson E., Tilman D., Polasky S. & Tiffany D. (2006). Environmental,
economic, and energetic costs and benefits of biodiesel and ethanol biofuels.
Proceedings of the National Academy of Sciences; 103(30): 11206-11210.

87
Hong S. G., Chun J., Oh H. W. & Bae K. S. (2001). Metschnikowia koreensis sp.
nov. a novel yeast species isolated from flowers in Korea. International Journal of
System Evolution and Microbiology; 51:1927 -1931.
Huffman 1. L., Molina F. 1. & Jong C. (1992). Authentication of ATCC strains in the
Saccharomyces cerevisiae complex by PCR fingerprinting. Experimental
Mycology; l6: 316- 19.
Jakobsen M. and Narvhus J. (1996). Yeasts and their possible beneficial and negative
effect on the quality of dairy products. International Dairy Journal; 6: 755 – 768.
James S. A., Collins M. D. & Roberts I. N. (1996). Use of an rRNA Internal
transcribed spacer region to distinguish phylogenetically closely related species of
the genera Zygosaccharomyces and Torulaspora. International Journal of
Systematic Bacteriology; 46: 189-194.
Jimoh O. S., Saleh A. A., Ameh J. B. & Whong C. M. Z. (2012). Characteristics and
Diversity of yeast in locally fermented Beverages sold in Nigeria. World Journal of
Engineering and Pure and Applied Sciences; 2(2):40.
Joshi B., Megh R. B., Dinita S., Jarina J., Rajani M. & Lakshmaiah S. (2011).
Lignocellulosic ethanol production: Current practices and recent developments.
Biotechnology and Molecular Biology Review; 6(8):172-182.
Kadar Z. S., Christensen A. D., Oleskowicz-Popiel P. & Thomsen M. H. (2011)
Production of bioethanol from organic whey using Kluyveromyces marxianus.
Journal of Industrial Microbiology and Biotechnology; 38:283–289.

88
Katarzyna G (2011). Characteristics of growth of yeasts and yeast-like fungi on
chromogenic medium CHROMagar Candida (GRASO). Wiadomoeci
Parazytologiczne; 57(3):143–149.
Kiers J, Zeeman A. M., Luttik M., Thiele C., Castrillo J. I., Steensma H. Y., van-
Dijken J. P. & Pronk J. T. (1998). Regulation of alcoholic fermentation in batch
and chemostat cultures of Kluyveromyceslactis CBS 2359. Yeast; 14:459–469.
Kisaalita W. S., Lo K. V. & Pinder K. L. (1990). Influence of whey protein on
continuous acidogenic degradation of lactose. Biotechnology and Bioenginnering;
36(6):642-6.
Knoushaug E. P., Frandea M. A., Stanbuk B. U., Zhang M. & Singh A. (2009).
Utilization and transport of L-arabinose by non sacchramyces yeasts. Cellulose; 16:
729-741.
Kock J. L. F., Lategan P. M., Botes P. J. & Viljoen B. C. (1985). Developing a rapid
statistical identification process for different yeast species. Journal of Microbiology
Methods; 4:147 - 154.
Kourkoutas Y., Dimitropoulou S., Kanellaki M., Marchant R., Nigam P. & Banat I.
M. (2002). High Temperature Alcoholic Fermentation of Whey Using
Kluyveromyces marxianus IMB3 Yeast Immobilized on Delignified Cellulosic
Material. Bioresource Technology; 82: 177–181.
Kurtzman C. P. (1993). Systematics of the ascomycetous yeasts assessed from
ribosomal RNA sequence divergence. Antonie van Leeuwenhoek; 63:165-174.

89
Kurtzman C. P. (1992). rRNA sequence comparisons for assessing phylogenetic
relationships among yeasts. International Journal of System Evolution and
Microbiology; 42: 1-6.
Kurtzman C. P. & Fell J. W. (1998). Definition, classification and nomenclature of the
yeasts. In: Kurtzman C. P. & Fell J. W. (eds), The Yeasts, A Taxonomic Study,
4th edn. Elsevier Science BV, Amsterdam, The Netherlands. pp 3-5.
Kurtzman C. P. & Robnett C. J. (1995). Molecular relationships among hyphal
ascomycetous yeasts and yeast like taxa. Canadian Journal of Botany; 73(1): 824-
830.
Kurtzman C. P. & Robnett C. J. (1997). Identification of clinically important
ascomycetous yeasts based on nucleotide divergence in the 5’ end of the large
subunit (26S) ribosomal DNA gene. Journal of Clinical Microbiology; 35:1216-
1223.
Kurtzman C. P. & Robnett C. J. (1998). Identification and phylogeny of ascomycetous
yeasts from analysis of nuclear large subunit (26S) ribosomal DNA partial
sequences. Antonie van Leeuwenhoek; 73:331 - 371.
Kurtzman C. P. (2000). Four new yeasts in the Pichia anomalaclade. International
Journal of System Evolution and Microbiology; 50:395-404.
Kurtzman C. P. (2001). Six new anamorphic ascomycetous yeasts near Candida
tanzawaensis. FEMS Yeast Research; 1:177-185.

90
Lachance M. A. & Starmer W. T. (1998). Ecology and Yeasts. In: Kurtzman C. P. &
Fell J. W. (eds), The Yeasts, a Taxonomy Study, 4th edn. Elsevier Science BV,
Amsterdam, The Netherlands. pp 21-30.
Lachance M. A. Kluyveromyces van der Walt emend. van der Walt. (1998) ,In:
Kurtzman CP, Fell JW, eds. The yeasts, a taxonomic study. Amsterdam: Elsevier.
pp 227-47.
Lark N., Xia Y., Qin C., Gong C. S. & Tsao G. T. (1997). Production of Eethanol from
Recycled Paper Sludge Using Cellulase and Yeast, Klyuveromyces marxianus.
Biomass and Bioenergy; 12:135-143.
Ling K. C. (2008). Whey to ethanol: a biofuel role for dairy cooperatives? Washington
DC: USDA Rural Development Research Report. 214:1-27.
Lonner C., Welander T., Molin N. & Dostálek M. (1986). The micro-flora in a sour
dough started spontaneously on typical Swedish rye meal. Food Microbiology; 3: 3-
12.
Lopandic K., Zelger S., Banszky L. K., Eliskases-Lechner F. & Prillinger H.
(2006). Identification of yeasts associated with milk products using traditional and
molecular techniques. Food Microbiology; 23: 341-350.
Lukondeh T., Ashbolt N. J. & Rogers P. L. (2005). Fed-batch fermentation for
production of Kluyveromyces marxianus FII 510700 cultivated on a lactose-based
medium. Journal of Industrial Microbiology and Biotechnology; 32: 284–288.
Lynd L. R., Laser M. S. & Bransby D. (2008), How biotech can transform biofuels.
Nature Biotechnology; 26(2):72.

91
Mahammud M. M. (2011). Potential and investment opportunities in the petroleum
industries in Kenya presented on 9th and 10th December 2011 during 3rd India-
Africa Hydrocarbons conference, New Delhi.
Martin P. A., Florez A. B., Diaz T. M. L. & Mayo B. (2007). Phenotypic and
molecular identification of yeast species associated with Spanish blue-veined
Cabrales cheese. International dairy journal; 17:961-967.
Miller M., Kock J. L. F. & Botes P. J. (1989). The significance of long -chain fatty acid
compositions and other phenotypic characteristics in the genus Pichia Hansen
emend Kurtzman. Systematic and Applied Microbiology; 12:70-79.
Mitchell D. A (2008). A note on rising food prices. World Bank policy research working
paper 4682.
Molina F. I., Inoue T. & Jong S. C. (1992). Ribosomal DNA restriction analysis reveals
genetic heterogeneity in Saccharomyces cerevisiae. International Journal of System
Evolution and Microbiology; 42:499-502.
Naveen. K. (2001).Text book of microbiology, published by l.K international publishing
house pvt.ltd pphaar cinema market. Pp 40
Nigam J. N. (2000). Continuous ethanol production from pineapple cannery waste using
immobilized yeast cells. Journal of Biotechnology; 80:189-193.
Ogawa Y., Nitta A., Uchiyama H., Imamura T., Shimoi H. & Ito K. (2000).
Tolerance mechanism of the ethanol tolerant mutant sake yeast. Journal of
Bioscience and Bioengineering; 90:313-20.

92
Ozmihci S. & Kargi F. (2007a). Effects of feed sugar concentration on continuous
ethanol fermentation of cheese whey powder solution (CWP). Enzyme
Microbiology Technology; 41:876-80.
Ozmihci S. & Kargi F. (2007b). Comparison of yeast strains for batch ethanol
fermentation of cheese–whey powder (CWP) solution. Letters in Applied
Microbiology; 44:602–606.
Patzek, T. W. & Pimentel D. (2005). Thermodynamics of Energy Production from
Biomass. Critical Reviews in Plant Sciences; 24(5):327-364.
Pesta G., Meyer-Pittroff R. & Russ W. (2007). Utilization of whey. in: Oreopoulou V,
Russ W editors. Utilization of by-products and treatment of waste in the food
industry. New York: Springer. pp 193-207.
Phaff H. J. & Starmer W. T. (1980). Specificity of natural habitats for yeasts and yeast
like organisms, In: Skinner F. M., Passmore S. M. & Davenport R. R. (eds),
Biology and Activities of Yeasts. Academic Press London. pp 79 -102.
Phaff H. J. (1986). Ecology of yeasts with actual and potential value in Biotechnology.
Microbiology and Ecology; 12:31-42.
Phaff H. J., Vaughan-Martini A. & Starmer W. T. (1998). Debaryomyces prosopidis
sp. nov. a yeast from exudates of mesquite trees. International Journal of Systematic
Bacteriology; 48:1419-1424.
Pimentel D. (2006). Greenplants, fossil fuels, and now biofuels. BioScience Editorials;
56:875.

93
Poggeler S. (2001). Mating type genes for classical strain improvements in ascomycetes.
Applied Microbiology and Biotechnology; 56:589-601.
Porro D., Martegani E., Ranzi B. M. & Alberghina L. (1992). Lactose/whey
utilization and ethanol production by transformed S. cerevisiae cells. Biotechnology
and Bioenginnering; 39: 799–805.
Prasad, S., Anoop, S. & Joshi, H. C. (2006). Ethanol as an alternative fuel from
agricultural, industrial and urban residues. Resources Conservation and Recycling;
50:1 – 39.
Priest F. G. & Campbell I. (2002). Brewing microbiology. Springer 3rd edition
Cornwall: Chapman and Hall 306. pp 302.
Purwadi R., Brandberg T. & Taherzadeh M. J. (2007). A possible industrial solution
to ferment lignocellulosic hydrolyzate to ethanol: continuous cultivation with
flocculating yeast. International Journal of Molecular Sciences; 8: 920-932.
Qing M., Bai M., Zhang Y., Liu W., Sun Z., Zhang H. & Sun T. (2010) Identification
and biodiversity of yeasts from Qula in Tibet and milk cake in Yunnan of China.
Wei Sheng Wu Xue Bao; 50(9):1141-6.
Querol A. & Ramon D. (1996). The application of molecular techniques in wine
microbiology. Trends in Food Science Technology; 7:73- 78.
Ragauskas A. J., Williams C. K., Davison B. H., Britovsek G., Cairney J., Eckert C.
A., Frederick Jr W. J., Hallett J. P., Leak D. J., Liotta C. l., Mielenz J. R.,
Murphy R., Templer R. & Tschaplinsk T. (2006). The path forward for biofuels
and biomaterials. Science; 311: 484-489.

94
Rech R. & Ayub M. A. Z. (2007). Simplified feeding strategies for fed-batch cultivation
of Kluyveromyces marxianus in cheese whey. Process Biochemistry; 42:873–877.
Renewable Fuels Association. (2011). RFA - The Industry - Statistics..
http://ethanolrfa.org/pages/World-Fuel-Ethanol-Production [Accessed on May
2012].
Renewable Fuels Association. (2012). RFA -The Industry - Statistics.
http://ethanolrfa.org/pages/World-Fuel-Ethanol-Production [Accessed on May
2012].
Rosa F. M. & Sa-Correia I. (1992). Ethanol tolerance and activity of plasma membrane
ATPase in Kluyveromyces marxianus and Saccharomyces cerevisiae. Enzyme and
Microbial Technology; 14: 23-27.
Rubio-Texeira M. (2006). Endless versatility in the biotechnological applications of
Kluyveromyces LAC genes. Biotechnology Advances; 24:212–25.
Saddoud A., Hassaïri I. & Sayadi S. (2007). Anaerobic membrane reactor with phase
separation for the treatment of cheese whey. Bioresource Technology; 98:2102–
2108.
Saitou N. & Nei M. (1987). The neighbor-joining method: a new method for
reconstructing phylogenetic trees. Molecular Biology Evolution; 4: 406-425.
Sanchez O. J. & Cardona C. A. (2008). Trends in biotechnological production of fuel
ethanol from different feedstocks. Bioresource Technology; 99:5270-5295.

95
Scorzetti G., Fell J. W., Fonseca A. & Statzell-Tallman A. (2002). Systematics of
basidiomycetous yeasts: a comparison of large subunit D1/D2 and internal
transcribed spacer rDNA regions. FEMS Yeast Research; 1497:1-23.
Silveira W. B., Passos F., Mantovani H. C. & Passos F. M. L. (2005). Ethanol
production from cheese whey permeate by Kluyveromyces marxianus UFV-3: a
flux analysis of oxido-reductive metabolism as a function of lactose concentration
and oxygen levels. Enzyme Microbiology and Technology; 36: 930-6.
Siso M. (1996). The biotechnological of utilization of cheese whey: a review.
Bioresource Technology; 57:1– 11.
Skeer J. & Wang Y. (2007). China on the move: Oil price explosion? Energy Policy;
35: 678-691.
Slapack G. E. & Steward G. G. (1987). Thermophilic microbes in Ethanol production.
Boca Raton; CRC press. pp186.
Soichi Y., Otikuso M., Hata K., Yarita K., Fujii T. & Takeo K. (2011). Early Death at
Medium acidification and survival after low pH adaptation in Cryptococcus
neoformans. Mycoscience 42: 535-541.
Starmer W. T., Fogleman J. C. & Lachance M. A. (1991). The yeast community of
cacti. In: Andrews J. H. & Hriano S. S. (eds), Microbial Ecology of Leaves.
Springer, New York. pp. 158 -178.
Szczodrak J., Szewczuk D., Rogalski J. & Fiedurek J. (1997). Selection of yeast strain
and fermentation conditions for high-yield ethanol production from lactose and
concentrated whey. Acta Biotechnologica; 17:51-61.

96
Tamura K., Dudley J., Nei M. & Kumar S. (2007) MEGA4: Molecular Evolutionary
Genetics Analysis (MEGA) software version 4.0. Molecular Biology and
Evolution; 24:1596-1599.
Tansel H. Y. & Fusun B. U. (2009): Isolation and characterization of cheese spoiler
yeast isolated from Turkish white cheeses. Annals of Microbiology; 59 (3): 477-
483.
Tenenbaum D. J. (2008). Food vs. Fuel: Diversion of Crops Could Cause More Hunger.
Environmental Health Perspective; 116(6): 254–257.
Thiele J. H. (2005). Estimate of the energy potential for fuel ethanol from putrescible
wasteinNewZealand.Dunedin:WasteSolutionsLtd;http://wwwbioenergy.org.nz/docu
ments/liquidbiofuels/energy-potential-for-fuel-ethanol- 1098[Accesssed February
2012].
Valente P., Gouveia F. C., de Lemos G. A., Pimentel D., van Elsas J. D., Mendoga-
Hagler L. C. & Hagler A. N. (1996). PCR amplification of the rDNA internal
transcribed spacer region for differentiation of Saccharomyces cultures. FEMS
Microbiology Letters; 137:253-256.
Vallian S., Hassan M. & Nahvi I. (2004). Isolation and identification of yeast strains
capable of producing single cell protein from whey in co-cultures with
Saccharomyces cerevisiae. Iranian Journal of Biotechnology; 2(1):1-6.

97
van Maris A. J. A., Abbott D. A., Bellissimi E., van den Brink J., Kuyper M., Luttik
M. A. H., Wisselink H. W., Scheffers W. A., van Dijken J. P. & Pronk, J. T.
(2006). Alcoholic fermentation of carbon sources in biomass hydrolysates by
Saccharomyces cerevisiae: current status. Antonie van Leeuwenhoek 90:391–418.
Van Urk H., Voll W. S. L., Scheffers W. A. & van Dijken J. P. (1990). Transient-state
analyses of metabolic fluxes in Crabtree-positive and Crabtree-negative yeasts.
Applied Environmental Microbiology; 56:281–287.
Vasdinyei R. & Deák T. (2003). Characterization of yeast isolates originating from
Hungarian dairy products using traditional and molecular identification techniques.
International Journal of Food Microbiology; 86:123-130.
Verduyn C., Postma E., Scheffers W. A. & van Dijken J. P. (1992). Effect of benzoic
acid on metabolic fluxes in yeasts: a continuous-culture study on the regulation of
respiration and alcoholic fermentation.Yeast; 8:501–517.
Viljoen B. C., Kock J. L. F. & Lategan P. M. (1986). The influence of culture age on
the cellular fatty acid composition of four selected yeasts. Journal of General
Microbiology;132:1895-1898.
Vision 2030 document of Kenya. [online]. Available from: www.planning.go.ke/
[Accessed on: 0ctober 15th 2012]
Welthagen J. J. & Viljoen B. C. (1999). The isolation and identification of yeasts
obtained during the manufacture and ripening of Cheddar cheese. Food
Microbiology; 16:63–73.

98
Wesselink J., Iglesia B., James S. A., Dicks J. L., Roberts I. N. & Rayward-Smith V.
J. (2002). Determining a unique defining sequence for yeast species using hashing
techniques. Bioinformatics; 18:1004 - 1010.
White T.J., Bruns T., Lee S. and Taylor J. (1990). Amplification and direct sequencing
of fungal ribosomal RNA genes for phylogenetics. In: PCR protocols. A guide to
methods and applications. Innis M. A., Gelfand D. H., Sninsky J. J. & White T.J.
(eds.). Academic Press, San Diego. pp 315-322.
Wyder M. T. & Puhan Z. (1997). A rapid method for identification of yeasts from kefyr
at species level. Michwissenchaft; 52:327-330.
Wyder M. T. & Puhan Z. (1999). Investigation of the yeast flora in smear ripened
cheeses. Milchiwissenschaft; 54:330-333.
Yang S. T & Silva E. M. (1995). Novel products and new technologies for use of a
familiar carbohydrate, milk lactose. Journal of Dairy Science; 78:2541-62.
Yarrow D. (1998). Methods for the isolation, maintenance and identification of yeasts.
In: The Yeasts, a Taxonomic Study, 4th ed., C. P. Kurtzman, J. W. Fell (Eds.),
Elsevier, Amsterdam. pp 77–101.
Yun C. W., Bauler M., Moore R. E., Klebba P. E. & Philppott C. C. (2001). The role
of the FRE family of plasma membrane reductases in the uptake of siderophore iron
in Saccharomyces cerevisiae. Journal of Biological Chemistry; 276: 10218-23.
Zafar S., Owais M., Salleemuddin M. & Husain S. (2005). Batch kinetics and
modelling of ethanolic fermentation of whey. International Journal of Food Science
and Technology; 40:597-604.

99
Zhang Y. H. P. & Lynd L. R. (2007). Cellulose utilization by Clostridium
thermocellum: Bioenergetics and Hydrolysis Product Assimilation. Proceedings of
National Academy of Science; 102:7321-7325.
Zoppellari F, & Bardi L. (2012). Production of bioethanol from effluents of the dairy
industry by Kluyveromyces marxianus. New Biotechnology; 12:4-6.

100
APPENDICES
Appendix 4. Phylogenetic tree for K. marxianus strain YC4 and related species
Appendix 2. Phylogenetic tree for K. marxianus strain M11and related species
Appendix 3. Phylogenetic tree for K. marxianus strain P2 and related species
Appendix 1. Phylogenetic tree for K.marxianus strain BM2 and related species

101
Appendix 5. Phylogenetic for Pichia norvegensis YC6 and related species
Appendix 6. Phylogenetic tree for P. norvegensis strain PC2 and related
species
Appendix 7. Phylogenetic tree for Pichia cactophila strain PB9 and related species

102
Appendix 8. Phylogenetic tree for Pichia cactophila strain PB10 and related species
Appendix 9. Phylogenetic tree for Candida inconspicua strain BM1 and related species
Appendix 10. Phylogenetic tree for Candida tropicalis strain P22 and related species

103
Appendix 11. Phylogenetic tree for Yarrowia lipolytica strain P42 and related species
Appendix 12. Phylogenetic tree for Yarrowia lipolytica strain P43 and related species
Appendix 13. Phylogenetic tree for Yarrowia lipolytica strain P45 and related species
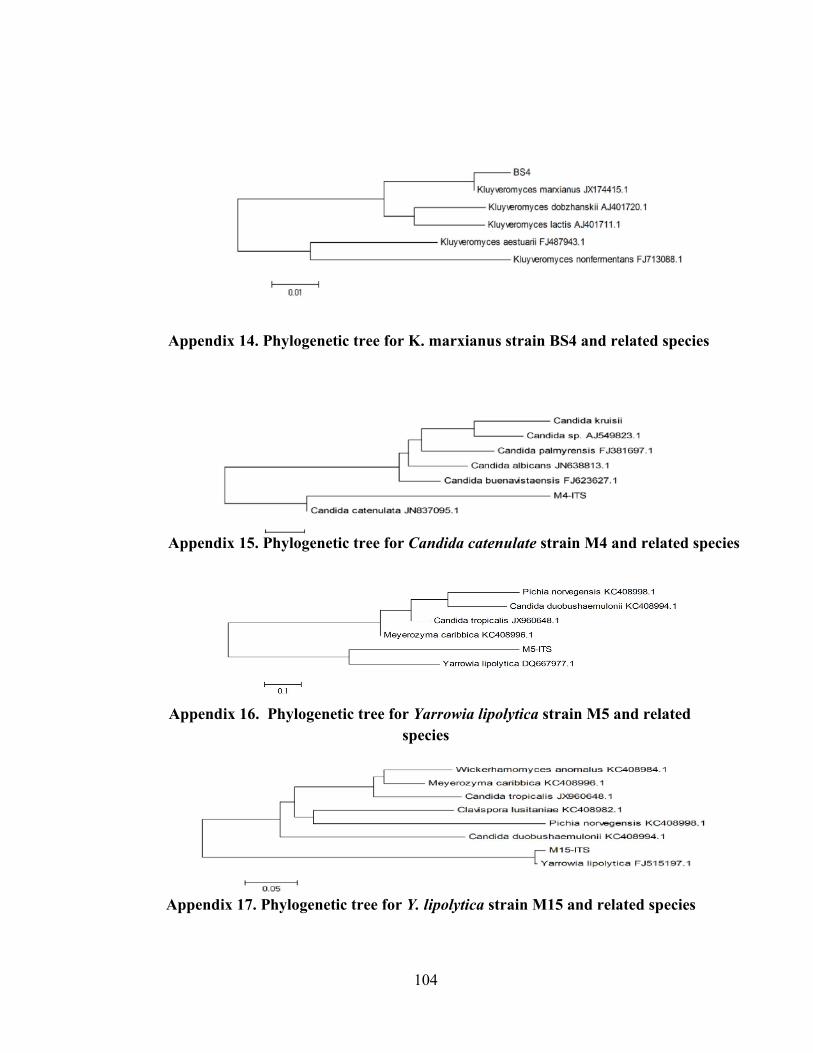
104
Appendix 16. Phylogenetic tree for Yarrowia lipolytica strain M5 and related
species
Appendix 14. Phylogenetic tree for K. marxianus strain BS4 and related species
Appendix 15. Phylogenetic tree for Candida catenulate strain M4 and related species
Appendix 17. Phylogenetic tree for Y. lipolytica strain M15 and related species

105
Appendix 19. Phylogenetic tree for Pichia cecembensis strain PC3 and related
species
Appendix 18. Phylogenetic tree for Yarrowia lipolytica strain P45 and related species

106
Score Expect Identities Gaps Strand Frame
1007 bits(545) 0.0() 555/559(99%) 4/559(0%) Plus/Plus
Query 4 ACCGGGCATTGCCTTAGT-ACGGCGAGTG-AGCGGCAAAAGCTCAAATTTGAAATCTGGC 61 |||||| ||||||||||| |||||||||| |||||||||||||||||||||||||||||| Sbjct 31 ACCGGG-ATTGCCTTAGTAACGGCGAGTGAAGCGGCAAAAGCTCAAATTTGAAATCTGGC 89 Query 62 GTCTTCGACGTCCGAGTTGTAATTTGAAGAAGGCGACTTTGTAGCTGGTCCTTGTCTATG 121 |||||||||||||||||||||||||||||||||||||||||||||||||||||||||||| Sbjct 90 GTCTTCGACGTCCGAGTTGTAATTTGAAGAAGGCGACTTTGTAGCTGGTCCTTGTCTATG 149 Query 122 TTCCTTGGAACAGGACGTCATAGAGGGTGAGAATCCCGTGTGGCGAGGATCCCAGTTATT 181 |||||||||||||||||||||||||||||||||||||||||||||||||||||||||||| Sbjct 150 TTCCTTGGAACAGGACGTCATAGAGGGTGAGAATCCCGTGTGGCGAGGATCCCAGTTATT 209 Query 182 TGTAAAGTGCTTTCGACGAGTCGAGTTGTTTGGGAATGCAGCTCTAAGTGGGTGGTAAAT 241 |||||||||||||||||||||||||||||||||||||||||||||||||||||||||||| Sbjct 210 TGTAAAGTGCTTTCGACGAGTCGAGTTGTTTGGGAATGCAGCTCTAAGTGGGTGGTAAAT 269 Query 242 TCCATCTAAAGCTAAATATTGGCGAGAGACCGATAGCGAACAAGTACAGTGATGGAAAGA 301 |||||||||||||||||||||||||||||||||||||||||||||||||||||||||||| Sbjct 270 TCCATCTAAAGCTAAATATTGGCGAGAGACCGATAGCGAACAAGTACAGTGATGGAAAGA 329 Query 302 TGAAAAGAACTTTGAAAAGAGAGTGAAAAAGTACGTGAAATTGTTGAAAGGGAAGGGCAT 361 |||||||||||||||||||||||||||||||||||||||||||||||||||||||||||| Sbjct 330 TGAAAAGAACTTTGAAAAGAGAGTGAAAAAGTACGTGAAATTGTTGAAAGGGAAGGGCAT 389 Query 362 TTGATCAGACATGGCGTTTGCTTCGGCTTTCGCTGGGCCAGCATCAGTTTTAGCGGTTGG 421 |||||||||||||||||||||||||||||||||||||||||||||||||||||||||||| Sbjct 390 TTGATCAGACATGGCGTTTGCTTCGGCTTTCGCTGGGCCAGCATCAGTTTTAGCGGTTGG 449 Query 422 ATAAATCCTCGGGAATGTGGCTCTGCTTCGGTAGAGTGTTATAGCCCGTGGGAATACAGC 481 |||||||||||||||||||||||||||||||||||||||||||||||||||||||||||| Sbjct 450 ATAAATCCTCGGGAATGTGGCTCTGCTTCGGTAGAGTGTTATAGCCCGTGGGAATACAGC 509 Query 482 CAGCTGGGACTGAGGATTGCGACTTTTGTCAAGGATGCTGGCGTAATGGTTAAATGCCGC 541 |||||||||||||||||||||||||||||||||||||||||||||||||||||||||||| Sbjct 510 CAGCTGGGACTGAGGATTGCGACTTTTGTCAAGGATGCTGGCGTAATGGTTAAATGCCGC 569 Query 542 CCGTCTTGACCAACCGGAC 560 |||||||||||||| |||| Sbjct 570 CCGTCTTGACCAAC-GGAC 587
Appendix 20. Sequence alignment of the isolate BM9 against D1/D2 of 26S rDNA
sequence data of Kluyveromyces marxianusshowing 4 base pair substitutions

107
Score Expect Identities Gaps Strand Frame
977 bits(529) 0.0() 534/536(99%) 2/536(0%) Plus/Minus
Query 15 CAGCATCCTTG--AAAAGTCGCAATCCTCAGTCCCAGCTGGCTGTATTCCCACGGGCTAT 72 ||||||||||| ||||||||||||||||||||||||||||||||||||||||||||||| Sbjct 549 CAGCATCCTTGACAAAAGTCGCAATCCTCAGTCCCAGCTGGCTGTATTCCCACGGGCTAT 490 Query 73 AACACTCTACCGAAGCAGAGCCACATTCCCGAGGATTTATCCAACCGCTAAAACTGATGC 132 |||||||||||||||||||||||||||||||||||||||||||||||||||||||||||| Sbjct 489 AACACTCTACCGAAGCAGAGCCACATTCCCGAGGATTTATCCAACCGCTAAAACTGATGC 430 Query 133 TGGCCCAGCGAAAGCCGAAGCAAACGCCATGTCTGATCAAATGCCCTTCCCTTTCAACAA 192 |||||||||||||||||||||||||||||||||||||||||||||||||||||||||||| Sbjct 429 TGGCCCAGCGAAAGCCGAAGCAAACGCCATGTCTGATCAAATGCCCTTCCCTTTCAACAA 370 Query 193 TTTCACGTACTTTTTCACTCTCTTTTCAAAGTTCTTTTCATCTTTCCATCACTGTACTTG 252 |||||||||||||||||||||||||||||||||||||||||||||||||||||||||||| Sbjct 369 TTTCACGTACTTTTTCACTCTCTTTTCAAAGTTCTTTTCATCTTTCCATCACTGTACTTG 310 Query 253 TTCGCTATCGGTCTCTCGCCAATATTTAGCTTTAGATGGAATTTACCACCCACTTAGAGC 312 |||||||||||||||||||||||||||||||||||||||||||||||||||||||||||| Sbjct 309 TTCGCTATCGGTCTCTCGCCAATATTTAGCTTTAGATGGAATTTACCACCCACTTAGAGC 250 Query 313 TGCATTCCCAAACAACTCGACTCGTCGAAAGCACTTTACAAATAACTGGGATCCTCGCCA 372 |||||||||||||||||||||||||||||||||||||||||||||||||||||||||||| Sbjct 249 TGCATTCCCAAACAACTCGACTCGTCGAAAGCACTTTACAAATAACTGGGATCCTCGCCA 190 Query 373 CACGGGATTCTCACCCTCTATGACGTCCTGTTCCAAGGAACATAGACAAGGACCAGCTAC 432 |||||||||||||||||||||||||||||||||||||||||||||||||||||||||||| Sbjct 189 CACGGGATTCTCACCCTCTATGACGTCCTGTTCCAAGGAACATAGACAAGGACCAGCTAC 130 Query 433 AAAGTCGCCTTCTTCAAATTACAACTCGGACGTCGAAGACGCCAGATTTCAAATTTGAGC 492 |||||||||||||||||||||||||||||||||||||||||||||||||||||||||||| Sbjct 129 AAAGTCGCCTTCTTCAAATTACAACTCGGACGTCGAAGACGCCAGATTTCAAATTTGAGC 70 Query 493 TTTTGCCGCTTCACTCGCCGTTACTAAGGCAATCCCGGTTGGTTTCTTTTCCTCCG 548 |||||||||||||||||||||||||||||||||||||||||||||||||||||||| Sbjct 69 TTTTGCCGCTTCACTCGCCGTTACTAAGGCAATCCCGGTTGGTTTCTTTTCCTCCG 14
Appendix 21. Sequence alignment of the isolate BM4 against D1/D2 of 26S
rDNA sequence data of Kluyveromyces marxianus showing 2 base pair
substitutions

108
Score Expect Identities Gaps Strand Frame
861 bits(466) 0.0() 492/504(98%) 3/504(0%) Plus/Minus
Features:
Query 41 CCAGCTGGCTGTATTCCC-CGGGCTATAACCCTCTACCGAA-CAGAGCCACATTCCCGAG 98 |||||||||||||||||| ||||||||||| |||||||||| |||||||||||||||||| Sbjct 504 CCAGCTGGCTGTATTCCCACGGGCTATAACACTCTACCGAAGCAGAGCCACATTCCCGAG 445 Query 99 GATTTATCC-ACCGCTATAACTGATGCTGGCCCAGCGAAAGCCGAAGCAAACGCCATGTC 157 ||||||||| ||||||| |||||||||||||||||||||||||||||||||||||||||| Sbjct 444 GATTTATCCAACCGCTAAAACTGATGCTGGCCCAGCGAAAGCCGAAGCAAACGCCATGTC 385 Query 158 TGATCAAATGCCCTTCCCTTTCAACAATTTTACGTACTTTTTCACTCTCTTTTCAAAGTT 217 |||||||||||||||||||||||||||||| ||||||||||||||||||||||||||||| Sbjct 384 TGATCAAATGCCCTTCCCTTTCAACAATTTCACGTACTTTTTCACTCTCTTTTCAAAGTT 325 Query 218 CTTTTCATCTTTCCATCACTGTACTTGTTCGCTATCGGTCTCTCGCCAATATTTAGCTTT 277 |||||||||||||||||||||||||||||||||||||||||||||||||||||||||||| Sbjct 324 CTTTTCATCTTTCCATCACTGTACTTGTTCGCTATCGGTCTCTCGCCAATATTTAGCTTT 265 Query 278 AGATGGAATTTACCACCCACTTAGAGCTGCATTCCCAAACAACTCGACTCGTCGAAAGCA 337 |||||||||||||||||||||||||||||||||||||||||||||||||||||||||||| Sbjct 264 AGATGGAATTTACCACCCACTTAGAGCTGCATTCCCAAACAACTCGACTCGTCGAAAGCA 205 Query 338 CTTTACAAATAACTGGGATCCTCGCCACACGGGATTCTCACCCTCTATGACGTCCTGTTC 397 |||||||||||||||||||||||||||||||||||||||||||||||||||||||||||| Sbjct 204 CTTTACAAATAACTGGGATCCTCGCCACACGGGATTCTCACCCTCTATGACGTCCTGTTC 145 Query 398 CAAGGAATATAAACGAGGACCAGCTACAAAGTCACCTTCTTCAAATTACAACTCGGACGT 457 ||||||| ||| || ||||||||||||||||| ||||||||||||||||||||||||||| Sbjct 144 CAAGGAACATAGACAAGGACCAGCTACAAAGTTACCTTCTTCAAATTACAACTCGGACGT 85 Query 458 CGAAGACGCCAGATTTCAAATTTGAGCTTTTGCCGCTTCACTCGCCGTTTCTAAGGCAGT 517 ||||||||||||||||||||||||||||||||||||||||||||||||| |||||||| | Sbjct 84 CGAAGACGCCAGATTTCAAATTTGAGCTTTTGCCGCTTCACTCGCCGTTACTAAGGCAAT 25 Query 518 CCCGGTTGGTTTCTTTTCCTCCGC 541 |||||||||||||||||||||||| Sbjct 24 CCCGGTTGGTTTCTTTTCCTCCGC
Appendix 22. Sequence alignment of the isolate P41 against D1/D2 of 26S rDNA
sequence data of Kluyveromyces lactis showing 11 base pair substitutions

109
Score Expect Identities Gaps Strand Frame
1042 bits(564) 0.0() 571/574(99%) 2/574(0%) Plus/Plus
Features:
Query 13 CTCAGTAGCGGCGAGTG-AGCGGCAAGAGCTCAGATTTGAAATCGCAGCACCATGCTGCG 71
||||||||||||||||| ||||||||||||||||||||||||||||||| ||||||||| Sbjct 9 CTCAGTAGCGGCGAGTGAAGCGGCAAGAGCTCAGATTTGAAATCGCAGC-GCATGCTGCG 67 Query 72 AGTTGTAGATTGCAGGTGGGAGAGTCTGCGTAGGCCGGTGTCGAAGTCCCTTGGAACAGG 131 |||||||||||||||||||||||||||||||||||||||||||||||||||||||||||| Sbjct 68 AGTTGTAGATTGCAGGTGGGAGAGTCTGCGTAGGCCGGTGTCGAAGTCCCTTGGAACAGG 127 Query 132 GCGCCACTGAGGGTGAGAGCCCCGTGCGATGCCACGCTCTACGTTTTGTACTCCCCTCTG 191 |||||||||||||||||||||||||||||||||||||||||||||||||||||||||||| Sbjct 128 GCGCCACTGAGGGTGAGAGCCCCGTGCGATGCCACGCTCTACGTTTTGTACTCCCCTCTG 187 Query 192 ACGAGTCGAGTTGTTTGGGAATGCAGCTCTAAGTGGGTGGTAAATTCCATCTAAGGCTAA 251 |||||||||||||||||||||||||||||||||||||||||||||||||||||||||||| Sbjct 188 ACGAGTCGAGTTGTTTGGGAATGCAGCTCTAAGTGGGTGGTAAATTCCATCTAAGGCTAA 247 Query 252 ATACTGGCGAGAGACCGATAGCGAACAAGTACTGTGAAGGAAAGATGAAAAGCACTTTGA 311 |||||||||||||||||||||||||||||||||||||||||||||||||||||||||||| Sbjct 248 ATACTGGCGAGAGACCGATAGCGAACAAGTACTGTGAAGGAAAGATGAAAAGCACTTTGA 307 Query 312 AAAGAGAGTGAAACAGCACGTGAAATTGTTGAAAGGGAAGGGTATTGGGCCCGACATGGG 371 |||||||||||||||||||||||||||||||||||||||||||||||||||||||||||| Sbjct 308 AAAGAGAGTGAAACAGCACGTGAAATTGTTGAAAGGGAAGGGTATTGGGCCCGACATGGG 367 Query 372 AATCGCGCACCGCTGCTCCTTGTGGGCGGCGCTCTGGGCTTTTCCTGGGCCAGCATCGGT 431 |||||||||||||||||||||||||||||||||||||||||||||||||||||||||||| Sbjct 368 AATCGCGCACCGCTGCTCCTTGTGGGCGGCGCTCTGGGCTTTTCCTGGGCCAGCATCGGT 427 Query 432 TCTTGCTGCAGGAGAAGGGGCTGTGGAATGTGGCTGCCGCGCTTTGCCGGGGCAGTGTTA 491 |||||||||||||||||||||||||||||||||||||||||||||||||||||||||||| Sbjct 428 TCTTGCTGCAGGAGAAGGGGCTGTGGAATGTGGCTGCCGCGCTTTGCCGGGGCAGTGTTA 487 Query 492 TAGCCACTGGGCCAGATGCTGCGTGTGGGGACCGAGGACTGCGGCCGCAAGGTCTCGGAT 551 |||||||||||||||||||||||||||||||||||||||||||||||||||||||||||| Sbjct 488 TAGCCACTGGGCCAGATGCTGCGTGTGGGGACCGAGGACTGCGGCCGCAAGGTCTCGGAT 547 Query 552 GCTGGCACAACGGCGCAATACCGCCCGTCTTGAA 585 |||||||||||||||||||||||||||||||||| Sbjct 548 GCTGGCACAACGGCGCAATACCGCCCGTCTTGAA 581
Appendix 23. Sequence alignment of the isolate YB2 against D1/D2 of 26S rDNA
sequence dataof Pichia cactophila showing 3 base pair substitutions

110
Appendix 24. HPLC chromatogram of 6% for ethanol
Appendix 25. HPLC chromatogram of ethanol yield for BM4