isoflavone synthase: presence and activity in leguminous ... · čeledích, ortolog známých ifs z...
TRANSCRIPT

1
CHARLES UNIVERSITY IN PRAGUE
FACULTY OF SCIENCE
Department of Plant Experimental Botany
Isoflavone Synthase: Presence and Activity in Leguminous and Non-leguminous Plants
MASTERS THESIS
Martina Pičmanová
Supervisor: RNDr. David Honys, PhD.
Prague 2010
2
The present work was carried out at the Laboratory of Pollen Biology at the Institute of Experimental Botany AS CR, Prague.
Declaration
I hereby declare that, except where explicitly indicated otherwise, I completed this
masters thesis independently, and that it documents my own work, carried out under the
guidance of my supervisor RNDr. David Honys, PhD. Throughout, I have properly
acknoweldged and cited all sources used.
Prague, 24 July 2010 ……...……………………………………..
3
All we need is plant.
Acknowledgements
It is a pleasure to thank my supervisor RNDr. David Honys, PhD. for his patient
guidance, valuable comments and useful ideas. I would like to acknowledge my debt to
Prof. RNDr.Oldřich Lapčík, Dr., who first introduced me to the fascinating world of
isoflavonoids and enabled me to participate in his project. I feel very grateful to all my
laboratory colleagues, who were always ready to help, answer any queries and
encourage me in every crisis situation. Many thanks are due to Tsuyoshi Nakagawa,
who so kindly provided us with the pGWB binary vectors; Ing. Jana Feciková for her
guidance on proteomic analysis; Mgr. Edita Drdová, Mgr. David Reňák and RNDr. Jan
Petrášek, Ph.D., for their help with transient expression procedures and confocal
microscopy; Ing. Petra Mikšátková for taking the HPLC-MS measurements; and Ing.
Roman Pleskot for his molecular-modelling art. I would like to express my whole-
hearted gratitude to my partner in life, for our intellectually-stimulating and thoughtful
discussions, and for his infinite patience. Last but not least, I would like to thank my
parents, whose all-embracing support has been essential – and not just for my studies.
This work was supported by grant: Projekt GA525/09/0994 - Chemotaxonomie
isoflavonoidů, Czech Science Foundation

4
ABSTRACT
Isoflavone synthase (IFS; CYP93C) plays a key role in the biosynthesis of the
plant secondary metabolites, isoflavonoids. These phenolic compounds, which are well-
known for their multiple biological effects, are produced mostly in leguminous plants
(family Fabaceae). However, at least 225 of them have also been decribed in 59 other
families, without any knowledge of orthologues to hitherto known IFS genes from
legumes (with the single exception of sugar beet – Beta vulgaris, from the family
Chenopodiaceae).
Based on these findings, this masters thesis has focused on two main objectives:
(1) to identify isoflavone synthase genes in chosen leguminous and non-leguminous
plants by the PCR strategy with degenerate and non-degenerate primers, and (2) to find
a system for the verification of the correct function of these genes.
Our methodology for the identification of IFS orthologues was successfully
demonstrated in the case of two examined legumes – Phaseolus vulgaris L. and
Pachyrhizus tuberosus (Lam.) Spreng, in genomic DNA of which the complete IFS
sequences have been newly identified. To design a procedure for ascertaining the
correct function of these genes and others once they have been completely described, a
pilot study with IFS from Pisum sativum L. (CYP93C18; GenBank number
AF532999.2) was conducted. CYP93C18 was identified, cloned and introduced into the
isoflavone pathway-free plant Arabidopsis thaliana using GatewayTM technology. Its
correct function was verified at four different levels by: PCR with IFS-specific primers
(DNA), RT-PCR (RNA), Western-blots (proteins) and HPLC-MS (metabolites). In
addition, CYP93C18::GFP fused proteins were transiently expressed in the leaves of
Nicotiana benthamiana, and the localisation of the GFP signal was observed on the
endoplasmic reticulum using confocal microscopy, which is consistent with the
predicted presence of a signal peptide in the IFS´s N-terminus of IFS, as well as with
the model of IFS generated in silico on the basis of cytochromes P450 homology.
Keywords: cytochrome P450, isoflavone synthase, CYP93C18, Pisum sativum L.,
Pachyrhizus tuberozus (Lam.) Spreng, Phaseolus vulgaris L., pilot study, GFP,
endoplasmic reticulum membrane

5
ABSTRAKT
Isoflavonsynthasa (IFS; CYP93C) hraje klíčovou roli v biosyntéze rostlinných
sekundárních metabolitů – isoflavonoidů. Tyto fenolické látky, známé díky širokému
spektru svých biologických účinků, jsou produkovány především rostlinami čeledi
bobovité (Fabaceae). Ačkoliv bylo alespoň 225 isoflavonoidů detekováno i v 59 dalších
čeledích, ortolog známých IFS z bobovitých rostlin byl doposud popsán pouze v jediné
nebobovité rostlině – Beta vulgaris (čeleď Chenopodiaceae).
Tato diplomová práce si na základě zmíněných poznatků kladla za cíl (1)
identifikovat ortologní geny pro isoflavonsynthasu ve vybraných bobovitých a
nebobovitých rostlinách a (2) vytvořit sytém pro ověřování správné funkce těchto genů.
Naše metodika pro identifikaci ortologů IFS se osvědčila v případě dvou
zkoumaných bobovitých rostlin – Phaseolus vulgaris L. a Pachyrhizus tuberosus
(Lam.) Spreng, v jejichž genomické DNA byly nově identifikovány kompletní sekvence
genu pro IFS. Aby bylo možno v budoucnu ověřit správnou funkci těchto a dalších
případných genů pro IFS, byla provedena pilotní studie s IFS pocházející z Pisum
sativum L (CYP93C18; GenBank number AF532999.2). Gen pro CYP93C18 byl
identifikován, klonován s využitím Gateway™ technologie a vnesen do Arabidopsis
thaliana – rostliny postrádající biosyntetickou dráhu isoflavonoidů. Správná funkce
CYP93C18 v transgenních rostlinách pak byla ověřována na čtyřech úrovních: PCR
s primery specifickými k IFS (DNA), RT-PCR (RNA), Western-bloty (proteiny) a
HPLC-MS (metabolity). Zároveň byla potvrzena správná intracelulární lokalizace
CYP93C18 metodou transientní exprese fúzních proteinů IFS::GFP v listech Nicotiana
benthamiana. Fluorescenční signál byl konfokálním mikroskopem pozorován na
endoplasmatickém retikulu, což odpovídá predikované přítomnosti signálního peptidu
na N-konci IFS, stejně jako modelu generovanému in silico na základě homologie
cytochromů P450.
Klí čová slova: cytochrom P450, isoflavonsynthasa, CYP93C18, Pisum sativum L.,
Pachyrhizus tuberozus (Lam.) Spreng, Phaseolus vulgaris L., pilotní studie, GFP,
membrána endoplasmatického retikula

6
CONTENTS
List of abbreviations ................................................................................................. 9 1. INTRODUCTION ............................................................................................ 10
2. LITERATURE SURVEY ................................................................................ 11
2.1. Isoflavonoid biosynthesis ...................................................................... 11
2.1.1. Phenylpropanoid metabolic pathway .................................................... 11
2.1.2. The biosynthetic branch leading to the production of
isoflavonoids ................................................................................... 12
2.2. Isoflavone synthase (IFS) ...................................................................... 15
2.2.1. Cytochromes P450 (CYPs) .............................................................. 15
2.2.2. CYP93C ........................................................................................... 15
2.2.3. Reaction mechanism of IFS ............................................................. 18
2.2.4. Molecular modelling of IFS active site ............................................ 19
2.3. 2-hydroxyisoflavanone dehydratase (2-HID) ...................................... 20
2.4. Isoflavonoids ........................................................................................... 21
2.4.1. Structure and classification of isoflavonoids.................................... 22
2.4.2. Isolation and identification of isoflavonoids .................................... 22
2.4.3. Taxonomical distribution of isoflavonoids ...................................... 23
2.4.4. Biological functions of isoflavonoids in plants ................................ 24
2.4.5. Pharmacological effects of isoflavonoids......................................... 26
2.5. Metabolic engineering of isoflavonoid biosynthesis ............................ 27
3. MATERIAL AND METHODS ....................................................................... 30
3.1. Material .................................................................................................. 30
3.1.1. Plant material .................................................................................... 30
3.1.2. Bacterial strains and plasmids .......................................................... 30
3.1.3. Antibiotics ........................................................................................ 30
3.1.4. Growth media ................................................................................... 30
3.1.5. Chemicals ......................................................................................... 31
3.1.6. Commercial kits for molecular biology ........................................... 32
3.2. General laboratory equipment used ..................................................... 32
3.3. Computational programmes and databases ........................................ 32
3.4. Methods and procedures ...................................................................... 33
7
3.4.1. Outline of our approach ................................................................... 33
3.4.2. Genomic DNA extraction ................................................................ 34
3.4.3. Identification of isoflavone synthase gene (IFS) .............................. 35
3.4.3.1. Primers design ...................................................................... 35
3.4.3.2. Polymerase chain reaction (PCR) ......................................... 36
3.4.3.3. Horizontal agarose gel electrophoresis ................................. 37
3.4.4. Cloning of fragments obtained with degenerate primers ................. 38
3.4.5. Cloning of putative IFS genes from Phaseolus vulgaris and
Pachyrhizus tuberosus ...................................................................... 40
3.4.6. Cloning and over-expression of CYP93C18 using GatewayTM
Technology ....................................................................................... 41
3.4.6.1. Directional TOPO® cloning of CYP93C18 .......................... 41
3.4.6.2. LR recombination reaction .................................................. 42
3.4.6.3. Transformation of Agrobacterium tumaefaciens ................. 44
3.4.7. The stable expression of CYP93C18 ............................................... 44
3.4.7.1. Transformation of Arabidopsis thaliana .............................. 44
3.4.7.2. Selection of transformants ................................................... 45
3.4.7.3. Analysis of transgenic Arabidopsis thaliana ....................... 45
3.4.7.3.1. Level 1: DNA ........................................................ 45
3.4.7.3.2. Level 2: RNA ........................................................ 45
3.4.7.3.3. Level 3: Proteins ................................................... 46
3.4.7.3.4. Level 4: Metabolites.............................................. 48
3.4.8. The transient expression of CYP93C18 ........................................... 48
3.4.8.1. Tranformation of Nicotiana benthamiana ........................... 48
3.4.8.2. Analysis of transgenic Nicotiana bethamiana ..................... 49
3.4.9. Modelling of CYP93C18 and computational methods .................... 49
4. RESULTS ......................................................................................................... 50
4.1. Identification of isoflavone synthase genes (IFS) .................................. 50
4.1.1. Identification of IFS in the chosen non-leguminous species ............ 50
4.1.2. Identification of complete IFS sequences from Pachyrhizus
and Phaseolus .................................................................................. 54
4.1.2.1. Characterization of IFS from Phaseolus vulgaris L. ........... 55
4.1.2.2. Characterization of IFS from Pachyrhizus tuberozus (Lam.) .
Speng . ............................................................................... 56

8
4.2. Pilot study with IFS (CYP93C18) from Pisum sativum L. .................... 57
4.2.1. Identification and isolation of CYP93C18 ....................................... 57
4.2.2. TOPO® cloning of CYP93C18 ......................................................... 62
4.2.3. Construction of CYP93C18 expression clone for stable
expression ......................................................................................... 64
4.2.3. Construction of CYP93C18 expression clone for transient
expression ......................................................................................... 66
4.2.4. Tranformation of Agrobacterium tumaefaciens ............................... 67
4.2.5. Transformation of pGWB2::IFS into Arabidopsis thaliana ............ 68
4.2.6. Verification of correct funtion of CYP93C18 transgene.................. 70
4.2.6.1. DNA level ............................................................................ 70
4.2.6.2. RNA level ............................................................................ 71
4.2.6.3. Protein level ......................................................................... 72
4.2.6.4. Metabolite level ................................................................... 74
4.2.7. Visualization of CYP93C18 in vivo ................................................. 78
4.2.8. IFS association with endoplasmic reticulum membrane .................. 78
5. DISCUSSION ................................................................................................... 81
5.1. IFS was detected in leguminous species only ......................................... 81
5.2. CYP93C18 is a functional isoflavone synthase ...................................... 84
5.3. IFS is localised on the membrane of the endoplasmic reticulum ......... 86
6. CONCLUSIONS .............................................................................................. 88
7. REFERENCES ................................................................................................. 89

9
ABBREVIATIONS
CDS Coding DNA sequence
CYP93C Subclass 93 of cytochrome P450
EDTA Ethylenediaminetetraacetic acid
ER Endoplasmic reticulum
GFP Green fluorescent protein
HPLC-ESI-MS High performance liquid chromatography-electrospray
ionisation- mass spectrometry
IFS Isoflavone synthase
LB medium Luria-Bertani medium
MS medium Murashige-Skoog medium
PCR Polymerase chain reaction
SDS-PAGE Sodium dodecyl sulfate polyacrylamide gel electrophoresis
10
1. INTRODUCTION
Amidst the vast number of cytochromes P450, isoflavone synthase (IFS;
belonging to the CYP93C subfamily) occupies a special place due to its key role in the
biosynthesis of plant secondary metabolites, isoflavonoids. Although these phenolic
compounds are produced predominantly in the Fabaceae family, they were detected in a
further 59 plant families, as far as known to date (Macková et al., 2006).
The literature deals extensively with the positive effects of these well-known
phytoestrogens on human health, including cancer prevention and the mitigation of
menopause symptoms, as well as with the potential risks associated with their
consumption (Ososki a Kennelly, 2003; Cornwell et al., 2004). In addition,
isoflavonoids have considerable importance for plants themselves, particularly as
phytoalexins and chemoattractants in rhizobial symbiosis.
Isoflavone synthase is known for its outstanding ability to catalyze both the
hydroxylation of the two flavanone precursors – liquiritigenin and naringenin – as well
as the critical migration of the aryl group from the C2 to the C3 position on the
chromene skeleton of the aforementioned flavanones. To date, 31 individual IFS-amino-
acid sequences, displaying a homology of more than 95%, have been described. Apart
from this, the presence of two isoforms of IFS has been reported only once, and in the
case of only a single non-leguminous species, namely Beta vulgaris (sugarbeet) from
family Chenopodiaceae (Jung et al., 2000).
In the light of the fact that there is a number of isoflavonoid-producing plant
families out of the Fabaceae family and yet we lack any knowledge of the genetic
background of their isoflavonoid biosynthesis (with the sole exception of sugarbeet), the
main objectives of this thesis were formulated as follows: (1) The identification of
isoflavone synthase genes in chosen non-leguminous and leguminous plants, and (2) the
performance of a pilot study with one of the two known IFS genes from Pisum sativum
L. – namely CYP93C18, GenBank accession no. AF532999 (Cooper et al., 2005) – in
order to develop a system for the verification of the correct function of newly-identified
genes orthologous to known IFSs. This study also entails the visualization of IFS in
vivo, thus providing confirmation of its subcellular localization.

11
2. LITERATURE SURVEY
2.1. Isoflavonoid biosynthesis
Isoflavonoids represent a group of phenolic plant secondary metabolites and are
well-known for their multiple beneficial effects to both plant and human health. Their
biosynthetic pathway and the unusual manner of their formation are therefore
frequently discussed in the literature, in most cases in connection with metabolic
engineering.
2.1.1. Phenylpropanoid metabolic pathway
The plant phenylpropanoid pathway is responsible for the production of a broad
spectrum of phenolic secondary metabolites including lignins, lignans, salicylates,
coumarins, stilbens, styrylpyrones and all compounds embraced by the common name
flavonoids – such as chalcones, isoflavonoids, flavones, flavonoles, anthocyanins,
condensed tannins, phlobaphenes and many others (Fig. 2.1; Buchanan et al., 2002).
The most abundant phenylpropanoid derivative is lignin (66.0% of the total), followed
by condensed tannins (18.6%) (Aksamit-Stachurska et al., 2008; Winkel-Shirley, 2001).
The compounds emerging from this pathway have a wide variety of functions as
structural, signalling and protective molecules, for which reason the pathway is the best-
studied secondary metabolic pathway of all (Yu and McGonigle, 2005).
The precursors of the phenylpropanoid pathway are phosphoenolpyruvate (from
glycolysis) and erythrose 4-phosphate (from the pentose phosphate pathway), leading to
two important intermediates, shikimic and chorismic acid. The phenylpropanoid
pathway itself begins with the action of phenyl ammonium lyase (PAL), which
deaminates the amino-acid phenylalanine derived from chorismate. The cinnamic acid
so formed is then converted, in several steps, into chalcon. The biosynthetic pathway
leads from chalcon to flavanones and then to isoflavones, which are the subject of our
interest. The other main biosynthetic steps and branches of the pathway are shown in
the diagram below (according to Buchanan et al., 2002; Fig. 2.1.).

Fig. 2.1. Schematic of the major branches oinvolved: (1) Phenylamonium lyase (PAL)coumaroyl:CoA-ligase (4CL), (CHI). Drawn in ACD/Chemsketch after Buchanan 2001.
2.1.2. The biosynthetic branch
The flavonoid
p-coumaroyl-CoA with three molecules of malonyl
skeleton – chalcone.
(formed by the catalysis
isoliquiritigenin (formed
reductase). From these structures arise
less abundant flavanone
chalcone isomerase)
leguminous species
liquiritigenin (Shimada
The aforementioned
and daidzein, respectively,
General phenylpropanoid patway
Flavonoids
12
Schematic of the major branches of the phenylpropanoid pathwayenylamonium lyase (PAL), (2) Cinnamate-4-hydroxylase (C4H), (3)ligase (4CL), (4) Chalcone synthase (CHS), (5) Chalcone isomerase
rawn in ACD/Chemsketch after Buchanan et al., 2002 and Winkel
biosynthetic branch leading to the production of isoflavonoids
flavonoid – and thus isoflavonoid – pathway starts with the condensation of
CoA with three molecules of malonyl-CoA, to form
. This can be the tetrahydroxychalcon named naringenin
catalysis of chalcone synthase), or the trihydroxy
formed through the catalysis of chalcone synthase and chalcone
From these structures arise the ubiquitous flavanone
less abundant flavanone liquiritigenin, respectively (both due to
(Steele et al., 1999). Interestingly, chalcone
guminous species is unable to catalyse the isomerization of isoliquiritigenin
(Shimada et al., 2003).
aforementioned flavanones are direct precursors of the
, respectively, which are the first isoflavonoids to appear
General phenylpropanoid patway
propanoid pathway. Enzymes hydroxylase (C4H), (3) 4-
(4) Chalcone synthase (CHS), (5) Chalcone isomerase 2002 and Winkel-Shirley,
isoflavonoids
pathway starts with the condensation of
to form the C15 flavonoid
named naringenin-chalcon
trihydroxychalcon named
catalysis of chalcone synthase and chalcone
ubiquitous flavanone naringenin, and the
(both due to the catalysis of
e isomerase from non-
unable to catalyse the isomerization of isoliquiritigenin into
the isoflavones genistein
flavonoids to appear in the pathway

13
(Fig. 2.2.). The conversion of the flavanones to isoflavones is carried out by the unusual
action of isoflavone synthase (2-hydroxyisoflavanone synthase) – which enzyme is
considered in section 2.3. The flavanone naringenin, however, is utilized by several
other enzymes from the flavonoid metabolism (e.g. flavanone-3-hydroxylase, flavone
synthase etc.), thus competing with IFS for the substrate (Yu and McGonigle, 2005).
The further metabolism of isoflavones involves enzymes such as
glycosyltransferases, prenyltransferases, methyltrasferases and others, all of which are
characterized by a wide substrate specificity (Lapčík, 2007). Their mode of action could
partly explain the phenomenon “Too few genes, too many metabolites” (Schwab, 2003),
reflecting the considerably higher number of metabolites compared to the limited
number of known genes coding the discussed enzymes.
According to Veitch (2007), one of the essential processes leading to
isoflavonoid diversification is the hydroxylation of the C-2´and C-3´positions by the
isoflavones 2´-hydroxylase and 3´-hydroxylase, respectively. Another important and
well-defined modification is the methylation of daidzein and its precursor 2,7,4´-
trihydroxyisoflavanone, resulting in the production of the isoflavones isoformononetin
and formonetin, respectively. The latter is a key precursor of isoflavans, coumestans and
pterocarpan phytoalexins (e.g. medicarpin or pisatin; Fig. 2.2.).

OH
OOH
O
OOH
O
OH
OOH
O
OH3CO
O
p-Coumaroyl
Isoliquiritigenin (a chalcone)
(2S)-Liquiritigenin
(a flavanone)
2,7,4´-Trihydroxyisoflavanone
Daidzein (an isoflavone)
Isoformononetin
CHS
++
CHR
CHI
IFD
D7OMT
- H2O
IFS
Fig. 2.2. Schematic of the isoflavonoid biosynthetic pathway.CHS, Chalcone synthase;isoflavone dehydratase; hydroxyisoflavanone 4´methyltransferase. DVeitch, 2007.
14
OH
OH
O
OHOH
OOH
OH
OH
OH
OH
OH
OH
OCH3
OOH
O
OH
OCH3
OOH
OH
H
OH
OCH3
OOH
O
OH
Coumaroyl-CoA + 3 Malonyl-CoA
Isoliquiritigenin (a chalcone) Tetrahydroxychalcone
Liquiritigenin
(a flavanone)
(2S
(a flavanone)
Trihydroxyisoflavanone
2,5,7,4´
tetrahydroxyisoflavanone
zein (an isoflavone) Genistein (an isoflavone)
Formononetin
(-)-Medicarpin (a pterocarpane)
2,7-dihydroxy-
4´-methoxyisoflavanone
CHS
CHR
CHS
HI4´OMT
- H2O
Schematic of the isoflavonoid biosynthetic pathway. , Chalcone synthase; CHI , chalcone isomerase; IFS, isoflavone synthase;
isoflavone dehydratase; IOMT , isoflavanone O-methyltransferase; hydroxyisoflavanone 4´-O-methyltransferase; D7OMT , daidzein 7methyltransferase. Drawn in ACD/Chemsketch after Buchanan
OH
OH
O
OOH
OH
O
O
OH
OH
O
OOH
OCH3
O
OOH
Tetrahydroxychalcone
S)-Naringenin
(a flavanone)
2,5,7,4´-
tetrahydroxyisoflavanone
Genistein (an isoflavone)
Biochanin A
CHI
IOMT
IFD
- H2O IFD
IFS
Enzymes involved: , isoflavone synthase; IFD ,
methyltransferase; HI4´IOMT , , daidzein 7-O-
rawn in ACD/Chemsketch after Buchanan et al., 2002 and

15
2.2. Isoflavone synthase (IFS)
Isoflavone synthase, IFS (also called 2-hydroxyisoflavanone synthase, 2-HIS)
plays a key role in the biosynthesis of the plant secondary metabolites, isoflavonoids.
This enzyme was discovered as a cytochrome P450 monooxygenase by the Griesebach
group at the University of Freiburg in 1984 (Hagmann and Griesebach, 1984). This was
when it was first proclaimed: “The ‘isoflavone synthase’ was found in elicitor-
challenged soybean cell cultures”. They reported that microsomes prepared from
elicitor-challenged soybean cell cultures catalysed the NADPH-dependent and
dioxygen-dependent rearrangement of radio-labelled naringenin to genistein. Many
years later, IFS was classified as a member of the subfamily CYP93C and will be treated
in more detail below.
2.2.1. Cytochromes P450 (CYPs)
Plant P450 monooxygenases are membrane-bound proteins consisting of a haem
and of an apoprotein that is responsible for the substrate specificity (Bolwell et al.,
1994). Utilizing reducing equivalents from the NADPH cofactor, they catalyse an
enormous range of oxidative reactions across all kingdoms. In plants they are involved
in the metabolism of lipids, phenylpropanoids, alkaloids, terpenoids and other
secondary metabolites.
The haem prosthetic group is bound through a cystein residue in a highly-
conserved domain near the C-terminus (Bolwell et al. 1994), in a position nearly
parallel to the surfaces between the L and I helices. Although the CYPs consist of
conserved α-helices and β-sheets, they display a narrow substrate specificity, as well as
strict regio- and stereo-specificities (Mansuy, 1998).
Several X-ray structures of some vertebrate and bacterial CYPs have been
described. According to the accessible literature, however, plant cytochromes P450
have not yet been obtained and thus the question of the precise structure of these
proteins remains to be solved.
2.2.2. CYP93C
In 1999-2000, that is as late as 16 years after its discovery, IFS was confirmed to
be the cytochrome P450 on the basis of genomic studies carried out independently by
three research groups (Steele et al. 1999; Akashi et al. 1999; Jung et al., 2000).

16
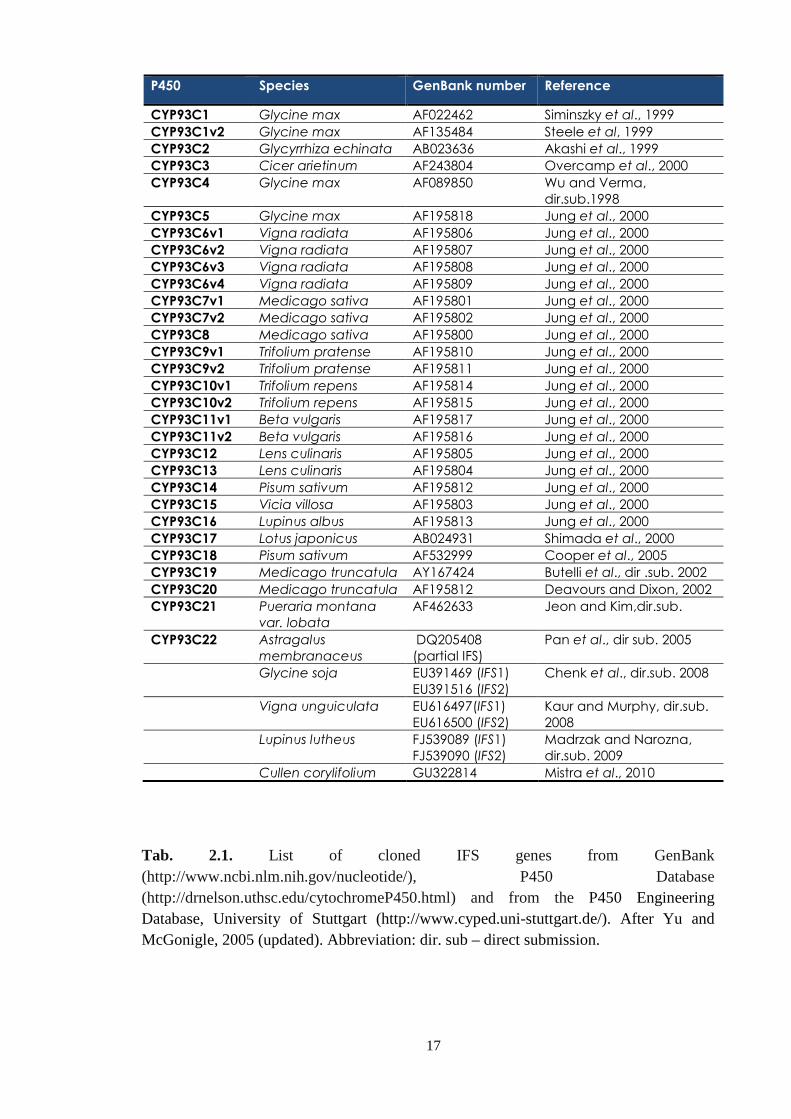
Based on the sequence homology and P450 nomenclature, all isoflavone
synthases of which the genes had been cloned were placed in the subfamily CYP93C,
and denoted by Dr. David Nelson (2009) by list numbers (Tab. 2.1.).
The sequences evince the typical features of cytochromes P450, including “A”-
“L” α-helices (the “I” helix is oxygen-binding), haem-binding motifs near the C-
terminus and conserved PERF domain (Steele et al., 1999; P450 Engineering Database,
University of Stuttgart).
To date (as of July 2010), 28 individual IFS-amino-acid sequences (including
IFS isoforms), displaying a homology of more than 95%, have been described in a total
of 17 leguminous species, according to the P450 Engineering Database (University of
Stuttgart). Moreover, three recent additions have appeared in the GenBank: two IFS
isoforms from the legume Lupinus luteus (Madrzak and Narozna, 2008, unpublished)
and one IFS sequence from the legume Cullen corylifolium (Misra et al., 2010). The
presence of IFS in non-leguminous species has hitherto been reported just once – in the
single case of Beta vulgaris, from the family Chenopodiaceae, where two IFS isoforms
have been found (Jung et al., 2000).
The soybean IFS gene was first described more or less at the same time
independently by Steele et al. (1999) and by Jung et al. (2000). Jung et al. isolated two
IFS isoforms (IFS1 and IFS2), which share highly homologous regions (92.5% at the
nucleotide level and 96.7% at the amino acid level), and both isoforms can convert the
flavanone substrates to isoflavones, but with differing degrees of efficiency (Jung et al.,
2000). Since that time, the gene has been succesfully over-expressed in several non-
leguminous species that do not produce isoflavonoids, namely Arabidopsis thaliana
(Jung et al., 2000 and others), tobacco (Jung et al., Yu et al., 2000, Liu et al., 2007),
tomato (Shih et al., 2008), petunia and lettuce (Liu et al., 2007), rice (Sreevidya et al,
2006), and maize black mexican sweet cells (Yu et al., 2000).
17
P450 Species GenBank number Reference
CYP93C1 Glycine max AF022462 Siminszky et al., 1999
CYP93C1v2 Glycine max AF135484 Steele et al, 1999
CYP93C2 Glycyrrhiza echinata AB023636 Akashi et al., 1999
CYP93C3 Cicer arietinum AF243804 Overcamp et al., 2000
CYP93C4 Glycine max AF089850 Wu and Verma, dir.sub.1998
CYP93C5 Glycine max AF195818 Jung et al., 2000
CYP93C6v1 Vigna radiata AF195806 Jung et al., 2000
CYP93C6v2 Vigna radiata AF195807 Jung et al., 2000
CYP93C6v3 Vigna radiata AF195808 Jung et al., 2000
CYP93C6v4 Vigna radiata AF195809 Jung et al., 2000
CYP93C7v1 Medicago sativa AF195801 Jung et al., 2000
CYP93C7v2 Medicago sativa AF195802 Jung et al., 2000
CYP93C8 Medicago sativa AF195800 Jung et al., 2000
CYP93C9v1 Trifolium pratense AF195810 Jung et al., 2000
CYP93C9v2 Trifolium pratense AF195811 Jung et al., 2000
CYP93C10v1 Trifolium repens AF195814 Jung et al., 2000
CYP93C10v2 Trifolium repens AF195815 Jung et al., 2000
CYP93C11v1 Beta vulgaris AF195817 Jung et al., 2000
CYP93C11v2 Beta vulgaris AF195816 Jung et al., 2000
CYP93C12 Lens culinaris AF195805 Jung et al., 2000
CYP93C13 Lens culinaris AF195804 Jung et al., 2000
CYP93C14 Pisum sativum AF195812 Jung et al., 2000
CYP93C15 Vicia villosa AF195803 Jung et al., 2000
CYP93C16 Lupinus albus AF195813 Jung et al., 2000
CYP93C17 Lotus japonicus AB024931 Shimada et al., 2000
CYP93C18 Pisum sativum AF532999 Cooper et al., 2005
CYP93C19 Medicago truncatula AY167424 Butelli et al., dir .sub. 2002
CYP93C20 Medicago truncatula AF195812 Deavours and Dixon, 2002
CYP93C21 Pueraria montana
var. lobata
AF462633 Jeon and Kim,dir.sub.
CYP93C22 Astragalus
membranaceus
DQ205408 (partial IFS)
Pan et al., dir sub. 2005
Glycine soja EU391469 (IFS1) EU391516 (IFS2)
Chenk et al., dir.sub. 2008
Vigna unguiculata EU616497(IFS1) EU616500 (IFS2)
Kaur and Murphy, dir.sub. 2008
Lupinus lutheus FJ539089 (IFS1) FJ539090 (IFS2)
Madrzak and Narozna, dir.sub. 2009
Cullen corylifolium GU322814 Mistra et al., 2010
Tab. 2.1. List of cloned IFS genes from GenBank (http://www.ncbi.nlm.nih.gov/nucleotide/), P450 Database (http://drnelson.uthsc.edu/cytochromeP450.html) and from the P450 Engineering Database, University of Stuttgart (http://www.cyped.uni-stuttgart.de/). After Yu and McGonigle, 2005 (updated). Abbreviation: dir. sub – direct submission.

18
O
O
OH
OH
R
O
O
OH
OH
R
O
O
OH
OH
R
OH
2.2.3. Reaction mechanism of IFS
In spite of the fact that the conversion of flavanones into isoflavones is a two-
step process, the overall reaction is frequently ascribed to IFS (Veitch, 2007). In fact,
due to the action of membrane-bound IFS, an unstable intermediate 2-
hydroxyisoflavanone arises from a flavanone precursor (Fig 2.3.). For this reason, “2-
hydroxyisoflavanone synthase” or “2-HIS” is a more precise name for the enzyme
involved (Yu and McGonigle, 2005). The subsequent step is catalyzed by a soluble 2-
hydroxyisoflavanone dehydratase, which is responsible for the 1,2-elimination of water
from 2-hydroxyisoflavanones and the formation of a double bond between the C2 and
C3 positions of the resulting isoflavone structures (Akashi et al., 2005; Fig 2.3.).
Fig. 2.3. The biosynthesis of isoflavone from flavanone, in detail. IFS, isoflavone synthase; HID , 2-hydroxyisoflavanone dehydratase. Drawn in ACD/ChemSketch, after Tian and Dixon, 2006.
Yu and McGonigle, who were both amongst the first discoverers of the
isoflavone synthase gene, call IFS an “intriguing enzyme“ due to its outstanding ability
to catalyze both the hydroxylation of the two flavanone precursors – liquiritigenin and
naringenin – and the critical migration of the aryl group from the C2 to the C3 position
on the chromene skeleton of the aforementioned flavanones (Yu and McGonigle 2005).
The reaction mechanism of the 1,2-aryl migration was studied in elicitor-
challenged Pueraria lobata cell cultures (Hashim et al., 1990; Hakamatsuka et al.,
1991). The authors suggested a new reaction mechanism which, in contrast to the
previous concept of enol-epoxidation of the flavanone (Kochs and Grisebach, 1986),
entailed hydroxylation associated with the rearrangement of the flavanone (Fig. 2.4.).
The reaction requires interaction with NADPH:cytochrome P450 reductase, which
provides the P450 with electrons by reducing the NADPH. The mechanism involves (1)
Spontaneous
dehydratation
NADPH
HID IFS
NADP
R=H: (2S)-liquiritigenin 2-hydroxyisoflavanon R=H: daidzein
R=OH: (2S)-naringenin R=OH: genistein

19
O
O
OH
OH
HH
H
OH
O
O
OH H
OH
Fe
O
O
O
OH
OH
H
H
Fe
OH
Fe
OHO
O
OH
HOH
H
O
O
OH
HOH
OHFeH
the abstraction of hydrogen from C3 by an activated oxygen intermediate, bound to
haem iron, followed by (2) the migration of the aryl group from position C2 to C3 on
the chromene skeleton, and (3) the rebinding of the hydroxyl radical to C2 (Sawada et
al., 2002). It is not clear whether or not IFS assists the dehydratase in the subsequent
step – the elimination of water (Yu and McGonigle, 2005). Although the reaction
catalysed by IFS is frequently called a “unique” reaction, it cannot be excluded that
examples of a similar reaction mechanism might be found within the complex plant
secondary metabolism.
Fig. 2.4. The probable reaction mechanism of oxidative aryl migration, catalyzed by isoflavone snythase (IFS) and leading to the production of isoflavones. (1) liquiritigenin, (2) 2,7,4´-trihydroxyisoflavanone (2-hydroxyisoflavanone, for short), (3) daidzein. Drawn in ACD/ChemSketch after Hakamatsuka et al., 1991. 2.2.4. Molecular modelling of IFS active site
In 2002, Sawada and his colleagues reported the identification of two amino-
acid residues that are critical for the aryl migration (Sawada et al., 2002). On the basis
of the known X-ray crystal structure of the cytochrome P450BM3 from Bacillus
megaterium (Ravichandarn et al., 1993), and using a multiple-alignment analysis with
members of the CYP93 family, they generated a 3-D model of CYP93C2 (IFS from
Glycirrhiza echinata; Fig. 2.5.). Several potentially crucial amino-acids were marked
out by docking (2S)-liquiritigenin into the modelled IFS active site. Point mutant
proteins were then expressed in a heterologous yeast system, with the following results:
(1) the wild-type IFS produced 2-hydroxyisoflavanone and a reaction by-product, 3-
hydroxyflavanone, in a ratio of 92:8; (2) the mutant protein with Ser 310 (centre of I
helix) →Thr yielded 2-hydroxyisoflavanone and by-products, in ratio of 57:43,
IFS IFS
IFS - H2O
Dehydratase
1.
3.
2. IFS
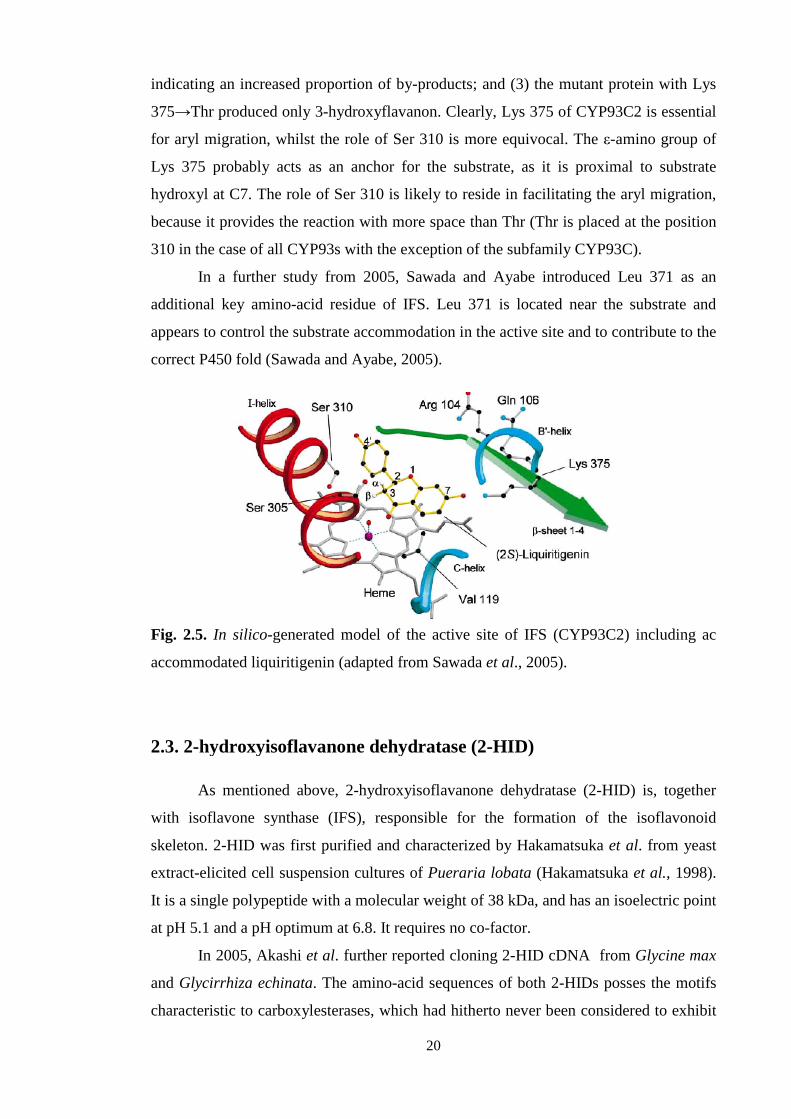
indicating an increased proportion of by
375→Thr produced only 3
for aryl migration, whilst the
Lys 375 probably acts as an anchor for the substrate, as it
hydroxyl at C7. The role of Ser 310
because it provides the reaction with
310 in the case of all CYP93s with the exception of the
In a further study from 2005
additional key amino
appears to control the substrate accommodation
correct P450 fold (Sawada and Ayabe, 2005).
Fig. 2.5. In silico-generated model of the active site of IFS (CYP93C2)
accommodated liquiritigenin
2.3. 2-hydroxyisoflavanone dehydratase
As mentioned above,
with isoflavone synthase (IFS)
skeleton. 2-HID was
extract-elicited cell suspension cultures of
It is a single polypeptide with a molecular weight of 38 kDa, and has an isoelectric point
at pH 5.1 and a pH optimum at 6.8. It requires
In 2005, Akashi
and Glycirrhiza echinata
characteristic to carboxylesterases
20
increased proportion of by-products; and (3) the mutant protein with Lys
Thr produced only 3-hydroxyflavanon. Clearly, Lys 375 of CYP93C2 is essential
whilst the role of Ser 310 is more equivocal.
probably acts as an anchor for the substrate, as it is proximal
hydroxyl at C7. The role of Ser 310 is likely to reside in facilitating the aryl migration
because it provides the reaction with more space than Thr (Thr is
in the case of all CYP93s with the exception of the subfamily CYP93C).
further study from 2005, Sawada and Ayabe introduced
key amino-acid residue of IFS. Leu 371 is located near the substrate
the substrate accommodation in the active site and
correct P450 fold (Sawada and Ayabe, 2005).
generated model of the active site of IFS (CYP93C2)
liquiritigenin (adapted from Sawada et al., 2005).
hydroxyisoflavanone dehydratase (2-HID)
As mentioned above, 2-hydroxyisoflavanone dehydratase
with isoflavone synthase (IFS), responsible for the formation of the isoflavonoid
was first purified and characterized by Hakamatsuka
cell suspension cultures of Pueraria lobata (Hakamatsuka
It is a single polypeptide with a molecular weight of 38 kDa, and has an isoelectric point
optimum at 6.8. It requires no co-factor.
Akashi et al. further reported cloning 2-HID cDNA from
rhiza echinata. The amino-acid sequences of both 2-HIDs
rboxylesterases, which had hitherto never been
mutant protein with Lys
375 of CYP93C2 is essential
The ε-amino group of
is proximal to substrate
in facilitating the aryl migration,
space than Thr (Thr is placed at the position
subfamily CYP93C).
introduced Leu 371 as an
is located near the substrate and
and to contribute to the
generated model of the active site of IFS (CYP93C2) including ac
ydroxyisoflavanone dehydratase (2-HID) is, together
on of the isoflavonoid
by Hakamatsuka et al. from yeast
Hakamatsuka et al., 1998).
It is a single polypeptide with a molecular weight of 38 kDa, and has an isoelectric point
HID cDNA from Glycine max
HIDs posses the motifs
never been considered to exhibit
21
O
O
35
6
7
8
2'
3'
4'
5'6'
2
O
O
2
56
7
8
2'
3'
4'
5'6'
3
dehydratase activity (Akashi et al., 2005). In other legumes, the production of
isoflavone from 2-hydroxyisoflavone is most probably catalyzed by 2-HID homologues.
However, in the case of non-leguminous plants the possible presence of a general
“flavonoid dehydratase”, or the spontaneous dehydratation of the intermediate, is more
probable (Yu and McGonigle, 2005).
2.4. Isoflavonoids
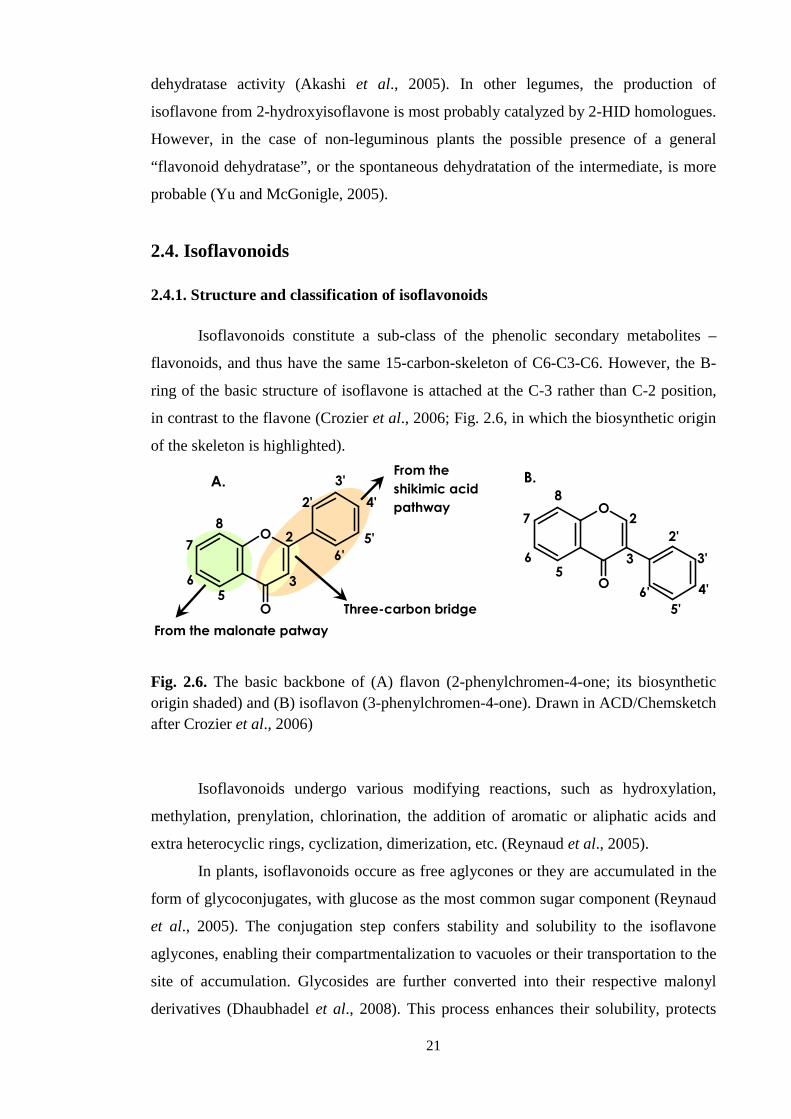
2.4.1. Structure and classification of isoflavonoids
Isoflavonoids constitute a sub-class of the phenolic secondary metabolites –
flavonoids, and thus have the same 15-carbon-skeleton of C6-C3-C6. However, the B-
ring of the basic structure of isoflavone is attached at the C-3 rather than C-2 position,
in contrast to the flavone (Crozier et al., 2006; Fig. 2.6, in which the biosynthetic origin
of the skeleton is highlighted).
Fig. 2.6. The basic backbone of (A) flavon (2-phenylchromen-4-one; its biosynthetic origin shaded) and (B) isoflavon (3-phenylchromen-4-one). Drawn in ACD/Chemsketch after Crozier et al., 2006)
Isoflavonoids undergo various modifying reactions, such as hydroxylation,
methylation, prenylation, chlorination, the addition of aromatic or aliphatic acids and
extra heterocyclic rings, cyclization, dimerization, etc. (Reynaud et al., 2005).
In plants, isoflavonoids occure as free aglycones or they are accumulated in the
form of glycoconjugates, with glucose as the most common sugar component (Reynaud
et al., 2005). The conjugation step confers stability and solubility to the isoflavone
aglycones, enabling their compartmentalization to vacuoles or their transportation to the
site of accumulation. Glycosides are further converted into their respective malonyl
derivatives (Dhaubhadel et al., 2008). This process enhances their solubility, protects
A. B.
Three-carbon bridge
From the
shikimic acid
pathway
From the malonate patway

22
O
O
O
O
O
OH
O
O
O
O
OH
OO
O
O
O
O
O
O
OH
O
O
O
O
O
O
O
O O
O
O
O
O
O
O
O
O
glycosides from degradation by glycosidases and helps in their intracellular transport
(Dhaubhaudel et al., 2008). The various modifications of isoflavonoids account for the
multiplicity of their subgroups. According to Veitch (2007), fourteen different
isoflavonoid subclasses can be distinguished, as shown in Tab. 2.2.
Isoflavones Isoflavans Isoflavanquinones Isoflavanones
Isoflav-3-enes
Rotenoids Dehydrorotenoids
12a-Hydroxyrotenoids
Pterocarpans Pterocarpenes
6a- Hydroxypterocarpans
Coumestans
Coumaronochromones
3-Arylcoumarins
2-Arylbenzofurans
Isoflavanols
Tab. 2.2. Overview of the individual subgroups of isoflavonoids and their basic chemical structures. Drawn in ACD/ChemSketch after Veitch, 2007.
2.4.2. Isolation and identification of isoflavonoids
Isoflavonoids are isolated from fresh, dried or lyophilised plant material. They
occur in subtantial amounts more often in roots, rhizomes, wood, bark, shoots and
seeds, than in leaves or flowers (Dacora and Phillips, 1996; Reynaud et al., 2005).
However, depending on both biotic and abiotic factors, isoflavonoids can accumulate in
any part of the plant (Dacora and Phillips, 1996).

23
As far as analytical techniques are concerned, the combination of high-
performance liquid chromatography (HPLC) with mass spectrometric detection (MS),
electrospray ionization (ESI) and atmospheric pressure chemical ionization (APCI), has
proved to be a useful tool (Boland and Donnelly, 1998). Gas chromatography, nuclear
magnetic resonance and capillary electrophoresis are also commonly employed. Apart
from these, immunochemical methods such as fluorescence immunoassay (FIA),
radioimmunoassay and enzyme-linked immunosorbent assay (ELISA) were also found
to be very sensitive and effective (Lapčík et al., 1999; Lapčík et al., 2004).
The constantly increasing sensitivity of methods for the analysis of natural
products now enables the detection of isoflavonoids even in such plants where only
traces can be found or in which the very occurence of isoflavonoids had not been
expected.
2.4.3. Taxonomical distribution of isoflavonoids
In the middle of the 19th century, Reinsch and Hlasiwetz first discovered the
isoflavonoid ononin in the roots of the leguminous plant Ononis spinoza L.
Surprisingly, further isoflavonoids came to be reported in connection with non-
leguminous species, namely iridin from Iris florentina (Iridaceae; de Laire and
Tiemann, 1893) and prunetin from Prunus sp. (Rosaceae; Finnemore, 1910) (cited from
Veitch, 2007 and Lapčík, 2007).
For their ubiquitousness in the family Fabaceae (leguminous plants),
isoflavonoids have been considered chemosystematic markers for this taxon in the past
(Reynaud et al., 2005). However, reports on the presence of isoflavonoids from sources
other than leguminous plants were also made. Three successive reviews in years 2005,
2006 and 2007 (Reynaud et al., 2005; Macková et al., 2006; Lapčík, 2007) attempted to
summarize current knowledge of the distribution of isoflavonoids in non-leguminous
families. According to Lapčík and Veitch, at least 225 out of over 1600 known
isflavonoids (predominantly isoflavones) have been described in 59 non-leguminous
families (Lapčík, 2007; Veitch, 2007). By the year 2007, isoflavonoids had been found
in one family of mosses (Bryopsida), three families of conifers (Pinopsida), 10 families
of monocots (Liliopsida) and 46 families of dicots (Magnoliopsida; Macková et al.,
2006; Lapčík, 2007; Tab. 2.3.).
Without being aware of the fact, we consume a certain amount of isoflavonoids
in our daily diet. Apart from seeds and other parts of leguminous plants (and especially

24
all soya products), these compounds have also been found in small amounts in certain
fruits, vegetables, cereals, potatoes, oil seeds and nuts (Boker et al., 2002, Mazur et al.,
2000). Isoflavonoids were also detected in green tea and coffee (Mazur et al., 1998),
beer (Rosenblum et al., 1992) and bourbon (Gavaler et al., 1987).
The effects of dietary isoflavonoids, including potential benefits and risks to
human health, will be discussed below.
Note: Isoflavonoids appeared to have been detected in some additional families (Lauraceae, Pedaliaceae etc.), but the evidence has not been considered to be reliable (Macková et al., 2006).
Tab 2.3. Overview of non-leguminous taxa producing isoflavonoids, as of 2007 (after Reynaud et al., 2005; Macková et al., 2006; Lapčík, 2007).
2.4.4. Biological functions of isoflavonoids in plants
The role of isoflavonoids in plant defence and in the induction of rhizobial
symbiosis is the most frequently discussed in the literature.
Due to their antimicrobial activity, some isoflavonoids are classified as
phytoalexins (i.e. antimicrobial compounds synthetised de novo in direct response to
microbial attack and other stressors) and as phytoanticipins (i.e. molecules chemically
identical to phytoalexins but stored in plant cells in anticipation of pathogenic attack or
produced after infection solely from preexisting constituents) (VanEtten et al., 1994).
Apart from isoflavonoids, which are the most widely studied class of phytoalexins, such
Division Family Division Family
Bryopsida Bryaceae Magnoliopsida Amaranthaceae Cucurbitaceae Polygalaceae
Pinopsida Araucariaceae Apiaceae Erythroxylaceae Polygonaceae
Cupressaceae Apocynaceae Euphorbiaceae Rhamnaceae
Podocarpaceae Asclepiadaceae Magnoliaceae Rosaceae
Liliopsida Asphodelaceae Asteraceae Malvaceae Rutaceae
Cyperaceae Bombacaceae Melastomataceae Rubiaceae
Eriocaulaceae Brassicaceae Menispermaceae Sapotaceae
Iridaceae Cannabaceae Moraceae Scrophulariacea
e Juncaceae Caryophyllaceae Myricaceae Solanaceae
Liliaceae Celastraceae Myristicaceae Sterculiaceae
Poaceae Chenopodiaceae Myrtaceae Urticaceae
Smilaceae Clusiaceae Nymphaeaceae Verbenaceae
Stemonaceae Connaraceae Nyctagicaeae Vitaceae
Zingiberaceae Convolvulaceae Ochnaceae Violaceae
Crassulaceae Papaveraceae Zygophyllaceae

25
defensive compounds can be found among terpenes, stilbene, benzofuranes and other
chemical groups (Dakora and Phillips, 1996).
The most potent phytoalexins in leguminous plants are the isoflavanone kieviton
(Phaseolus, Vigna); pterocarpans phaseollins (Phaseolus), pisatin (Pisum), medicarpin
(Cicer, Medicago), glyceollins (Glycine), maackiain (Trifolium); and the coumestan (a
fully-oxidised pterocarpan) coumestrol (Glycine, Medicago, Phaseolus, Vigna)
However, the simple isoflavones daidzein, genistein, formononetin, glycitein and
biochanin A also display some antimicrobial and antifungal activity (Dakora and
Phillips, 1996). Some examples of isoflavonoid phytoalexins have been detected in
several non-leguminous families (Chenopodiaceae, Myristicaceae, Zingiberaceae,
Iridaceae and others; Reynaud, 2005 and Lapčík, 2007). Moreover, rotenoids (especially
rotenone) from both leguminous and non-leguminous species are known for their
insecticidal, piscicidal and antiviral activies (Boland and Donnelly, 1998).
The production of isoflavonoid phytoalexins is regulated at the level of the
transcription of the genes which are required for the isoflavonoid biosynthesis. Biotic
elicitors (e.g. saccharides from the cell wall of the plant or of the pathogen) as well as
abiotic factors (e.g. UV radiation, heavy metals, too low or too high a concentrations of
minerals, etc.) play an important role in the stimulation of isoflavonoid formation. The
elicited isoflavonoids can then act as toxins against the pathogens; but the signalling
function of isoflavonoids in connection with hypersensitive response (HSR) and
systemic acquired resistance (SAR), still awaits clarification (Dacora and Phillips,
2006).
The concept of phytoalexins is somewhat complicated by the fact that some
isoflavonoids function as stimulants of the mutualistic interactions between leguminous
plants and the soil diazotropic bacteria collectively called rhizobia. Chemoattractants –
isoflavonoids and flavonoids – are excreted from roots and interact with rhizobial NodD
proteins, which serve as both environmental sensors and activators of transcription of
rhizobial nod genes. This induction leads to the synthesis of chitolipooligosaccharidic
Nod factors which, in turn, through positive feedback, stimulate the further production
of iso/flavonoids, provoke the nodulation of root hairs and allow rhizobia to enter the
root through the infection thread (Broughton et al., 2000; Cooper, 2004). Succesful
infection eventually results in reduction of atmosferic N2 to ammonia (a form of
nitrogen acceptable for plants) by rhizobial enzyme nitrogenase.
26
Subramanian et al. showed that the expression of soybean IFS increased in root
hairs as well as in xylem, in response to Bradyrhizobium japonicum treatment
(Subramanian et al., 2004). When IFS was silenced using RNA interference,
isoflavone levels, as well as nodulatin in soybean hairy roots, were reduced; and even
feeding the isoflavone genistein back in the IFS RNAi roots was not sufficient to
restore nodulation (Subramanian et al., 2006). Moreover, it was found that the IFSi
roots had a significantly higher level of auxin transport (the ability of isoflavone
genistein to act as auxin transport inhibitor having been demonstrated many years ago;
Jacobs and Rubery, 1988). According to these findings, isoflavonoids play a critical role
as nod gene inducers inside the root. Also, there is a clear connection between
isoflavonoid accumulation and the modulation of auxin transport, although this
connection was found not to be essential to nodulation (Subramanian et al., 2007).
Subramanian et al. also cloned and characterized the promoters of soybean, IFS1 and
IFS2, and found them to be root- and seed-specific. These two promoters respond
differently to stimuli such as defence or nodulation signals (Subramanian et al., 2004).
Another interesting result was obtained by Sreevidya et al., who introduced the
soybean IFS gene into rice (Sreevidya et al., 2006), which resulted in the transgenic
plants producing genistein in glycoside form. In addition, these plants were able to
induce nod gene expression, as demonstrated by experiments with different strains of
rhizobia (Sreevidya et al., 2006).
2.4.5. Pharmacological effects of isoflavonoids
In the last 20 years, isoflavonoids have attracted much attention due to their
multiple beneficial effect to human health. Isoflavones genistein and daidzein, the
richest source of which is dietary soybean, are known as effective phytoestrogens. There
is a countless number of publications dealing with this phenomenon.
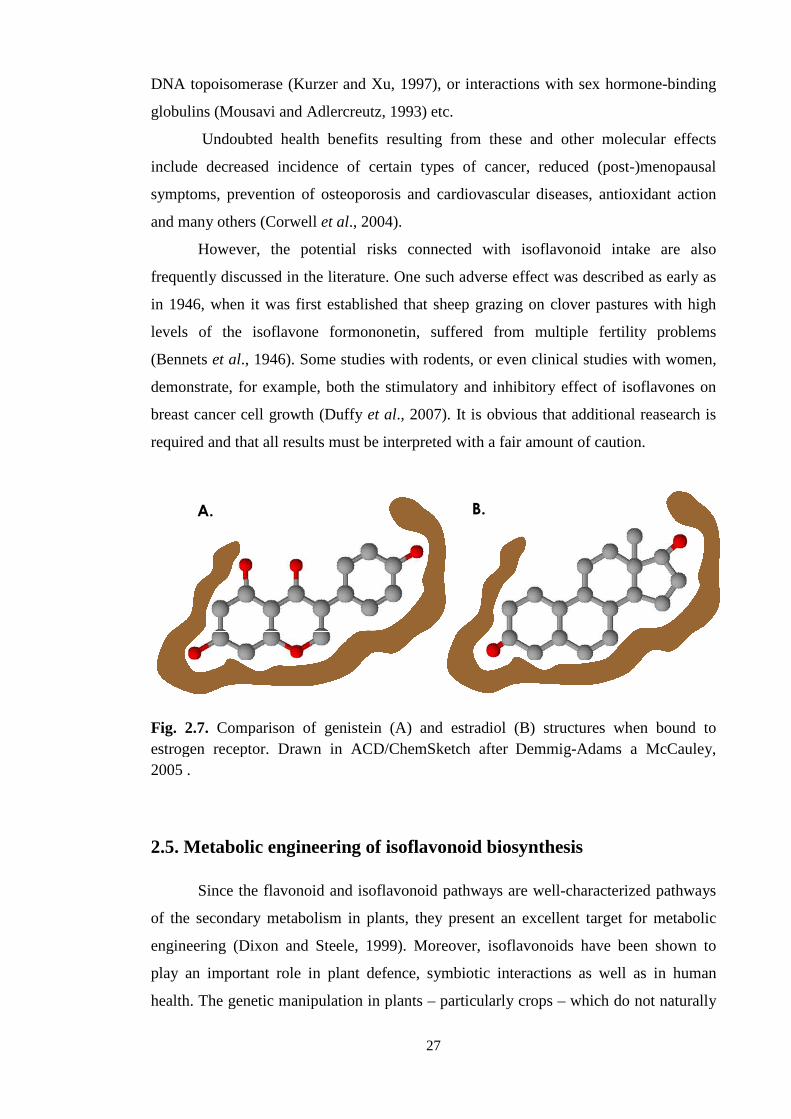
In brief, isoflavones have a structure which enables them to mimic the
endogenous hormone oestradiol and to bind the estrogen receptors α and β (Ososki and
Kennelly, 2003; Fig. 2.7). They can act as both agonists and antagonists, i.e. they can
respectively activate and block the signalling pathway leading to the expression of
estrogen-responsive genes. Hence they are termed “selective estrogen receptor
modulators” (SERMs) and are used as an alternative to hormone replacement therapy
(HRT; Brzezinski and Debi, 1999). Apart from this, isoflavones have several non-
genomic effects on humans, such as the inhibition of aromatase, thyrozine kinase and
DNA topoisomerase
globulins (Mousavi a
Undoubted h
include decreased incidence of certain types of cancer, reduced (post
symptoms, prevention of osteoporosis and cardiovascular diseases
and many others (Corwell
However, the potent
frequently discussed in the literature
in 1946, when it was first establis
levels of the isoflavone formononetin
(Bennets et al., 1946).
demonstrate, for example,
breast cancer cell growth (Duffy
required and that all results
Fig. 2.7. Comparisonestrogen receptor. Drawn in ACD/ChemSketch after2005 .
2.5. Metabolic eng
Since the flavonoid and isoflavonoid pathways are well
of the secondary metabolism in plants, they present an excel
engineering (Dixon and Steele, 1999)
play an important role in
health. The genetic manipulation in plants
A.
27
(Kurzer and Xu, 1997), or interactions with sex hormone
globulins (Mousavi and Adlercreutz, 1993) etc.
Undoubted health benefits resulting from these and other
include decreased incidence of certain types of cancer, reduced (post
, prevention of osteoporosis and cardiovascular diseases
and many others (Corwell et al., 2004).
However, the potential risks connected with isoflavonoi
ently discussed in the literature. One such adverse effect was described
it was first established that sheep grazing on clover
isoflavone formononetin, suffered from multiple fertility problems
., 1946). Some studies with rodents, or even clinical studies with women
, for example, both the stimulatory and inhibitory ef
ell growth (Duffy et al., 2007). It is obvious that additional reasearch is
all results must be interpreted with a fair amount of caution.
Comparison of genistein (A) and estradiol (B) structuresestrogen receptor. Drawn in ACD/ChemSketch after Demmig-
2.5. Metabolic engineering of isoflavonoid biosynthesis
the flavonoid and isoflavonoid pathways are well-characterized pathways
of the secondary metabolism in plants, they present an excellent target for metabolic
engineering (Dixon and Steele, 1999). Moreover, isoflavonoids
role in plant defence, symbiotic interactions as
The genetic manipulation in plants – particularly crops – which do not naturally
B.
or interactions with sex hormone-binding
and other molecular effects
include decreased incidence of certain types of cancer, reduced (post-)menopausal
, prevention of osteoporosis and cardiovascular diseases, antioxidant action
isoflavonoid intake are also
was described as early as
clover pastures with high
suffered from multiple fertility problems
or even clinical studies with women,
stimulatory and inhibitory effect of isoflavones on
., 2007). It is obvious that additional reasearch is
be interpreted with a fair amount of caution.
structures when bound to -Adams a McCauley,
of isoflavonoid biosynthesis
characterized pathways
ent target for metabolic
s have been shown to
plant defence, symbiotic interactions as well as in human
which do not naturally

28
produce isoflavonoids should thus provide the plants with several beneficial functions.
On the other hand, it would be desirable to produce genetically-modified isoflavone-
deficient plants as fodder for grazing animals (Crozier et al., 2006).
The introduction of the isoflavonoid pathway into non-legumes can theoretically
be achieved by transformation with a single enzyme – IFS (Liu et al., 2002). However,
such attemps up to now have resulted in insufficient levels of isoflavonoids produced in
transformed plants (Du et al., 2010). The bottleneck for engineered isoflavonoid
production is the competition for flavanone substrate between IFS and different
endogenous branches of the flavonoid pathway, especially common flavonol synthesis.
Clear evidence for this was provided when Liu et al. introduced IFS into the
tt6/tt3(F3H/DFR) double mutant, which was blocked in flavonol and anthocyanin
biosynthesis, and thus achieved higher levels of accumulated genistein (Liu et al.,
2002).
The metabolic chanelling through a metabolon (Fig. 2.8.) – for which a model
was proposed by Liu and Dixon (2001) and Yu and McGonigle (2005), can thus
complicate possible engineering strategies, by limiting the access of introduced
enzymes to their substrates (Dixon and Steele, 1999). The correct localization and
transport of the introduced protein thus play an important role. In the case of membrane-
bound IFS, the protein has to migrate from its site of synthesis and orientate itself into
the correct membrane (Jaganath, 2005), which cannot always be taken for granted. A
better understanding of how the metabolome is formed, knowledge of the interactions of
the components and as to how the pathways are regulated (the transcription factors
specific to the isoflavonoid pathway have not been yet reported), could open the way to
the succesful metabolic engineering of isoflavonoids (Yu and McGongle, 2005).
Although the present masters thesis is not concerned with the metabolic
engineering of isoflavonoids, our methodical approach builds upon the same principles
of genetic manipulation.
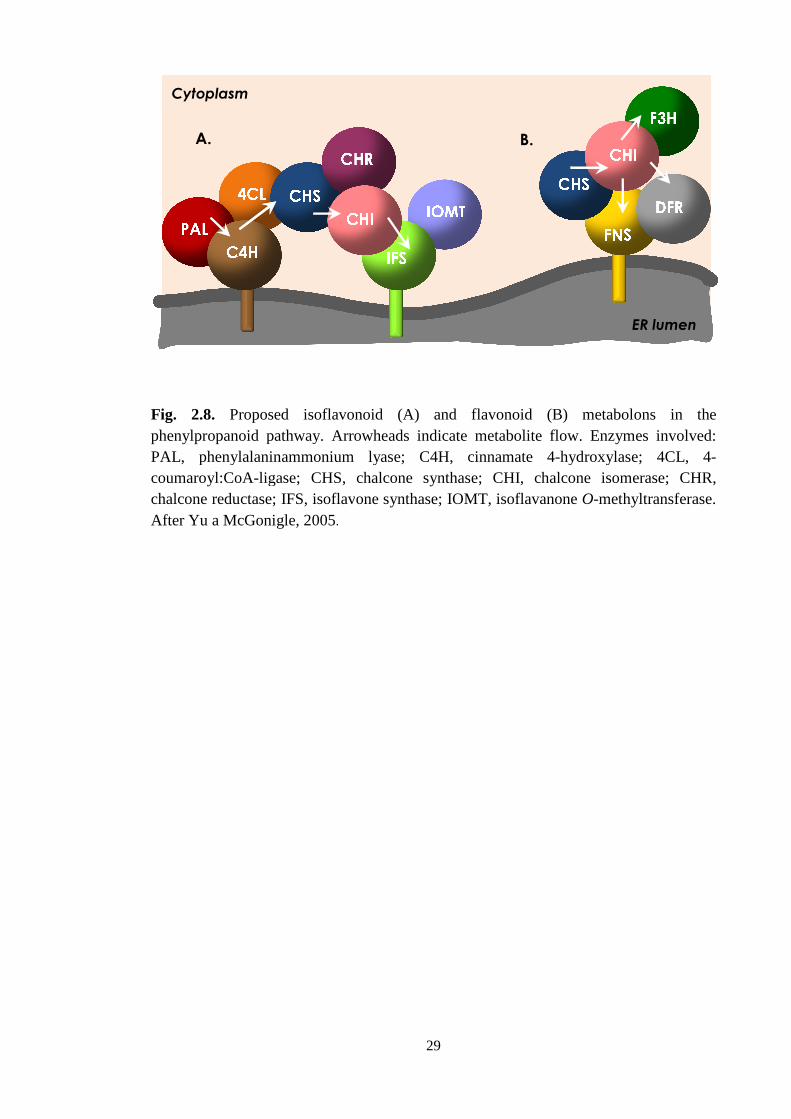
Fig. 2.8. Proposed isoflavonoid (A) and flavonoid (B) phenylpropanoid pathwayPAL, phenylalaninammonium lyase; C4H, cinnamate 4coumaroyl:CoA-ligasechalcone reductase; IFS, isoflavAfter Yu a McGonigle, 2005
A.
Cytoplasm
29
Proposed isoflavonoid (A) and flavonoid (B) oid pathway. Arrowheads indicate metabolite flow.
PAL, phenylalaninammonium lyase; C4H, cinnamate 4-hydroxylase; 4CL, ligase; CHS, chalcone synthase; CHI, chalcon
; IFS, isoflavone synthase; IOMT, isoflavanoneAfter Yu a McGonigle, 2005.
B.
Proposed isoflavonoid (A) and flavonoid (B) metabolons in the . Arrowheads indicate metabolite flow. Enzymes involved:
hydroxylase; 4CL, 4-one isomerase; CHR, e O-methyltransferase.
ER lumen
30
3. MATERIALS AND METHODS
3.1. MATERIAL
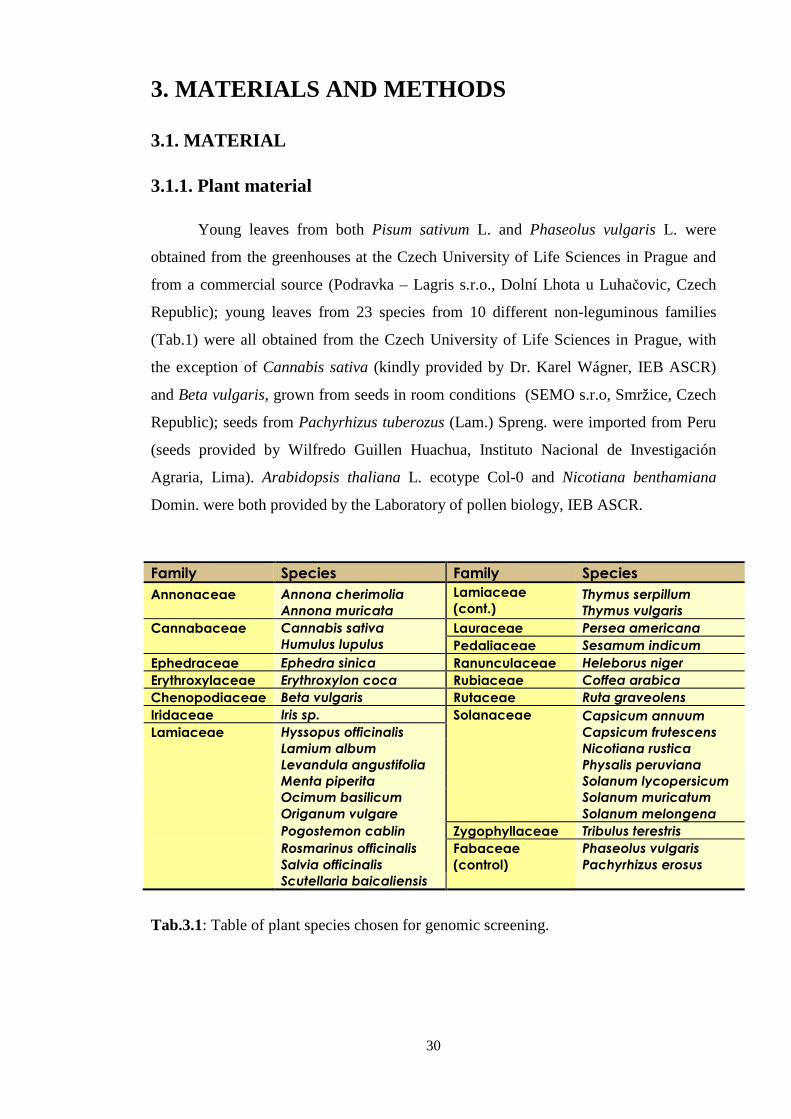
3.1.1. Plant material
Young leaves from both Pisum sativum L. and Phaseolus vulgaris L. were
obtained from the greenhouses at the Czech University of Life Sciences in Prague and
from a commercial source (Podravka – Lagris s.r.o., Dolní Lhota u Luhačovic, Czech
Republic); young leaves from 23 species from 10 different non-leguminous families
(Tab.1) were all obtained from the Czech University of Life Sciences in Prague, with
the exception of Cannabis sativa (kindly provided by Dr. Karel Wágner, IEB ASCR)
and Beta vulgaris, grown from seeds in room conditions (SEMO s.r.o, Smržice, Czech
Republic); seeds from Pachyrhizus tuberozus (Lam.) Spreng. were imported from Peru
(seeds provided by Wilfredo Guillen Huachua, Instituto Nacional de Investigación
Agraria, Lima). Arabidopsis thaliana L. ecotype Col-0 and Nicotiana benthamiana
Domin. were both provided by the Laboratory of pollen biology, IEB ASCR.
Family Species Family Species
Annonaceae
Annona cherimolia
Annona muricata
Lamiaceae (cont.)
Thymus serpillum
Thymus vulgaris
Cannabaceae Cannabis sativa
Humulus lupulus
Lauraceae Persea americana
Pedaliaceae Sesamum indicum
Ephedraceae Ephedra sinica Ranunculaceae Heleborus niger
Erythroxylaceae Erythroxylon coca Rubiaceae Coffea arabica
Chenopodiaceae Beta vulgaris Rutaceae Ruta graveolens
Iridaceae Iris sp. Solanaceae Capsicum annuum
Capsicum frutescens
Nicotiana rustica
Physalis peruviana
Lamiaceae Hyssopus officinalis
Lamium album
Levandula angustifolia
Menta piperita Solanum lycopersicum
Ocimum basilicum Solanum muricatum
Origanum vulgare Solanum melongena
Pogostemon cablin Zygophyllaceae Tribulus terestris
Rosmarinus officinalis
Salvia officinalis
Fabaceae (control)
Phaseolus vulgaris
Pachyrhizus erosus
Scutellaria baicaliensis
Tab.3.1: Table of plant species chosen for genomic screening.

31
3.1.2. Bacterial strains and plasmids
� The competent cells used were:
Escherichia coli – One Shot® TOP10 Chemically Competent E. coli (Invitrogen,USA)
Alpha-Select Gold Efficiency (Bioline, UK)
Agrobacterium tumaefaciens strain GV3101
� The plasmids used were:
pGEM®-T Easy (Promega, USA)
pCR8®/GW/TOPO® ((Invitrogen, USA)
pENTR™⁄D-TOPO®
pGWB2 and pGWB5 (obtained from Tsuyoshi Nakagawa, Shimane University, Matsue,
Japan)
3.1.3. Antibiotics
Antibiotics Final concentration Selection marker for:
Ampicilin 100 µg/ml pGEM®-T Easy in E.coli
Gentamycin 50 µg/ml Ti-plasmid in Agrobacterium
Hygromycin 50 µg/ml pGWB2 and pGWB5 in transformed Arabidopsis pGWB2 and pGWB5 in Alpha
Kanamycin 50 µg/ml pENTR™⁄D-TOPO® in E.coli, pGWB2 and pGWB5 in Alpha and Agrobacterium
Spectinomycin 100 µg/ml pCR8®/GW/TOPO® in E.coli
Rifampicin 100 µg/ml Ti-plasmid in Agrobacterium
3.1.4. Growth media
� Bacterial growth media (w/v)
S.O.C. medium (Invitrogen, USA) LB Broth: 2.5% LB Broth; pH 7.2 YEB medium: 0.5 % peptone, 0.6 % yeast extract, 0.05% MgSO4.7H2O, 0.5% sucrose; pH7.2 LB Agar: 3.5% LB Agar; pH 7.2 YEB Agar: YEB medium, 1.2 % Agar � Plant growth media (w/v)
½ MS medium: 0.2% Murashige and Skoog, 1% sucrose, 0.01% myo-inositol, 0.05 % MES, 0.8% agar; pH 5.7 + vitamins (1µg/ml of thiamin, 0.5 µg/ml pyridoxin and 0.5 µg/ml nicotine acid) All media were autoclaved for 20 min at 121°C and at pressure 1kPa prior to the
addition of appropriate antibiotics/vitamins.
32
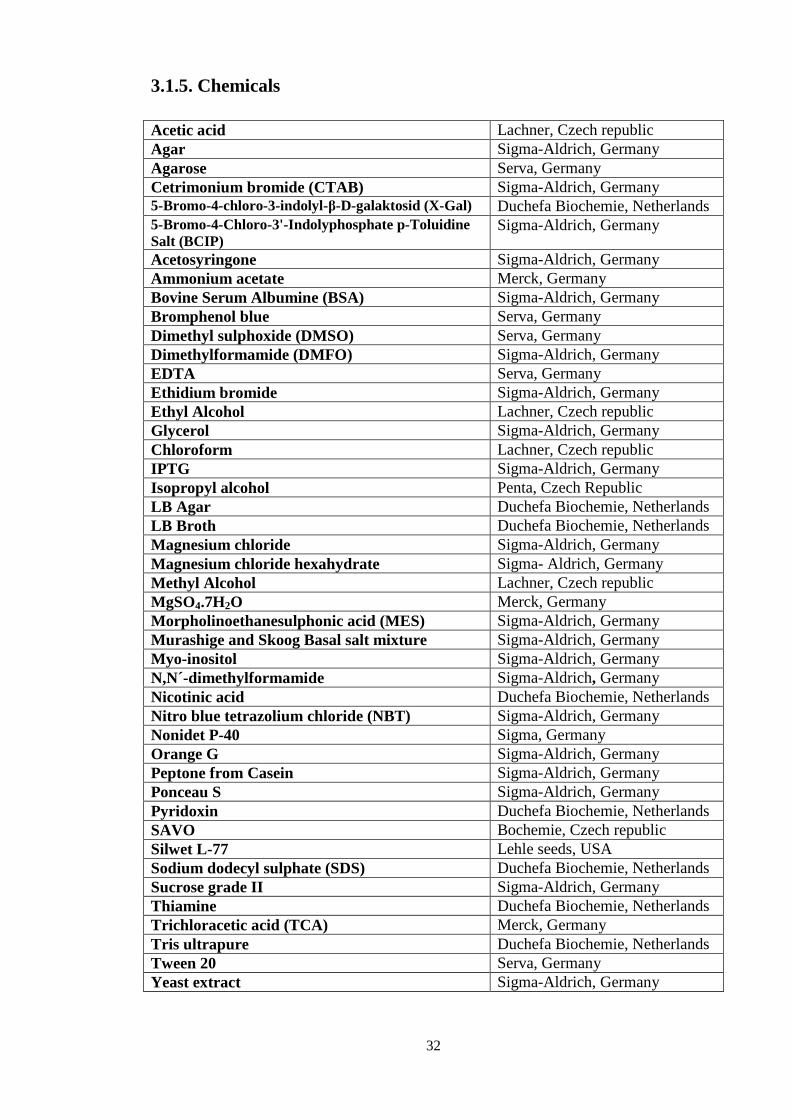
3.1.5. Chemicals
Acetic acid Lachner, Czech republic Agar Sigma-Aldrich, Germany Agarose Serva, Germany Cetrimonium bromide (CTAB) Sigma-Aldrich, Germany 5-Bromo-4-chloro-3-indolyl-β-D-galaktosid (X-Gal) Duchefa Biochemie, Netherlands 5-Bromo-4-Chloro-3'-Indolyphosphate p-Toluidine Salt (BCIP)
Sigma-Aldrich, Germany
Acetosyringone Sigma-Aldrich, Germany Ammonium acetate Merck, Germany Bovine Serum Albumine (BSA) Sigma-Aldrich, Germany Bromphenol blue Serva, Germany Dimethyl sulphoxide (DMSO) Serva, Germany Dimethylformamide (DMFO) Sigma-Aldrich, Germany EDTA Serva, Germany Ethidium bromide Sigma-Aldrich, Germany Ethyl Alcohol Lachner, Czech republic Glycerol Sigma-Aldrich, Germany Chloroform Lachner, Czech republic IPTG Sigma-Aldrich, Germany Isopropyl alcohol Penta, Czech Republic LB Agar Duchefa Biochemie, Netherlands LB Broth Duchefa Biochemie, Netherlands Magnesium chloride Sigma-Aldrich, Germany Magnesium chloride hexahydrate Sigma- Aldrich, Germany Methyl Alcohol Lachner, Czech republic MgSO4.7H2O Merck, Germany Morpholinoethanesulphonic acid (MES) Sigma-Aldrich, Germany Murashige and Skoog Basal salt mixture Sigma-Aldrich, Germany Myo-inositol Sigma-Aldrich, Germany N,N´-dimethylformamide Sigma-Aldrich, Germany Nicotinic acid Duchefa Biochemie, Netherlands Nitro blue tetrazolium chloride (NBT) Sigma-Aldrich, Germany Nonidet P-40 Sigma, Germany Orange G Sigma-Aldrich, Germany Peptone from Casein Sigma-Aldrich, Germany Ponceau S Sigma-Aldrich, Germany Pyridoxin Duchefa Biochemie, Netherlands SAVO Bochemie, Czech republic Silwet L-77 Lehle seeds, USA Sodium dodecyl sulphate (SDS) Duchefa Biochemie, Netherlands Sucrose grade II Sigma-Aldrich, Germany Thiamine Duchefa Biochemie, Netherlands Trichloracetic acid (TCA) Merck, Germany Tris ultrapure Duchefa Biochemie, Netherlands Tween 20 Serva, Germany Yeast extract Sigma-Aldrich, Germany
33
3.1.6. Commercial kits for molecular biology
2D Quant Kit (GE Healthcare, USA): determination of protein concentration GeneJet Plasmid Miniprep Kit (Fermentas, UK): isolation of plasmid DNA from bacteria ImProm-II™ Reverse Transcription System (Promega, USA): RT-PCR NucleoSpin Extract II (Machery-Nagel, Germany): extraction DNA from a gel pCR®8/GW/TOPO® TA Cloning® Kit (Invitrogen, USA): TOPO® Cloning pENTR™⁄D-TOPO® Cloning Kit (Invitrogen, USA): TOPO® Cloning RNeasy Plant Mini Kit (Qiagen,Valencia, CA): RNA isolation
3.2. GENERAL LABORATORY EQUIPMENT USED
Centrifuge 5430 R Eppendorf, Germany Centrifuge MiniSpin plus Eppendorf, Germany Documentation system G:Box Syngene, UK E-centrifuge Wealtec,USA Elecroporator E.coli pulser nodel 1652102 Bio-Rad, USA Incubator and Shaker Edmund Büchler GmbH., Germany Incubator INP 200 Memmert, Germany Incubator StabilithermTM, USA Master Cycler Gradient Eppendorf, Germany NanoDrop 1000 Spectrophotometer Thermo scientific, USA pH metr InoLab WTW, Germany Power pack 3000 Bio-Rad, USA Refrigerated Incubator FTC 90I Velp Scientifica, Italy ShockPodTM Cuvette Chamber Bio-Rad, USA Spectrophotometer Thermo electron, USA Standard Power Pack P 25 Biometra, Germany Thermomixer Comfort Eppendorf, Germany Thermoblock Cooling&Heating Block Bioer, China Ultracentrifuge Beckman L8-70M Beckman, USA Vortex Classic Velp Scientifica, Italy Water Bath GFL 1002 Scientific Instrument Centre, UK Water Shaker GFL 1092 Scientific Instrument Centre, UK Xp cycler Bioer, China 3.3. COMPUTATIONAL PROGRAMMES AND DATABASES � Sequence source: National Center for Biotechnology Information (http://www.ncbi.nlm.nih.gov/) The CYP P450 Engineering Database (http://www.cyped.uni-stuttgart.de/) � Sequence analysis and in vitro cloning: Vector NTI Suite 9.0.0 (Invitrogen, USA) Sequence Manipulation Suite (http://www.bioinformatics.org/sms2/) Chromas Lite 2.01 (http://www.technelysium.com.au/chromas.html)

34
3.4. METHODS AND PROCEDURES 3.4.1. Outline of our approach
A. To identify isoflavone synthase genes in the chosen non-leguminous plants
(see Tab. 3.1.), a procedure based on a PCR strategy was devised (see Fig. 1). After the
collection of the plant material, DNA was extracted; PCR with degenerate and non-
degenerate primers was carried out; fragments so obtained were excised from the
agarose gel; in the case of degenerate primers, the fragments were cloned into the
pGEM®-T Easy vector; finally, sequencing and sequence analysis was performed.
B. To conduct a pilot study with IFS (CYP93C18) from Pisum sativum L., IFS
was first identified with the CYP93C18-specific primers; the gene was then cloned
using GatewayTM technology, which was followed by the transformation of Arabidopsis
(Col-0) via Agrobacterium and the subsequent over-expression of IFS under 35S
promoter; the correct expression of IFS was verified at four levels (see Fig. 2). The
same procedure with a different destination vector was undertaken in order to visualize
the intracellular localization of IFS in vivo.
Fig. 3.1. Strategy for non-leguminous plants.
Fig. 3.2. Strategy for pilot study with IFS from Pisum sativum L. (CYP93C18).

35
3.4.2. Genomic DNA extraction
Genomic DNA from 100 mg of young leaves from plants specified in 2.1.1. and
from 100 mg of pulverized embryos of Pachyrhizus tuberozus (Lam.) Spreng. was
extracted following the standard CTAB DNA extraction protocol (adapted from Weigel
and Glazebrook, 2002). Plant material was placed in the Eppendorf tubes and frozen
immediately in liquid nitrogen. The tissue was homogenised by intensive shaking with
glass beads using Silamat S5 (Vivadent, Lichtenstein) or by grinding using frozen
mortar and pestle. It was then dissolved in 250 µl of the CTAB extraction buffer and
incubated at room temperature for 20 min. Further, 250 µl of a mixture of chloroform
with isoamyl alcohol (24:1) was added, and the two phases – aqueous and organic –
were subsequently separated by centrifugation for 10 min at 13 000 rcf. The upper
aqueous phase was transferred into a new microcentrifuge tube containing 140 µl of
isopropanol and spun down for 7 min at 13000 rcf. The supernatant was discarded, the
pellet was washed with 1 ml of 70% ethanol and centrifuged for an additional 7
minutes. Ethanol was then removed by means of a water vacuum pump and its residues
were made to evaporate in a thermostat at 55°C. The dried pellet was dissolved in 50 µl
of double distilled H2O and incubated for 5 min at 55°C. The final concentration of thr
extracted DNA was measured by means of a spectrophotometer (Nanodrop), and
samples were stored at -20°C.
CTAB extraction buffer: 1.4M NaCl, 20 mM EDTA, 100 mM Tris (pH 8), 3% CTAB
3.4.3. Identification of isoflavone synthase gene (IFS)
3.4.3.1. Primers design
(1) Pisum sativum L .: CYP93C18-specific primers (Fig. 3) were designed on the basis
of the CYP93C18 sequence (Cooper et al., 2005) from the GenBank (NCBI). The
expected lenght of the sequence was slightly greater than 1575 bp.
Forward : 5´- CACCATGTTGGTTGAACTTGCACTTGCTT-3´ (CACC for TOPO® cloning) Reverse 1: 5´- TTAAGAGGAAAGCAATTTAGCTGCT-3´ (used for stable expression) Reverse 2: 5´- TGCAGAGGAAAGCAATTTAGCTGCT-3´ (stop codon TAA replaced by GCA coding alanine; used for transient expression)
36
(2) Phaseolus vulgaris L. and Pachyrhizus tuberosus (Lam.) Spreng.: Consensual
primers were designed on the basis of multiple alignment of 30 known IFS sequences
(primers constitute the first and last 26 nucleotides of IFS).
Forward : 5´-ATGTTGCTGGAACTTGCACTTGGTTT-3´ Reverse: 5´-TTAAGAAAGGAGTTTAGATGCAACGC-3´ (3) All the non-leguminous species: Degenerate primers and their non-degenerate
(consensual) versions were designed through a CODEHOP algorithm on the basis of
highly conservative regions (Fig. 3.4.). The expected lenght of the fragments to be
obtained was ca. 1000 bp.
Forward : 5´- YGAYCCTRTCRTTGAAAGGGTCATCAAGAA-3´ Reverse: 5´- RAKWAKWGATGMAAGAAGTGTTGCCATTCC-3´
All the primers were synthetised by Sigma-Aldrich (Germany) or Genery Biotech
(Czech Republic) and diluted in ddH2O to achieve a concentration of 100 mM.
3.4.3.2. Polymerase chain reaction (PCR)
To identify IFS in the chosen plant species, PCR was carried out in each case
with the respective primers and Taq DNA polymerase (Merci, Czech Republic). In the
case of CYP93C18, Phusion high fidelity DNA polymerase (Finnzymes, Finland) was
used for the gene identification and amplification, as it produces blunt-end PCR
products and its error rate is 50-fold lower than that of Taq polymerase. The optimal
annealing temperatures of the primers were determined experimentally, using a wide
gradient of temperatures.
Fig. 3.3. CYP93C18-specific primers employed (in – introne, ex – exone).
Fig. 3.4. Forward and reverse degenerate and non-degenetare primers employed (for clarity shown for the example of CYP93C18; in – introne, ex – exone).

37
The PCR mixtures consisted of:
TAQ DNA POLYMERASE PHUSION HIGH FIDELITY DNA POLYMERASE
Component Volume Component Volume
10x Taq polymerase Buffer 2.5 µl 5x Phusion HF Buffer 5 µl MgCl2 (5 mM) 1 µl MgCl2 (5 mM) 1 µl dNTP mix (10 mM) 0.5 µl dNTP mix (10 mM) 0.5 µl Primer F (20 mM) 1 µl Primer F (20 mM) 1 µl Primer R (20 mM) 1 µl Primer R (20 mM) 1 µl DNA template (ca. 100 ng/µL) 1 µl DNA template (ca. 100 ng/µL) 1 µl
Taq DNA polymerase 0.25 µl Phusion DNA polymerase 0.3 µl ddH2O 17.75 µl ddH2O 15.2 µl
Final volume 25 µl Final volume 25 µl
The reaction mixtures were distributed from premix to the wells on the PCR plate,
covered by aluminium sealing foil and placed into the PCR thermocycler.
The PCR conditions were as follows:
TAQ DNA POLYMERASE PHUSION DNA POLYMERASE
Step Conditions Conditions
Initial denaturation 94°C/7 min 98°C/30 s
Denaturation 94°C/30 s 98°C/10s
Annealing* gradient of 50-65°C/30s 58°C + 3°C/30s
Extension 72°C/1 min 72°C/40s
Final extension 72°C/10 min 72°C/10 min
* For the purposes of verification of the presence of CYP93C18 during the cloning
process, in transformed Arabidopsis, and in the case of RT-PCR, the amplification of
the gene was accomplished by Taq DNA polymerase at the determined optimal
annealing temperature of 58.3°C and a time of extension 1.5 min.
3.4.3.3. Horizontal agarose gel electrophoresis
Agarose gel electrophoresis was used in order to separate and visualize PCR
products after reaction and for the excision and isolation of fragments/genes of the
desired length from the gel. 1% agarose gel was boiled in a microwave and once it was
cooled to 55°C, ethidium bromide was added to a final concentration 0.1 µg/ml. After
solidification in a casting tray with a comb, the gel was submerged in 1x TAE buffer,
and PCR mixtures with a loading buffer (12% v/v), and a molecular marker were loaded
into the wells. The voltage applied was 80V or 110 V, depending on the size of the
electrophoretic apparatus. After ca. 45 min, the gel was visualized by UV
35 cycles
38
transiluminator and photographed using the documentation system G:Box (Syngene).
All PCR products of interest were excised from the gel and purified by means of the
NucleoSpin Extract II kit, according to its manual.
50x TAE: 24.2% (w/v) Tris, 10% (v/v), 0.5 M EDTA (pH 8), 5.7% (v/v) CH3COOH
Agarose gel: 1% (w/v) agarose diluted in 1x TAE buffer with 10 µg/ml ethidium
bromide
Loading buffer for ELFO: 0.7% (w/v) Orange G, 0.14 M EDTA (pH 8), 60% (v/v)
glycerol
DNA molecular marker: 1 µl GeneRuler™ 1 kb and 100 bp DNA Ladder (Fermentas,
USA) mixed with 1 µl loading buffer and dissolved in 4 µl ddH2O
3.4.3.4. DNA sequencing
All sequentional analyses of obtained PCR products were performed in the service
Laboratory of DNA Sequencing, Faculty of Science, Charles University in Prague.
3.4.4. Cloning of fragments obtained with degenerate primers
As the amplification using degenerate primers usually yields multiple PCR
products, false priming is commonly observed when the obtained fragments are directly
sequenced (Williams and Kane, 1993). Therefore, such fragments must be cloned into
an appropriate vector and sequenced with a suitable pair of primers specific to the
vector. In the case of examined non-leguminous species where PCR product were
obtained with degenerate primers only, the fragments were cloned using pGEM®-T
Easy Vector System (Promega, USA; see Fig. 5).
Reaction mixture
Reaction mixture
Fig. 3.5. pGEM®-T Easy Vector with the insertional site within the lacZ gene, providing blue-white selection of transformants (adapted from Promega´s manual).
39
Component Volume
PCR product 3.5 µl
2x Rapid Ligation Buffer 5 µl
pGEM-T Easy Vector (50 ng) 0.5 µl
T4 DNA Ligase 1 µl
Final volume 10 µl
The reaction mixture was incubated overnight at 4°C.
Transformation of competent cells
Chemical transformation of competent cells was performed. 25 µl of One Shot®
TOP10 were added to 2 µl of the reaction mixture and incubated for 30 min on ice. The
cells were then heat shocked for 45 s at 42°C and immediately plunged into ice. Two
minutes later, 200 µl of S.O.C. medium were added and the tubes were shaken
horizontally at 250 rpm for 1 hour at 37°C. The cells were subsequently spread over the
selective plate with LB agar, which contained 100 µg/ml ampicilin and over whose
surface 100 µL IPTG and 20 µL X-Gal (for blue-white selection) had been smeared.
The plates were incubated overnight at 37°C. Tens of white and blue colonies appeared.
Some of the white colonies (correctly transformed) were examined by Colony PCR with
the degenerate primers and pGEM-T Easy Vector-specific F (5´-TTTCACACAGGAA-
ACAGCTATGA-3´) and R (5´- ACGGCCAGTGAATTGTAATACG-3´) primers was
carried out. The PCR mixture and conditions were the same as those indicated above,
with the following exceptions: the DNA template was the trace of the colony, and initial
denaturation and denaturation steps were performed at 96°C. The succesfully
transformed colonies were inoculated into 5 ml LB broth containing 100 µg/ml
ampicilin and shaken (250 rpm) at 37°C overnight. The plasmides were isolated by
means of the GeneJet Plasmid Miniprep Kit according to the manufacturer´s
instructions, quantified and sequenced with vector specific primers.
IPTG stock solution (0.1M): 1.2 g IPTG in 50 ml ddH2O; stored at 4°C
X-Gal: 100 mg in 2 ml N,N´-dimethylformamide; stored at -20°C covered with
aluminium foil

40
3.4.5. Cloning of putative IFS genes from Phaseolus vulgaris and Pachyrhizus tuberosus
These two leguminous species were originally used as positive controls during
the identification of IFS in the chosen non-leguminous species. However, the IFS
sequences of the both plants have not been yet identified. The PCR products obtained
with consensual primers and Taq DNA polymerase* were therefore cloned, in order to
get the complete genes upon sequencing. As the outcome of the cloning procedure tends
to be somewhat unpredictable, the PCR product from Pachyrhizus was succesfully
cloned into pGEM-T Easy Vector, using the same protocol described above, whereas
the cloning of those from Phaseolus failed repeatedly. For this reason,
pCR8®/GW/TOPO® (Fig. 3.6.) was chosen for TA cloning of the PCR product from
Phaseolus.
Reaction mixture Component Volume
PCR product excised from gel 1 µl Salt solution provided within the kit 0.5 µl pCR8®/GW/TOPO® provided within the kit 0.5 µl
ddH2O 1 µl
Final volume 3 µl
The reaction mixture was incubated at room temperature for 10 min.
* Our effort to clone the gene produced by Phusion proofreading polymerase failed persistently, in contrast with those when Taq polymerase was used. In these circumstances we had to make do with the PCR products amplified by the latter. As this polymerase produces A-overhangs of the amplicons, TA cloning had to be carried out.
Fig. 3.6. pCR8®/GW/TOPO®
Vector appropriate for TA cloning (adapted from Invitrogen´s manual).
the selection marker used was antibiotic spectinomycin (100 µg/ml); neither IPTG nor
X-Gal were applied; the primers used for control PCR and sequencing were TOPO®
vector-specific M13 F (5´-GTAAAACGACGGCCAGT-3´) and R primers (5´-
AACAGCTATGACCATG-3´).
All the subsequent tranformational steps
were identical to those described in section
3.4.4. with the following exceptions:

3.4.6. Cloning and overTechnology
GatewayTM
Invitrogen, USA) is a
expression. It comprises three main succes
(1) TOPO® cloning of the PCR product into
(2) LR recombination between the
expression clone.
(3) Introduction of the expession clone into the appropriate host and expression of the
recombinant protein.
3.4.6.1. Directional TOPO
Full-length and stop
between positions 903 and 991
(InvitrogenTM, USA).
complemetary to GTGG overhang in the
blunt 3´end.
The TOPO® cloning reaction
Fig. 3.7. TOPO
41
. Cloning and over-expression of CYP93C18
Technology (U.S. Patent 5,888,732, Life Technologies Inc.
is a universal methodology for cloning PCR products and protein
expression. It comprises three main successive steps:
cloning of the PCR product into an entry vector, to generate an
(2) LR recombination between the entry clone and destination vector
(3) Introduction of the expession clone into the appropriate host and expression of the
.1. Directional TOPO® cloning of CYP93C18
length and stop-codon-missing CYP93C18 (both includ
between positions 903 and 991) were cloned into the entry vector
, USA). Both sequences carried four extra nucleotides CACC at the 5´end
complemetary to GTGG overhang in the pENTRTM/D-TOPO®
cloning reaction was performed according to the kit manual
TOPO® cloning principle (adapted from product manual).
using GatewayTM
U.S. Patent 5,888,732, Life Technologies Inc.,
universal methodology for cloning PCR products and protein
to generate an entry clone.
entry clone and destination vector, to generate an
(3) Introduction of the expession clone into the appropriate host and expression of the
(both including intron
) were cloned into the entry vector pENTRTM/D-TOPO®
Both sequences carried four extra nucleotides CACC at the 5´end
(Fig. 3.7.) and had a
kit manual, as follows:
principle (adapted from product manual).
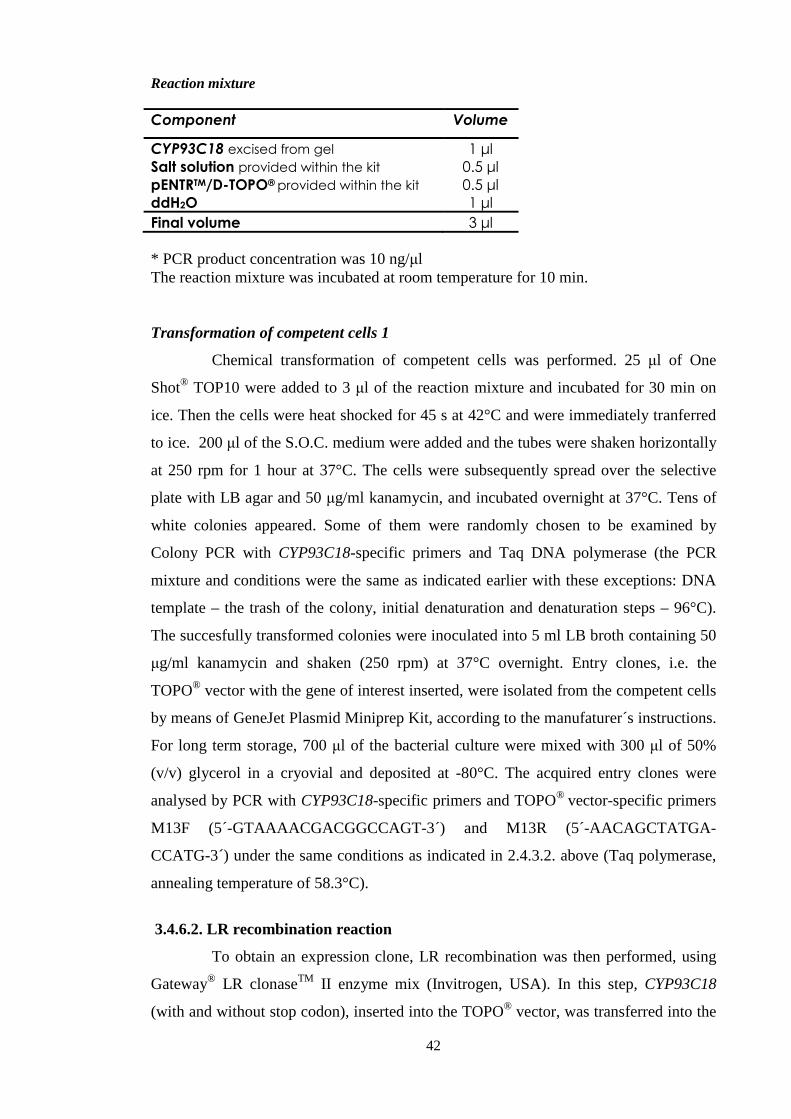
42
Reaction mixture Component Volume
CYP93C18 excised from gel 1 µl Salt solution provided within the kit 0.5 µl pENTRTM/D-TOPO® provided within the kit 0.5 µl ddH2O 1 µl
Final volume 3 µl
* PCR product concentration was 10 ng/µl The reaction mixture was incubated at room temperature for 10 min.
Transformation of competent cells 1
Chemical transformation of competent cells was performed. 25 µl of One
Shot® TOP10 were added to 3 µl of the reaction mixture and incubated for 30 min on
ice. Then the cells were heat shocked for 45 s at 42°C and were immediately tranferred
to ice. 200 µl of the S.O.C. medium were added and the tubes were shaken horizontally
at 250 rpm for 1 hour at 37°C. The cells were subsequently spread over the selective
plate with LB agar and 50 µg/ml kanamycin, and incubated overnight at 37°C. Tens of
white colonies appeared. Some of them were randomly chosen to be examined by
Colony PCR with CYP93C18-specific primers and Taq DNA polymerase (the PCR
mixture and conditions were the same as indicated earlier with these exceptions: DNA
template – the trash of the colony, initial denaturation and denaturation steps – 96°C).
The succesfully transformed colonies were inoculated into 5 ml LB broth containing 50
µg/ml kanamycin and shaken (250 rpm) at 37°C overnight. Entry clones, i.e. the
TOPO® vector with the gene of interest inserted, were isolated from the competent cells
by means of GeneJet Plasmid Miniprep Kit, according to the manufaturer´s instructions.
For long term storage, 700 µl of the bacterial culture were mixed with 300 µl of 50%
(v/v) glycerol in a cryovial and deposited at -80°C. The acquired entry clones were
analysed by PCR with CYP93C18-specific primers and TOPO® vector-specific primers
M13F (5´-GTAAAACGACGGCCAGT-3´) and M13R (5´-AACAGCTATGA-
CCATG-3´) under the same conditions as indicated in 2.4.3.2. above (Taq polymerase,
annealing temperature of 58.3°C).
3.4.6.2. LR recombination reaction
To obtain an expression clone, LR recombination was then performed, using
Gateway® LR clonaseTM II enzyme mix (Invitrogen, USA). In this step, CYP93C18
(with and without stop codon), inserted into the TOPO® vector, was transferred into the
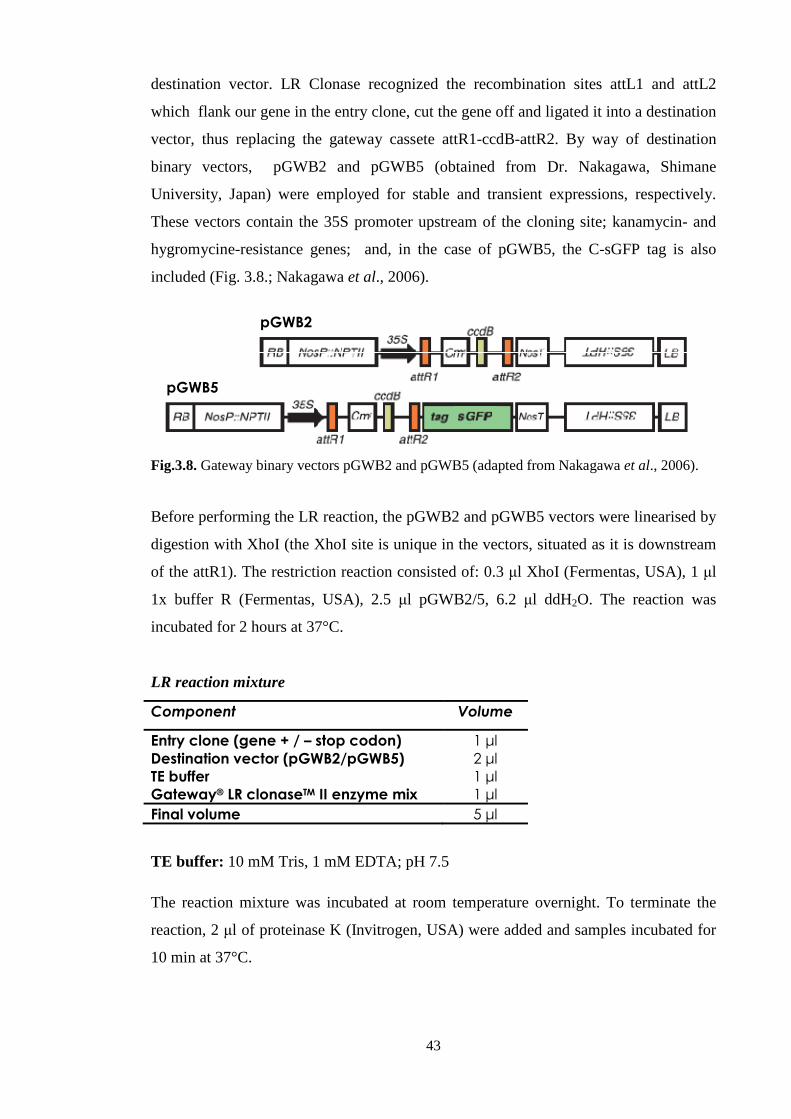
43
destination vector. LR Clonase recognized the recombination sites attL1 and attL2
which flank our gene in the entry clone, cut the gene off and ligated it into a destination
vector, thus replacing the gateway cassete attR1-ccdB-attR2. By way of destination
binary vectors, pGWB2 and pGWB5 (obtained from Dr. Nakagawa, Shimane
University, Japan) were employed for stable and transient expressions, respectively.
These vectors contain the 35S promoter upstream of the cloning site; kanamycin- and
hygromycine-resistance genes; and, in the case of pGWB5, the C-sGFP tag is also
included (Fig. 3.8.; Nakagawa et al., 2006).
Fig.3.8. Gateway binary vectors pGWB2 and pGWB5 (adapted from Nakagawa et al., 2006).
Before performing the LR reaction, the pGWB2 and pGWB5 vectors were linearised by
digestion with XhoI (the XhoI site is unique in the vectors, situated as it is downstream
of the attR1). The restriction reaction consisted of: 0.3 µl XhoI (Fermentas, USA), 1 µl
1x buffer R (Fermentas, USA), 2.5 µl pGWB2/5, 6.2 µl ddH2O. The reaction was
incubated for 2 hours at 37°C.
LR reaction mixture
Component Volume
Entry clone (gene + / – stop codon) 1 µl Destination vector (pGWB2/pGWB5) 2 µl TE buffer 1 µl Gateway® LR clonaseTM II enzyme mix 1 µl
Final volume 5 µl
TE buffer: 10 mM Tris, 1 mM EDTA; pH 7.5
The reaction mixture was incubated at room temperature overnight. To terminate the
reaction, 2 µl of proteinase K (Invitrogen, USA) were added and samples incubated for
10 min at 37°C.
pGWB5
pGWB2
44
Transformation of competent cells 2
Chemical transformation of competent cells was performed. 25 µl of Alpha-
Select Gold Efficiency were added to 5 µl of the reaction mixture. The procedure
(including long-term storage) continued as already described under Transformation 1
above, except for the fact that LB plates and subsequently LB broth contained 50 µg/ml
kanamycin and 50 µg/ml hygromycin, as selection markers. Both of the acquired
expression clones were analysed by PCR with CYP93C18-specific primers and pGWB
vectors specific primers pGWBF and (5´-TCATTTCATTTGGAGAGAACACG -3´)
and pGWBR (5´-CCACTTTGTACAAGAAAGCTGG-3´), under the same conditions
as indicated in 2.4.3.2. above (Taq polymerase, annealing temperature of 58°C).
3.4.6.3. Transformation of Agrobacterium tumaefaciens
The expression clones obtained were introduced into Agrobacterium
tumaefaciens strain GV3101 by electroporation. 1 µl of pGWB2::IFS and pGWB5::IFS
was mixed with 50 µl of Agrobacterium in the sterile electroporation cuvette. This was
then placed in an electroporator and a voltage of 2.5 V was applied. 800 µl of LB broth
were added immediately, in each case the solution was transferred to a 1.5 ml
microcentrifuge tube and incubated for 2 hours at 28°C. 200 µl cultures were spread on
YEB-plates containing 50 µg/ml kanamycin, 50 µg/ml hygromycin, 50 µg/ml
gentamycin and 100 µg/ml rifampicin and incubated overnight at 28°C, covered in
aluminium foil. The following day, Colony PCR was performed (under conditions
specified in 2.4.4.1 above). For long-term storage, 700 µl of the Agrobacterium culture
in YEB medium containing the above-mentioned antibiotics were mixed with 300 µl of
50% (v/v) glycerol in a cryovial, and deposited at -80°C.
3.4.7. The stable expression of CYP93C18
3.4.7.1. Transformation of Arabidopsis thaliana
To obtain stably transformed Arabidopsis over-expressing CYP93C18,
expression clones pGWB2::IFS were introduced via transformed Agrobacterium into
flower buds of Arabidopsis plants, using the floral dip method (Clough and Bent, 1998).
A colony of Agrobacterium with a verified presence of CYP93C18 was inoculated into
150 µl of YEB medium containing 50 µg/ml kanamycin, 50 µg /ml hygromycin, 50
µg/ml gentamycin and 100 µg/ml rifampicin, and shaken overnight at 28°C. The culture
was then centrifuged in Beckman tubes (250 ml) for 20 min at 4,500 rpm at 4°C in the

45
Beckman centrifuge. Pelleted cells were resuspended in a mixture of sucrose (10% w/v)
and Silwet L-77 (0.05% v/v) to reach OD600 = from 1.0 to 1.5 (measured by
spectrophotometer Thermo electron). In 200 µl of the resulting solution, flower buds of
ca. 8 Arabidopsis plants were dipped for several seconds with gentle agitation. The
dipped plants were covered in plastic bags and placed in the dark overnight. The
following day, the plants were transferred into a growth chamber. The procedure was
repeated with the same plants five days later.
3.4.7.2. Selection of transformants
2-3 weeks after transformation, seeds of the transformed plants were harvested
and sterilized. The sterilization procedure comprised the following steps: (1) placing the
seeds in the freezer overnight, (2) shaking the seeds in 70% ethanol for 5 min, (3)
discarding the supernantant and shaking the seeds in 10% (v/v) SAVO with 0.1% (v/v)
nonidet for 20 min, (4) discarding the supernatant and washing the seeds 5 times in
ddH2O. Ca. 2000 of the sterilized seeds were selected on MS-plates with 50 µg/ml
hygromycin and cultivated at 21°C with a 16-hour photoperiod . The surviving four-leaf
seedlings were transferred into Jiffy peat pots (Smurfit, Finland), grown at 21°C with a
16-hour photoperiod and later analysed. The same selection procedure was repeated
over 3 generations to obtain homozygous transformants.
3.4.7.3. Analysis of transgenic Arabidopsis thaliana
At all the analytical levels described bellow, the same procedures were also
carried out with Pisum sativum L. and with wild-type Arabidopsis, as positive and
negative controls, respectively.
3.4.7.3.1. Level 1: DNA
DNA was extracted from 100 mg of leaves of 10 T1, 20 T2 and T3 randomly-
selected transformants, as described in 2.4.2 above, and control PCR with CYP93C18-
specific primers and Taq polymerase under standard conditions was carried out.
3.4.7.3.2. Level 2: RNA
Total RNA was extracted from 100 mg of leaves of individual plants in which
the presence of IFS was verified, using RNeasy Plant Mini Kit (Qiagen,Valencia, CA).
The RNA concentration was measured by the use of Nanodrop. RT-PCR was then

46
performed, using the ImProm-II™ Reverse Transcription System (Promega, USA),
according to the manufacturer´s instructions. The denaturation reaction mixture
consisted of RNA (up to 1 µg/reaction), 1 µl oligo (dT)15 and nuclease-free water, to
achieve a final volume of 5 µl. This mixture was incubated at 70 °C for 5 min,
immediately chilled on ice (for 10 min) and added to the RT-PCR reaction.
RT-PCR reaction mixture
Component Volume
5x ImProm-II™ 5x reaction buffer 4 µl MgCl2 4 µl dNTP mix 1 µl Recombinant Rnasin® Ribonuclese inhibitor 1 µl ImProm-II™ Reverse Transcriptase 1 µl Nuclease-Free H2O 4 µl
Final volume 15 µl
RT-PCR reaction
Step Conditions
Annealing 25°C/5 min
Extension 42°C/1 hour
Inactivation 70°C/15 min
The final PCR amplification was carried out with CYP93C18-specific primers and Taq
polymerase under standard conditions (as defined above). In the case of Pisum, RT-
PCR with RNA from leaves, roots, embryos, seeds and pods was also performed, to
control expression in different organs.
3.4.7.3.3. Level 3: Proteins
Protein Extraction. Total protein was first extracted in accordance with the procedure
due to Wang et al. (2006), from 100 mg of leaves from confirmed IFS transgenic
Arabidospis. In brief, (1) plant material was grinded in a mortar and pestle, (2) washed
with 10% TCA/acetone, (3) washed with 80% methanol with 0.1 M ammonium acetate,
(4) washed with 80% acetone, (5) air-dried overnight, (5) proteins were extracted using
1:1 phenol (pH 8)/SDS buffer and precipitated in 80% methanol with 0.1 M ammonium
acetate, (6) the pellet was washed in 100 % methanol and (7) in 80% acetone and (8)
air-dried overnight. The extracted proteins were quantifed using the 2-D Quant kit,
according to the manufacturer´s protocol.
47
SDS buffer: 30% (w/v) succrose, 2% (w/v) SDS, 1.21 % (w/v) TRIS, 5% (v/v)
mercaptoethanol
Protein Separation. The extracted proteins were separated using 1-D SDS-PAGE.
Samples were dissolved with STM sample buffer, stained with bromphenol blue and
denaturated by boiling for 5 min. SDS-PAGE was then performed in 10% resolving and
4% stacking gels, using the Multigel-Long apparatus (Biometra, Germany). A voltage
of 80 V was applied for 1 hour (Bio-Rad Power pack 3000), and 180 V were then
applied for a further 4 hours or so at 12.5°C.
STM sample buffer: 2% (w/v) SDS, 6% (w/v) TRIS (pH 6.8), 0.1% (v/v) glycerol, 5%
(v/v) mercaptoethanol
SDS-PAGE Molecular Weight Standards, Broad Range (Bio-Rad, USA).
Western Blotting and Immunodetection. The separated proteins were tranferred onto
a nitrocellulose membrane (Serva, Germany) using the Bio-Rad Mini Trans-Blot® Cell.
The transfer was conducted at a temperature of 4°C, inicially overnight under a voltage
of 30 V and at 60 V for an ensuing hour. The nitrocellulose membranes were then
reversibly stained with Ponceau S to control the tranfer. For subsequent
immunodetection, a peptide sequence derived from an extremely conservative region of
IFS was used, to prepare an IFS-specific antibody, and its epitop surface localization
was confirmed by means of protein modelling in Modeller9v5 (Šali and Blundell,
1993). The peptide NH2-DPKYWKRPLEFRPER (according to Yu et al., 2000),
conjugated with KLH (Davids biotechnologie, Regensburg), was then used for the
immunization of a rabbit (Department of Biological Control, Institute of Physiology AS
CR, Prague), according to their immunization schedule. Immunodetection was
performed with total proteins on the nitrocellulose membranes and with IFS antibodies,
30 days after immunization. The primary antibody was diluted 1:200 in the case of the
transgenic Arabidospis and 1:1000 in the case of wild-type Arabidopsis and Pisum, in a
TBST buffer with 5% non-fat dry milk; the secondary Anti-rabbit Goat IgG, conjugated
to alkaline phosphatase (Sigma-Aldrich, Germany), was used in dilutions 1:30,000 in a
TBST buffer with 1% BSA. Detection of IFS was carried out by submerging the
nitrocellulose membrane (Serva, Germany) in an AP buffer with 0.37 mM BCIP a 0.37
mM NBT, and blue-coloured bands were observed after the membrane dried.

48
Ponceau S: 2% (w/v) Ponceau S dissolved in 3% (v/v) TCA
TBST buffer: 0.242% (w/v) TRIS, 0.8% (w/v) NaCl, 0.05% (w/v) Tween 20
AP buffer: 1.211% (w/v) TRIS, 0.584 (w/v) NaCl, 0.101 %(w/v) MgCl2 .6 H2O
3.4.7.3.4. Level 4: Metabolites
Measurements were carried out by Ing. Petra Mikšátková at the Department of
Chemistry of Natural Compounds at the Institute of Chemical Technology in Prague.
Lyophilised shoots and dried seeds were ground. 0.4 g of the plant material,
together with 8 ml of 80% EtOH, were left for 14 days at room temperature, with
occasional agitation. The extracts were then centrifuged and filtered through a 17 mm,
0.45 µm PTFE syringe filter. 2.5 ml of extracts were dried and then dissolved in 0.3 ml
of 40% MeOH, for HPLC-ESI-MS analysis. The HPLC-MS tandem consisted of a
Hewlett Packard (HP/Agilent Technologies, USA) 1100 HPLC series and a HP Mass
selective detector (G1946A), and was controlled by means of ChemStation software
(revision A 07.01). A LiChroCART® 125-4 mm HPLC-Cartridge with Prospher® STAR
RP-18 endcaped (5 µm), was used as a column (Merck, Germany). Mobile phases were
40% methanol (solvent A) and 100% methanol (solvent B), both with 0.5% acetic acid.
The following gradient was employed (all steps linear): 0 min, 100:0 (A:B); 5 min,
80:20; 15 min, 55:45; 20 min 0:100; 23 min, 0:100; 27 min, 100:00 and at 27 min stop
followed by 3 min post-run. The flow-rate was 0.8 ml/min, the temperature of the
column thermostat was set at 25°C and the injection volume was 20 µl. The mass
spectrometer was operating in the positive ESI mode. Individual isoflavones were
identified by comparing their retention times (tR) and molecular ions [M+H]+ with those
of standards.
3.4.8. The transient expression of CYP93C18
3.4.8.1. Tranformation of Nicotiana benthamiana
In order to secure transient expression and to visualize IFS subcellular
compartmentalization, pGWB5::CYP93C18 was infused into the leaves of Nicotiana
benthamiana through infiltration by syringe injection with the inoculum of transformed
Agrobacterium (Jian-Feng et al., 2009). Briefly, the transformed Agrobacterium was
inoculated into 5 ml YEB medium with appropriate antibiotics (see 2.4.4.3) and shaken
at 28 °C overnight. The cultures were then spun down at 8000 rpm for 5 min. Pelleted
cells were resuspended with 1 ml infiltration medium and centrifuged. The pellet was

49
resuspended in the infiltration medium to OD600 0.1 and incubated for 1.5 hour in the
dark at room temperature. The lower epidermis of young leaves of Nicotiana
benthamiana was gently grazed by a sterile needle, and Agrobacterium solution (500 µl
per one leave) was injected by a syringe into the leaves. The transformed plants spent
one night in the dark at room temperature and the following day were moved to a
growth chamber. As a positive control, Agrobacterium strain C58C1 carrying the pBIN m-
gfp5-ER plant binary vector (transformed culture obtained from Dr. Jan Petrášek, IEB
ASCR), was used. It codes for the ER-localized GFP variant mGFP5-ER, a
thermotolerant derivative of mGFP4-ER (Haseloff et al., 1997), and contains a C-
terminal ER retention signal sequence (HDEL); as a negative control, Agrobacterium
strain GV3101 carrying pGWG5 without any insert (expression of free sGFP), was
employed. Both of the aforementioned control proteins were transiently expressed in
Nicotiana leaves, using the same protocol.
Infiltration medium : 10 mM MES, 10 mM MgCl2, 200 µM acetosyringon (200 mM
stock solution in DMSO)
3.4.8.2. Analysis of transgenic Nicotiana bethamiana
Nicotiana plants were analysed 2-3 days after the transformation. The spots on
the Nicotiana leaves where the Agrobacterium injection was applied, were excised and
subjected to immediate observation by means of confocal laser scanning microscopy
(LSM Zeiss 5 Duo, Germany), using the confocal microscope with the 488 nm laser line
of the ArKr laser.
3.4.9. Modelling of CYP93C18
The CYP93C18 protein structure was modelled in collaboration with Ing. Roman
Pleskot from the Institute of Experimental Biology ASCR, Prague.
The appropriate templates for homology modelling of the CYP93C18 protein
structure were found using the Psipred threading algorithm (Bryson et al., 2005). The
three-dimensional model was then generated on the basis of the resulting alignment, by
means of Modeller9v5 (Eswar et al., 2006). The Adaptive Poisson-Boltzmann Solver
(APBS) was employed for the evaluation of the electrostatic properties of the modelled
structure (Baker et al., 2001). Molecular graphics images were produced using the
UCSF Chimera package, the University of California, SanFrancisco (Pettersen et al.,
2004).

50
4. RESULTS
4.1. Identification of isoflavone synthase genes (IFS)
On the basis of the extensive literature dealing with the detection of
isoflavonoids in various plant families, we selected 33 non-leguminous plant species
from 14 different families, from which 8 families are isoflavonoid producers and 6 are
not (Tab. 4.1.; non-producing families marked with an asterisk). Two control
leguminous plants whose IFS sequences are not in the GenBank as yet – Phaseolus
vulgaris L. and Pachyrhizus tuberozus (Lam.) Spreng – were also examined, with a
high probability of the presence of IFS.
4.1.1. Identification of IFS in the chosen non-leguminous species
To identify IFS orthologues, PCR was performed with degenerate primers,
which were designed on the basis of the most conservative region discovered by
multiple alignment of known IFS (see section 2.2.2.) and with the genomic DNA
extracted from chosen plants.
In 9 cases out of 33 plants examined, no PCR product was obtained, even
though numerous optimalizations were attempted (repeated DNA extraction, gradient of
annealing temperatures, various concentrations of PCR components etc.). In the
remaining cases, PCR products of different lengths appeared and were further
investigated (Tab. 4.1.).
However, the subsequent procedure leading to sequencing involved several
complications, ranging from failure during the cloning of the fragments into the
pGEM/T-Easy vector, to erroneous sequencing, with no sequence being obtained . In
those instances where cloning failed persistently (9 cases out of the remaining 24), the
fragment was sequenced with the non-degenerate version of the degenerate primers
originally used, once control PCR with those non-degenerate primers had been carried
out.
Regretably, a BLAST search (blastn suite 2.2.23+; Altschul et al., 1997)
undertaken after the obtained fragments were sequences, revealed that none of the PCR
products from non-leguminous species were homologous with IFS genes from
GeneBank. What is even more peculiar is the fact that more than half of the sequences
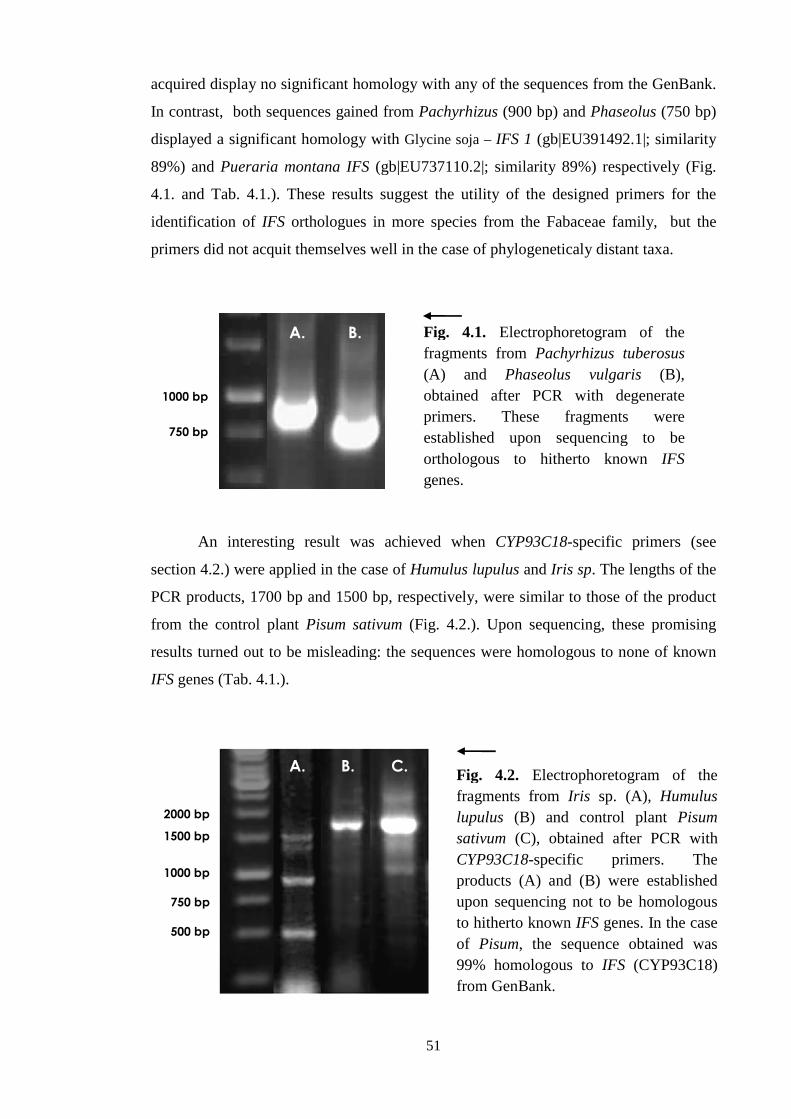
acquired display no significant homology with any of the sequences from the GenBank.
In contrast, both sequences gained from
displayed a significant homo
89%) and Pueraria montana IFS
4.1. and Tab. 4.1.).
identification of IFS
primers did not acquit themselves well in the case of phylogeneticaly distant taxa.
An interesting result was achieved when
section 4.2.) were applied
PCR products, 1700 bp and 1500 bp, respectively, were similar to those of the product
from the control plant
results turned out to b
IFS genes (Tab. 4.1.).
1000 bp
750 bp
2000 bp
1500 bp
1000 bp
750 bp
500 bp
51
acquired display no significant homology with any of the sequences from the GenBank.
both sequences gained from Pachyrhizus (900 bp) and
displayed a significant homology with Glycine soja – IFS 1 (gb|EU391492.1|; similarity
Pueraria montana IFS (gb|EU737110.2|; similarity 89%)
). These results suggest the utility of the designed primers for the
orthologues in more species from the Fabaceae family,
primers did not acquit themselves well in the case of phylogeneticaly distant taxa.
An interesting result was achieved when CYP93C18-
) were applied in the case of Humulus lupulus and Iris sp
PCR products, 1700 bp and 1500 bp, respectively, were similar to those of the product
from the control plant Pisum sativum (Fig. 4.2.). Upon sequencing, the
results turned out to be misleading: the sequences were homologous to none of known
).
A. B. Fig. 4.1. Electrophoretografragments from Pachyrhizus tuberosus(A) and Phaseolus vulgarisobtained after PCR with degenerate primers. These fragments were established upon sequencing to be orthologous to hitherto known genes.
A. B. C. Fig. 4.2. Electrophoretografragments from Iris lupulus (B) and control plant sativum (C), obtained after PCR with CYP93C18-specific primersproducts (A) and (B) were upon sequencing to hitherto known of Pisum, the sequence obtained was 99% homologous to from GenBank.
acquired display no significant homology with any of the sequences from the GenBank.
bp) and Phaseolus (750 bp)
|EU391492.1|; similarity
(gb|EU737110.2|; similarity 89%) respectively (Fig.
designed primers for the
ogues in more species from the Fabaceae family, but the
primers did not acquit themselves well in the case of phylogeneticaly distant taxa.
-specific primers (see
Iris sp. The lengths of the
PCR products, 1700 bp and 1500 bp, respectively, were similar to those of the product
). Upon sequencing, these promising
e misleading: the sequences were homologous to none of known
ectrophoretogram of the Pachyrhizus tuberosus
Phaseolus vulgaris (B), obtained after PCR with degenerate primers. These fragments were
sequencing to be hitherto known IFS
Electrophoretogram of the Iris sp. (A), Humulus
(B) and control plant Pisum (C), obtained after PCR with
specific primers. The d (B) were established not to be homologous
hitherto known IFS genes. In the case , the sequence obtained was
99% homologous to IFS (CYP93C18)

52
Plant family Plant species PCR product length pGEM cloning Sequencing/primers Blast search (% max. identities)
Annonaceae* Annona cherimolia 1000 bp Yes Yes/pGEM No similarity found
Annona muricata 800 bp Yes Yes/pGEM Liriodendron tulipifera chloroplast genome; 85%
Cannabaceae Cannabis sativa X X X X
Humulus lupulus 1000 bp No Yes/non-dege No similarity found
700 bp No Yes/non-dege Vitis vinifera contig VV79X002481.3; 69%
Ephedraceae* Ephedra sinica 750 bp No Yes/non-dege Nasturtium officinale chloroplast DNA; 76%
Erythroxylaceae Erythroxylon coca 1500 bp Yes Yes/pGEM No similarity found
1200 bp Yes Yes/pGEM Populus trichocarpa predicted protein; 75%
Chenopodiaceae Beta vulgaris 1000 bp Yes Yes/pGEM No sequence obtained
Iridaceae Iris sp. X X X X
Lamiaceae* Hyssopus officinalis 750 bp No Yes/non-dege Petunia integrifolia S-2 RNase and SLF2; 75%
Lamium album 1000 bp Yes Yes/pGEM No similarity found
Levandula angustifolia 1100 bp Yes Yes/pGEM No similarity found
800 bp Yes Yes/pGEM No similarity found
Menta piperita X X X X
Ocimum basilicum 900 bp Yes Yes/pGEM Solanum lycopersicum (chromosome 8); 72%
Origanum vulgare 600 bp Yes Yes/pGEM No similarity found
Pogostemon cablin 1800 bp Yes Yes/pGEM No similarity found
800 bp Yes Yes/pGEM No similarity found
550 bp Yes Yes/pGEM Arabidopsis lyrata clone SINE9 transposon; 96%
Rosmarinus officinalis 1500 bp Yes Yes/pGEM No similarity found
Salvia officinalis 1000 bp No Yes/non-dege Lotus japonicus (chromosome 4); 68%
Scutellaria baicaliensis 750 bp No Yes/non-dege No sequence obtained
Thymus serpyllum X X X X
Thymus vulgaris X X X X
Degenerate primers
Tab. 4.1. Table of chosen non-leguminous plants and control leguminous plants examined. Plant families not producing isoflavonoids are marked with an asterisk (*). The table continues on the next page.

53
Plant family Plant species PCR product length pGEM cloning Sequencing/primers Blast search (% max. identities)
Lauraceae* Persea americana 800 bp Yes Yes/pGEM No similarity found
Pedaliaceae* Sesamum indicum 1100 bp Yes Yes/pGEM Nicotiana tabacum mitochondrial DNA; 87%
Ranunculaceae* Heleborus niger X X X X
Rubiaceae Coffea arabica X X X X
Rutaceae Ruta graveolens 1500 bp No Yes/non-dege Helianthus petiolaris retrotransposon Ty3; 80%
Solanaceae Capsicum annuum 1000 bp Yes Yes/pGEM Solanum tuberosum (chromosome 11); 73%
Capsicum frutescens 1200 bp Yes Yes/pGEM No similarity found
Nicotiana rustica 1500 bp Yes Yes/pGEM Petunia integrifolia S-2 RNase and SLF2, 74%
700 bp Yes Yes/pGEM Solanum lycopersicum (chromosome 2); 68%
Physalis peruviana 1000 bp No Yes/non-dege No similarity found
Solanum lycopersicum 600 bp No Yes/non-dege Solanum lycopersicum (chromosome 8); 81%
Solanum muricatum X X X X
Solanum melongena 800 bp Yes Yes/pGEM No similarity found
Zygophyllaceae Tribulus terestris X X X X
Fabaceae Pachyzhizus tuberosus 900 bp No Yes/non-dege Glycine soja – Isoflavone synthase 1; 89%
(control) Phaseolus vulgaris 750 bp No Yes/non-dege Pueraria montana – Isoflavone synthase; 88%
Plant family Plant species PCR product length pGEM cloning Sequencing/primers Blast search (% max. identities)
Iridaceae Iris sp. 1500 bp Yes Yes/pGEM Arabidopsis lyrata SINE8 transpozone; 94%
1400 bp Yes Yes/pGEM No similarity found
900 bp Yes Yes/pGEM Humulus lupulus microsatellite; 69%
500 bp Yes Yes/pGEM Arabidopsis lyrata Gypsy21 transposon; 99% Canabaceae Humulus lupulus 1700 bp Yes Yes/pGEM No similarity found
Fabaceae (control) Pisum sativum 1700 bp Yes Yes/pGEM Isoflavone synthase (CYP93C18); 99%
Degenerate primers - continued
CYP93C18-specific primers
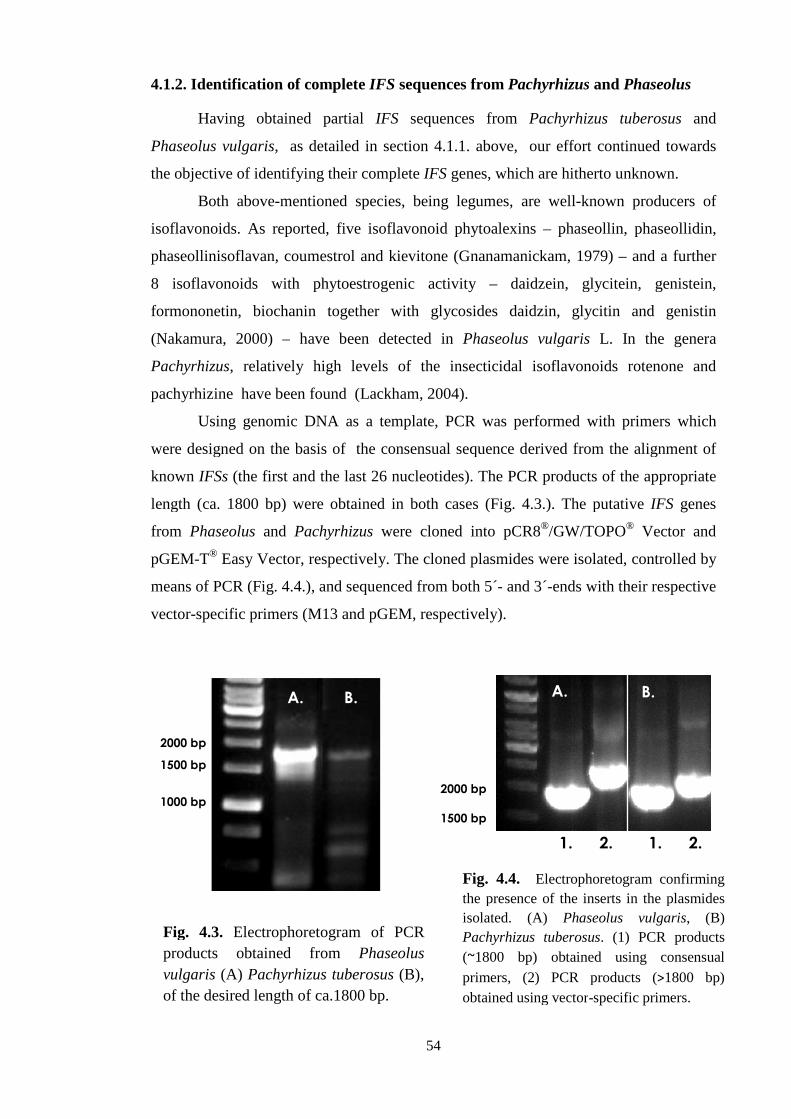
4.1.2. Identification of complete
Having obtained partial
Phaseolus vulgaris,
the objective of identifying their complete
Both above-mentioned species, being legumes, are well
isoflavonoids. As reported, f
phaseollinisoflavan, coumestrol and kievitone (Gnanamanickam, 1979)
8 isoflavonoids with ph
formononetin, biochanin together with glycosides daidzin, glycitin and genistin
(Nakamura, 2000) –
Pachyrhizus, relatively high lev
pachyrhizine have been found (Lackham, 2004).
Using genomic DNA as a template
were designed on the basis of the consensual sequence derived from the alignment of
known IFSs (the first and the last 26 nucleotides). The PCR products of the appropriate
length (ca. 1800 bp) we
from Phaseolus and
pGEM-T® Easy Vector, respectively. The cloned plasmides were isolated, co
means of PCR (Fig. 4.4.
vector-specific primers (M13 and pGEM, respectively).
2000 bp
1500 bp
1000 bp
Fig. 4.3. Electrophoretograproducts obtained from vulgaris (A) Pachyrhizus tuberosusof the desired length of ca.1800 bp.
54
ication of complete IFS sequences from Pachyrhizus
Having obtained partial IFS sequences from Pachyrhizus tuberosus
as detailed in section 4.1.1. above, our effort continued towards
the objective of identifying their complete IFS genes, which are hitherto unknown.
mentioned species, being legumes, are well
isoflavonoids. As reported, five isoflavonoid phytoalexins – phaseollin, phaseollidin,
phaseollinisoflavan, coumestrol and kievitone (Gnanamanickam, 1979)
ds with phytoestrogenic activity – daidzein, glycitein, genistein,
formononetin, biochanin together with glycosides daidzin, glycitin and genistin
– have been detected in Phaseolus vulgaris
, relatively high levels of the insecticidal isoflavonoids rotenone and
have been found (Lackham, 2004).
Using genomic DNA as a template, PCR was performed
were designed on the basis of the consensual sequence derived from the alignment of
(the first and the last 26 nucleotides). The PCR products of the appropriate
length (ca. 1800 bp) were obtained in both cases (Fig. 4.3.). The putative
and Pachyrhizus were cloned into pCR8®/GW/TOPO
sy Vector, respectively. The cloned plasmides were isolated, co
means of PCR (Fig. 4.4.), and sequenced from both 5´- and 3´-ends with their respective
specific primers (M13 and pGEM, respectively).
Electrophoretogram of PCR products obtained from Phaseolus
Pachyrhizus tuberosus (B), of the desired length of ca.1800 bp.
A. B.
2000 bp
1500 bp
Fig. 4.4. Electrophoretogram confirming the presence of the inserts in the plasmides isolated. (A) Phaseolus vulgarisPachyrhizus tuberosus(~1800 bp) obtained using consensualprimers, (2) PCR productobtained using vector
A.
1. 2.
Pachyrhizus and Phaseolus
Pachyrhizus tuberosus and
as detailed in section 4.1.1. above, our effort continued towards
genes, which are hitherto unknown.
mentioned species, being legumes, are well-known producers of
phaseollin, phaseollidin,
phaseollinisoflavan, coumestrol and kievitone (Gnanamanickam, 1979) – and a further
daidzein, glycitein, genistein,
formononetin, biochanin together with glycosides daidzin, glycitin and genistin
vulgaris L. In the genera
the insecticidal isoflavonoids rotenone and
was performed with primers which
were designed on the basis of the consensual sequence derived from the alignment of
(the first and the last 26 nucleotides). The PCR products of the appropriate
). The putative IFS genes
/GW/TOPO® Vector and
sy Vector, respectively. The cloned plasmides were isolated, controlled by
ends with their respective
Electrophoretogram confirming the presence of the inserts in the plasmides
Phaseolus vulgaris, (B) Pachyrhizus tuberosus. (1) PCR products
1800 bp) obtained using consensual
rs, (2) PCR products (>1800 bp) obtained using vector-specific primers.
B.
1. 2. 1. 2.
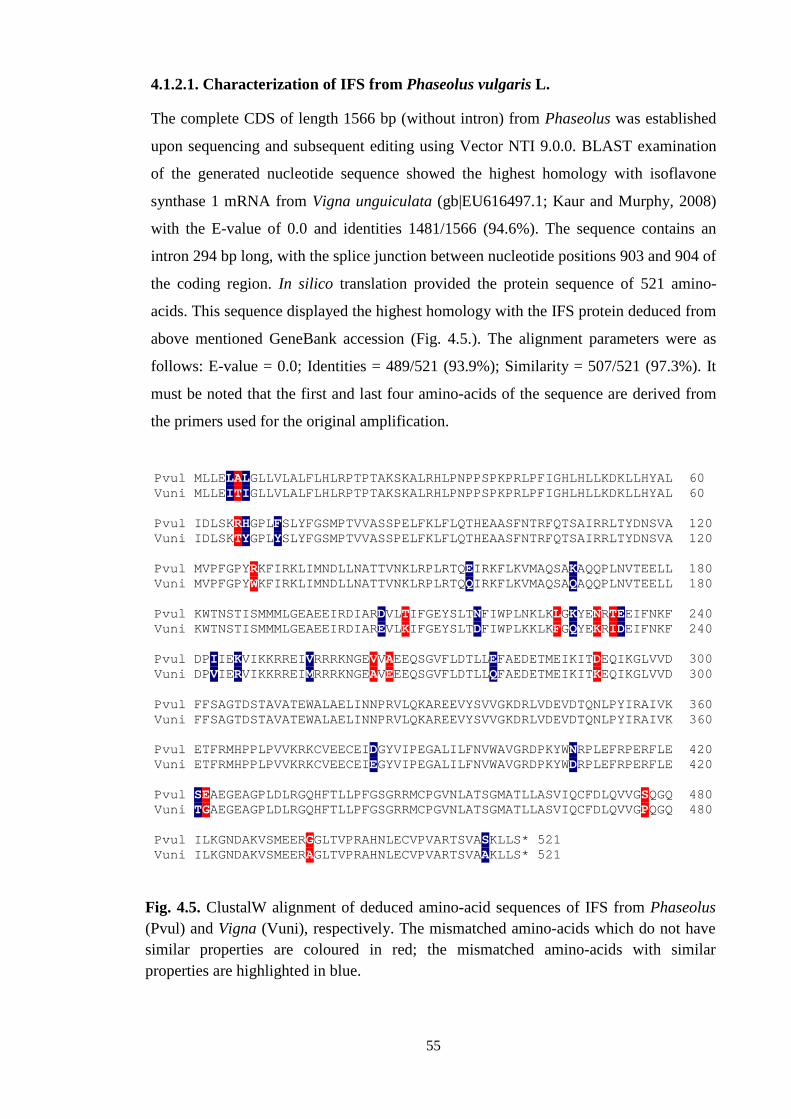
55
4.1.2.1. Characterization of IFS from Phaseolus vulgaris L.
The complete CDS of length 1566 bp (without intron) from Phaseolus was established
upon sequencing and subsequent editing using Vector NTI 9.0.0. BLAST examination
of the generated nucleotide sequence showed the highest homology with isoflavone
synthase 1 mRNA from Vigna unguiculata (gb|EU616497.1; Kaur and Murphy, 2008)
with the E-value of 0.0 and identities 1481/1566 (94.6%). The sequence contains an
intron 294 bp long, with the splice junction between nucleotide positions 903 and 904 of
the coding region. In silico translation provided the protein sequence of 521 amino-
acids. This sequence displayed the highest homology with the IFS protein deduced from
above mentioned GeneBank accession (Fig. 4.5.). The alignment parameters were as
follows: E-value = 0.0; Identities = 489/521 (93.9%); Similarity = 507/521 (97.3%). It
must be noted that the first and last four amino-acids of the sequence are derived from
the primers used for the original amplification.
Fig. 4.5. ClustalW alignment of deduced amino-acid sequences of IFS from Phaseolus (Pvul) and Vigna (Vuni), respectively. The mismatched amino-acids which do not have similar properties are coloured in red; the mismatched amino-acids with similar properties are highlighted in blue.
Pvul MLLE LALGLLVLALFLHLRPTPTAKSKALRHLPNPPSPKPRLPFIGHLHLLKDKLLHYAL 60 Vuni MLLE ITIGLLVLALFLHLRPTPTAKSKALRHLPNPPSPKPRLPFIGHLHLLKDKLLHYAL 60 Pvul IDLSK RHGPLFSLYFGSMPTVVASSPELFKLFLQTHEAASFNTRFQTSAIRRLTYDNSVA 120 Vuni IDLSK TYGPLYSLYFGSMPTVVASSPELFKLFLQTHEAASFNTRFQTSAIRRLTYDNSVA 120 Pvul MVPFGPYRKFIRKLIMNDLLNATTVNKLRPLRTQEIRKFLKVMAQSAKAQQPLNVTEELL 180 Vuni MVPFGPYWKFIRKLIMNDLLNATTVNKLRPLRTQQIRKFLKVMAQSAQAQQPLNVTEELL 180 Pvul KWTNSTISMMMLGEAEEIRDIARDVLTIFGEYSLTNFIWPLNKLKLGKYENRTEEIFNKF 240 Vuni KWTNSTISMMMLGEAEEIRDIAREVLKIFGEYSLTDFIWPLKKLKFGQYEKRIDEIFNKF 240 Pvul DP IIE KVIKKRREIVRRRKNGEVVAEEQSGVFLDTLLEFAEDETMEIKITDEQIKGLVVD 300 Vuni DP VIE RVIKKRREIMRRRKNGEAVEEEQSGVFLDTLLQFAEDETMEIKITKEQIKGLVVD 300 Pvul FFSAGTDSTAVATEWALAELINNPRVLQKAREEVYSVVGKDRLVDEVDTQNLPYIRAIVK 360 Vuni FFSAGTDSTAVATEWALAELINNPRVLQKAREEVYSVVGKDRLVDEVDTQNLPYIRAIVK 360 Pvul ETFRMHPPLPVVKRKCVEECEIDGYVIPEGALILFNVWAVGRDPKYWNRPLEFRPERFLE 420 Vuni ETFRMHPPLPVVKRKCVEECEIEGYVIPEGALILFNVWAVGRDPKYWDRPLEFRPERFLE 420 Pvul SEAEGEAGPLDLRGQHFTLLPFGSGRRMCPGVNLATSGMATLLASVIQCFDLQVVGSQGQ 480 Vuni TGAEGEAGPLDLRGQHFTLLPFGSGRRMCPGVNLATSGMATLLASVIQCFDLQVVGPQGQ 480 Pvul ILKGNDAKVSMEERGGLTVPRAHNLECVPVARTSVASKLLS* 521 Vuni ILKGNDAKVSMEERAGLTVPRAHNLECVPVARTSVAAKLLS* 521

56
4.1.2.2. Characterization of IFS from Pachyrhizus tuberozus (Lam.) Speng.
As in the previous case, the complete CDS of length 1560 bp (without intron) from
Pachyrhizus was established upon sequencing and subsequent editing using Vector NTI
9.11. BLAST search of the ascertained nucleotide sequence displayed the highest
homology with isoflavone synthase mRNA Pueraria montana var. lobata (gb|
AF462633.1; Jeon and Kim, 2001), with the E-value of 0.0 and identities 1405/1566
(89.7%). The sequence contains an intron 243 bp long, with the splice junction between
nucleotide positions 897 and 898 of the coding region. The deduced protein sequence of
519 amino-acids showed the highest homology with the isoflavone synthase 2 from
Vigna unguiculata (gb|ACC77197.1; Kaur and Murphy, 2008) (Fig. 4.6.). The
alignment parameters were as follows: E-value = 0.0; Identity = 470/522 (90.0%);
Similarity = 495/522 (94.8%); Gaps = 3. It must again be noted that the first and last
four amino-acids of the sequence gained are derived from the primers used for the
original amplification.
Ptub MLLE LALGLFVLALFLHLRPRPSAKSKALRHLPNPPSPKPRLPFIGHLHLLDKTLLHHSL 60 Vuni MLLE IAIGLLVLGLFLHLRPTPSAKSKALRHLPNPPSPKPRLPLIGHLHLLKDQLLHHSL 60 Ptub I SLSQRYGPLYSLYFGSMPTVVASTPELFKLFLQTHEATSFNTRFQTSAIKRLTYNNSVA 120 Vuni I DLSKRYGPLYSLYFGSMPTVVASTPELFKLFLQTHEAASFNTRFQTSAIKRLTYDNSVA 120 Ptub MVPFGPYWKFIRKLIMNDLLNATTVNKLRPLRTQEIRKVLRVLAQSAEAQQSLNVTEELL 180 Vuni MVPFGPYWKFIRKLIMNDLLNATTVNKLRPLRSHEIRKVLRVLAQSAEAQQPLNVTEELL 180 Ptub KWTNNTISMMMLGEAEEVRDMAREAVKIFGEYSLTDFIWPLKKLKFGQYEKRIEEIFNKF 240 Vuni KWTNNTISMLMLGEAEEVRDLARETVKIFGEYSLTDFIWPLKKLKFGKYEKRIDEIFNKF 240 Ptub DP AIEKVIKKR REIVRRRKNGEVVEGEASGVFLDTLLEFAEDETVEIKITKEQIKGLVVD 300 Vuni DP VIEKVIKKR QEIVRRRKNGEVVEGEQSGIFLDTLLEFAEDETMEIKITKEQIKGLVVD 300 Ptub FFSAGTDSTAVATEWALAELINNPRVLQKAREEVYSVVGKDRLVDEADTQNLPYIRAIVK 360 Vuni FFSAGTDSTAVATEWALAELINNPRVLQKAREEVYSVVGKDRLVDEVDTQNLPYIRAIVK 360 Ptub ETFRMHPPLPVVKRKCVEECEINGYVIPEGALILFNVWAVGRDPKYWDKPSEFRPERFLE 420 Vuni ETFRMHPPLPVVKRKCVEECEIEGCVIPEGALILFNVWAVGRDPKYWDRPSEFRPERFLE 420 Ptub T--EG DVSPIDLRGQHFQLLPFGSGRRMCPGVNLATSGMATFLASVIQCFDLQVVGPQGQ 480 Vuni NGGEGAVGPIDLRGQHFQLLPFGSGRRMCPGVNLSTSGMATLLASVIQCFDLQVLDPQGH 480 Ptub ILKGNDAKVSMEERPGLTVPREHSLMCVPLARTSVASKLLS- 519 Vuni VLKGDDAKVSMEERAGLTVPRKHNLVCLPLAKTTLAAKLLSP 522
Fig. 4.6. ClustalW alignment of deduced amino-acid sequences of IFS from Pachyrhizus (Ptub) and Vigna (Vuni), respectively. The mismatched amino-acids which do not have similar properties are coloured in red; the mismatched amino-acids with similar properties are highlighted in blue; the 3 gaps discovered are indicated in yellow.
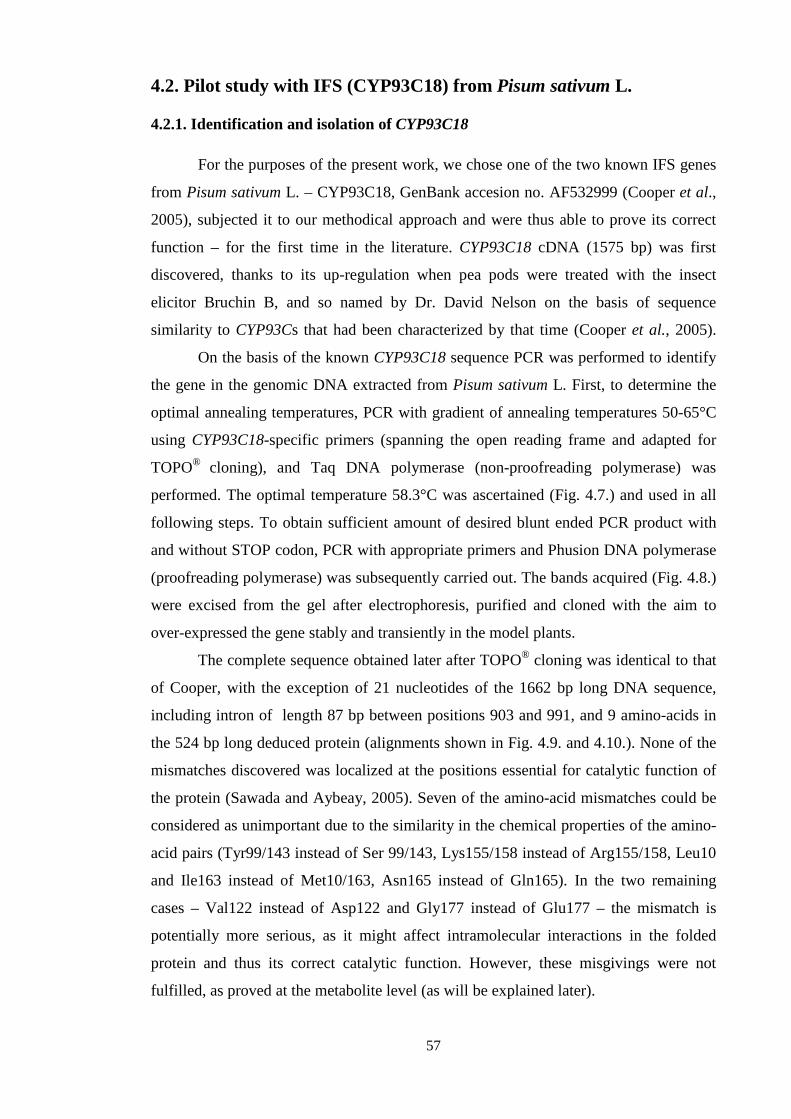
57
4.2. Pilot study with IFS (CYP93C18) from Pisum sativum L. 4.2.1. Identification and isolation of CYP93C18
For the purposes of the present work, we chose one of the two known IFS genes
from Pisum sativum L. – CYP93C18, GenBank accesion no. AF532999 (Cooper et al.,
2005), subjected it to our methodical approach and were thus able to prove its correct
function – for the first time in the literature. CYP93C18 cDNA (1575 bp) was first
discovered, thanks to its up-regulation when pea pods were treated with the insect
elicitor Bruchin B, and so named by Dr. David Nelson on the basis of sequence
similarity to CYP93Cs that had been characterized by that time (Cooper et al., 2005).
On the basis of the known CYP93C18 sequence PCR was performed to identify
the gene in the genomic DNA extracted from Pisum sativum L. First, to determine the
optimal annealing temperatures, PCR with gradient of annealing temperatures 50-65°C
using CYP93C18-specific primers (spanning the open reading frame and adapted for
TOPO® cloning), and Taq DNA polymerase (non-proofreading polymerase) was
performed. The optimal temperature 58.3°C was ascertained (Fig. 4.7.) and used in all
following steps. To obtain sufficient amount of desired blunt ended PCR product with
and without STOP codon, PCR with appropriate primers and Phusion DNA polymerase
(proofreading polymerase) was subsequently carried out. The bands acquired (Fig. 4.8.)
were excised from the gel after electrophoresis, purified and cloned with the aim to
over-expressed the gene stably and transiently in the model plants.
The complete sequence obtained later after TOPO® cloning was identical to that
of Cooper, with the exception of 21 nucleotides of the 1662 bp long DNA sequence,
including intron of length 87 bp between positions 903 and 991, and 9 amino-acids in
the 524 bp long deduced protein (alignments shown in Fig. 4.9. and 4.10.). None of the
mismatches discovered was localized at the positions essential for catalytic function of
the protein (Sawada and Aybeay, 2005). Seven of the amino-acid mismatches could be
considered as unimportant due to the similarity in the chemical properties of the amino-
acid pairs (Tyr99/143 instead of Ser 99/143, Lys155/158 instead of Arg155/158, Leu10
and Ile163 instead of Met10/163, Asn165 instead of Gln165). In the two remaining
cases – Val122 instead of Asp122 and Gly177 instead of Glu177 – the mismatch is
potentially more serious, as it might affect intramolecular interactions in the folded
protein and thus its correct catalytic function. However, these misgivings were not
fulfilled, as proved at the metabolite level (as will be explained later).

IFS
Fig. 4.7. Electrophoretogram of obtained using CYP93C18polymerase; the gradient of annealing temperatures was as follows: (1) 49.8 °C, (2) 50.2°C, (3) 51.1°C, (4) 52.5°C, (5) 54.3°C, (6) 56.2°C, (7) 58.3°C, (8) 60.2°C, (9) 62°C, (10) 63.5°C, (11) 64.6°C, (12) 65.1°C.buffer were loaded per lane. The optimal temperature was ascertained as 7th of the gradient used (58.3°C).
1. 2. 3. 4. 5.
IFS (1662 bp)
Fig. 4.8. Electrophoretogram of PCR products of desired lenght of ~1700 bp obtained using CYP93C18-specific primers with (A) and without (B) STOP codon and Phusion DNA polymerase in both cases. The annealing temperature of 58.3°C (+3°C according to Finzymes´s instruction) was applied. The concentration of the excised DNA was ca. 60 ng/µl in both cases.
58
IFS (1662 bp)
Electrophoretogram of PCR products of the desired lenght of CYP93C18-specific primers (with STOP codon) and Taq DNA
polymerase; the gradient of annealing temperatures was as follows: (1) 49.8 °C, (2) °C, (4) 52.5°C, (5) 54.3°C, (6) 56.2°C, (7) 58.3°C, (8) 60.2°C, (9) 62
°C, (10) 63.5°C, (11) 64.6°C, (12) 65.1°C. 25 µl of PCR mixture with 3buffer were loaded per lane. The optimal temperature was ascertained as 7th of the gradient used (58.3°C).
2. 3. 4. 5. 6. 7. 8. 9. 10. 11.
Electrophoretogram of PCR products of desired lenght of ~1700 bp obtained specific primers with (A) and without (B) STOP codon and
Phusion DNA polymerase in both cases. The annealing temperature of 58.3°C (+3°C ng to Finzymes´s instruction) was applied. The concentration of the excised
µl in both cases.
2000 bp
1500 bp
1000 bp
A. B.
PCR products of the desired lenght of ~1700 bp imers (with STOP codon) and Taq DNA
polymerase; the gradient of annealing temperatures was as follows: (1) 49.8 °C, (2) °C, (4) 52.5°C, (5) 54.3°C, (6) 56.2°C, (7) 58.3°C, (8) 60.2°C, (9) 62
of PCR mixture with 3 µl loading buffer were loaded per lane. The optimal temperature was ascertained as 7th of the
11. 12.
2000 bp
1500 bp
1000 bp
Electrophoretogram of PCR products of desired lenght of ~1700 bp obtained specific primers with (A) and without (B) STOP codon and
Phusion DNA polymerase in both cases. The annealing temperature of 58.3°C (+3°C ng to Finzymes´s instruction) was applied. The concentration of the excised
2000 bp
1500 bp
1000 bp
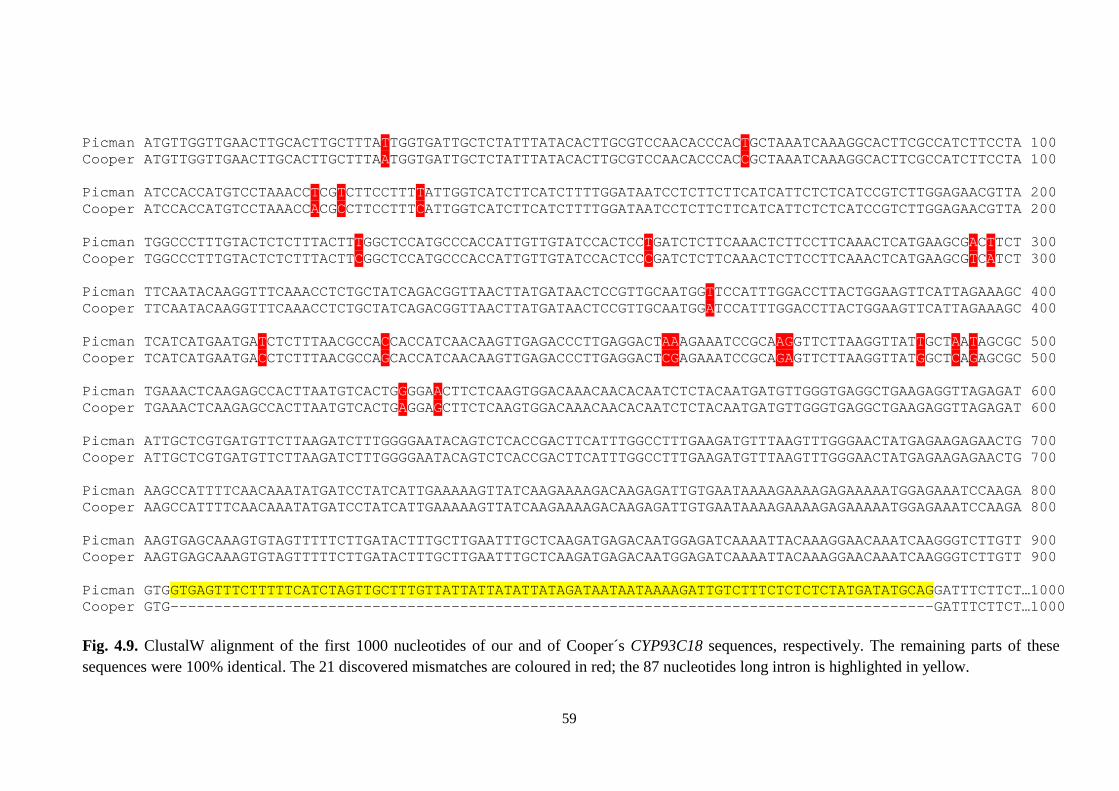
59
Picman ATGTTGGTTGAACTTGCACTTGCTTTATTGGTGATTGCTCTATTTATACACTTGCGTCCAACACCCACTGCTAAATCAAAGGCACTTCGCCATCTTCCTA 100 Cooper ATGTTGGTTGAACTTGCACTTGCTTTAATGGTGATTGCTCTATTTATACACTTGCGTCCAACACCCACCGCTAAATCAAAGGCACTTCGCCATCTTCCTA 100 Picman ATCCACCATGTCCTAAACCTCGTCTTCCTTTTATTGGTCATCTTCATCTTTTGGATAATCCTCTTCTTCATCATTCTCTCATCCGTCTTGGAGAACGTTA 200 Cooper ATCCACCATGTCCTAAACCACGCCTTCCTTTCATTGGTCATCTTCATCTTTTGGATAATCCTCTTCTTCATCATTCTCTCATCCGTCTTGGAGAACGTTA 200 Picman TGGCCCTTTGTACTCTCTTTACTTTGGCTCCATGCCCACCATTGTTGTATCCACTCCTGATCTCTTCAAACTCTTCCTTCAAACTCATGAAGCGACTTCT 300 Cooper TGGCCCTTTGTACTCTCTTTACTTCGGCTCCATGCCCACCATTGTTGTATCCACTCCCGATCTCTTCAAACTCTTCCTTCAAACTCATGAAGCGTCATCT 300 Picman TTCAATACAAGGTTTCAAACCTCTGCTATCAGACGGTTAACTTATGATAACTCCGTTGCAATGGTTCCATTTGGACCTTACTGGAAGTTCATTAGAAAGC 400 Cooper TTCAATACAAGGTTTCAAACCTCTGCTATCAGACGGTTAACTTATGATAACTCCGTTGCAATGGATCCATTTGGACCTTACTGGAAGTTCATTAGAAAGC 400 Picman TCATCATGAATGATCTCTTTAACGCCACCACCATCAACAAGTTGAGACCCTTGAGGACTAAAGAAATCCGCAAGGTTCTTAAGGTTATTGCTAATAGCGC 500 Cooper TCATCATGAATGACCTCTTTAACGCCAGCACCATCAACAAGTTGAGACCCTTGAGGACTCGAGAAATCCGCAGAGTTCTTAAGGTTATGGCTCAGAGCGC 500 Picman TGAAACTCAAGAGCCACTTAATGTCACTGGGGAACTTCTCAAGTGGACAAACAACACAATCTCTACAATGATGTTGGGTGAGGCTGAAGAGGTTAGAGAT 600 Cooper TGAAACTCAAGAGCCACTTAATGTCACTGAGGAGCTTCTCAAGTGGACAAACAACACAATCTCTACAATGATGTTGGGTGAGGCTGAAGAGGTTAGAGAT 600 Picman ATTGCTCGTGATGTTCTTAAGATCTTTGGGGAATACAGTCTCACCGACTTCATTTGGCCTTTGAAGATGTTTAAGTTTGGGAACTATGAGAAGAGAACTG 700 Cooper ATTGCTCGTGATGTTCTTAAGATCTTTGGGGAATACAGTCTCACCGACTTCATTTGGCCTTTGAAGATGTTTAAGTTTGGGAACTATGAGAAGAGAACTG 700 Picman AAGCCATTTTCAACAAATATGATCCTATCATTGAAAAAGTTATCAAGAAAAGACAAGAGATTGTGAATAAAAGAAAAGAGAAAAATGGAGAAATCCAAGA 800 Cooper AAGCCATTTTCAACAAATATGATCCTATCATTGAAAAAGTTATCAAGAAAAGACAAGAGATTGTGAATAAAAGAAAAGAGAAAAATGGAGAAATCCAAGA 800 Picman AAGTGAGCAAAGTGTAGTTTTTCTTGATACTTTGCTTGAATTTGCTCAAGATGAGACAATGGAGATCAAAATTACAAAGGAACAAATCAAGGGTCTTGTT 900 Cooper AAGTGAGCAAAGTGTAGTTTTTCTTGATACTTTGCTTGAATTTGCTCAAGATGAGACAATGGAGATCAAAATTACAAAGGAACAAATCAAGGGTCTTGTT 900 Picman GTGGTGAGTTTCTTTTTCATCTAGTTGCTTTGTTATTATTATATTATAGATAATAATAAAAGATTGTCTTTCTCTCTCTATGATATGCAGGATTTCTTCT…1000 Cooper GTG----------------------------------------- ----------------------------------------------GATTT CTTCT…1000
Fig. 4.9. ClustalW alignment of the first 1000 nucleotides of our and of Cooper´s CYP93C18 sequences, respectively. The remaining parts of these sequences were 100% identical. The 21 discovered mismatches are coloured in red; the 87 nucleotides long intron is highlighted in yellow.
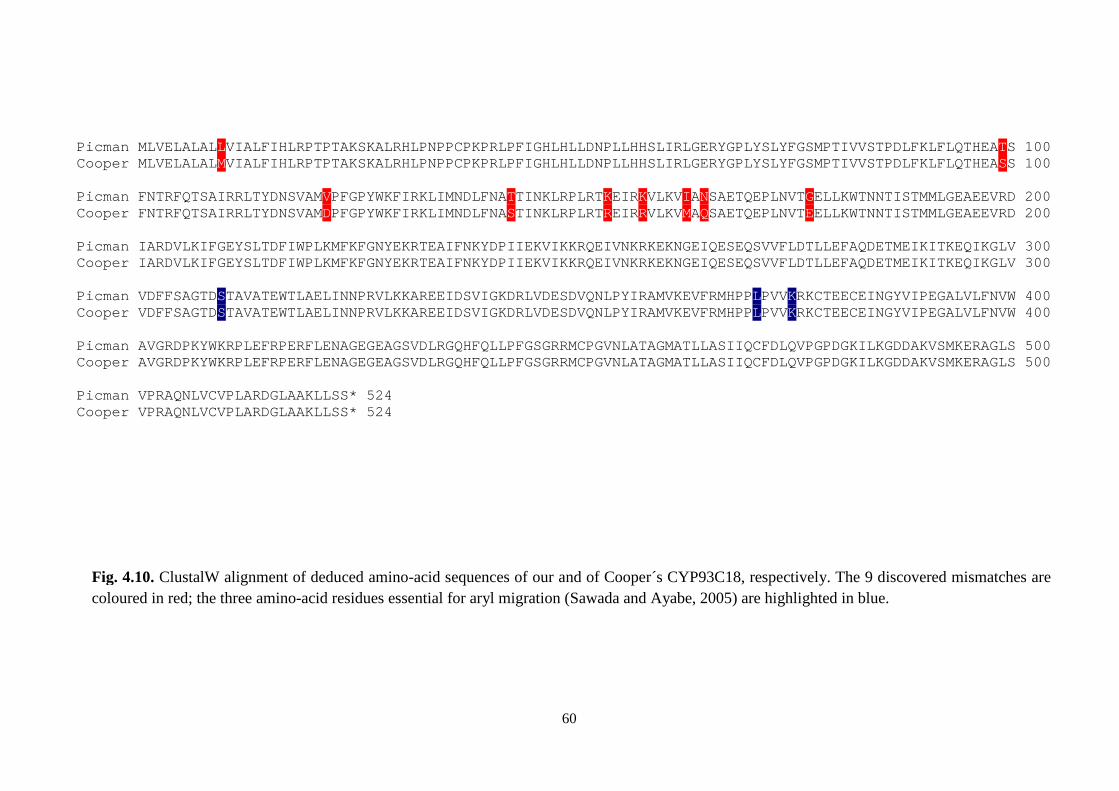
60
Picman MLVELALAL LVIALFIHLRPTPTAKSKALRHLPNPPCPKPRLPFIGHLHLLDNPLLHHSLIRLGERYGPLYSLYFGSMPTIVVSTPDLFKLFLQTHEATS 100 Cooper MLVELALAL MVIALFIHLRPTPTAKSKALRHLPNPPCPKPRLPFIGHLHLLDNPLLHHSLIRLGERYGPLYSLYFGSMPTIVVSTPDLFKLFLQTHEASS 100 Picman FNTRFQTSAIRRLTYDNSVAMVPFGPYWKFIRKLIMNDLFNATTINKLRPLRTKEIRKVLKVI ANSAETQEPLNVTGELLKWTNNTISTMMLGEAEEVRD 200 Cooper FNTRFQTSAIRRLTYDNSVAMDPFGPYWKFIRKLIMNDLFNASTINKLRPLRTREIRRVLKVMAQSAETQEPLNVTEELLKWTNNTISTMMLGEAEEVRD 200 Picman IARDVLKIFGEYSLTDFIWPLKMFKFGNYEKRTEAIFNKYDPIIEKVIKKRQEIVNKRKEKNGEIQESEQSVVFLDTLLEFAQDETMEIKITKEQIKGLV 300 Cooper IARDVLKIFGEYSLTDFIWPLKMFKFGNYEKRTEAIFNKYDPIIEKVIKKRQEIVNKRKEKNGEIQESEQSVVFLDTLLEFAQDETMEIKITKEQIKGLV 300 Picman VDFFSAGTDSTAVATEWTLAELINNPRVLKKAREEIDSVIGKDRLVDESDVQNLPYIRAMVKEVFRMHPPLPVVKRKCTEECEINGYVIPEGALVLFNVW 400 Cooper VDFFSAGTDSTAVATEWTLAELINNPRVLKKAREEIDSVIGKDRLVDESDVQNLPYIRAMVKEVFRMHPPLPVVKRKCTEECEINGYVIPEGALVLFNVW 400 Picman AVGRDPKYWKRPLEFRPERFLENAGEGEAGSVDLRGQHFQLLPFGSGRRMCPGVNLATAGMATLLASIIQCFDLQVPGPDGKILKGDDAKVSMKERAGLS 500 Cooper AVGRDPKYWKRPLEFRPERFLENAGEGEAGSVDLRGQHFQLLPFGSGRRMCPGVNLATAGMATLLASIIQCFDLQVPGPDGKILKGDDAKVSMKERAGLS 500 Picman VPRAQNLVCVPLARDGLAAKLLSS* 524 Cooper VPRAQNLVCVPLARDGLAAKLLSS* 524
Fig. 4.10. ClustalW alignment of deduced amino-acid sequences of our and of Cooper´s CYP93C18, respectively. The 9 discovered mismatches are coloured in red; the three amino-acid residues essential for aryl migration (Sawada and Ayabe, 2005) are highlighted in blue.

62
4.2.2. TOPO® cloning of CYP93C18
According to Gateway® cloning manual, both blunt ended PCR products with and
without STOP codon were separately introduced into pENTRTM/D-TOPO® to obtain
the entry clones (Fig. 4.11.), as described in section 3.4.6. The following day after
heat shock transformation of E.coli TOP 10, tens of white colonies appeared on the
selective plates with 50 µg/ml kanamycin (Fig.4.12.). The colony PCR with
randomly chosen 4 colonies as DNA teplate and CYP93C18-specific primers were
then carried out to confirm the presence of the gene of interest (Fig. 4.13). One of the
succesfully transformed colonies in both cases was cultivated overnight and
pENTR/D-TOPO::IFS constructs were isolated using GeneJET™ Plasmid Miniprep
Kit. The concentration of plasmides acquired was determined by means of NanoDrop
as ca. 250 ng/µl in both cases. The final PCR with the plasmides diluted to
concentration ca. 25 ng/µl was then performed. CYP93C18-specific primers were
used in order to verify the presence of the insert in the vector; cross combination of
CYP93C18-specific primer Forward and primer M13 Reverse (pENTR/D-TOPO-
specific, 157 bp downstream from the insert) was used to confirm the correct
orientation of the insert in the vector (Fig. 4.14.) More details may be found in the
figure description.
Fig. 4.11. The entry clone with inserted CYP93C18 (IFS) which is the same in the case of insert with and without STOP codon. The simplified schematic layout of the clone was created according to the in silico cloning generated by the Vector NTI Suite 9.0.0.
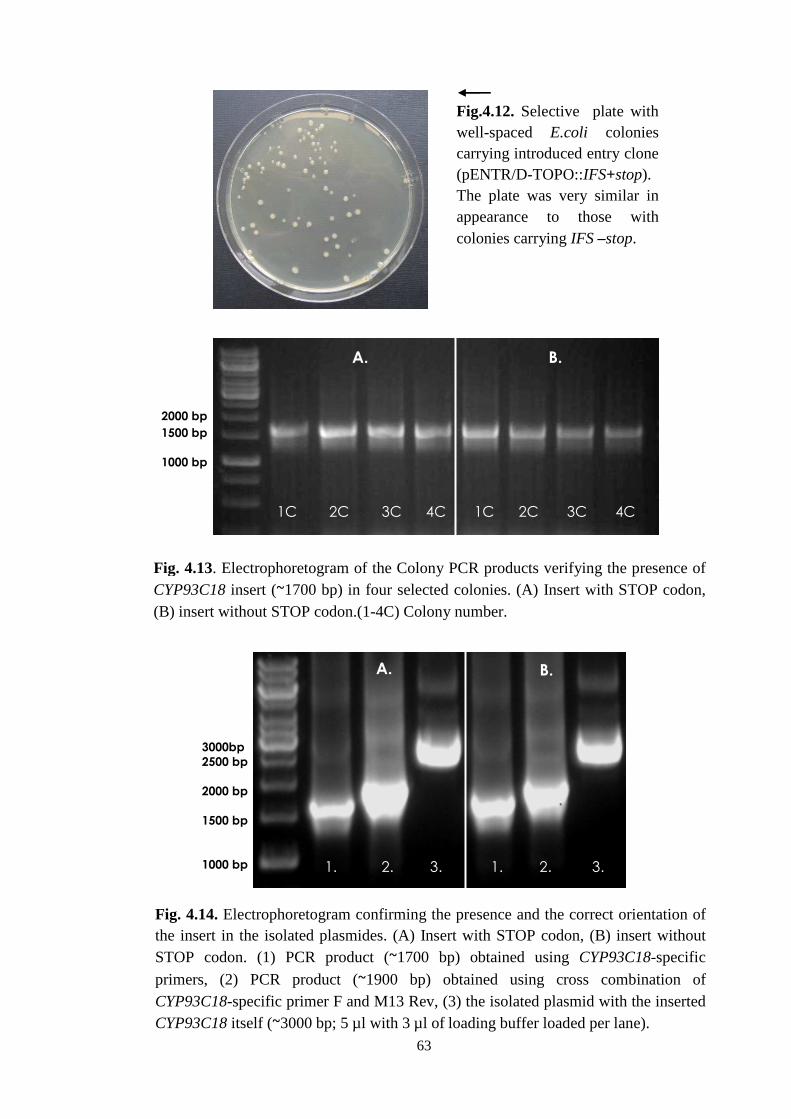
Fig. 4.13. Electrophoretogram of CYP93C18 insert (~1700 bp) in four selected colonies(B) insert without STOP codon.(1
Fig. 4.14. Electrophoretogram confirming the presence and the correct orientation of the insert in the isolated plasmides. (A) Insert STOP codon. (1) PCR product (
primers, (2) PCR product (CYP93C18-specific primer F CYP93C18 itself (~3000 bp; 5
1C
2000 bp
1500 bp
1000 bp
3000bp 2500 bp
2000 bp
1500 bp
1000 bp
63
Electrophoretogram of the Colony PCR products verifying the 1700 bp) in four selected colonies. (A) Insert with STOP codon,
(B) insert without STOP codon.(1-4C) Colony number.
Electrophoretogram confirming the presence and the correct orientation of the insert in the isolated plasmides. (A) Insert with STOP codon, (B) insert without STOP codon. (1) PCR product (~1700 bp) obtained using
PCR product (~1900 bp) obtained using cross combination of specific primer F and M13 Rev, (3) the isolated plasmid with the in
3000 bp; 5 µl with 3 µl of loading buffer loaded per lane)
1C 2C 3C 4C 1C 2C 3C 4C
A. B.
1. 2. 3. 1. 2. 3.
A. B.
Fig.4.12. Selectivwell-spaced E.colicarrying introduced(pENTR/D-TOPO::The plate was very similar in appearance to those with colonies carrying IFS
verifying the presence of (A) Insert with STOP codon,
Electrophoretogram confirming the presence and the correct orientation of with STOP codon, (B) insert without
1700 bp) obtained using CYP93C18-specific
cross combination of the isolated plasmid with the inserted
loaded per lane).
1C 2C 3C 4C
2. 3. 1. 2. 3.
Selective plate with E.coli colonies
carrying introduced entry clone TOPO::IFS+stop).
The plate was very similar in appearance to those with
IFS –stop.

64
4.2.3. Construction of CYP93C18 expression clone for stable expression
In order to secure stable expression of CYP93C18 (with STOP codon) under
CaMV35S promoter, LR recombination between relevant entry clone (pENTR/D-
TOPO::IFS+stop) and destination vector pGWB2 was performed. The construct
obtained (Fig. 4.15.) was introduced into Alpha-Select Gold Efficiency. As expected,
tens of white colonies appeared on the selective plates with 50 µg/ml kanamycin and
50 µg/ml hygromycin (Fig. 4.16.). As in the case 4.2.2., the colony PCR with
randomly chosen 5 colonies as DNA template and CYP93C18-specific primers
followed (Fig. 4.17.). Two of the succesfully transformed colonies were cultivated
overnight and pGWB2::IFS constructs were isolated using GeneJET™ Plasmid
Miniprep Kit. The concentration of plasmides acquired was determined by means of
NanoDrop as ca. 40 ng/µl. The control PCR with the plasmides diluted to
concentration ca. 20 ng/µl was then performed. CYP93C18-specific primers were
used in order to verify the presence of the insert in the vector; cross combination of
CYP93C18-specific primer Forward and primer pGWB2 Reverse (pGWB2-specific,
55 bp downstream from the insert) was used to confirm the correct orientation of the
insert in the vector (Fig. 4.18.) More details may be found in the figure description.
Fig.4.15. The expression clone with inserted CYP93C18 (IFS+stop). The simplified schematic layout of the expression clone was created according to that generated in silico by the Vector NTI Suite 9.0.0.
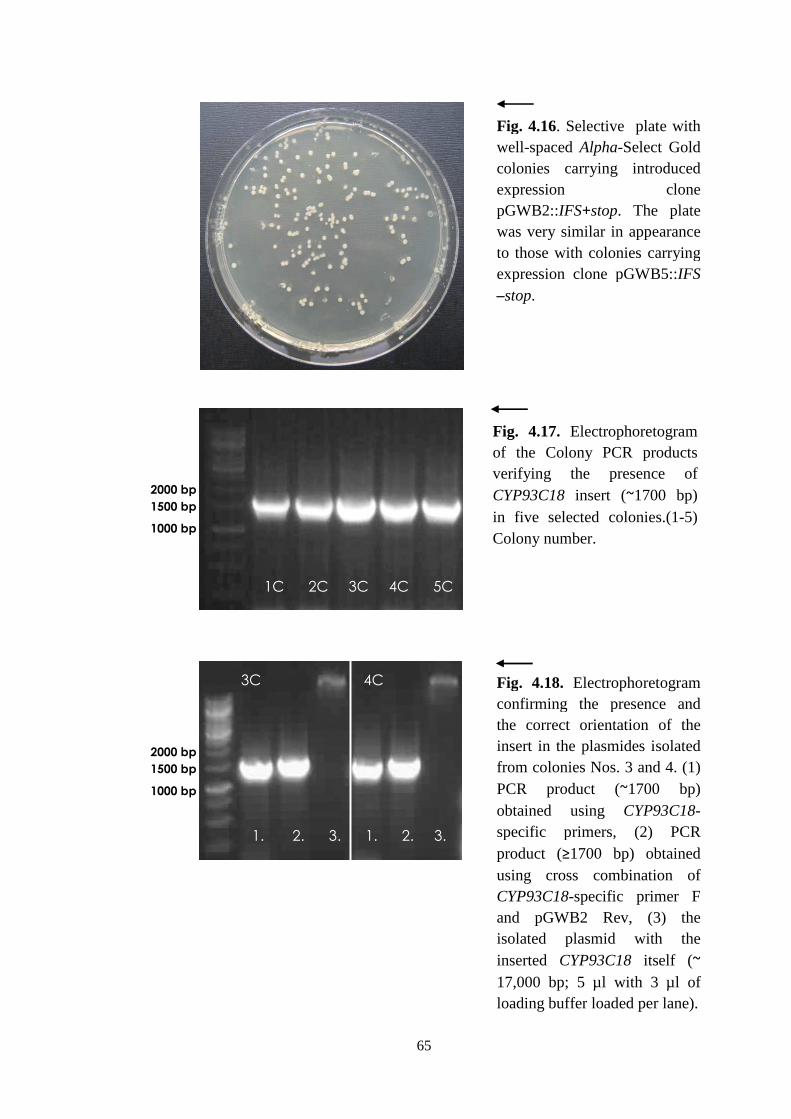
2000 bp
1500 bp
1000 bp
1C
2000 bp
1500 bp
1000 bp
1.
3C
65
Fig. 4.16. Selective plate with well-spacedcolonies carrying introduced expression pGWB2::IFSwas very similar in appearance to those with colonies carryingexpression clone pGWB–stop.
Fig. 4.17. Electrophoretogram of the Colony PCRverifying the CYP93C18 in five selected colonies.(1Colony number.
Fig. 4.18. confirming the presence and the correct orientation of the insert in the plasmidesfrom colonies Nos. 3 and 4. (1) PCR product (obtained using specific primers, (2)product (≥170using cross combination of CYP93C18-and pGWB2 isolated plasmid with the inserted CYP93C18 17,000 bp; 5loading buffer
2C 3C 4C 5C
2. 3. 1. 2. 3.
4C
Selective plate with spaced Alpha-Select Gold
carrying introduced clone
IFS+stop. The plate was very similar in appearance to those with colonies carrying expression clone pGWB5::IFS
Electrophoretogram the Colony PCR products
verifying the presence of insert (~1700 bp)
in five selected colonies.(1-5) Colony number.
Electrophoretogram confirming the presence and the correct orientation of the insert in the plasmides isolated from colonies Nos. 3 and 4. (1) PCR product (~1700 bp) obtained using CYP93C18-specific primers, (2) PCR
1700 bp) obtained cross combination of
-specific primer F pGWB2 Rev, (3) the
isolated plasmid with the CYP93C18 itself (~
17,000 bp; 5 µl with 3 µl of loading buffer loaded per lane).
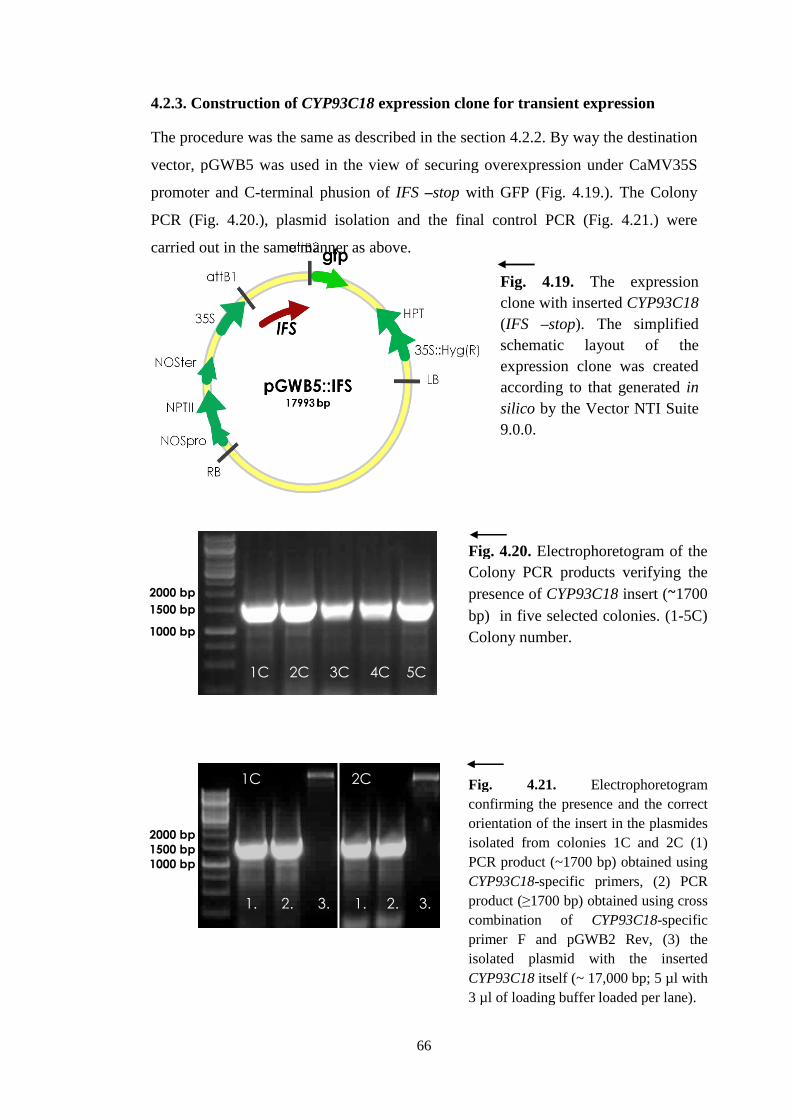
4.2.3. Construction of
The procedure was the same as described in the section 4.2.2. By way the destination
vector, pGWB5 was used in the view of securing overexpression under CaMV35S
promoter and C-terminal phusion of
PCR (Fig. 4.20.), plasmid
carried out in the same manner as above.
2000 bp 1500 bp 1000 bp
2000 bp
1500 bp
1000 bp
1C
1C
1. 2. 3. 1. 2. 3.
66
Construction of CYP93C18 expression clone for transient expression
dure was the same as described in the section 4.2.2. By way the destination
vector, pGWB5 was used in the view of securing overexpression under CaMV35S
terminal phusion of IFS –stop with GFP (Fig. 4.19.). The Colony
), plasmid isolation and the final control PCR (Fig. 4.21.
carried out in the same manner as above.
Fig. 4.19.clone with insert(IFS –stopschematic layout of the expression clone was created according to that generated silico by the Vector NTI Suite 9.0.0.
Fig. 4.20. Electrophoretogram of Colony PCR productspresence of CYP93C18bp) in five selected colonies. (1Colony number.
2C 3C 4C 5C
Fig. 4.21. confirming the presence and the correct orientation of the insert in the plasmides isolated from colonies 1PCR product (~1700 bp) obtained using CYP93C18-specific primers, (2) PCR product (≥1700 bp) obtained using combination of primer F and pGWB2 Rev, isolated plasmid with the inserted CYP93C18 itself (~ 17,000 bp; 53 µl of loading buffer loaded per lane).
2C
2. 3. 1. 2. 3.
expression clone for transient expression
dure was the same as described in the section 4.2.2. By way the destination
vector, pGWB5 was used in the view of securing overexpression under CaMV35S
P (Fig. 4.19.). The Colony
PCR (Fig. 4.21.) were
Fig. 4.19. The expression clone with inserted CYP93C18
stop). The simplified schematic layout of the expression clone was created according to that generated in
by the Vector NTI Suite
Electrophoretogram of the products verifying the
CYP93C18 insert (~1700 in five selected colonies. (1-5C)
Electrophoretogram confirming the presence and the correct orientation of the insert in the plasmides isolated from colonies 1C and 2C (1) PCR product (~1700 bp) obtained using
specific primers, (2) PCR 1700 bp) obtained using cross
combination of CYP93C18-specific primer F and pGWB2 Rev, (3) the isolated plasmid with the inserted
itself (~ 17,000 bp; 5 µl with 3 µl of loading buffer loaded per lane).

4.2.4. Tranformation of
The subsequent step of our effort to over
the obtained expression
which has an extraordinary ability to tranfer a gene of interest (i.e. T
selectable marker into plant genome. The isolated plasmides pGWB
pGWB5::IFS–stop were separately tr
means of electroporation. Transformants were then selected on the the YEB
containing 50 µg/ml kanamycin, 50
100 µg/ml rifampicin
colony PCR with appropriate
2000 bp
1500 bp
1000 bp
Fig. 4.23. Electrophoretogram of verifying the presence of colonies. (1-5C) Colony number. (A) pGWB2::IFS, (B) pGWB5::IFS.
1C 2C 3C 4C 5C
A.
67
4.2.4. Tranformation of Agrobacterium tumaefaciens
The subsequent step of our effort to over-express CYP93C18, was
xpression clones into “a natural genetic engineer”
which has an extraordinary ability to tranfer a gene of interest (i.e. T
selectable marker into plant genome. The isolated plasmides pGWB
stop were separately transformed into Agrobacterium
means of electroporation. Transformants were then selected on the the YEB
g/ml kanamycin, 50 µg/ml hygromycin, 50 µg/ml gentamycin and
ml rifampicin (Fig. 4.22.) Randomly chosen colonies w
colony PCR with appropriate CYP93C18-specific primers in both cases (Fig. 4.23.
Fig. 4.22. Selective plate with tranformed Agrobacterium(slightly over-grown) carintroduced expressionpGWB2::IFS+stop. The plate was very similar in appearance to those with colonies carrying pGWB5::IFS –stop.
2000 bp
1500 bp
1000 bp
Electrophoretogram of the Agrobacterium colony PCRpresence of CYP93C18 insert (~1700 bp) in the five selected
5C) Colony number. (A) pGWB2::IFS, (B) pGWB5::IFS.
2C 3C 4C 5C 1C 2C 3C 4C 5C
B.
was the introduction of
“a natural genetic engineer” Agrobacterium
which has an extraordinary ability to tranfer a gene of interest (i.e. T-DNA) with a
selectable marker into plant genome. The isolated plasmides pGWB2::IFS+stop and
Agrobacterium GV3101 by
means of electroporation. Transformants were then selected on the the YEB-plates
g/ml gentamycin and
) Randomly chosen colonies were controled by
in both cases (Fig. 4.23.).
Selective plate with Agrobacterium colonies
grown) carrying introduced expression clone
The plate was very similar in appearance to those with
expression clone
olony PCR products in the five selected
5C) Colony number. (A) pGWB2::IFS, (B) pGWB5::IFS.
2C 3C 4C 5C
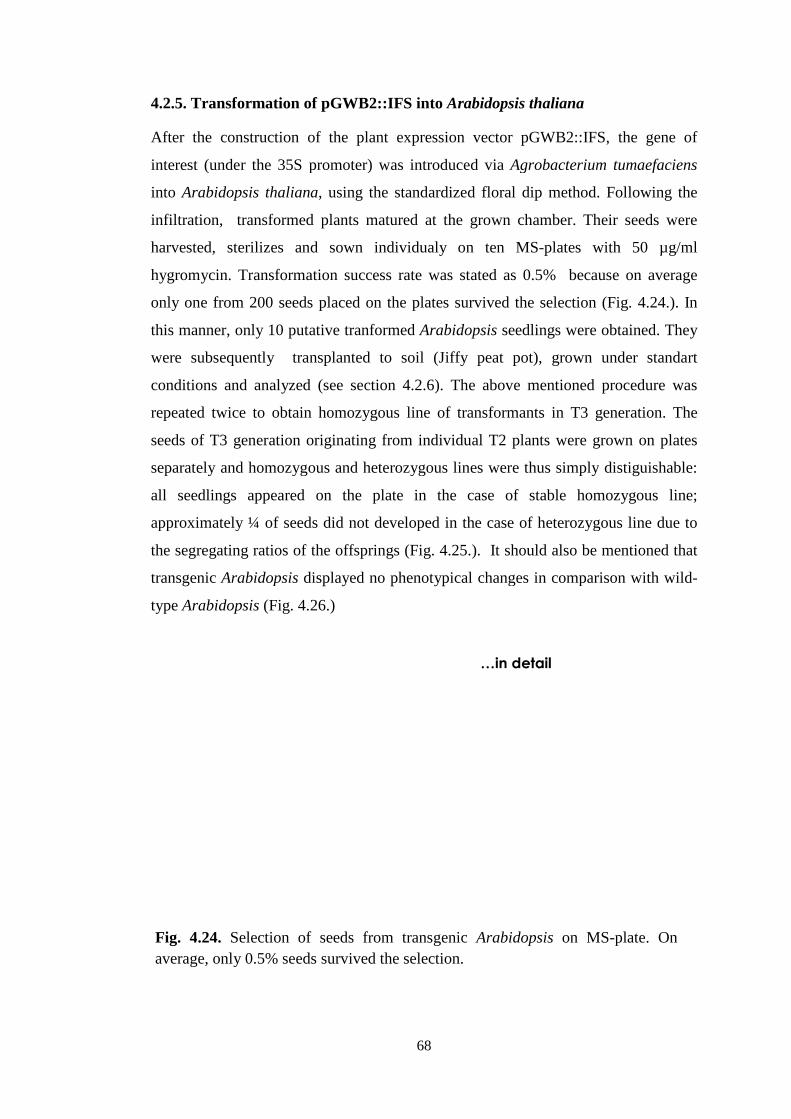
4.2.5. Transformation of pGWB2::IFS
After the construction of the plant expression vector pGWB2::IFS
interest (under the 35S promoter) was introduced via
into Arabidopsis thaliana
infiltration, transformed plants matured at the grown chamber. Their seeds wer
harvested, sterilizes and sown individualy on ten MS
hygromycin. Transformation success rate was stated as 0.5% because on average
only one from 200 seeds placed on the plate
this manner, only 10 putative tranformed
were subsequently transplanted to soil (Jiffy peat pot), grown under standart
conditions and analyzed (see section 4.2.6). The
repeated twice to obtain homozy
seeds of T3 generation originating from individual T2 plants were grown on plates
separately and homozygous and heterozygous lines were thus simply
all seedlings appeared on the plate in the
approximately ¼ of seeds did not developed in the case of heterozygous line due to
the segregating ratios of the offsprings
transgenic Arabidopsis
type Arabidopsis (Fig. 4.26.
Fig. 4.24. Selection of seeds from transgenic average, only 0.5% seeds survived the selection.
68
4.2.5. Transformation of pGWB2::IFS into Arabidopsis thaliana
After the construction of the plant expression vector pGWB2::IFS
interest (under the 35S promoter) was introduced via Agrobacterium tumaefaciens
thaliana, using the standardized floral dip method. Following the
infiltration, transformed plants matured at the grown chamber. Their seeds wer
harvested, sterilizes and sown individualy on ten MS-plates with
hygromycin. Transformation success rate was stated as 0.5% because on average
only one from 200 seeds placed on the plates survived the selection (Fig. 4.24.
y 10 putative tranformed Arabidopsis seedlings were obtained. They
were subsequently transplanted to soil (Jiffy peat pot), grown under standart
conditions and analyzed (see section 4.2.6). The above mentioned
repeated twice to obtain homozygous line of transformants in T3 generation. The
seeds of T3 generation originating from individual T2 plants were grown on plates
separately and homozygous and heterozygous lines were thus simply
all seedlings appeared on the plate in the case of stable homozygous line;
approximately ¼ of seeds did not developed in the case of heterozygous line due to
the segregating ratios of the offsprings (Fig. 4.25.). It should also be mentioned that
Arabidopsis displayed no phenotypical changes in comparison with wild
(Fig. 4.26.)
Selection of seeds from transgenic Arabidopsis on MS
average, only 0.5% seeds survived the selection.
…in detail
Arabidopsis thaliana
After the construction of the plant expression vector pGWB2::IFS, the gene of
Agrobacterium tumaefaciens
, using the standardized floral dip method. Following the
infiltration, transformed plants matured at the grown chamber. Their seeds were
plates with 50 µg/ml
hygromycin. Transformation success rate was stated as 0.5% because on average
s survived the selection (Fig. 4.24.). In
seedlings were obtained. They
were subsequently transplanted to soil (Jiffy peat pot), grown under standart
above mentioned procedure was
in T3 generation. The
seeds of T3 generation originating from individual T2 plants were grown on plates
separately and homozygous and heterozygous lines were thus simply distiguishable:
case of stable homozygous line;
approximately ¼ of seeds did not developed in the case of heterozygous line due to
It should also be mentioned that
nges in comparison with wild-
on MS-plate. On
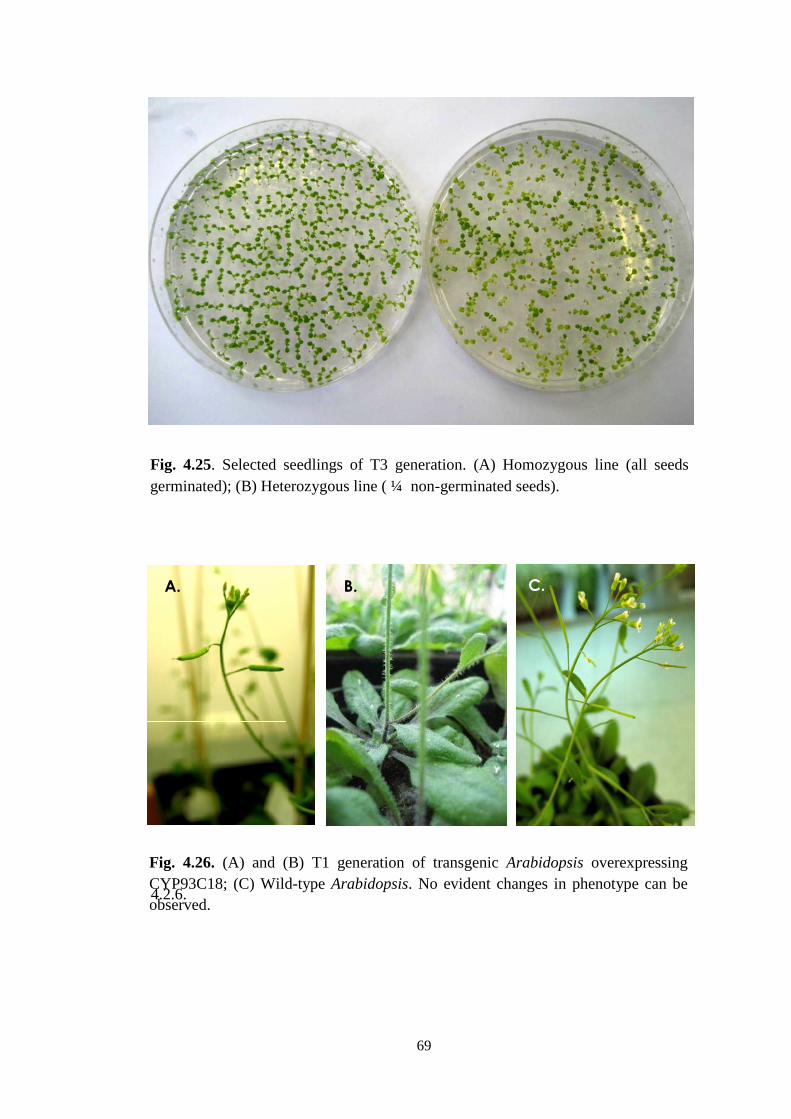
4.2.6.
Fig. 4.25. Selected seedlings of T3 generation. (A) Homozygous line (all seeds germinated); (B) Heterozygous line ( ¼ non
A.
Fig. 4.26. (A) and (B) T1 generation of transgenic CYP93C18; (C) Wildobserved.
69
Selected seedlings of T3 generation. (A) Homozygous line (all seeds germinated); (B) Heterozygous line ( ¼ non-germinated seeds).
(A) and (B) T1 generation of transgenic ArabidopsisCYP93C18; (C) Wild-type Arabidopsis. No evident changes in phenotype can be
B. C.
Selected seedlings of T3 generation. (A) Homozygous line (all seeds
Arabidopsis overexpressing . No evident changes in phenotype can be

4.2.6. Verification of correct funtion of CYP93C18
Transgenic plants surviving hygromycin selection, and their further two generat
were then analysed at four different levels: DNA, RNA, proteins and metabolites.
4.2.6.1. DNA level
DNA was isolated from all transgenic plants of T1 and 20 randomly chosen plants of
T2 and T3 generations and analysed by PCR with
control presence of the transgene.
Arabidopsis (Fig. 4.27.
4.28A). The corresponding band was also obtained in
(Fig. 4.28B), but not in wild
Fig. 4.27. Ten transgenic confirming the presence of
1. 2. 3. 4. 5. 6.
A.
T2
Fig. 4.28. Electrophoretogram of CYP93C18 (arrowheadfrom T2 and T3 generations of transgenic control; (C) wild-type
70
4.2.6. Verification of correct funtion of CYP93C18 transgene
Transgenic plants surviving hygromycin selection, and their further two generat
were then analysed at four different levels: DNA, RNA, proteins and metabolites.
DNA was isolated from all transgenic plants of T1 and 20 randomly chosen plants of
T2 and T3 generations and analysed by PCR with CYP93C18-
control presence of the transgene. CYP93C18 was found to be present in all T1
(Fig. 4.27.) and in most of indivuduals of T2 and T3 generations (Fig
A). The corresponding band was also obtained in Pisum – as a positive control
, but not in wild-type Arabidopsis – as a negative control (Fig
ransgenic Arabidopsis plants of T1 generation. Electrophoretogram confirming the presence of CYP93C18 (arrowheads show IFS 1662
2. 3. 4. 5. 6. 7. 8. 9. 10.
B.. C.
T3
Electrophoretogram of PCR products confirming the presence of(arrowhead show IFS 1662 bp long). (A) Two chosen PCR products
from T2 and T3 generations of transgenic Arabidopsis; (B) Pisumtype Arabidospis as a negative control.
T1
Transgenic plants surviving hygromycin selection, and their further two generations,
were then analysed at four different levels: DNA, RNA, proteins and metabolites.
DNA was isolated from all transgenic plants of T1 and 20 randomly chosen plants of
-specific primers to
was found to be present in all T1
of indivuduals of T2 and T3 generations (Fig.
as a positive control
as a negative control (Fig. 4.28C).
2000 bp
1500 bp
1000 bp
2000 bp
1500 bp
1000 bp
plants of T1 generation. Electrophoretogram 1662 bp long).
confirming the presence of . (A) Two chosen PCR products
Pisum as a positive
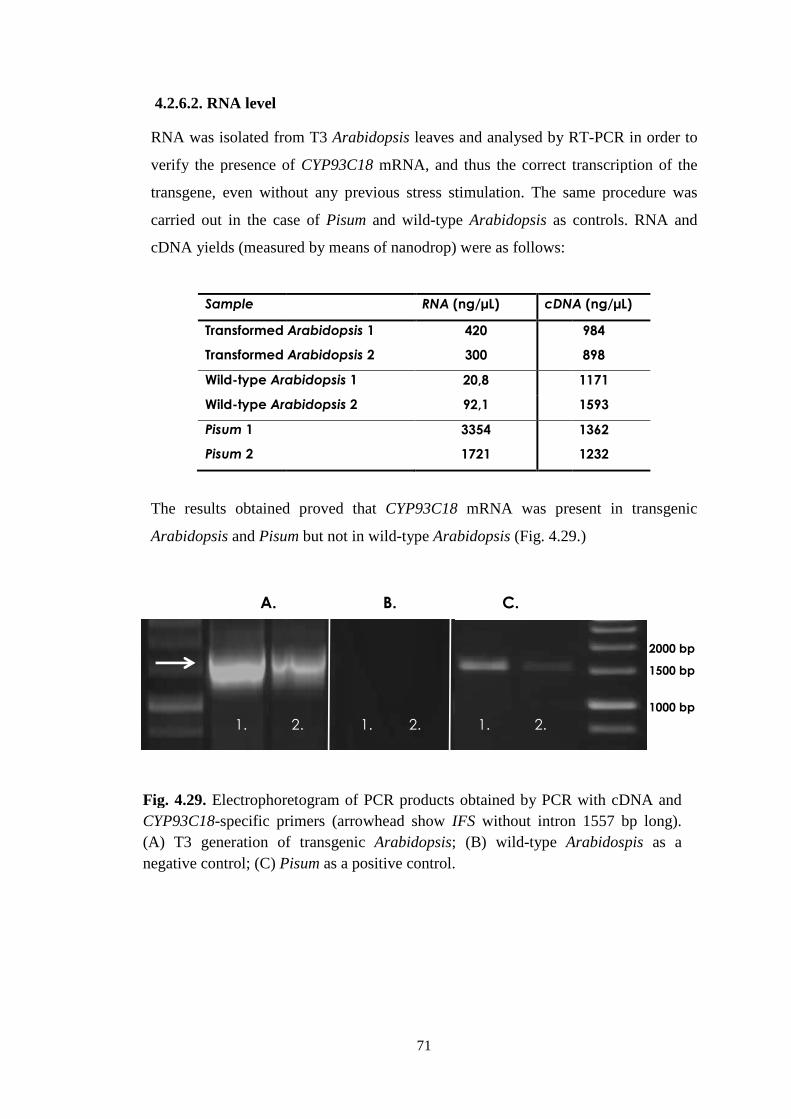
4.2.6.2. RNA level
RNA was isolated from T3
verify the presence of
transgene, even without any previous stress stimulation
carried out in the case of
cDNA yields (measured by means of nanodrop)
Sample
Transformed
Transformed
Wild-type Arabidopsis
Wild-type Arabidopsis
Pisum 1
Pisum 2
The results obtained proved that
Arabidopsis and Pisum
Fig. 4.29. Electrophoretogram of CYP93C18-specific primers (arrowhead(A) T3 generation of transgenic negative control; (C) Pisum
A.
1.
71
RNA was isolated from T3 Arabidopsis leaves and analysed by RT
verify the presence of CYP93C18 mRNA, and thus the correct transcription of the
, even without any previous stress stimulation. The same procedure was
carried out in the case of Pisum and wild-type Arabidopsis as controls.
(measured by means of nanodrop) were as follows:
RNA (ng/µL) cDNA
Transformed Arabidopsis 1 420
Transformed Arabidopsis 2 300
Arabidopsis 1 20,8
Arabidopsis 2 92,1
3354
1721
The results obtained proved that CYP93C18 mRNA was present in transgenic
Pisum but not in wild-type Arabidopsis (Fig. 4.29.
Electrophoretogram of PCR products obtained by PCR with cDNA and specific primers (arrowhead show IFS without intron
(A) T3 generation of transgenic Arabidopsis; (B) wild-type ArabidospisPisum as a positive control.
C.B.
2. 1. 2. 1. 2.
RT-PCR in order to
d thus the correct transcription of the
. The same procedure was
as controls. RNA and
cDNA (ng/µL)
984
898
1171
1593
1362
1232
mRNA was present in transgenic
(Fig. 4.29.)
products obtained by PCR with cDNA and without intron 1557 bp long).
Arabidospis as a
2000 bp
1500 bp
1000 bp

4.2.6.3. Protein level
To confirm the correct expression of the CYP93C18, total protein extraction,
accurate quantification of
specific peptide antibody (designed accordingly to Yu
performed. 1-D SDS
transgenic and wild-type
S (Fig. 4.30.) for control detection of separated proteins. In contrast to Yu´s results
the subsequent immunological detection
specific manner with the total protein extracted from the plants examined, and,
accordingly, we noted the concomitant failure of the discrete IFS band to appear
sufficiently distinctly in the immunoblot
protein (59.4 kDa) may be assumed to be present in transgenic
Pisum, but not in wild
binding of the aforementi
literature, once (Jaganath, 2005)
66 kDa
RBSC-L
45 kDa
Fig. 4.30. 1-D SDSRubisco large subunit (RBSCproteins extracted. IFS of the presumed size 59.4 kDa could be present approximately on the half way between RBTransgenic Arabidospis
72
4.2.6.3. Protein level
To confirm the correct expression of the CYP93C18, total protein extraction,
accurate quantification of the proteins and following imunoblotting with an IFS
specific peptide antibody (designed accordingly to Yu et al., 2000; Fig. 4.31.
D SDS-PAGE western blot of 10 µg total protein extracted from
type Arabidopsis and Pisum was reversibly stained with Ponceau
) for control detection of separated proteins. In contrast to Yu´s results
subsequent immunological detection showed that the antibody reacted in a
specific manner with the total protein extracted from the plants examined, and,
accordingly, we noted the concomitant failure of the discrete IFS band to appear
inctly in the immunoblot (Fig. 4.32.). In spite of this, the CYP93C18
protein (59.4 kDa) may be assumed to be present in transgenic
but not in wild-type Arabidopsis. A similar problem due to the non
binding of the aforementioned IFS antibody has already been described in the
literature, once (Jaganath, 2005).
66 kDa
45 kDa
T W P
D SDS-PAGE western blot of total protein stained with Ponceau S. Rubisco large subunit (RBSC-L; 55 kDa) occupies the major proportion of the proteins extracted. IFS of the presumed size 59.4 kDa could be present approximately on the half way between RBSC-L and 66 kDa marker.
Arabidospis; (W) wild -type Arabidopsis; (P) Pisum
To confirm the correct expression of the CYP93C18, total protein extraction,
the proteins and following imunoblotting with an IFS-
., 2000; Fig. 4.31.) was
g total protein extracted from
y stained with Ponceau
) for control detection of separated proteins. In contrast to Yu´s results,
showed that the antibody reacted in a non-
specific manner with the total protein extracted from the plants examined, and,
accordingly, we noted the concomitant failure of the discrete IFS band to appear
In spite of this, the CYP93C18
protein (59.4 kDa) may be assumed to be present in transgenic Arabidopsis and
A similar problem due to the non-specific
oned IFS antibody has already been described in the
IFS? 59.4 kDa
stained with Ponceau S. L; 55 kDa) occupies the major proportion of the
proteins extracted. IFS of the presumed size 59.4 kDa could be present L and 66 kDa marker. (T)
Pisum.
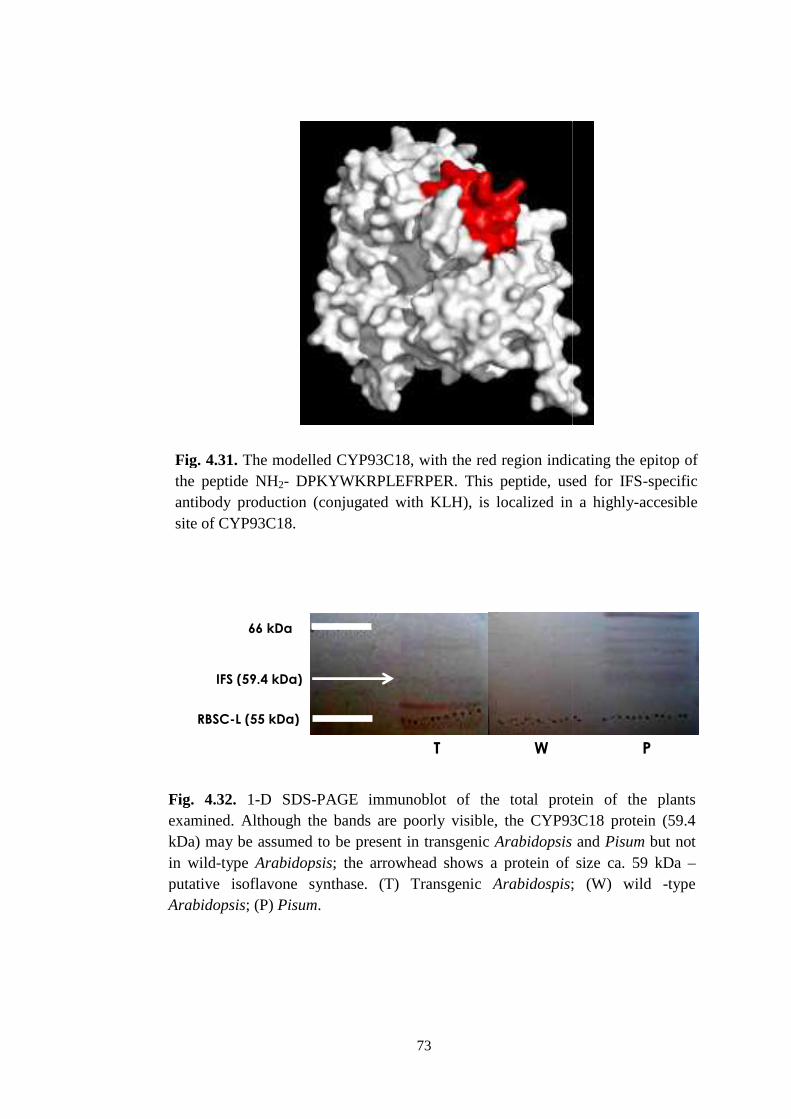
Fig. 4.31. The modelled CYP93C18, with the red region indicating the epitop of the peptide NH2-antibody productionsite of CYP93C18.
Fig. 4.32. 1-D SDSexamined. Although the bands are poorly visible, tkDa) may be assumed to be present in transgenic in wild-type Arabidopsisputative isoflavone synthase.Arabidopsis; (P) Pisum
66 kDa
IFS (59.4 kDa)
RBSC-L (55 kDa)
73
The modelled CYP93C18, with the red region indicating the epitop of - DPKYWKRPLEFRPER. This peptide, used for IFS
ction (conjugated with KLH), is localized in a highlysite of CYP93C18.
D SDS-PAGE immunoblot of the total protein of the plants Although the bands are poorly visible, the CYP93C18 protein (59.4
kDa) may be assumed to be present in transgenic Arabidopsis Arabidopsis; the arrowhead shows a protein of size ca. 59 kDa
putative isoflavone synthase. (T) Transgenic Arabidospis; (W) wild Pisum.
66 kDa
IFS (59.4 kDa)
(55 kDa)
T W
The modelled CYP93C18, with the red region indicating the epitop of DPKYWKRPLEFRPER. This peptide, used for IFS-specific
, is localized in a highly-accesible
immunoblot of the total protein of the plants he CYP93C18 protein (59.4
and Pisum but not ; the arrowhead shows a protein of size ca. 59 kDa –
; (W) wild -type
W P

74
4.2.6.4. Metabolite level
HPLC-MS analysis of extracts from whole shoots and seeds of the plants examined
revealed the main indicator of the correct function of the introduced CYP93C18: the
presence of isoflavonoids in the transgenic Arabidopsis, despite the absence of
previous stress induction. Using 15 different isoflavonoid standards (Fig. 4.34.), we
detected isoflavone genistein and its methylated derivative, tectorigenin (4´,5,7-
trihydroxy-6-methoxyisoflavone), in the shoots and in the seeds of the transgenic
Arabidopsis, respectively (Fig. 4.35. – A and B). A positive control – Pisum
contained in total 5 different forms of isoflavonids (Fig. 35 – E and F). None of the
isofavonoids on which we focused were present in the shoots or seeds of the wild-
type Arabidopsis (Fig. 4.35. – C and D). The chemical structures of the isoflavonoids
detected are shown in the Fig. 4.33. The quantities of the isoflavonoids measured
were as follows:
Sample Content of isoflavonids
Shoot (µg/g dry weight) Seeds (µg/g dry weight)
Transformed Arabidopsis 1.58 tectorigenin 0.5 genistein
Wild-type Arabidopsis none none
Pisum none daidzein 0.55 daidzein
0.31daidzin 6.96 daidzin
0 genistein 0.33 genistein
0.35 prunetin 0.14 prunetin
0.41 puerarin none puerarin
A. B.
E.D. F.
C.
Fig. 4.33. Chemical structures of the detected isoflavonoids. (A) genistein; (B) tectorigenin; (C) prunetin (7-O-methylated genistein); (D) daidzein; (E) daidzin (7-O-glucoside of daidzein); (F) puerarin (8-C-glucoside of daidzein). Drawn in ACD/ChemSketch.

Fig. 4.34. 15 isoflavonoid standards used: 13.235), 3- ononin (r.t. 7.739), 4genistein (r.t. 11.974), 715.624), 9-puerarin (r.t. 17.789), 103.420), 12-genistin (r.t. 4.809), 1315-tectorigenin (r.t. 11.840).
75
15 isoflavonoid standards used: 1-puerarin (r.t. 2.436), 2ononin (r.t. 7.739), 4-daidzein (r.t. 9.354), 5-glycite
genistein (r.t. 11.974), 7- isoformononetin (r.t.14.429), 8-formononetin (r.t. puerarin (r.t. 17.789), 10- biochanin A (r.t. 19.270), 11genistin (r.t. 4.809), 13-tectoridin (r.t. 5.054), 14- sissotr
tectorigenin (r.t. 11.840). r.t. – retention time.
puerarin (r.t. 2.436), 2- daidzin (r.t. glycitein (r.t. 9.867), 6-
formononetin (r.t. biochanin A (r.t. 19.270), 11-glycitin (r.t.
sissotrin (r.t. 11.041),
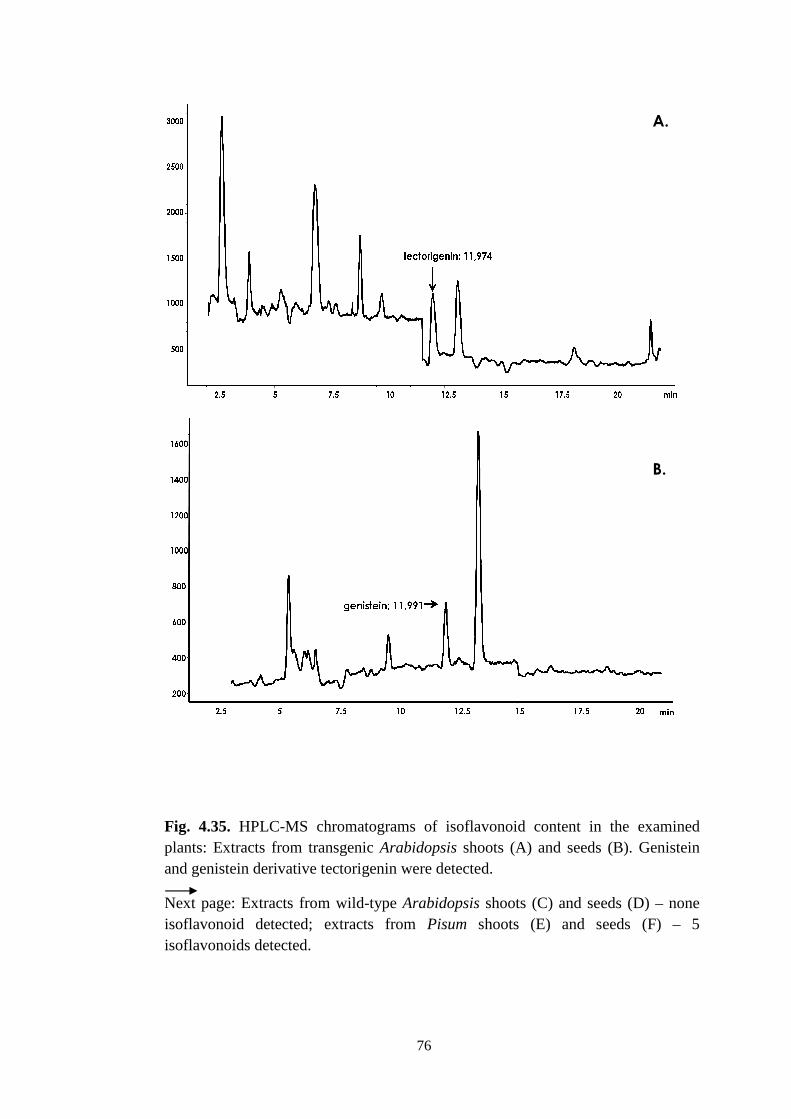
Fig. 4.35. HPLC-MS chromatograms of isoflavonoid content in the examined plants: Extracts from transgenic and genistein derivative tectorigenin were detected.
Next page: Extracts from wildisoflavonoid detectedisoflavonoids detected.
76
MS chromatograms of isoflavonoid content in the examined plants: Extracts from transgenic Arabidopsis shoots (A) and seeds (B).
erivative tectorigenin were detected.
Next page: Extracts from wild-type Arabidopsis shoots (C) and seeds (Disoflavonoid detected; extracts from Pisum shoots (E) and seeds (Fisoflavonoids detected.
MS chromatograms of isoflavonoid content in the examined shoots (A) and seeds (B). Genistein
and seeds (D) – none shoots (E) and seeds (F) – 5
B.
A.

77
C.
D.
E.
F.

78
4.2.7. Visualization of CYP93C18 in vivo
Further, our objective to visualize CYP93C18´s localization in vivo was met. As
mentioned in the section 2.2., it is frequently stated in the literature that isoflavone
synthase is localized on the membrane of the endoplasmic reticulum. Using the on-line
tool SignalP 3.0 (Bendtsen et al., 2004), the signal peptide in N-terminus of CYP93C18
was predicted with 99.6% probability (NN) and 99.9% probability (HMM). The
cleavage site was determined between the 19th and 20th amino-acid residues, with not
very high probability of 39.2%. The prediction of ER targeting was verified by means
of the Agrobacterium-mediated transient expression of 35S::CYP93C18::GFP fused
proteins (construct pGWB5::IFS, see section 4.2.3.) in the leaves of Nicotiana
benthamiana. The desired fluorescent signal was observed by means of a confocal
microscope in the endoplasmic reticulum, as predicted (Fig. 4.36. A, B, C, D). This
result was compared with the localization of the free GFP (cytoplasm and nucleus, Fig.
4.36. E), and of the GFP with HDEL sequence (pBIN m-gfp5-ER), whose pattern of ER
localization corresponded exactly to those of IFS (Fig. 4.36. F).
4.2.8. IFS association with endoplasmic reticulum membrane
The question as to how the IFS is bound to the ER membrane, however, remains still to
be answered. In the case of IFS, no signal anchor (i.e. uncleaved signal peptide) was
recognised by the HMM, nor was any potential modification site found within the
CYP93C18 sequence. However, further investigation using the on-line tools SOSUI
(Mitaku Group, Department of Applied Physics, Nagoya University) and TMpred
(Hofmann and Stoffel, 1993), revealed the N-terminal hydrofobic transmembrane helix
with membrane inner-outer orientation, corresponding to the predicted signal peptide
within the IFS sequence. We constructed a model of 3D structure of CYP93C18 using
the Modeller9v5 program. As templates we utilized known 3D structures of mammalian
P450 (e.g. rcsb code: 1tqn, 2hi4 and 3e6i) which, by means of the Psipred threading
algorithm, were found to be the most suitable templates. Based on this model and
previous predictions, we propose a mechanism of CYP93C18 membrane-binding, with
N-terminal helix embedded in a membrane (Fig. 4.37. A). The N terminus was not
modelled, however, due to the absence of a structural template. Our proposal of IFS´s
association to ER membrane is also due to the is also supported by the electrostatic
distribution on the protein computed by the linear Poisson-Boltzmann equation
(Fig.4.37. B).
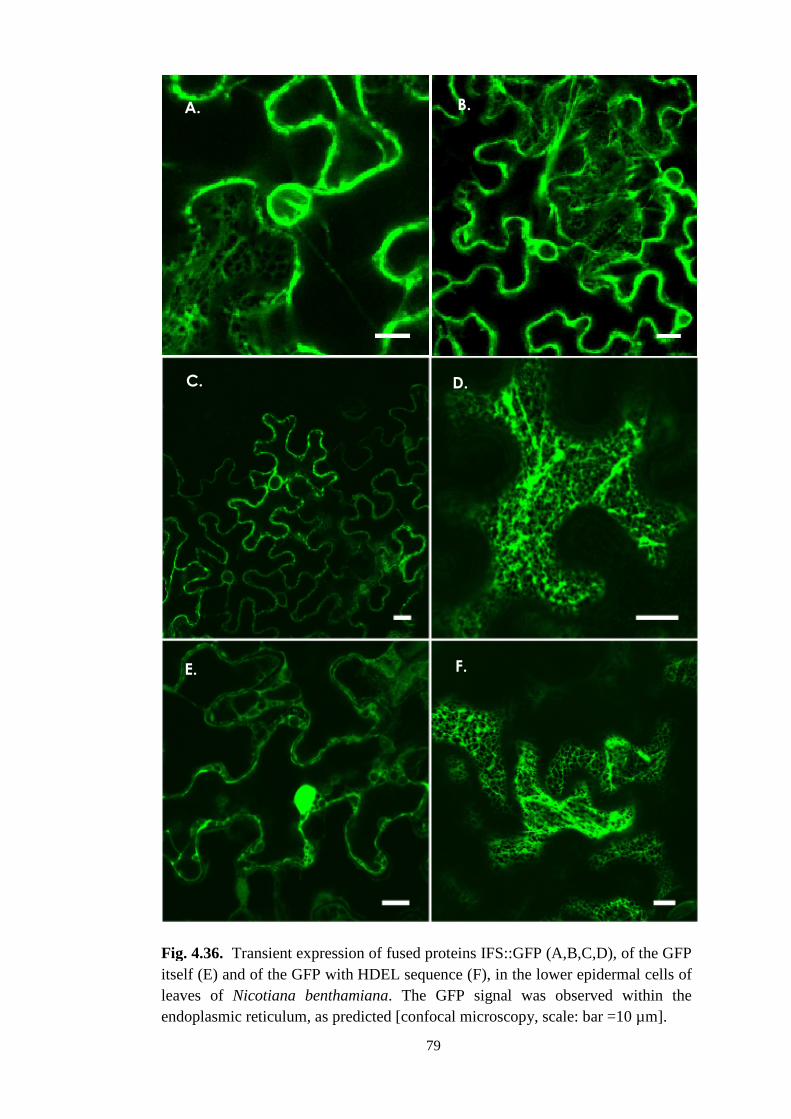
Fig. 4.36. Transient expression of fused proteins IFS::GFPitself (E) and of the GFP withleaves of Nicotiana benthamianaendoplasmic reticulum, as predicted [confocal microscopy, scale: bar =10 µm].
C.
A.
E.
79
Transient expression of fused proteins IFS::GFP (A,B,C,D), of the GFP ) and of the GFP with HDEL sequence (F), in the lower
Nicotiana benthamiana. The GFP signal was observed within the doplasmic reticulum, as predicted [confocal microscopy, scale: bar =10 µm].
F.
D.
B.
(A,B,C,D), of the GFP lower epidermal cells of
. The GFP signal was observed within the doplasmic reticulum, as predicted [confocal microscopy, scale: bar =10 µm].
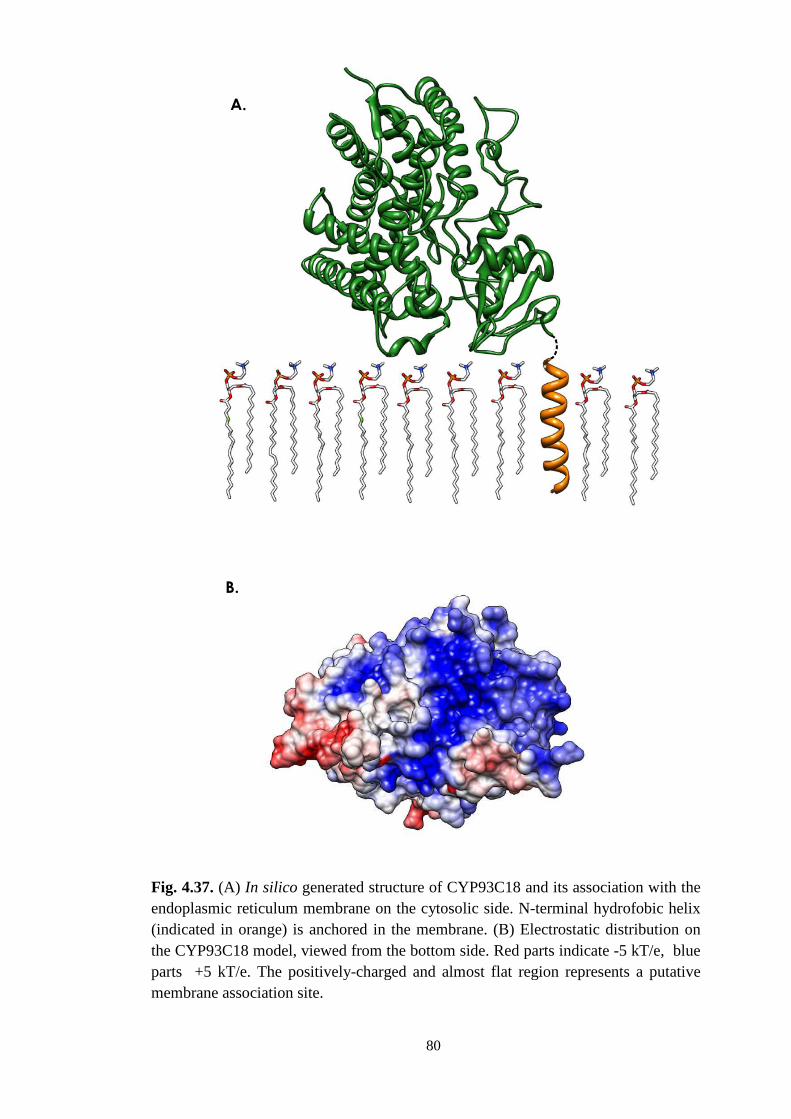
A.
B.
Fig. 4.37. (A) In silicoendoplasmic reticulum membrane on the cytosolic side. N(indicated in orange) is anchored in the membrane. (B)the CYP93C18 model, viewed from the bottom side. parts +5 kT/e. The positivelymembrane association site.
80
In silico generated structure of CYP93C18 and its association with the
endoplasmic reticulum membrane on the cytosolic side. N-terminal hy) is anchored in the membrane. (B) Electrostatic distribution on
the CYP93C18 model, viewed from the bottom side. Red parts indicate . The positively-charged and almost flat region re
membrane association site.
generated structure of CYP93C18 and its association with the rminal hydrofobic helix
Electrostatic distribution on Red parts indicate -5 kT/e, blue
charged and almost flat region represents a putative

81
5. DISCUSSION
The two main objectives of the present masters thesis were: (1) The
identification of isoflavone synthase genes in the chosen non-leguminous and
leguminous plants, and (2) Performing a pilot study with IFS (CYP93C18) from Pisum
sativum L. to design a procedure for the functional expression for newly-identified
isoflavone synthase genes and, moreover, to localize the protein in vivo. Our
methodology was inspired by several succesful studies reported in the literature (Jung et
al., 2000; Akashi et al., 1999, Kim et al., 2003), which described the identification,
cloning and functional expression of IFS from different leguminous species, in
connection with the metabolic engineering of isoflavonoid biosynthesis.
5.1. IFS was detected in leguminous species only
Given that there are 60 isoflavonoid-producing plant families known to date
(Macková et al., 2006), our approach was informed by five particular hypotheses: (1)
The number of families producing isoflavonoids might in fact be significantly larger
than hitherto thought, (2) plants producing isoflavonoids must necessarily possess an
enzyme catalysing the migration of the aryl group on the chromene skeleton of
flavanones, (3) the genes coding this enzyme should display a homology with genes for
IFS already described in the case of several leguminous species, (4) the absence of such
orthologues need not always signify the absence of the biosynthetic pathway leading to
the production of isoflavonoids – and thus the possible existence of some other, hitherto
undiscovered enzyme should not be ruled out, and, (5) conversely, the presence of an
orthologue to CYP93C need not necessarily guarantee the presence of isoflavonoids,
despite its high probability.
It must be admitted that our efforts towards the aim of identifying IFS in non-
leguminous species did not yield fruit. Isoflavone synthase was discovered in none of
the 33 examined non-leguminous species from 14 different plant families, although, as
reported in the literature, in most of them some isoflavonoids have been detected. Using
the PCR method with degenerate primers, PCR products appeared in 24 of the chosen
plants, once reaction conditions had been optimised. Even though the IFS fragment
sequence determined by the degenerate primers was known from multiple alignment
analysis, there was no particular expectation of the precise lenght of the PCR products,

82
as the genomes of the examined plants are unknown (the variable constituent was
primarily intron length). The lengths of the fragments obtained ranged from 550 bp to
1500 bp. In total, 28 sequences were acquired upon sequencing (some of which were
fragments of different lengths originating from the same species). A BLAST search
showed that half of them were not homologous to any nucleotide sequence from the
database, and that the remaining sequences displayed homology with transposones and
retrotrasposones, with fragments from mitochondrial and chloroplast genomes, and with
various chromosomal DNAs not specified in any further detail. Moreover, when
CYP93C18-specific primers were applied in the case of Humulus lupulus and Iris sp.,
PCR products of the promising lengths of 1700 bp (equal to the length of IFS from the
Pisum) and 1500 bp, respectively, appeared. Surprisingly, the sequencing results were
disappointing: the sequences were not homologous to any known IFS from the
GenBank.
These results are in contrast with the fact that IFS has been described in the case
of a particular non-leguminous species once in the literature: Jung et al. identified two
isoflavone synthase isoforms in Beta vulgaris L. from the family Chenopodiaceae (Jung
et al., 2000), which is consistent with the presence of isoflavonoids in this plant
(Geigert et al., 1973). However, the unexpectedly high homology of even the nucleotide
sequences of these two genes with their orthologues from evolutionary distant
leguminous species (99% in most cases) does raise some awkward questions, even
though the necessity for the protein sequence to have conserved regions is not open to
doubt. Beta vulgaris was also examined in our study, but with a negative result, arising
from repeated errorneous sequencing – which makes this result impossible to interpret.
On the other hand, this study demonstrates the utility of an undemanding PCR
method with appropriately-designed primers to identify new isoflavone synthase genes
in the genomic DNAs of leguminous species. In the case of the control leguminous
plants – Phaseolus vulgaris L. and Pachyrhizus tuberosus (Lam.) Spreng – we obtained
new partial IFS sequences using the same, above-mentioned degenerate primers, and
subsequently obtained also their complete IFS sequences, using consensual primers
spanning the whole reading frame. The complete sequences were 1860 bp long
(including intron) in the case of Phaseolus, and 1803bp long (including intron) in the
case of Pachyrhizus. The introns revealed on the basis of alignment with the most
similar IFSs from GenBank, were 264 bp and 243 bp long, respectively. This means that
they are longer compared to the soybean IFS1 intron of 218 bp and soybean IFS2 intron
83
of 135 bp (Jung et al., 2000), and much longer than the intron of 87 bp detected in
CYP93C18 in our pilot study (see section 4.2.1.). The new IFS gene from Phaseolus
displayed very high homology at the DNA level as well as at the protein level (more
than 97% of the amino-acids were similar) with IFS1 from Vigna unguiculata (L.)
Walp. These findings correspond to the phylogenetical proximity of these two species
within the millettioid clade of the Phaseolae tribe (Cannon et al., 2009). In the case of
Pachyrhizus, the nucleotide sequence was most similar to the IFS from Pueraria
montana var. lobata, both belonging to the Glycininae subtribe (Lee and Hymowitz,
2001), whereas, surprisingly, the amino-acid sequence was highly homologous to IFS2
from Vigna unguiculata (L.) Walp., whose IFS was longer by three amino-acids. These
differences beetwen the DNA´s and the derived protein´s homologies could be
explained by the manner in which the BLAST algorithm compares the sequence of
interest with the database, without taking into account the degeneracy of the genetic
code. The slightly higher percentage of identities in the case of the IFS gene from
Pueraria versus the IFS gene from Vigna (89% versus 86% of identities), was not
reflected in a higher percentage of identities in the derived amino-acid sequence in
Puearia. In constrast, the amino-acid sequence of IFS2 from Vigna, belonging also to
the Phaseolae tribe but not in the Glycininae subtribe (Lee and Hymowitz, 2001), was
found to be the most similar to our sequence. This could be due to the fact that not all
mismatches in the nucleotide sequence will necessarily affect the protein sequence.
The next appropriate step would be the verification of the the correct function of
the newly-identified IFSs from Phaseolus vulgaris and Pachyrhizus tuberozus, using the
methodology which was developed and succesfully applied in the pilot study with
CYP93C18, as descibed below.
However, our best efforts notwithstanding, the objective of identifying the IFS
gene in non-leguminous plants was not met, as the methodology did not work here. This
fact needs to be interpreted with caution. In particular: (1) In some of the plants
investigated, isoflavone synthesis is indeed absent, and thus the gene itself is likely to
be absent. (2) Primers designed on the basis of our knowledge of the IFS genes from
leguminous plants and from sugarbeet (Beta vulgaris), might not necessarily be
appropriate to phylogenetically distant plant species. (3) It is improbable, yet possible,
that a hitherto unknown protein – responsible for isoflavone synthesis through a
different enzyme pathway – may exist instead of IFS, and if so, this pathway still awaits
discovery.

84
5.2. CYP93C18 is a functional isoflavone synthase
The primary aim of the second part of this study was to develop an assay for the
functional expression of IFS, using CYP93C18 as an example. But the study could be
also considered as a continuation of the only study concerning CYP93C18: in 2005,
Cooper et al. demonstrated the obvious connection between up-regulation of the newly
discovered CYP93C18, “a putative isoflavone synthase gene”, and a subsequent
increase in isoflavonoid pisatin content in pea pods treated with insect elicitor (Cooper
et al., 2005). However, the direct verification of the correct function of CYP93C18 by
means of heterologous expression, has never been reported.
In the present work, a succesful pilot study with IFS from Pisum sativum L.
(CYP93C18) has been carried out. The CYP93C18 was identified, cloned using
GatewayTM technology and introduced into the model plant Arabidospsis thaliana (L.)
Heynh. ecotype Col-0.
Concerning our and Cooper´s CYP93C18 protein sequence, the nine differences
discovered – all of which were upstream the intron – can be ascribed to a genomic
polymorphism of individual varieties of Pisum sativum L., as well as to possible
sequentional errors in our and/or Cooper´s sequence (our sequence was sequenced 3
times from both 5´and 3´ends). Moreover, a multiple alignment of our CYP93C18 with
all 30 known isoflavone synthase genes, including that described by Cooper (P450
Engineering database, University of Stuttgart), revealed that five of the mismatched
amino-acids in our sequence corresponded to the consensus; three of the mismatches in
Cooper´s sequence corresponded to the consensus; and both in Cooper’s case and in
ours, there was a mismatch at position 155 that did not correspond to the consesus.
These findings support the polymorphism theory, and thus the mismatches are unlikely
to be attributable to sequentional errors. In any case, the ascertained mismatches were
not localised in the catalytic centre of the enzyme and did not include the conserved
amino-acid residues Ser 310, Lys 375 and Leu 371, critical for aryl migration (Sawada
et al., 2002; Sawada and Ayabe, 2005). Thus they have no influence over the
localization and function of IFS, as was subsequently demonstrated in the present study.
In our work it was experimentaly proved that CYP93C18 gene is present in the
transgenic Arabidopsis genome, and this gene was transcribed under the constitutive
promoter CaMV35S, as confirmed by means of RT-PCR.
However, the proof of the correct gene expression, i.e. detection of CYP93C18
protein using western blot analysis, is sligthly controversial because of the fact that no
85
descrete band of the IFS appeared – due to non-specificity of the antibody used. The
CYP93C18-specific antibody conjugated with KLH, was designed in accordance with
Yu et al. (Yu et al., 2000), who immunochemically detected the soybean IFS in
microsomes prepared from transgenic tobacco leaves (IFS is known as a membrane-
bound protein). The identical antibody was also employed for the same purpose in the
study by Indu Jaganath (Jaganath, 2005), in which she attempted to detect the soybean
IFS in both total and membrane proteins, from the leaves of transgenic Arabidopsis Col-
0. As in the case of our work, she observed strong cross-reactivity of the antibody with
proteins of various molecular sizes, although the IFS of 59 kDa in the protein extracts
from soybean (a positive control) was clearly detected. In our case, the antibody bound
to various proteins both from transgenic Arabidopsis and control plants (Pisum and
wild-type Arabidopsis).
There are several explanations for this phenomenon: (1) The total protein
extract, but not the membrane protein extract, was examined. The amount of protein
which could cross-react was thus increased. Moreover, the prominent component of the
leaf total protein extract is Rubisco large subunit of 55 kDa, whose preponderance in a
sample could “overlay“ some non-abundant proteins, amongst which might also be the
IFS. (2) The primary polyclonal antibody was produced in an immunised rabbit, and
rabbits, being herbivorous animals, can often produce antisera displaying non-specific
background reaction against plant antigens (Oulehlová et al., 2009). (3) Peptides similar
to that chosen by us for antibody design, can be found in a small number of other plant
cytochromes P450, even though none of these peptides are identical to ours. (4) Most
probably, polyclonal antibodies against the KLH:peptide conjugate can cross-react with
various plant antigens in western-blot analysis, thus causing the non-specificity of the
immunodetection (Oulehlová et al., 2009). This system seems to be unsuitable when a
particular protein from Arabidopsis or from Pisum is to be detected. Apart from this, the
visualisation system of the secondary Anti-rabbit IgG conjugated with alkaline
phosphatase, was found to be less than ideal, as it is almost impossible to gain a
sufficiently distinct digital image of the weakly-visualised proteins.
HPLC-MS analysis of the metabolites, however, was more relevant, as it
provided the key proof of the correct function of CYP93C18 in the transgenic
Arabidopsis. Compared to the 15 isoflavonoid standards, isoflavonoids genistein and
tectorigenin were detected in the shoots and seeds of transgenic Arabidopsis,
respectively, whereas no isoflavonoids were found in the wild-type Arabidopsis. The

86
latter finding reflects the fact that the gene orthologous to isoflavone synthase is not
present within the Arabidopsis genome. Interestingly, the transformed Arabidopsis was
able to produce small amounts of isoflavonoids without any previous stress induction
such as UV-B treatment (Yu et al., 2000) or elicitation with yeast extract (Akashi et al.,
1999), which are known to activate the phenylpropanoid pathway and increase the
levels of isoflavonoids and of their precursor naringenin.
The present study thus provides evidence that:
(1) CYP93C18 is a functional isoflavone synthase. Although only small traces of
genistein and tectorigenin could be detected in IFS-transformed Arabidopsis, their
presence was indisputable.
(2) Arabidopsis is an appropriate plant-expression system, which disposes the IFS
substrate naringenin. The elimination of water to yield isoflavones from 2-
hydroxyisoflavanone is likely to be spontaneous; or the dehydratation could possibly be
catalysed by 2-hydroxyisoflavanone dehydratase (Akashi et al., 2005), although no
evidence of the presence of this enzyme in non-leguminous species has hitherto been
reported, as far as we are aware. Moreover, isoflavone-modifying enzymes, namely
hydroxylase and O-methyltransferase, clearly had to be present and be able to recognise
the novel substrate genistein, as indicated by the presence of tectorigenin (4´,5,7-
trihydroxy-6-methoxyisoflavone). Our results also indicate that the introduced IFS
successfully competed with the endogenous enzymes involved in flavonoid
biosynthesis, which also utilize the flavanon substrate naringenin – for instance,
flavanone-3-hydroxylase or flavone synthase (Yu and McGonigle, 2005). Moreover, the
surprising presence of the methylated isoflavonoid tectorigenin, a well-known anti-
cancerogenic isoflavonoid (Thelen et al., 2005), is to the best of our knowledge reported
here for the first time.
(3) Our simple methodology is thus applicable to the exploration of the function of
newly-identified genes for IFS from various species.
5.3. IFS is localised on the membrane of the endoplasmic reticulum
In addition, the predicted N-terminal signal peptide of CYP93C18, and
thereby the latter´s ER localization, were verified by means of transient expression of
CYP93C18::GFP in the tobacco leaves, where the GFP signal appeared on the
endoplasmic reticulum, as predicted. This result is consistent with the concept of
isoflavonoid metabolone (Yu and McGonigle, 2005), where membrane-bound IFS

87
ensures the correct metabolic channelling by interacting with enzymes upstream and
downstream in the pathway. It is encouraging to note that a result similar to ours
appears to have been obtained by Liu and Dixon (2001), albeit with IFS cDNA from
Medicago truncatula overexpressed in Alfalfa seedlings.
Our results, however, contrast with the conclusions reached by Indu Jaganath
(cited by Crozier et al., 2006), who failed in her attempt to engineer the genistein
metabolic pathway into Arabidopsis Col-0 using soybean IFS. One of the possible
explanations they suggested for this failure entails considerations of subcellular
localisation. Accordingly, the introduced IFS was transcribed in high levels but
genistein was not produced, due to the potential mislocalisation of IFS into the
cytoplasm instead of the ER membrane. This explanation was consistent with the fact
that IFS was not detected by western-blot analysis of membrane bound proteins from
transgenic lines. The question then arises as to why the IFS examined by them might
have been incorrectly localised in the transgenic plants, whereas our IFS, as well as
those by other investigators (Jung et al., 2000; Yu et al., 2000 and others), were indeed
correctly embedded in the membrane.
The manner in which the IFS is attached to the ER membrane is still not entirely
clear. It is generally acknowledged that membrane-bound P450s have their N-terminal
signal sequence anchored in the membrane, and hydrophobic residues in the F-G loop
associated with the cytosolic side of the ER membrane (Boudry et al., 2006). Other
possible interaction domains, such as segments before and after the A-helix, and amino-
acid resudues in β strand 2-2, were also described (Williams et al., 2000).
Our in silico predictions involving isoflavone synthase and the model generated
are consistent with the above-mentioned features of the membrane-bound P450s. In a
manner analogous to Dai et al., who constructed a model of mammalian P450 2B1 and
clarified its mode of the attachement to the endoplasmic reticulum membrane (Dai et
al., 1998), we propose a similar mode of IFS membrane insertion. N terminus was
predicted as the only transmembrane domain of the protein. Additional hydrophobic
regions, localised on the same protein face as the N terminus and protruding from the
protein surface, could be found within the F-G loop, the pre-A region as well as in the β
sheet 2-2. This proposed IFS membrane association, however, remains to be confirmed,
by means of the methods of structural biology.

88
6. CONCLUSIONS
The present masters thesis dealt with the genetic background of the biosynthesis
of plant secondary metabolites – isoflavonoids, specifically with the genes for the
isoflavone synthase (IFS) – a key enzyme in the isoflavonoid biosynthetic pathway.
On the basis of the current state of knowledge, it was attempted to identify
isoflavone synthase genes in 33 species from 14 different families of non-leguminous
plants, using the PCR method with degenerate primers. In spite of considerable efforts,
no such gene was identified in this study. However, the method worked in the two
control leguminous species, Phaseolus vulgaris L. and Pachyrhizus tuberozus (Lam.)
Spreng., whose new complete genes for IFS, homologous to known IFS genes in
GenBank, were subsequently obtained. By way of future work, it will be appropriate to
confirm the correct function of these new genes by means of functional expression.
A pilot study with IFS from Pisum sativum L. (CYP93C18) was succesfuly
conducted. The CYP93C18 gene was identified, cloned and introduced into the
isoflavone pathway-free plant Arabidopsis thaliana, using GatewayTM technology. The
correct function of the gene was verified at four different levels and the most important
result to emerge was the detection of the isoflavonoids genistein and tectorigenin in the
transgenic Arabidopsis. The methodology used is thus applicable to the study of the
function of newly-identified genes for IFS from other species also.
In addition, CYP93C18::GFP fused proteins were transiently expressed in the
leaves of Nicotiana benthamiana, and the localisation of the GFP signal was observed
on the endoplasmic reticulum, using confocal microscopy. This was consistent with
data from the literature and with the in silico predictions. The mode of the attachement
of IFS to endoplasmic reticulum membrane as suggested in our model, however, still
remains to be experimentaly clarified using methods of structural biology.

89
7. REFERENCES
Ahmad V.U., Iqbal S., Nawaz S.A., Choudhary M.I., Farooq U., Ali S.T., Ahmad A., Bader S., Kousar F., Arshad S., Tareen R.B. (2006): Isolation of four new pterocarpans from Zygophyllum eurypterum (Syn. Z. atriplicoides) with enzyme-inhibition properties. Chem. Biodiversity 3: 996–1003.
Altschul S. F., Madden T.L., Schäffer A.A., Zhang J, Zhang Z., Miller W., Lipman D. (1997): Gapped BLAST and PSI-BLAST: a new generation of protein database search programs. Nucleic Acids Res. 25:3389-3402.
Akashi T., Aoki T., Ayabe S. (1999): Cloning and functional expression of a cytochrome P450 cDNA encoding 2-hydroxyisoflavanone synthase involved in biosynthesis of the isoflavonoid skeleton in licorice. Plant Physiol. 121: 821–828.
Akashi T., Sawada Y., Aoki T., Ayabe S. (2000): New Scheme of the Biosynthesis of Formononetin Involving 2,7,4'-Trihydroxyisoflavanone but Not Daidzein as the Methyl Acceptor. Biosci. Biotechnol. Biochem. 46: 2276-2279.
Akashi T., Aoki T., Ayabe S. (2005): Molecular and biochemical characterization of 2-hydroxyisoflavanone dehydratase. Involvement of carboxylesterase-like proteins in leguminous isoflavone biosynthesi. Plant. Physiol. 137:882–891 Ayabe S. and Akashi T. (2006): Cytochrome P450s in flavonoid metabolism. Phytochem. Rev. 5: 271-282. Baker N.A., Sept D., Joseph S., Holst M.J., McCammon J.A. (2001): Electrostatics of nanosystems: application to microtubules and the ribosome. Proc. Natl. Acad. Sci. USA 98:10037-10041
Baudry J., Rupasinghe S., Schuler M.A. (2006): Class-dependent sequence alignment strategy improves the structural and functional modeling of P450s. Protein Eng. Des. Sel. 19(8):345–353. Baumberger I.C., Fraefel N., Göttfert M., Hennecke H. (2003): New NodW- or NifA-Regulated Bradyrhizobium japonicum Genes. Molecular Plant-Microbe Interactions 16 (4): 342-351. Bendtsen J.D., Nielsen H., Von Heijne G., Brunak S. (2004): Improved prediction of signal peptides: SignalP3.0. J. Mol. Biol. 340:783-795.
Boker L.H., Van der Schouw Y.T., De Kleijn M.J.J., Jacques P.F, Grobbee D.E., Peeters P.H.M. (2002): Intake of Dietary Phytoestrogens by Dutch Women. J. Nutr. 132:1319-1328.
Boland M. and Donnelly D.M.X. (1998): Isoflavonoids and related compounds. Nat. Prod. Rep. 15(3): 241-260.
90
Bolanos-Vasquez M. and Werner D. (1997): Effects of Rhizobium tropici, R. etli, and R. leguminosarum bv. phaseoli on nod Gene-Inducing Flavonoids in Root Exudates of Phaseolus vulgaris. Mol. Plant-Microbe Inter. 10 (3): 339-346.
Boydston R., Paxton J.D., Koeppe D.E. (1983): Glyceollin: a site-specic inhibitor of electron transport in isolated soybean mitochondrion. Plant Physiol. 72: 151-155.
Broughton W.J., Jabbouri S., Perret X. (2000): Keys to Symbiotic Harmony. J. Bact. 182(20): 5641-5652.
Bryson K., McGuffin L.J., Marsden R.L., Ward J.J., Sodhi J.S., Jones D.T. (2005): Protein structure prediction servers at University College London. Nuc.l Acids Res. 33:W36-38 Brzezinski A. and Debi A. (1999): Phytoestrogens: the ‘natural’ selective estrogen receptor modulators? Eur. J. Obstet. Gynecol. Reprod. Biol. 85: 47–51. Buchanan B.B., Gruissem W., Jones. R.L. (2002): Biochemistry & molecular biology of plants. American Society of Plant Physiologists, 1304-1306. Clough S.J., Bent A.F. (1998): Floral dip: a simplified method for Agrobacterium-mediated transformation of Arabidopsis thaliana. Plant. J. 16(6):735-743. Cooper E.J. (2004): Multiple responses of rhizobia to flavonoids during legume root infection Adv. Bot. Res. 41: 1–62. Cooper L.D., Doss R.P., Price R., Peterson K., Olivern J.E. (2005): Application of Bruchin B to pea pods results in the up-regulation of CYP93C18, a putative isoflavone synthase gene, and an increase in the level of pisatin, an isoflavone phytoalexin. J. Exp. Bot. 56 (414):1229–1237. Cornwell T., Cohick W, Raskin I. (2004): Dietary phytoestrogens and health. Phytochem. 65: 995–1016. Crombie L. (1984): Rotenoids and their Biosynthesis. Nat. Prod. Rep. 1: 1-19.
Crozier A, Jaganath IB, Clifford MN (2006): Phenols, Polyphenols and Tannins: An Overview. In: Plant Secondary Metabolites: Occurrence, Structure and Role in the Human Diet, Blackwell Publishing Ltd., 1-24.
Crozier A., Jaganath I.B., Clifford M.N. (2009): Dietary phenolics: chemistry, bioavailability and effects on health. Nat .Prod. Rep. 26:1001–1043 Cunningham S., Kollmeyer W.D., Stacey G. (1991): Chemical control of interstrain competition for soybean nodulation by Bradyrhizobium japonicum. Appl. Environ. Microbiol. 57: 1886-1892.
91
Dai R, Pincus MR, Friedman FK (1998): Molecular Modeling of Cytochromes P450 2B1: Mode of membrane insertion and substrate specifity. J. Protein Chem. 17(2):121-129.
Dakora F.D. and Phillips D.A. (1996): Diverse functions of isoflavonoids in legumes transcend anti-microbial definitions of phytoalexins. Physiol. Mol. Plant Pathol. 49: 1-20.
Deavours B.E. and Dixon R.A. (2005): Metabolic Engineering of Isoflavonoid Biosynthesis in Alfalfa. Plant Physiol 138:2245-2259 Demmig-Adams B. and McCauley L. (2005): Breast cancer, estrogen, soy genistein, and other dietary factorsTowards an understanding of their mechanistic interactions. Nutrition & Food Science 35 (1): 35-42. Dhaubhadel S., Farhangkhoee M. and Chapman R. (2008): Identification and characterization of isoflavonoid specific glycosyltransferase and malonyltransferase from soybean seeds. J. Exp. Bot. 59(4): 981-994.
Dhaubhadel S., McGarvey B.D., Williams R., Gijzen M. (2003): Isoflavonoid biosynthesis and accumulation in developing soybean seeds. Plant Mol.Biol. 53(6): 733-743(11). Dixon R.A, Harrison M.J, Paiva N.L. (1995): The isoflavonoid phytoalexin pathway: from enzymes to genes to transcription factors. Physiologia Plantarum 93: 385-392. Dixon R.A. (2005): Engineering of plant natural products pathways. Current oppinion in Plant Biology 8: 329-336. Dixon R.A. and Steele C.L. (1999): Flavonoids and isoflavonoids-a gold mine for metabolic engineering. Trends in plant science 4 (10): 394-400.
Duffy C., Perez K., Partridge A. (2007): Implications of phytoestrogen intake for breast cancer. CA Cancer J. Clin. 57:260-277. Eisenhaber B., Bork P., Eisenhaber F. (1998): Sequence properties of GPI-anchored proteins near the omega-site: constraints for the polypeptide binding site of the putative transamidase. Protein Eng. Des. Sel. 11(12):1155-1161.
Eswar N., Marti-Renom M. A., Webb B., Madhusudhan M. S., Eramian D., Shen M., Pieper U., Sali A. (2006): Comparative Protein Structure Modeling With MODELLER. Cur. Prot. Bioinf., John Wiley & Sons, Inc., Supplement 15, 5.6.1-5.6.30
Feng J., Li Q., Hu H.-L., Chen X-C., Hong G.-F. (2003): Inactivation of the nod box distal half-site allows tetrameric NodD to activate nodA transcription in an inducer-independent manner. Nucleic Acids Res. 31(12): 3143-3156.
Fisher R.F. and Long S.R. (1993): Interactions of NodD at the nod Box: NodD binds to two distinct sites on the same face of the helix and induces a bend in the DNA. J.Mol.Biol. 233(3): 336-48.

92
Frank M. R., Deyneka J. M., Schuler M. A. (1996): Cloning of Wound-Induced Cytochrome P450 Monooxygenases Expressed in Pea. Plant physiol. 110 (3): 1035-1046.
Gavaler J.S., Rosenblum E.R., Van Thiel D.H., Eagon P.K., Pohl C.R., Campbell I.M., Gavaler J. (1987): Biologically active phytoestrogens are present in bourbon. Alcohol Clin. Exp. Res 11:399-406.
Geigert J., Stermitz F. R., Johnson G., Maag D. D., Johnson D. K. (1973): Two phytoalexins from sugarbeet (Beta vulgaris) leaves. Tetrahedron
29 (18): 2703-2706.
Gnanamanickam S.S. (1979): Isolation of isoflavonoid phytoalexins from seeds of Phaseolus vulgaris L. Experimentia 35:323. Gnanamanickam S.S. and Mansfield J.W. (1981): Selective toxicity of wyerone and other phytoalexins to gram-positive bacteria. Phytochem. 20 (5): 997-1000.
Graham T.L. (1991): Flavonoid and isoflavonoid distribution in developing soybean seedling tissues and in seed and root exudates. Plant Physiol. 95: 594-603.
Hakamatsuka T., Hashim M.S., Ebizuka Y., Sankawa U. (1991): P-450-dependent oxidative rearrangement in isoflavone biosynthesis: reconstitution of P-450 and NADPH:P450 reductase. Tetrahedron 47: 5969-5978.
Hakamatsuka T., Mori K., Ishida S., Ebizuka Y. , Sankawa U. (1998): Purification of 2-Hydroxyisoflavanone Dehydratase from the Cell Cultures of Pueraria Lobata in Honour of Professor G. H. Neil Towers 75TH Birthday. Phytochem. 49 (2): 497-505.
Haseloff J., Siemering K.R., Prasher D.C., Hodge S. (1997): Removal of a cryptic intron and subcellular localisation of green fluorescent protein are required to mark transgenic Arabidopsis plants brightly. Proc. Natl. Acad. Sci. USA 94:2122–2127. Hashim M.F., Hakamatsuka T., Ebizuka Y., Sankawa U. (1990): Reaction mechanism of oxidative rearrangement of flavanone in isoflavone biosynthesis. FEBS Lett 271(1-2): 219-222.
Hofmann K., Stoffel W. (1993): TMbase - A database of membrane spanning proteins segments. Biol. Chem. Hoppe-Seyler 374:166. Hu H., Liu S., Yang Y., Chang W., Hong G. (2000): In Rhizobium leguminosarum, NodD represses its own transcription by competing with RNA polymerase for binding sites. Nucleic Acids Res. 28(14): 2784-2793.
Jacobs M. and Rubery P.H. (1988): Naturally Occurring Auxin Transport Regulators. Science 341 (4863): 346-349.
Jaganath I.B. (2005): Dietary flavonoids: bioavailabilty and biosynthesis. PhD thesis, University of Glasgow.
93
Jung W., Yu O., Lau S.C., O´Keefe D., Odell J., Fader G. McGonigle B. (2000): Identification and expression of isoflavone synthase, the key enzyme for biosynthesis of isoflavones in legumes. Nat. Biotechnol. 18: 208–212.
Junghans H., Dalkin K., Dixon R.D. (1993): Stress responses in alfalfa (Medicago sativa L.).15. Characterization and expression patterns of members of a subset of the chalcone synthase multigene family. Plant Mol. Biol. 22: 239-253.
Kim B.G., Kim S-Y., Song H.S., Chan Lee CH., Hur H-G., Kim S-I., Ahn J.H. (2003): Cloning and Expression of the Isoflavone Synthase Gene (IFS-Tp) from Trifolium pratense. Mol. Cells 15 (3): 301-306. Kim S.T., Cho K.S., Yu S., Kim S.G., Hong J.C., Han C., Bae D.W., Nam M.H., Kang K.Y. (2003): Proteomic analysis of differentially expressed proteins induced by rice blast fungus and elicitor in suspension-cultured rice cells. Proteomics 3: 2368–2378. Koblovská R., Kokoška L., Klejdus B., Lapčík O. (2006): Isoflavonoids in the Cannabaceae family (abstract). Planta Med. 72: 1027. Kochs G. and Grisebach H. (1986): Enzymic synthesis of isoflavones.Eur. J.Biochem.155(2): 311-318. Kuanar S.K. (2006): 5-hydroxy 6,2 '-dimethoxy isoflavone 7-O-beta-D-galacotopyranoside from the stem bark of antirheumatic plant Liriodendron tulipifera Linn. Asian J.Chem. 18 (4): 3126-3128. Kuiper G.G.J.M., Lemmen J.G., Carlsson B. (1998): Interaction of estrogenic chemicals and phytoestrogens with estrogen receptor β. Endocrinol. 139: 4252–4263. Kurzer M.S. and Xu X. (1997): Dietary phytoestrogens. Annu. Rev. Nutr. 17:353-81. Lackhan N.K . (1994): Investigations on in vitro production of rotenone using Pachyrhizus erosus (L.) Urban. MPh thesis, University of St. Augustine. Lania-Pietrzak B., Hendrich A.B., Zugaj J., Michalak K. (2005): Metabolic O-demethylation does not alter the influence of isoflavones on the biophysical properties of membranes and MRP1-like protein transport activity. Arch. Biochem. Biophys. 433(2): 428-34. Lapčík O. (2004): Endocrinological aspects of dietary habits. Czech J.Food Sci. 22: 29-38. Lapčík O. (2007): Isoflavonoids in non-leguminous taxa: A rarity or rule? Phytochem. 68 (22-24): 2909-2916. Lapčík O., Hill M., Černý I., Lachman J., Al-Maharik N., Adlercreutz H., Hampl R. (1999): Immunoanalysis of isoflavonoids in Pisum sativum and Vigna radiata. Plant Sci.148: 111–119.
94
Lapčík O., Hill M., Hampl R., Wähälä K., Adlercreutz H. (1998): Identification of isoflavonoids in beer. Steroids 63: 14–20. Lee J. and Hymowitz T. (2001): A molecular phylogenetic study of the subtribe
Glycininae (Leguminosae) derived from the chloroplast DNA rps16 intron sequences.
Amer. J. Bot. 88 (11): 2064–2073.
Li J.F., Park E., Von Arnim A.G., Nebenführ A. (2009): The FAST technique: a simplified Agrobacterium-based transformation method for transient gene expression analysis in seedlings of Arabidopsis and other plant species. Plant Methods doi:10.1186/1746-4811-5-6. Li Z.S., Alfenito M., Rea P.A., Walbot V., Dixon R.A. (1997): Vacuolar uptake of phytoalexin medicarpin by the glutation conjugate pump. Phytochem. 45 (4): 689-693 Liu R., Hu Y., Li J., Lin Z. (2007): Production of soybean isoflavone genistein in non-legume plants via genetically modified secondary metabolism pathway. Metab. Eng. 9(1): 1-7.
Macková Z., Koblovská R., Lapčík O. (2006): Distribution of isoflavonoids in non-leguminous taxa – An update. Phytochem. 67: 849–855. Mazur W. and Adlercreutz H.(1998): Natural and anthropogenic environmental oestrogens: the scientific basis for risk assessment. Naturally occurring oestrogens in food. Pure Appl. Chem. 70: 1759–1776. Mazur W. M., Wihala K., Rasku S., Salakka A., Hase T., Adlercreutz H. (1998): Lignan and isoflavonoid concentrations in tea and coffee Brit. J. Nutr. 79: 37-45. Meragelman T.L., Tucker K.D., McCloud T.G., Cardellina J.H., Shoemaker R.H. (2005): Antifungal flavonoids from Hildegardia barteri. J. Nat. Prod. 68: 1790–1792.
Misra P., Pandey A., Tewari S.K., Nath P., Trivedi P.K. (2010): Characterization of isoflavone synthase gene from Psoralea corylifolia: a medicinal plant. Plant Cell Rep. 29 (7):747-755.
Mousavi Y. and Adlercreutz H. (1993): Genistein is an effective stimulator of sex hormone-binding globulin production in hepatocarcinoma human liver cancer cells and suppresses proliferation of these cells in culture. Steroids 58(7): 301-304.
Nakagawa T., Kurose T., Hino T., Tanaka K., Kawamukai M., Niwa Y., Toyooka K., Matsuoka K., Jinbo T., Kimura T. (2007): Development of series of gateway binary vectors, pGWBs, for realizing efficient construction of fusion genes for plant transformation. J. Biosci. Bioeng. 104(1): 34-41 Nakamura Y., Tsuji S., Tonogai Y. (2000): Determination of the levels of isoflavonoids in soybeans and soy-derived foods and estimation of isoflavonoids in the Japanese daily intake. J. AOAC Int. 83(3): 635-650 Nelson D.R., Kamataki T., Waxman, D.J. Guengerich F.P., Estabrook R.W., Feyereisen R., Gonzalez F.J., Coon M.J., Gunsalus I.C., Gotoh O., Okuda K.,

95
Nebert D.W. (1993): The P450 superfamily: update on new sequences, gene mapping, accession numbers, early trivial names of enzymes and nomenclature. DNA and Cell Biol. 12: 1- 51. Nelson R.A. (2009): The Cytochrome P450 Homepage. Human Genomics 4: 59-65.
Ososki A.L. a Kennelly E.J. (2003): Phytoestrogens: a Rewiev of Present State of research. Phytoter. Res. 17: 845-869. Oulehlová D., Hála M., Potocký M., Žárský V., Cvrčková F. (2009): Plant antigens cross-react with rat polyclonal antibodies againstKLH-conjugated peptides. Cell Biol. Internat. 33:113-118
Overkamp S., Hein F., Barz W. (2000): Cloning and characterization of eight cytochrome P450 cDNAs from chickpea (Cicer arietinum L.) cell suspension cultures. Plant Sci. 12 (155):101-108.
Parniske M., Ahlborn B., Werner D. (1991): Isoflavonoid-inducible resistance to the phytoalexin glyceollin in soybean rhizobia. J.Bacteriol. 173: 3432-3439.
Pettersen E.F., Goddard T.D., Huang C.C., Couch G.S., Greenblatt D.M., Meng E.C., Ferrin T.E. (2004): UCSF Chimera--a visualization system for exploratory research and analysis. J Comput Chem 25(13):1605-1612.
Ravichandran K.G., Boddupalli S.S., Hasemann C.A., Peterson J.A., Deisenhofer J. (1993): Crystal structure of hemoprotein domain of P450BM-3, a prototype for microsomal P450s. Science 261: 731-736.
Reynaud J., Guilet D., Terreux R., Lussignol M., Walchshofer N. (2005): Isoflavonoids in non-leguminous families: an update. Nat. Prod. Rep. 22: 504–515.
Rosenblum E.R., Campbell I.M., Van Thiel D.H., Gavaler J.S. (1992): Isolation and identification of phytoestrogens from beer. Alcohol Clin. Exp. Res. 16: 843-845.
Sakakibara H., Honda Y., Nakagawa S., Ashida H., Kanazawa K. (2003): Simultaneous Determination of All Polyphenols in Vegetables, Fruits, and Teas. J.Agric. Food Chem. 51: 571-581.
Sali A. and Blundell T.L. (1993): Comparative protein modelling by satisfaction of spatial restraints. J. Mol. Biol. 234(3): 779-815 Savoure A., Magyar Z., Pierre M., Brown S., Schultze M., Dudits D., Kondorosi A., Kondorosi E. (1994): Activation of the cell cycle machinery and the isoflavonoid biosynthesis pathway by active Rhizobium meliloti Nod signal molecules in Medicago microcallus suspensions. EMBO J. 13:1093-1102. Sawada Y., Kinoshita K., Akashi T., Aoki T., Ayabe S. (2002): Key amino acid residues required for aryl migration catalysed by the cytochrome P450 2-hydroxyisoflavanone synthase. Plant J. 31: 555–564. Sawada Y. and Ayabe S. (2005): Multiple mutagenesis of P450 isoflavonoid synthase reveals a key active-site residue. Biochemical and Biophysical Research Communications 330: 907–913.

96
Shih Ch-H., Chen Y., Wang M., Chu I.K., Lo C.( 2008): Accumulation of Isoflavone Genistin in Transgenic Tomato Plants Overexpressing a Soybean Isoflavone Synthase Gene. J. Agric. Food Chem. 56(14): 5655-61. Schwab W. (2003): Metabolome diversity: too few genes, too many metabolites? Phytochem. 62: 837–849. Siminszky B., Corbin F.T., Ward E.R., Fleischmann T.J., Dewey R.E. (1999): Expression of a soybean cytochrome P450 monooxygenase cDNA in yeast and tobacco enhances the metabolism of phenylurea herbicides. Proc. Natl. Acad. Sci. U.S.A. 96 (4): 1750-1755.
Sreevidya V.S., Rao S.C., Sullia S.B., Ladha J.K., Reddy P.M. (2006): Metabolic engineering of rice with soybean isoflavone synthase for promoting nodulation gene expression in rhizobia. J. Exp. Botany 57: 1957-1969.
Steele C.L., Gijzen M., Qutob D., Dixon R.A. (1999): Molecular characterization of the enzyme catalyzing the aryl migration reaction of isoflavonoid biosynthesis in soybean. Arch. Biochem. Biophys. 367,146–150.
Subramanian S., Stacey G., Yu O. (2006): Endogenous isoflavonoids are essential for the establishment of symbiosis between soybean and Bradyrhizobium japonicum. Plant J. 48(2): 261-273.
Subramanian S., Stacey G., Yu O. (2007): Distinct, crucial roles of flavonoids during legume nodulation. Trends in Plant Science 12 (7) 282-285
Thelen P., Scharf J.G. , Burfeind P., Hemmerlein B., Wuttke W., Spengler B. , Christoffel V., Ringert R.H., Seidlová-Wuttke D. (2005): Tectorigenin and other phytochemicals extracted from leopard lily Belamcanda chinensis affect new and established targets for therapies in prostate cancer. Carcinogenesis 26(8): 1360-1367.
VanEtten H. D., Mansfield J. W., Bailey J. A., Farmer E.E. (1994): Two Classes of Plant Antibiotics: Phytoalexins versus "Phytoanticipins" . Plant Cell 6: 1191-1192.
Veitch N. (2007): Isoflavonoids of the Leguminosae. Nat. Prod. Rep. 24: 417–464.
Wang S., Ghisalberti E.L., Ridsdill-Smith J. (1998): Bioactive isoflavonols and other Components from Trifolium subterraneum. J. Nat. Prod. 61: 508-510.
Wang W., Vignani R., Scali M., Crest M. (2006): A universal and rapid protocol for protein extraction from recalcitrant plant tissues for proteomic analysis. Electrophoresis 27(13): 2782 – 2786. Weigel D. and Glazebrook J. (2002): Arabidopsis. A laboratory handbook. Cold Spring Harbor Laboratory Press, Cold Spring Harbor, New York.

97
Williams P.A., Cosme J., Sridhar V., Johnson E.F., McRee D.E. (2000): Mammalian microsomal cytochrome P450 monooxygenase: structural adaptations for membrane binding and functionaldiversity. Mol. Cell. 5:121-131. Winkel-Shirley B. (2001): Flavonoid Biosynthesis. A Colorful Model for Genetics, Biochemistry, Cell Biology, and Biotechnology. Plant physiol. 126: 485-493. Yu O. and McGonigle B. (2005): Metabolic engineering of isoflavone biosynthesis. Adv. Agr. 86: 147-190.
Yu O., Jung W., Shi J., Croes R.A., Fader G.M., McGonigle B., Odell J.T. (2000): Production of the isoflavones genistein and daidzein in non-legume dicot and monocot tissues. Plant Physiol. 124(2): 781-94.