ism 270 service engineering and management. ism 270: service engineering and management focus on...
Post on 19-Dec-2015
216 views
TRANSCRIPT

ISM 270
Service Engineering and Management
ISM 270: Service Engineering and Management
Focus on Operations Decisions in the Service Industry
Open to students with an undergraduate engineering/science degree
Learn analytical tools and software for decision making
Featuring guest lectures from industry practitioners
Text: Fitzsimmons & Fitzsimmons ‘Service Management’ Operations, Strategy, Information Technology

Topics covered
The nature of service enterprises Strategy for new service development
Technology in services Quality in service encounters Forecasting demand Managing service capacity Supply chains in services Globalization and outsourcing

Skills / Tools LearnedProgramming Tools• Spreadsheet Programming• Optimization Solvers• Littlefield Management Simulation
Analytical Methods• Linear Programming• Data Envelopment Analysis• Statistics for Forecasting• Capacity Management and Queueing Theory• Project Management Under Uncertainty• Theory of Service Supply Chains
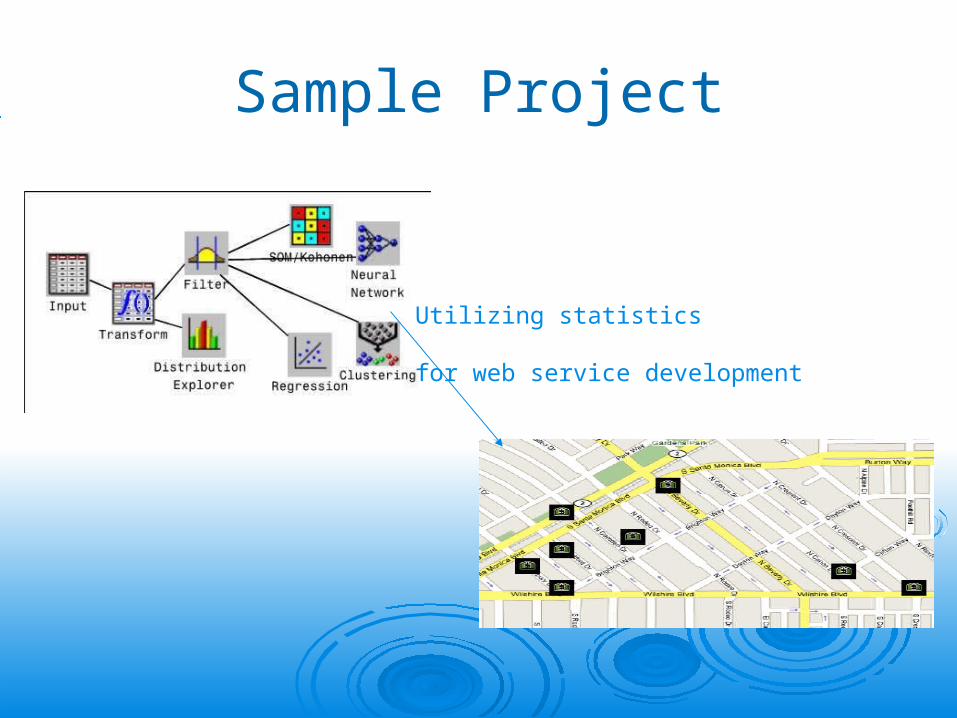
Sample Project
Utilizing statistics
for web service development
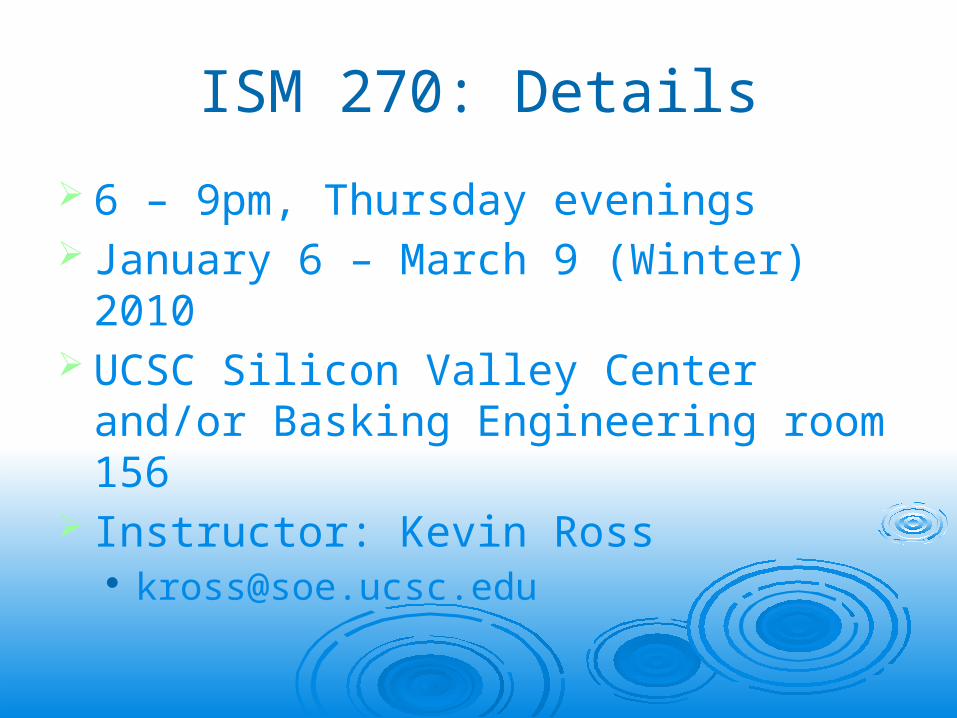
ISM 270: Details
6 – 9pm, Thursday evenings January 6 – March 9 (Winter) 2010 UCSC Silicon Valley Center and/or
Basking Engineering room 156 Instructor: Kevin Ross

Who is here?
My background Brief introductions, student survey

Logistics
Location Class website Readings Text book Office hours
5-6pm before class, or by appointment Fee for Simulation Game (~$20)
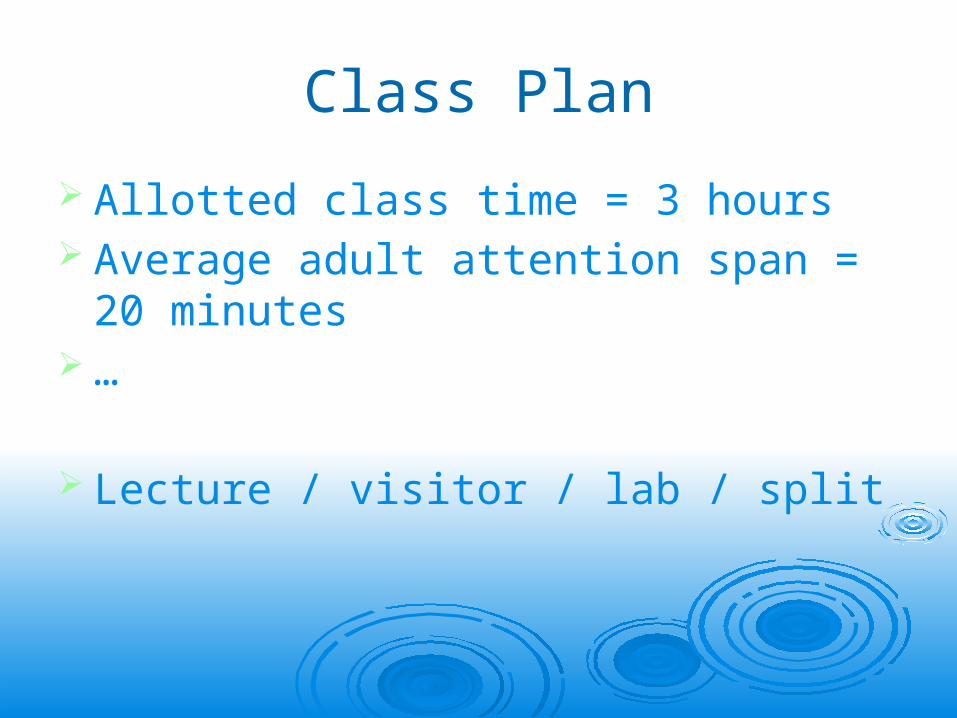
Class Plan
Allotted class time = 3 hours Average adult attention span = 20 minutes …
Lecture / visitor / lab / split
Computer issues
Who has a laptop? Web access Finding research papers Excel, solver, …

Please…
Bring: Paper, pen, laptop, … Opinions Questions Interesting articles, stories, anecdotes
Provide feedback!!! Make every effort to keep up with readings
etc.

ScheduleClass Date Text Chapters Topic Guest
SpeakerAssessment
1Jan 6 1, 2 The nature of service
enterprises
2Jan 13 3, 4 Strategy for new service
developmentPaul Maglio
3Jan 20 5 Technology in services Geoff Ryder Homework 1 due
4Jan 27 6,7, 8, 9 Quality in service
encountersHomework 2 due
5Feb 3 10 Project Management Anne
RobinsonProject Assigned
6Feb 10 11 Forecasting demand Vijay Mehrotra Homework 3 due
7Feb 17 12, 13, 14 Managing service
capacityProject Proposal Due
8Feb 24 15, 16 Supply chains in services Charles Ng Homework 4 due
9Mar 2 Littlefield
TechnologiesService Management Game Challenge
Homework 5 due
10Mar 9 17 Globalization and
outsourcingFinal Project Report due

Assessment
Assessment Value Due Date
Homework 50% Weekly
Simulation Projects
10% Feb 24
Final Project 40% March 9

Sample Previous homework: Applying the Excel solver tool for data
envelopment analysis (DEA)
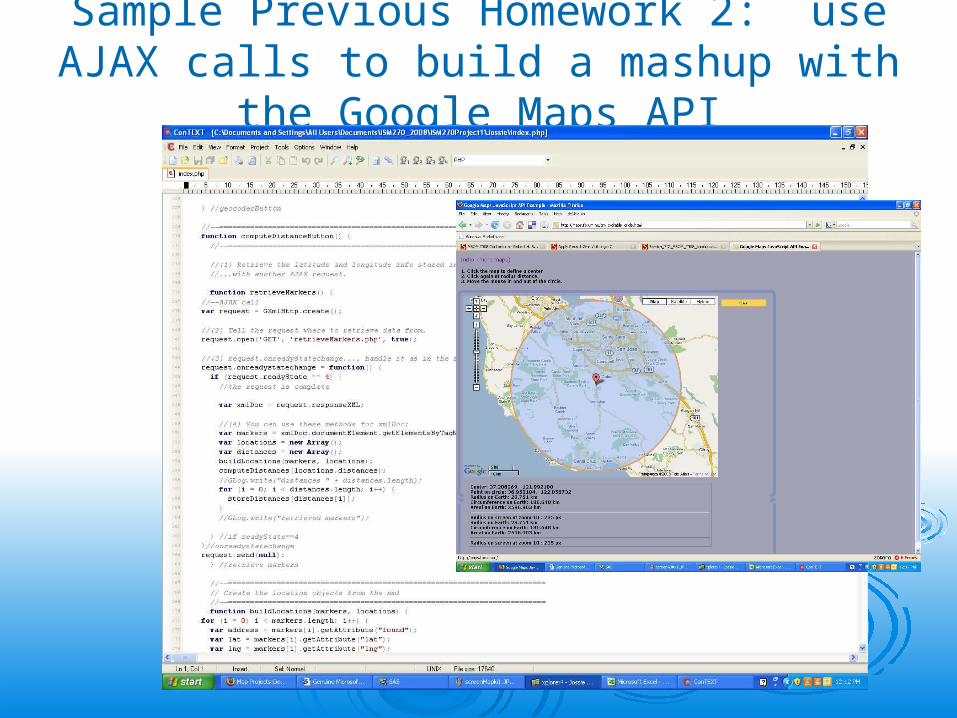
Sample Previous Homework 2: use AJAX calls to build a mashup with the Google Maps API

Sample Previous Homework 3: learn to use SAS Enterprise Miner

Project
More details later…
Focus on new service development
Written and Verbal Presentation at final class March 9

Questions and Break

Remaining in Lecture 1
Services in the Economy
Data Envelopment Analysis Linear Programming Excel

Perspective
World-wide trends
Personalization trends

Text Chapter 1:Role of Services in an
EconomyService Management
Professor James Fitzsimmons
University of Texas at Austin

Quiz Question Name the top 10 USA companies by
revenue in 2010 How many would you describe as service
companies?

Top 10 Fortune 500
1 Wal-Mart Stores 408,214.0 14,335.02 Exxon Mobil 284,650.0 19,280.03 Chevron 163,527.0 10,483.04 General Electric 156,779.0 11,025.05 Bank of America 150,450.0 6,276.06 ConocoPhillips 139,515.0 4,858.07 AT&T 123,018.0 12,535.08 Ford Motor 118,308.0 2,717.09 J.P. Morgan Chase 115,632.0 11,728.010 Hewlett-Packard 114,552.0 7,660.0
Revenue ($m) Profit ($m)

Definitions
What are services?
Service enterprises?

Service DefinitionsIntangible goods?
Services are deeds, processes, and performances.Valarie Zeithaml & Mary Jo Bitner
A service is a time-perishable, intangible experience performed for a customer acting in the role of a co-producer.
James Fitzsimmons
Folks doing things for folks for MoneyPaul Magio
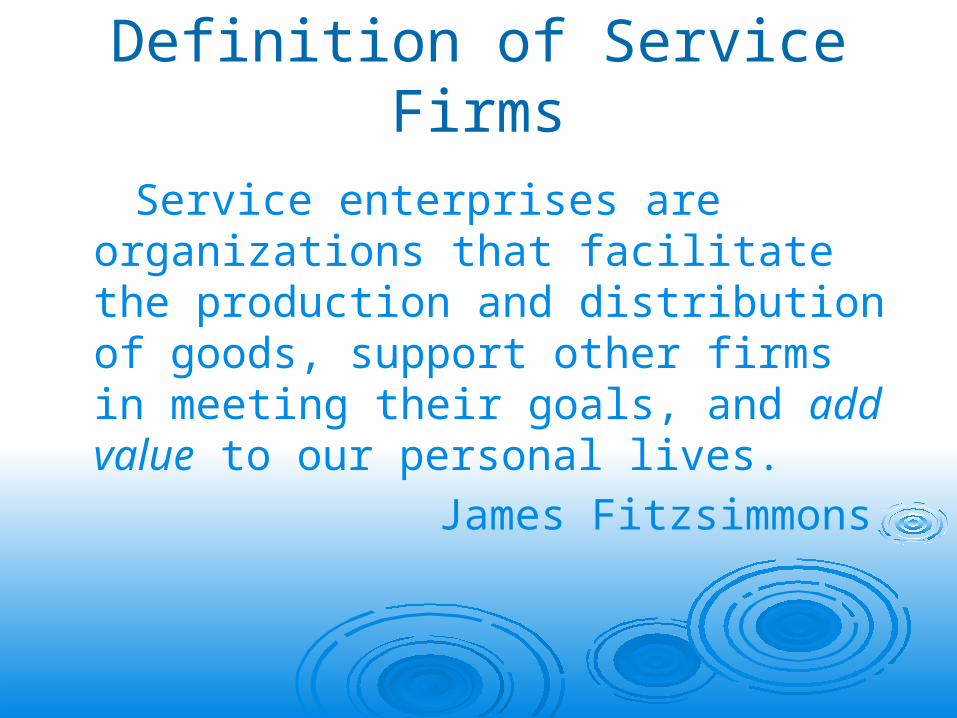
Definition of Service Firms
Service enterprises are organizations that facilitate the production and distribution of goods, support other firms in meeting their goals, and add value to our personal lives.
James Fitzsimmons

Services Science, Management and Engineering
…the application of science, management, and engineering disciplines to tasks that one organization beneficially performs for and with another
• (Wikipedia)

Role of Services in an Economy

Percent Employment in ServicesTop Ten Postindustrial Nations
Country 1965 1975 1985 1995 2005
United States 59.5 66.4 70.0 74.1 78.6
United Kingdom 51.3 58.3 64.1 71.4 77.0
The Netherlands 52.5 60.9 68.3 73.4 76.5
Sweden 46.5 57.7 66.1 71.5 76.3
Canada 57.8 65.8 70.6 74.8 76.0
Australia 54.6 61.5 68.4 73.1 75.8
France 43.9 51.9 61.4 70.0 74.8
Japan 44.8 52.0 57.0 61.4 68.6
Germany 41.8 n/a 51.6 60.8 68.5
Italy 36.5 44.0 55.3 62.2 65.5
1-29

Stages of Economic Activity
Primary (Extractive): Agriculture, Mining, Fishing, Forestry
Secondary (Goods-Producing): Manufacturing, Processing
Tertiary (Domestic Services): Restaurants, Hotels, Laundry, Maintenance
Quaternary (Trade and Commerce): Transportation, Communications, Retailing, Finance, Government
Quinary (Extending Human Potential): Health, Education, Research, Arts, Recreation
1-30

Trends in U.S. Employment by Sector
1850 1860 1870 1880 1890 1900 1910 1920 1930 1940 1950 1960 1970 1980 1990 20000
10
20
30
40
50
60
70
80
90
Service
Manufacturing
Agriculture
Year
Pro
po
rta
tio
n o
f to
tal
em
plo
ye
me
nt
1-31

Stages of Economic Development
Pre- Use of Standard dominant Human Unit of of Living Society Game Activity Labor Social Life Measure Structure Technology
Pre- Against Agriculture Raw Extended Sub- Routine Simple hand Industrial Nature Mining muscle household sistence Traditional tools
power Authoritative
Industrial Against Goods Machine Individual Quantity Bureaucratic Machines fabricated production tending of goods Hierarchical nature Post- Among Services Artistic Community Quality of Inter- Information industrial Persons Creative life in terms dependent Intellectual health, education, recreation
1-32

Percent Distribution of U.S. Employment by Industry
Construction 5%
Manufacturing 9%
Government 17%
Information 2%
Trade, transportation, and utilities 19%
Other services 4%
Financial activities 6%
Leisure and hospitality 10%
Educational and health 15%
Professional and business services 13%
1-33

Projected Percent Change in U.S. Employment by Industry
-20% -10% 0% 10% 20% 30%
Health care and social assistance
Professional and business services
Educational services
Financial services
Leisure and hospitality
Other services
Construction
Transportation and utilities
Information
State and local government
Retail and wholesale trade
Federal government
Agriculture and mining
Manufacturing
All Industry Average
1-34

Economic Evolution
Economy Agrarian Industrial Service Experience
EconomicOffering
Food Packagedgoods
Commodityservice
Consumer services
Businessservices
Function Extract Make Deliver Stage Co-create
Nature Fungible Tangible Intangible Memorable Effectual
Attribute Natural Standardized Customized Personal Growth
Method of Supply
Stored in bulk
Inventoried Delivered on demand
Revealed over time
Sustained over time
Seller Trader Producer Provider Stager Collaborator
Buyer Market Customer Client Guest Collaborator
Expectation Quantity Features Benefits Sensations Capability
1-35
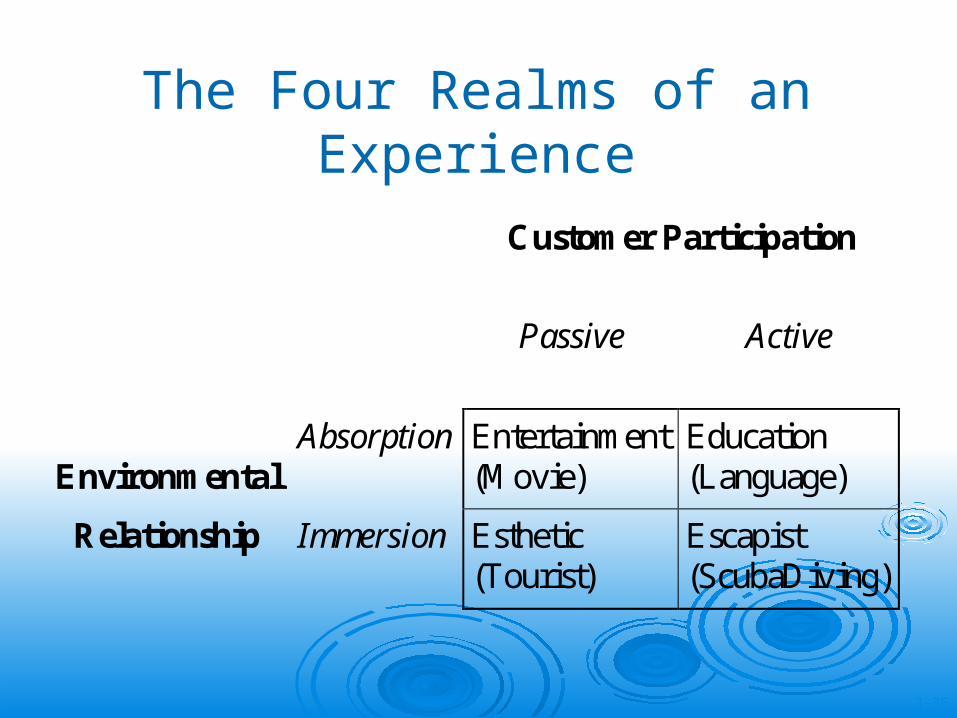
The Four Realms of an Experience
Customer Participation
Passive Active
Environmental
Absorption Entertainment (Movie)
Education (Language)
Relationship Immersion Esthetic (Tourist)
Escapist (ScubaDiving)
1-36

Experience Design Principles
Theme the Experience (Forum shops) Harmonize Impressions with Positive Cues
(O’Hare airport parking garage) Eliminate Negative Cues
(Cinemark talking trash containers) Mix in Memorabilia (Hard Rock T-shirts) Engage all Five Senses (Mist in Rainforest)
1-37

Typology of Services in the 21st Century
Core Experience Essential Feature Examples
Creative Present ideas Advertising, theater
Enabling Act as intermediary Transportation, communications
Experiential Presence of customer Massage, theme park
Extending Extend and maintain Warranty, health check
Entrusted Contractual agreement Service/repair, portfolio mgt.
Information Access to information Internet search engine
Innovation Facilitate new concepts R&D services, product testing
Problem solving Access to specialists Consultants, counseling
Quality of life Improve well-being Healthcare, recreation, tourism
Regulation Establish rules and regulations Environment, legal, patents
1-38

Source of Service Sector Growth Information Technology (e.g. Internet) Innovation
Push theory (e.g. Post-it) Pull theory (e.g. Cash Management) Services derived from products (e.g. Netflix)
Exploiting information (e.g. Auto part sales) Difficulty of testing service prototypes Changing Demographics
Aging of the population Two-income families Growth in number of single people Home as sanctuary
1-39

Distribution of GDP in the US Economy
Product Services
Physical
Information
6%
10%
31%
53%
37%
63%
84%16%
D
BA
C
1-40

Question:What has engineering got to do
with all of this?

Discussion Topics Describe the work that you do from a
service perspective Illustrate how the type of work you do
influences a person’s lifestyle.

Example Service Innovation: Disney World
Link

Lessons from Disney

Data Envelopment Analysis (DEA)
Method for evaluating efficiency of similar venues/products
Incorporates inputs and outputs – not just one dimensional
Uses LINEAR PROGRAMMING (LP)

Sample LP: Product Mix Problem
How much beer and ale to produce from three scarce resources:
480 pounds of corn 160 ounces of hops 1190 pounds of malt
A barrel of ale consumes 5 pounds of corn, 4 ounces of hops, 35 pounds of malt
A barrel of beer consumes 15 pounds of corn, 4 ounces of hops and 20 pounds of malt
Profits are $13 per barrel of ale, $23 for beer

Sample LP: Transportation Problem
A firm produces computers in Singapore and Hoboken.
Distribution Centers are in Oakland, Hong Kong and Istanbul
Supply, demand and costs summary:
Oakland Hong Kong
Istanbul Supply
Singapore 85 37 119 500Hohboken 53 189 94 300Demand 350 250 200

Other LP examples
Blending problem Diet problem Assignment problem

Key terms of LP
Variables Parameters Objective function Constraints

Standard Form(according to Hillier and Lieberman)
Njx
bxaxaxa
bxaxaxa
bxaxaxa
xcxcxc
j
MNMNMM
NN
NN
NN
..1,0
...
...
...
...
subject to
...max
2211
22222121
11212111
2211
0
subject to
max
x
bAx
xc
Concise version:
A is an m by n matrix: n variables, m constraints

Geometry of LP
Consider the plot of solutions to a LP
21
21
21
21
max
0,
1232
1553
xx
xx
xx
xx

Data Envelopment Analysis (DEA)
Method for evaluating efficiency of similar venues/products
Incorporates inputs and outputs – not just one dimensional
Uses LINEAR PROGRAMMING (LP) KEY IDEA:
Weight the inputs and outputs to make one unit as efficient as possible, relative to all others
If this is 100% efficient, then the unit is on the frontier of efficiency;
If less than 100%, there are other units that could utilize the SAME inputs for MORE outputs

DEA Example from Text: Burger Palace
Small, artificial example for illustration! Page 68 of 5th edition, text
Burger chain has six units in several cities Each unit uses different combination of labor
hours and dollars to produce meals Which units use their resources most
efficiently?

Productivity of Burger Palace Service Units
Service Unit
Meals Sold Labor Hours
Dollars
1 100 2 200
2 100 4 150
3 100 4 100
4 100 6 100
5 100 8 80
6 100 10 50

DEA summary of terms Define variables
E_k = efficiency of unit k u_j= coefficient for output j (relative decrease in efficiency per
unit reduction of output value) v_i = coefficient for input i (relative increase in efficiency per unit
decrease of input value) O_jk = observed ouput j units generated by service unit k during
one time period I_ik = no. units input used by service unit k during one period
Note: k=1..K = service unit counter j=1..M = output counter i=1..N = input counter

DEA Objective and constraints
Niv
Mju
KkIvIvIv
OuOuOu
ts
IvIvIv
OuOuOuE
i
j
NkNkk
MkMkk
NeNee
MeMeee
,...,2,1,0
,...,2,1,0
,...,1,1...
...
..
...
...max
2211
2211
2211
2211
Evaluating unit eTrick = Rescaling to get linear equations
KkIvIvIvOuOuOu
ts
IvIvIv
NkNkkMkMkk
NeNee
,...,1,0)...(...
..
1...
22112211
2211

Next Week
Paul Maglio
Strategy in Services