isiolo county 2016 long rains food …reliefweb.int/sites/reliefweb.int/files/resources/isiolo...
TRANSCRIPT

1
ISIOLO COUNTY
2016 LONG RAINS FOOD SECURITY ASSESSMENT REPORT
A joint report by the Kenya Food Security Steering Group (KFSSG)1 and the Isiolo County
Steering Group
July 2016
1 Evelyn Wangari Ng’ang’a (National Drought Management Authority), Simon Mwangi (World Food Program) and
Isiolo Technical County Steering Group (CSG)
2
TABLE OF CONTENTS
1.0 INTRODUCTION................................................................................................................ 3
1.1 County Background............................................................................................................ 3
2.0 COUNTY FOOD SECURITY SITUATION .................................................................... 3
2.1 Current Food Security Situation ......................................................................................... 3
2.2 Food Security Trends ......................................................................................................... 4
2.3 Rainfall Performance.......................................................................................................... 4
3.0 IMPACT OF RAINFALL PERFOMANCE, SHOCKS AND HAZARDS .................... 5
3.1 Crop Production ................................................................................................................. 5
3.2 Livestock production .......................................................................................................... 6
3.3 Water and Sanitation .......................................................................................................... 9
3.4 Markets and Trade ............................................................................................................ 10
3.5 Health and Nutrition ......................................................................................................... 12
4.0 FOOD SECURITY PROGNOSIS ......................................................................................... 15
4.1 Prognosis Assumptions .................................................................................................... 15
4.2 Food Security outcomes from August to October ............................................................ 16
4.3 Food Security Outcomes for November to January ......................................................... 16
5.0 CONCLUSION AND RECOMMENDATIONS .................................................................. 17
5.1 Conclusion ........................................................................................................................ 17
5.2 Summary of Recommendations ....................................................................................... 17
5.3 Sub-County Ranking ........................................................................................................ 18
6.0 ANNEXES ............................................................................................................................... 18
6.1 On-going Interventions by Sector .................................................................................... 18
6.2 Proposed Intervention ...................................................................................................... 20
3
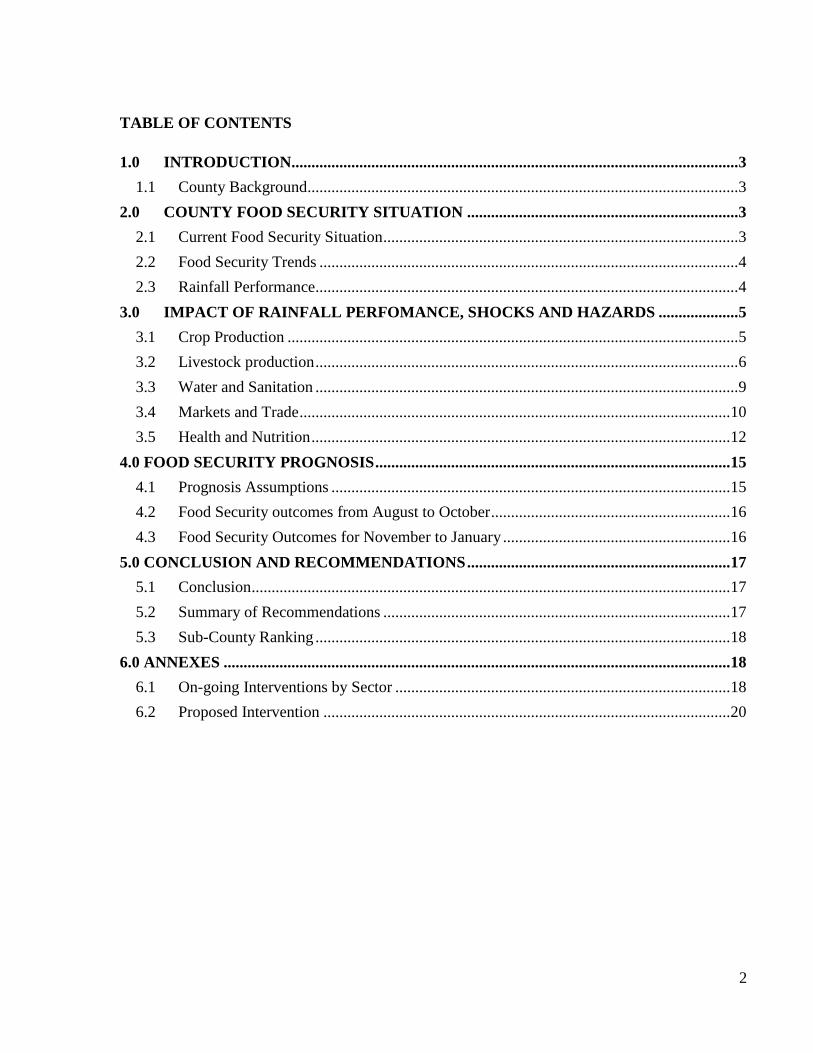
Figure 1: Population by livelihood zone
15%
35% 15%
32%
3% Pastoral- AllSpecies
Pastoral- Cattleand Goats
Agro pastoral
Casual and WagedLabour
Firewood andCharcoal
1.0 INTRODUCTION
1.1 County Background
Isiolo County is located in the northern part
of the country. It is divided into two sub-
counties, Isiolo North and Isiolo South. The
county spans an area of 25,605 square
kilometers with a population of 143,294
(KNBS, 2009). There are five livelihood
zones (Figure 1). The analysis in this report
will be done primarily for the Pastoral,
Agro-pastoral and Firewood/Charcoal
livelihood zones.
2.0 COUNTY FOOD SECURITY SITUATION
2.1 Current Food Security Situation
The Pastoral, Firewood/Charcoal and Agro pastoral (Merti sub-county) livelihood zones are
classified in the Stressed food insecurity phase (IPC Phase 2) while the Agro pastoral livelihood
zone is classified in the Minimal food insecurity phase (IPC Phase 1). A major driver of food
insecurity is poor rainfall performance with over 50 percent of the county receiving between 50
and 75 percent of normal rainfall. Crop destruction also occurred in areas around Merti due to
flooding of the Ewaso Nyiro caused by excess water from its catchment in Mt Kenya. Access to
pasture and water was limited in the southern part of the County around Belgesh in the Pastoral
livelihood zone due to tension over the presence of herdsmen from Garissa County. Finally,
pasture was also fast diminishing due to inward migration of livestock from Marsabit and Wajir
Counties which resulted to over-concentration of livestock around the remaining grazing areas
and water points.
Most households (75.3 percent) had an acceptable Food Consumption Score (FCS) and were
consuming at least a staple and vegetables on a daily basis complemented by frequent
consumption of oil and pulses according to May 2016 Food Security Outcome Monitoring
(FSOM) report which is an improvement on the 55.5 percent recorded at the same time last year.
The Coping Strategy Index (CSI) has also reduced to 19 in May 2016 from 33 at the same time
last year, implying that fewer households were engaging in consumption-based coping strategies
and on a less frequent basis. The Global Acute Malnutrition (GAM) prevalence was 12.3 percent
(SMART survey, Feb 2016) compared with 13.2 percent at the same time in 2015. The Crude
Mortality Rate (CMR) and under five mortality rate (U5MR) were 0.57/10,000/day and
<0.001/10,000/day respectively (SMART survey, Feb 2014) and were within normal ranges.
4
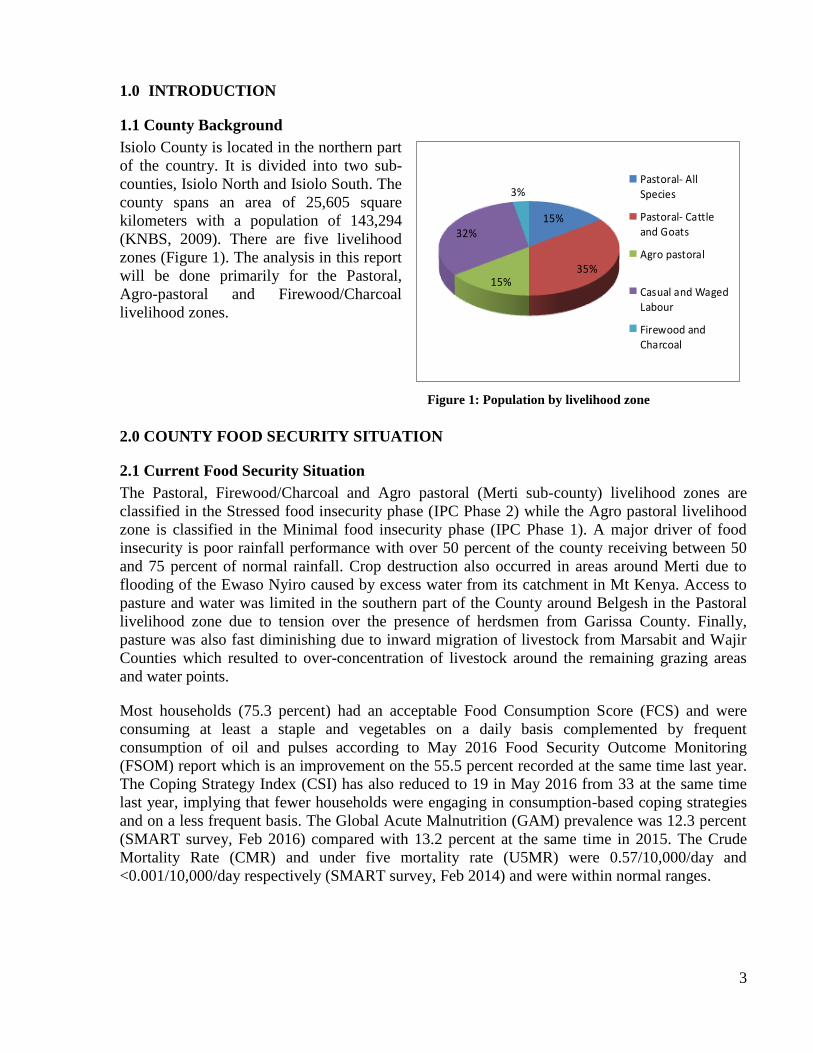
Figure 2: Percent of normal rainfall
performance
2.2 Food Security Trends
Table 1: Food security trends in Isiolo County
Indicator Long rains assessment, July
2016
Short rains assessment, Feb 2016
Food insecurity phase Stressed (pastoral,
firewood/charcoal and agro-
pastoral in Merti)
Minimal (agro-pastoral in Kinna)
Stressed (pastoral and
firewood/charcoal)
Minimal (agro-pastoral)
% of maize stocks held by
households (agro-pastoral)
2.7% 4% (previous LRA, August 2015)
Livestock body condition Fair for all species Fair to good
Water consumption (litres per
person per day)
10-15 (pastoral zone)
15-20 (agro-pastoral zone)
7-10 (pastoral zone)
15-20 (agro-pastoral zone)
Price of maize (per kg) 51 30
Distance to grazing 15km 8km
Terms of trade (pastoral zone) 58.7.4kg maize / one goat 52.4kg maize / one goat
Coping strategy index 19 33
Food consumption score 75.3 percent 55.5 percent
2.3 Rainfall Performance
The onset of the rains in the county was late by a
dekad as it occurred in the first dekad of April
compared with the normal third dekad of March.
The County received below normal rains of 50-90
percent in most parts (Figure 2). However, a few
isolated locations such as Kinna in the Agro-
pastoral zone and Cherab ward in the Pastoral
livelihood zone received normal to near-normal
rains, although the temporal distribution was poor
since most of it was received in only three days.
In other areas, the rains were fairly well
distributed in time during the season as all dekads
received some rains, while the spatial distribution
was even across all livelihood zones. Cessation
was normal in the second dekad of May.

5
3.0 IMPACT OF RAINFALL PERFOMANCE, SHOCKS AND HAZARDS
3.1 Crop Production
The County is short rains dependent. The long rains season accounts for about 40 percent of
annual rainfall. The three main food crops are maize, beans and cowpeas (Table 2). Crop
production is only practiced in the Agro pastoral livelihood zone.
Table 2: Contribution of crops to food and income in Isiolo County
Livelihood Zone Crop Percent Contribution
Food Income
Agro Pastoral Maize 45 15
Beans 19 25
Cow peas 3 1
Although the area put under maize was normal compared with the Long Term Average (LTA),
the projected production was approximately 4.7 percent of the LTA (Table 2). The significantly
lower than normal production was occasioned by stunting of the maize crop as a result of excess
water in Kinna, which also led to crop destruction in Merti along the Ewaso Nyiro River. In Isiolo
Central, production was lower as most households delayed planting due to the rains’ late onset.
Additionally, the rainfall in the area was characterized by poor temporal distribution with fewer
rainy days.
Table 3: Rain-fed crop production Crop Area planted during
2016 Long rains
season (Ha)
Long Term
Average
area planted during the
Long rains season (Ha)
2016 Long rains
season production
(90 kg bags)
Projected/Actual
Long Term Average
production during the
Long rains season
(90 kg bags)
Maize 366 350 155 3300
Beans 144 265 300 1905
Cowpeas 57 75 30 105
The area planted under beans and cowpeas was 54.3 and 76 percent of the LTA respectively
caused by the late onset, since households were reluctant to spend on these crops as they are
slightly expensive and were unsure whether they would do well. Consequently, the actual
production of both crops was 15.7 and 28.6 percent of their LTAs respectively (Table 3).
The area put under irrigation for maize was 36 percent of the LTA which was projected to result
in 45 percent of the normal production (Table 3). The Ewaso Nyiro River has over time been
changing its course making it difficult to construct irrigation canals to enable water to flow by
gravity. An alternative option was to use pumps to relay water to the farms. Some farmers in
these irrigated areas had neither the resources to purchase these pumps nor the fuel to run them,
hence the lower than normal production of maize.
6
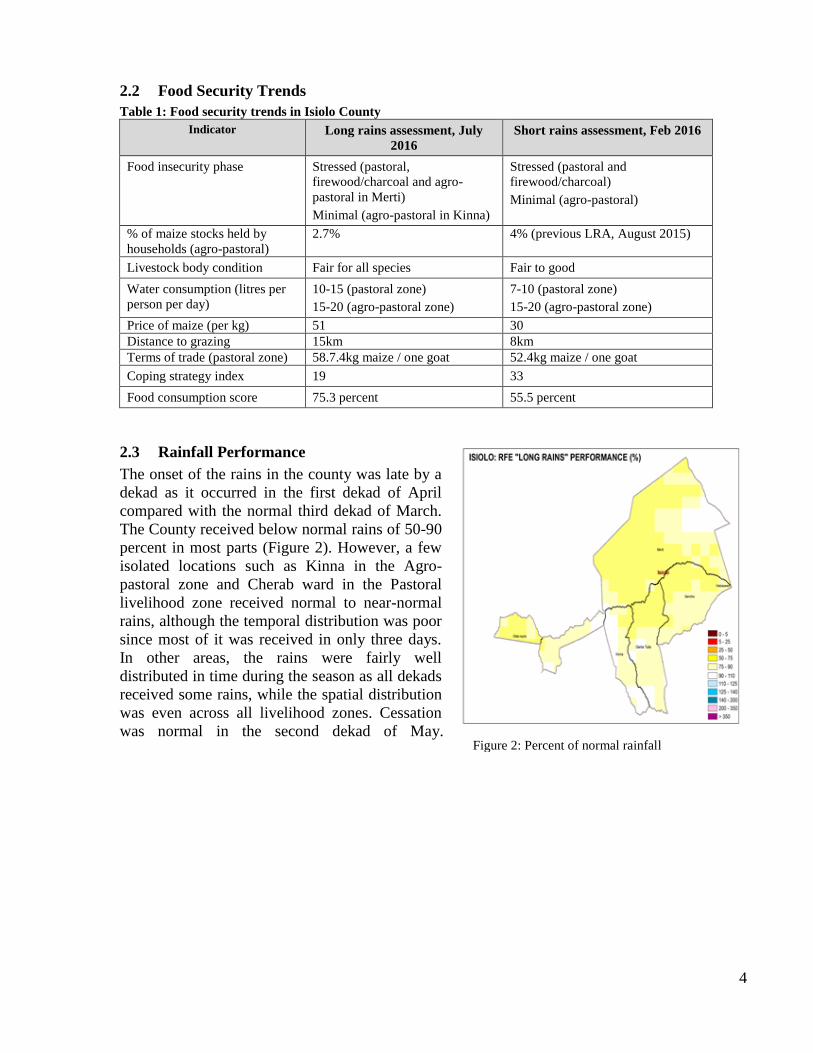
Table 4: Irrigated crop production
Crop Area planted
during 2016
Long rains
season (Ha)
Short Term Average
area planted during the
Long rains season (Ha)
2016 Long rains season
production (90 kg bags)
Projected and Actual
Short Term Average
production during the Long
rains season (90 kg bags)
Maize 119 330 1878 4200
Cow peas 20 15 266 200
Onions 24 29 240 250
The acreage of cowpeas under irrigation rose by 33 percent and its consequent production also
increased by a similar margin. The little water available in the irrigated farms was sufficient for
cowpea production as it is a drought tolerant and water efficient crop. The acreage under
irrigation for onions and its consequent production was normal (Table 4).
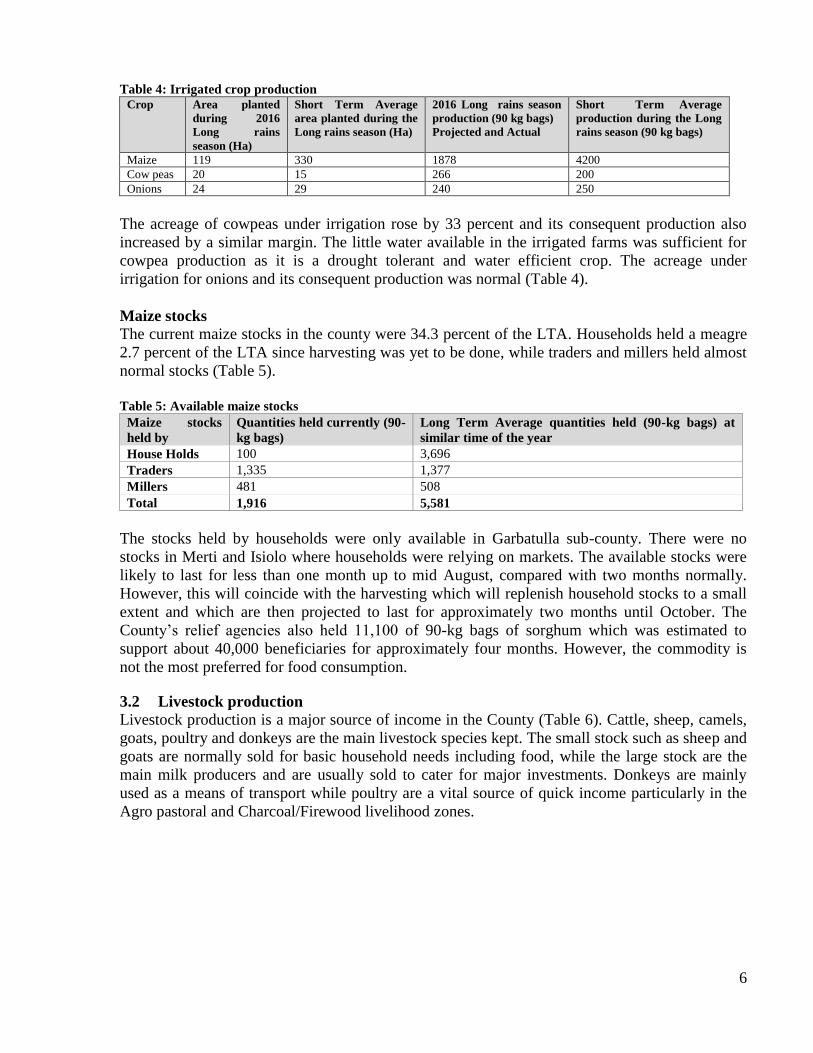
Maize stocks
The current maize stocks in the county were 34.3 percent of the LTA. Households held a meagre
2.7 percent of the LTA since harvesting was yet to be done, while traders and millers held almost
normal stocks (Table 5).
Table 5: Available maize stocks
Maize stocks
held by
Quantities held currently (90-
kg bags)
Long Term Average quantities held (90-kg bags) at
similar time of the year
House Holds 100 3,696
Traders 1,335 1,377
Millers 481 508
Total 1,916 5,581
The stocks held by households were only available in Garbatulla sub-county. There were no
stocks in Merti and Isiolo where households were relying on markets. The available stocks were
likely to last for less than one month up to mid August, compared with two months normally.
However, this will coincide with the harvesting which will replenish household stocks to a small
extent and which are then projected to last for approximately two months until October. The
County’s relief agencies also held 11,100 of 90-kg bags of sorghum which was estimated to
support about 40,000 beneficiaries for approximately four months. However, the commodity is
not the most preferred for food consumption.
3.2 Livestock production
Livestock production is a major source of income in the County (Table 6). Cattle, sheep, camels,
goats, poultry and donkeys are the main livestock species kept. The small stock such as sheep and
goats are normally sold for basic household needs including food, while the large stock are the
main milk producers and are usually sold to cater for major investments. Donkeys are mainly
used as a means of transport while poultry are a vital source of quick income particularly in the
Agro pastoral and Charcoal/Firewood livelihood zones.
7
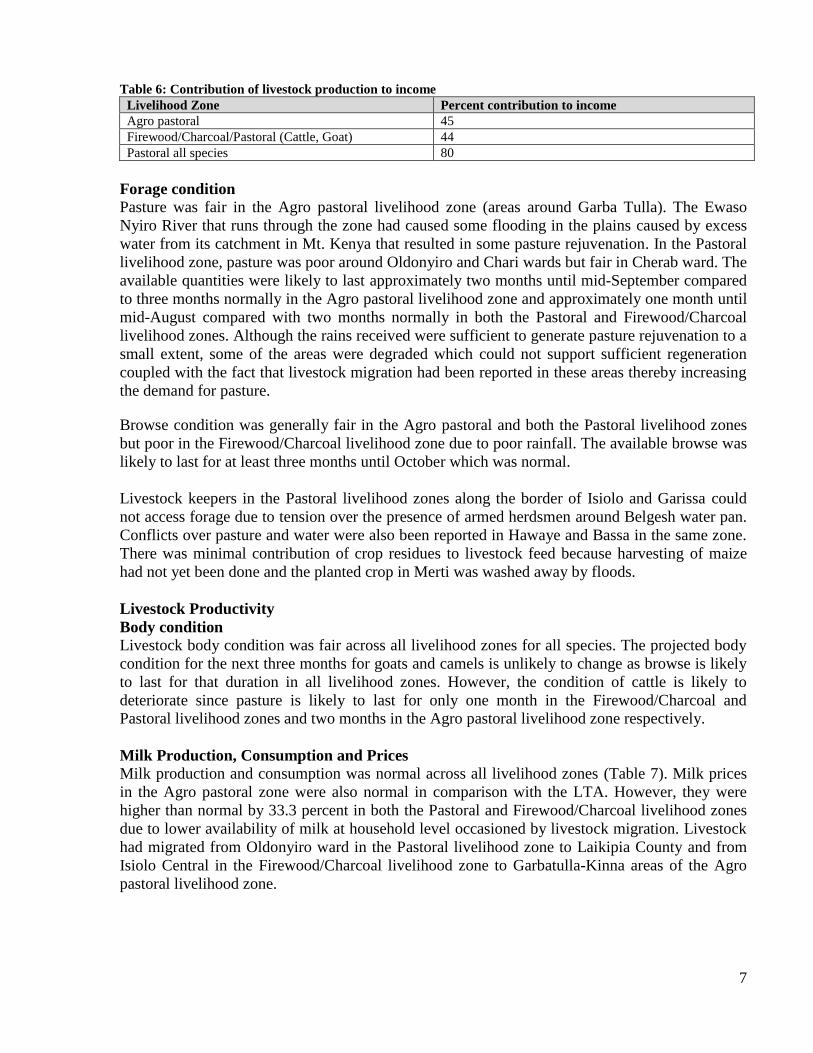
Table 6: Contribution of livestock production to income
Livelihood Zone Percent contribution to income
Agro pastoral 45
Firewood/Charcoal/Pastoral (Cattle, Goat) 44
Pastoral all species 80
Forage condition
Pasture was fair in the Agro pastoral livelihood zone (areas around Garba Tulla). The Ewaso
Nyiro River that runs through the zone had caused some flooding in the plains caused by excess
water from its catchment in Mt. Kenya that resulted in some pasture rejuvenation. In the Pastoral
livelihood zone, pasture was poor around Oldonyiro and Chari wards but fair in Cherab ward. The
available quantities were likely to last approximately two months until mid-September compared
to three months normally in the Agro pastoral livelihood zone and approximately one month until
mid-August compared with two months normally in both the Pastoral and Firewood/Charcoal
livelihood zones. Although the rains received were sufficient to generate pasture rejuvenation to a
small extent, some of the areas were degraded which could not support sufficient regeneration
coupled with the fact that livestock migration had been reported in these areas thereby increasing
the demand for pasture.
Browse condition was generally fair in the Agro pastoral and both the Pastoral livelihood zones
but poor in the Firewood/Charcoal livelihood zone due to poor rainfall. The available browse was
likely to last for at least three months until October which was normal.
Livestock keepers in the Pastoral livelihood zones along the border of Isiolo and Garissa could
not access forage due to tension over the presence of armed herdsmen around Belgesh water pan.
Conflicts over pasture and water were also been reported in Hawaye and Bassa in the same zone.
There was minimal contribution of crop residues to livestock feed because harvesting of maize
had not yet been done and the planted crop in Merti was washed away by floods.
Livestock Productivity
Body condition
Livestock body condition was fair across all livelihood zones for all species. The projected body
condition for the next three months for goats and camels is unlikely to change as browse is likely
to last for that duration in all livelihood zones. However, the condition of cattle is likely to
deteriorate since pasture is likely to last for only one month in the Firewood/Charcoal and
Pastoral livelihood zones and two months in the Agro pastoral livelihood zone respectively.
Milk Production, Consumption and Prices
Milk production and consumption was normal across all livelihood zones (Table 7). Milk prices
in the Agro pastoral zone were also normal in comparison with the LTA. However, they were
higher than normal by 33.3 percent in both the Pastoral and Firewood/Charcoal livelihood zones
due to lower availability of milk at household level occasioned by livestock migration. Livestock
had migrated from Oldonyiro ward in the Pastoral livelihood zone to Laikipia County and from
Isiolo Central in the Firewood/Charcoal livelihood zone to Garbatulla-Kinna areas of the Agro
pastoral livelihood zone.

8
Table 7: Milk production, consumption and prices at livelihood zone level
Tropical livestock units (TLUs)
The average TLUs per household was four for poor households where livestock comprised
approximately 3-5 cattle and 10-15 goats and sheep, coupled with a few chicken. Camels were
mainly found among the middle and upper income earners in addition to the sheep and goats.
TLUs were normal across all livelihood zones.
Birth rate
The birth rate for livestock averaged 17, 10 and 16 percent for sheep, cattle and goats respectively
which was normal for this time of the year and was expected to remain so for the next three
months.
Migration
Intra and inter County migrations have occurred earlier than normal. Herdsmen moved into
Belgesh and Hawaye area in the Pastoral livelihood zone in Garbatulla in early June in search for
pasture and water, which was normal. In-migration was also noted in Yamicha and Bassa in Merti
sub-county by livestock from Wajir and Marsabit Counties respectively. Armed herdsmen from
Garissa County and those in Hawaye, Bassa and Belgesh in the Pastoral livelihood zone of Isiolo
had resulted into conflict over pasture and water. The conflicts are likely to intensify as pasture
decreases in quantity in the next one month. Herders from Oldonyiro ward in the Pastoral
livelihood zone also moved to Laikipia County in April when normally they would move in June.
Additionally, herdsmen from Isiolo Central in the Firewood/Charcoal livelihood zone moved to
Kinna in the Agro pastoral livelihood zone as pasture was still available there. The movement in
this route was not normal.
Migration caused over grazing and degradation of the available pastures in the areas where it
occurred. It also reduced access to milk at household level in the Pastoral and Firewood/Charcoal
livelihood zones. The livestock that migrated are not expected back for the next three months
because La Nina conditions are forecasted to occur and therefore neither pasture nor browse is
likely to be adequately rejuvenated. In addition, open water sources will not have been
sufficiently recharged.
Livestock Diseases and Mortalities
Reported disease out breaks include black quarter in cattle in Sericho in Garbatulla sub-county in
May and sheep and goat pox in Kulamawe in Garbatulla sub-county and in Ngaremara and
Oldonyiro in Isiolo Central sub-county between April and June. Other diseases included
Contagious Caprine Pleuropneumonia (CCPP) in the whole County and Pestes des Petits
Ruminantes (PPR) in Ngaremara ward. Vaccination was undertaken to contain the situation.
There were reported but unconfirmed cases of Lumpy Skin Disease (LSD). There were no
unusual livestock deaths and the mortality rates of all livestock species were within seasonal
norms at two percent for cattle, goats and sheep.
Livelihood zone
Milk production (Litres) /
Household
Milk consumption (Litres) /
Household
Prices (Ksh)/Litre
Current LTA Current LTA Current LTA
Pastoral 3 3 1 2 80 60
Agro-pastoral 2 2 1 1 60 60
Firewood/charcoal 1 1 0.5 0.5 80 60

9
Water for Livestock
The main sources of water for livestock consumption were the normal ones for this time of the
year (Table 8). The Pastoral and Firewood/Charcoal livelihood zones posted the lengthiest return
trekking distances and were above the normal distances. The herders over-grazed around watering
points causing distances to pasture to lengthen, aggravated by the presence of livestock from
neighbouring counties.
Table 8: Water for livestock consumption in Isiolo County
3.3 Water and Sanitation
The main sources of water for domestic use across all livelihood zones include boreholes, water
pans, shallow wells, sand dams and Rivers Ewaso Nyiro, Bisanadi and Isiolo. Over 90 percent of
the boreholes were operational with the ones that were not operational being the ones at Duse and
livestock marketing division in the Pastoral livelihood zone and at Kinna in the Agro pastoral
livelihood zone caused by the mechanical breakdown of generators. Open water sources were
recharged at 50 to 70 percent of normal with the Ewaso Nyiro particularly benefitting from excess
rains in its upper catchment of Mt Kenya and the Aberdare Ranges which received some
substantial rains. Access to and availability of water at household level is normal. However, in
some areas such as Bassa, Ngaremare, Duse and Korbesa, access is hampered by squabbles in the
water users’ committees over levies charged at the water sources, which has led to a lack of
maintenance for sources such as boreholes.
Livelihood
zone
Sources Return trekking
distances
(kilometers)
Expected duration
to last (months)
Watering frequency
(days)
Current Normal Current Normal Current Normal Current Normal
Pastoral Borehole
Sand
dams
Water
pans
Shallow
wells
Borehole
Sand dams
Water pans
Shallow
wells
15 10 3 3 3 3
Agro-
pastoral
River
Borehole
River
Borehole
10 10 3 3 2 2
Firewood/c
harcoal
River
Borehole
River
Borehole
15 10 3 3 3 3

10
Table 9: Water for domestic consumption in Isiolo County
Sub
County/
Livelihoo
d Zone
Sources of
Water
Distance to
Water for
Domestic
Use (Km)
Cost of
Water
(Ksh./20
litres)
Waiting Time
at Source
(Minutes)
Average HH
Use
(Litres/person/
day)
Projected
Duration
of
Current
Water
Sources Norm
al
Curre
nt
Curr
ent
Nor
mal
Nor
mal
Curr
ent
Norm
al
Curr
ent
Norm
al
Curr
ent
Pastoral
Garbatulla
sub county
Borehol
es
Water
pans
Borehol
es
Water
pans
0.5-5 0.5-5 3-10 3-10 30 30 15 15 Borehole:
Permanent
source
Water
pans: 3
months
Agro
pastoral
Garbatulla
sub county
Borehol
es
Protecte
d
springs
Borehol
es
protecte
d spring
0.5-5 0.5-5 3-5 3-5 30 30 15 15 Borehole:
Permanent
source
Pastoral
Merti sub
county
River-
Ewaso-
Nyiro
River-
Ewaso-
Nyiro,
Borehol
es
5-10 5-10 3-5 3-5 30 30 10 10 Borehole:
Permanent
source
Agro
pastoral
Merti sub
county
Borehol
es
Borehol
es
0.5-5 0.5-5 3-5 3-5 20 20 15 15 Borehole:
Permanent
source
Agro
pastoral
Isiolo
Central sub
county
Isiolo
river,
Borehol
es,
Shallow
Wells
Isiolo
river,
shallow
wells
borehol
es
0.5-5 0.5-5 5 5 20 20 15 15 Borehole:
Permanent
source
Pastoral
Isiolo
Central sub
county
(Oldonyiro)
Sand
dams,
Ewaso
Nyiro,
Shallow
wells
Water
pans
Sand
dams,
Ewaso
Nyiro,
Shallow
wells
Water
pans
0.5-10 5-10 5 5 20 30 7-10 10-15 Borehole
Permanent
source
Water
pans: 2
months
Lengthy distances to water sources were recorded in Oldonyiro ward particularly in Nooloroi,
Nkarendare and Donyolengala at up to 5-10 km compared with 0.5-10 km normally. As a result,
water consumption per person per day in these areas ranged between 7 and 10 litres, compared
with the normal 10-15 litres. The waiting time in Oldonyiro was 30 minutes compared with 20
minutes normally because of low quantities in the shallow wells which were the main sources of
water (Table 9).
3.4 Markets and Trade
Market operations
Markets provide approximately 80 percent of food needs in the County with the main markets
being Isiolo, Oldonyiro and Maua (Meru County). Other notable markets include Bisan Biliqo,
Garbatulla, Merti, Kipsing, Habaswein (Wajir South), Modogashe and Nanyuki (Laikipia
County). Isiolo market, although strategically located is not fully exploited due to middlemen.
Currently, the markets are operating normally apart from Belgesh which had been closed down

11
Figure 4: Goat price trends in Isiolo County
0
500
1000
1500
2000
2500
3000
3500
Jan Feb Mar Apr May Jun Jul Aug Sep Oct Nov Dec
Pric
e (
Ksh
.)
Average (2011-2015) 2015 2016
Figure 3: Maize price trends in Isiolo County
0
10
20
30
40
50
60
Jan Feb Mar Apr May Jun Jul Aug Sep Oct Nov Dec
Pric
e (
Ksh
. / kg)
Average (2011-2015) 2015 2016
due to conflicts over forage and water. Livestock trade volumes are normal because they are able
to meet the demand.
Maize prices
Maize prices were similar to the same period in
2015 and maintained an above average trend by
18 percent when compared with the 2011-2015
LTA (Figure 3). The higher than normal prices
could be attributed to the fact that supply was
limited, as harvesting was yet to be done either
in the County or in neighbouring Counties,
which are a major source of maize. Prices were
highest in the Pastoral livelihood zone and
lowest in the Firewood/Charcoal livelihood
zones. The price was likely to rise in the next
three months as demand for the commodity
increases during the lean season from August
through to October, particularly in the Pastoral
livelihood zone.
Goat price The current goat prices are normal compared
with the LTA but higher by 11 percent when
compared with a similar time in 2015 (Figure
4). The lowest were recorded in the
Firewood/Charcoal livelihood zones. Goat
prices were expected to remain stable over the
next three months as the available browse was
projected to last at least that long.

12
Figure 5: Trends in terms of trade in Isiolo
County
0
10
20
30
40
50
60
70
80
Jan Feb Mar Apr May Jun Jul Aug Sep Oct Nov Dec
Kil
ogram
s o
f m
aiz
e
exch
an
ged
fo
r a
go
at
Average (2011-2015) 2015 2016
Terms of trade
The current TOT were lower than the LTA by
12 percent (Figure 5) implying that households
could purchase less maize with the proceeds
from the sale of a goat compared with normal.
However, the situation was slightly better by
13.7 percent than in 2015. The terms of trade
were likely to reduce in the next three months
as maize prices increase against a back-drop of
stable goat prices.
3.5 Health and Nutrition
Morbidity patterns
The five most common diseases for children aged below five years and the general population are
Malaria, Other diseases of the respiratory system, Diarrhoea, Pneumonia and Skin diseases (Table
10).
Table 10: Morbidity trends for children aged below five years and the general population
Reported Morbidity cases for children under five Reported Morbidity cases for General Population
Disease Jan-
June
2015
Jan-
June
2016
%
Change
Disease Jan-June
2015
Jan-June
2016
% Change
Malaria 1659 3115 88 Malaria 4054 5540 36.7
Other diseases of
the respiratory
system
20210 13464 -33 Other diseases of
the respiratory
system
26038 18901 -27.4
Diarhoea 4461 4427 1 Diarrhoea 2625 3174 20.9
Pneumonia 2314 2367 2 Pneumonia 2606 3351 28.6
Skin Disease 2161 2501 16 Skin Disease 5425 5902 8.8
Diarrhoea and Pneumonia cases in children aged below five years were normal from January to
June 2016 compared with a similar time last year. However, Malaria cases for the same cohort
and the general population were higher. Above normal rainfall during the short rains season in
Meru County caused flooding in Isiolo Central, Garbatulla and Merti areas that increased
mosquito breeding, hence the increase in the reported cases for Malaria, particularly in January
and February 2016. Diarrhoea cases in the general population went up due to contamination of
open water sources as a result of excess water, coupled with a marked absence of latrines for
human waste disposal.
Epidemic prone diseases
There was cholera epidemic from January to June 2016 with 13 cases reported but no deaths
recorded as measures were put in place to prevent fatalities (Table 11). The areas that reported
cholera cases included Game, Lotik and Attan in Isiolo Central.

13
Table 11: Epidemic prone diseases in Isiolo County
Epidemic January –June 2015 January –June 2016
No of cases Reported
Deaths
No of cases Reported
Deaths
Measles 0 0 0 0
Cholera 0 0 13 0
Dysentery 127 0 181 0
Diarrhea 7086 0 7601 0
Malaria 5713 0 8655 0
Typhoid 2055 0 1946 0
The CMR was 0.57/10,000/day while the U5MR was <0.001/10,000/day both of which were
within normal ranges. (SMART survey, Feb 2014).
Immunization Coverage
Immunization and vitamin A supplementation coverage during the period January to June 2016
generally declined compared with the same period last year and also remained below the national
target of 80 percent (Tables 12 and 13). The decline was attributed to households’ migration
earlier than normal, making them more difficult to reach for immunization coupled with lack of
proper documentation by the concerned department.
Table 12: Immunization coverage in Isiolo County
Year Percentage of fully immunized children
in the district
Source: DHIS MOH 710 Vaccines and
Immunizations
Percentage of children immunized against
the mentioned diseases in the district
Source: Nutrition survey
January to June
2016
55.7% 1. OPV 1 74.9%
2. OPV 3 72.9%
3. Measles at 9 months 69.2%
4. Measles at 18 months 55%
January to June
2015
69.8% 1. OPV 1 102%
2. OPV 3 87.7%
3. Measles at 9 months 63.5%
4. Measles at 18 months 32%
Table 13: Vitamin A Supplementation Coverage
% Children < 12
months who
received Vit A
(DHIS 710)
% Children 1 to 5
years old who
received Vit A
(DHIS 710)
% Children 6-11
Once
(Survey)
% Children 12-
59
Once
(Survey)
% Children 12-
59
More than Once
(Survey)
Jan –
June
2015
Jan –June
2016
Jan –June
2015
Jan –
June
2016
Jan –June
2015
Jan –
June
2016
Jan –
June
2015
Jan –
June
2016
Jan –
June
2015
Jan –
June
2016
117.1% 71.1% 75.5% 53.6% 58.6% 69.9% 30.6% 24.6% 58.4% 70.8%

14
Figure 6: Nutrition status in Isiolo County
Figure 7: Food Consumption Score trends in Isiolo
County
29
47.5
5.7 1.9
15 8.6
38.8
22.7
56
43.9
55.5
75.3
May, 2013 May, 2014 May, 2015 May, 2016
FCS Trend 2013 - 2016
Poor Borderline Acceptable
Nutritional status and dietary diversity
Most adults were consuming three
meals per day in the Agro pastoral
livelihood zone and between one to
two meals in the Pastoral livelihood
zones. Children aged below five were
fed three times a day in both the Agro-
pastoral and Pastoral livelihood zones
which was normal for this time of the
year. Meals were mainly of rice,
githeri (a mixture of maize and
beans), maize flour, milk and
sometimes spaghetti.
The GAM prevalence for the county
stood at 12.3 percent (Integrated
SMART survey, February 2016)
compared with 13.2 percent recorded at a similar time in 2015 (Figure 6). The situation was
categorized as serious according to WHO standards in both surveys but with no significant
change in the nutritional status. The prevalence of Severe Acute Malnutrition (SAM) was 1.2
percent and below the emergency threshold of three percent (Integrated SMART survey, February
2016). The most likely cause of malnutrition was disease and a poor health environment.
Food Consumption Scores
The proportion of households with poor
food consumption score had reduced
compared with a similar time last year
(FSOM, May 2016), implying improved
household food consumption (Figure 7).
The implication was that most
households (75.3 percent) were
consuming at least a staple and
vegetables daily, complemented by a
frequent consumption of pulses and oil.
The trend was similar to the results in
the SMART survey conducted in
February 2016, as the FCS, based on the
7-day recall, estimated two percent of
households having a poor food
consumption score compared with 4.4
percent at a similar time last year.

15
Figure 8: Trends in Coping Strategy Index
7
19
11
33
19
May, 2012 May, 2013 May, 2014 May, 2015 May, 2016
CSI Trend (May 2012-May 2016)
Coping Mechanisms
The CSI for May 2016 was 19 compared with
33 at a similar time in 2015 (Figure 8),
implying that households were currently
employing fewer coping strategies and less
frequently than in May 2015 (FSOM, May
2016). The most commonly employed coping
mechanisms were insurance and consumption-
based which included relying on less preferred
and/or less expensive food (86.1 percent) and a
reduction in the portion sizes of meals (61.7
percent). According to the integrated SMART
survey conducted in February 2016, the
situation was similar then as the mean CSI was
16.85, having reduced from 20.28 at a similar
period in 2015.
Sanitation and Hygiene Latrine coverage was 54.7 percent for the period January to June 2016, compared with 53.7
percent during the same period last year (Public Health Office, Isiolo County). There was no
significant change in the proportion of households who used a latrine for human waste disposal
compared with a similar time last year (Table 14).
Table 14: Latrine coverage
Point of human waste disposal SMART survey, 2015 SMART survey, 2016
Open defecation 35% 32.1%
Share latrine 29% 34.7%
Own latrine 35.80% 33.3%
A majority of households (87.9 percent) stored their water in closed containers while the rest
stored it in open containers. Approximately 12.5 percent of households washed their hands during
the four critical times while 52.8 percent used soap during hand-washing (SMART survey,
February 2016). The poor hygiene practices could be the underlying reason for the water-borne
diseases in the county.
4.0 FOOD SECURITY PROGNOSIS
4.1 Prognosis Assumptions
The October to December rains have a 75 percent chance of being below normal due to the
forecasted La Niña conditions.
Terms of trade are likely to decline through to December.
Land surface temperatures are likely to be higher than normal according to forecasts by
FEWSNET.

16
Rangeland conditions are likely to remain scarce through to November since they were not
sufficiently rejuvenated from the recent rains and also due to projected higher than normal
temperatures.
The incidence of conflict over water and forage is likely to intensify through to November.
Open water sources in the pastoral livelihood zones are likely to dry up as evaporation rates
increase due to rising temperatures.
The projected long rains harvests will replenish the dwindling food stocks in the agro-pastoral
livelihood zone but only to a limited extent.
4.2 Food Security outcomes from August to October
Pastures in the Pastoral livelihood zone are likely to be depleted by August after which livestock
prices will begin to fall due to deteriorating body condition. Lower livestock prices are likely to
coincide with rising food prices, such as of maize, resulting in decreasing terms of trade through
to December. The current migrations are likely to intensify, making livestock move further away
from homesteads and thereby reducing the availability of milk and other livestock products for
consumption at household level. Given that livestock production contributes over 80 percent to
income in the Pastoral zone, households that rely on livestock related income sources such as
herding and the sale of milk and other products will have fewer income opportunities. As these
diminish and maize prices maintain their above normal and increasing trend, significant food
consumption gaps will become evident in the Pastoral livelihood zone which primarily relies on
markets for food. The nutritional status of children aged below five is also likely to deteriorate as
food availability and access reduces at household level. With all these events occurring at the
beginning of the lean season, households in this zone are likely to increase the frequency and
severity of coping strategies through to October. While most households are likely to remain in
the Stressed phase (IPC Phase 2) some poor households in this zone are unlikely to meet both
their food and non-food needs and are likely to move to the crisis phase (IPC Phase 3).
For households in the Agro pastoral livelihood zone, it is unlikely that the projected harvest will
replenish food stocks to an appreciable extent. However, some households still hold stocks and
will further benefit from the minimal seasonal harvests which are likely to tide them through
some part of the lean season, particularly in areas around Kinna. Imports are also expected from
neighbouring counties after harvesting in August and markets are likely to continue functioning
normally in the zone. Most households around Kinna are likely to remain in the minimal phase
(IPC phase 1) while those around Merti are likely to remain in the stressed phase (IPC phase 2).
4.3 Food Security Outcomes for November to January
With the short rains season likely to be below normal, it is unlikely that the rains will result in
sufficient forage rejuvenation. As rangeland conditions continue to deteriorate, livestock body
condition will likely worsen and livestock prices reduce further. As food commodity prices
maintain their upward trend, terms of trade will further worsen. Open water sources are likely to
dry up as a result of higher than normal temperatures. Migrations are likely to intensify and the
current small scale conflicts associated with reducing availability of water and forage will
escalate and may interrupt many livestock-related activities such as herding and trade. Due to the
poor forage conditions, it is unlikely that livestock will return home, therefore milk and other
livestock products will continue to be unavailable for either consumption or sale. Food
consumption gaps will continue to be evident during this period as milk, an integral part of the
pastoral households’ diets and income will be unavailable. The nutritional status of children will
likely worsen and may reach critical levels according to WHO standards. As households are
17
forced to look for alternative ways to earn an income, it is likely that some will engage in more
severe (crisis) coping strategies more frequently than normal. As such, households in the stressed
phase (IPC Phase 2) and in the crisis phase (IPC Phase 3) are likely to remain there.
In the Agro pastoral livelihood zone, households are likely to have exhausted their household
stocks from the long rains season’s harvest and will likely be depending on markets. However,
imports from neighbouring counties are likely to keep prices stable in this zone and markets are
also likely to be well provisioned with staples from these counties. Therefore most households are
likely to remain in the minimal phase (IPC Phase 1) and others remain in the stressed phase (IPC
Phase 2) until January 2017.
5.0 CONCLUSION AND RECOMMENDATIONS
5.1 Conclusion
The Agro pastoral livelihood zone (Merti), the Firewood/Charcoal and the Pastoral livelihood
zones are classified in the Stressed food insecurity phase (IPC Phase 2) while the Agro pastoral
livelihood zone (Kinna in Garbatulla) is classified in the Minimal food insecurity (IPC Phase 1).
Key factors to monitor include resource-based conflicts, the nutritional status of children aged
below five years, rangeland conditions and household food stocks. Others include; Terms of trade
and distances to grazing areas for the Pastoral livelihood zone.
5.2 Summary of Recommendations
Scale up nutrition interventions and strengthen community based nutrition surveillance to
reduce the high malnutrition levels
Supply and distribution of water treatment chemicals at household level to reduce water-borne
diseases
Capacity building of farmers on proper utilization of sorghum, a drought tolerant crop, and
encourage its planting and consumption for improved food security
Damming of Ewaso Nyiro River for irrigation, and provision of water pumps and support for
the operational costs of irrigation (fuel subsidy)
Introduction of water-efficient crops such as NERICA rice
Disease surveillance, deworming and vaccination against PPR, sheep and goat pox, CCPP and
Black Quarter as the livestock influx from neighbouring counties poses the risk of spreading
diseases.
Pasture re-seeding in degraded rangelands and promotion of fodder production to improve the
availability of livestock feed
Peace meetings with grazing management committees to curb conflicts over pasture
Fast track legislation to manage the rangelands (such as the rangeland management bill in the
county assembly) in order to regulate livestock influx.
Repair of generator and piping system for broken boreholes to improve efficiency
Capacity building of water committees on group dynamics to be able to run water resources
properly.

18
5.3 Sub-County Ranking
Table 15: Sub-County ranking of food insecurity
Division Food security rank
(1-10)
Main food security threat (if any)
Oldonyiro 1 Out-ward migration, reducing milk availability at household level,
depleting open water sources, poor forage conditions
Sericho 2 Livestock influx from neighbouring counties, diminishing open water
sources, disrupted market functions due to insecurity in Belgesh, high
food commodity prices
Merti 3 Livestock influx from Marsabit and Wajir, crop destruction by floods,
high food commodity prices
Garba Tulla 4 Livestock influx from Garissa, conflict, disruption of markets
Central 5 Diminishing pasture, livestock migration to Kinna
Kinna 6 Livestock influx from Central and Garissa, availability of household
stocks, comparably fair food commodity prices, availability of well-
provisioned markets
6.0 ANNEXES 6.1 On-going Interventions by Sector
Table 16: On-going interventions by sector
Intervention Objective Specific
Location
Cost
(Ksh)
No. of
beneficiar
ies
Impleme
ntation
Time
Frame
Implementa
tion
stakeholders
HEALTH AND NUTRITION
Vitamin A
Supplementation, Zinc
Supplementation, Iron
Folate Supplementation
among Pregnant Women,
Food fortification and
deworming
To improve
immunity and
reduce the disease
burden
All health
facilities
Kshs.
1.4 M
88,772 Ongoing UNICEF,
FH, KRCS,
ACF
Management of Acute
Malnutrition (IMAM) and
IYCN Interventions (EBF
and Timely Introduction of
complementary Foods)
To improve access
to quality curative
nutrition services
and improve
nutritional status of
children under five
All health
facilities
Kshs.
129,600
66512 Ongoing UNICEF,
FH, KRCS,
ACF
Promotion of hand
washing, distribution of
water treatment chemicals,
Community Led Total
Sanitation
To reduce the
prevalence of
water-borne
diseases through
improved hygiene
and sanitation
All health
facilities,
selected
schools
and
communit
y units.
150,000 80,000 Jan-Dec
2016
UNICEF,
FH, KRCS,
ACF
LIVESTOCK
Construction of the hay
shed.(3 in number)
To maintain a
steady supply of
livestock feed
during the July-
Sept dry spell
Kinna
Chari
Wabera
20M 2,400
1,200
3,000
January –
Decembe
r 2016
DRSLP(drou
ght resilient
and
sustainable
livelihood
programme)
19
Intervention Objective Specific
Location
Cost
(Ksh)
No. of
beneficiar
ies
Impleme
ntation
Time
Frame
Implementa
tion
stakeholders
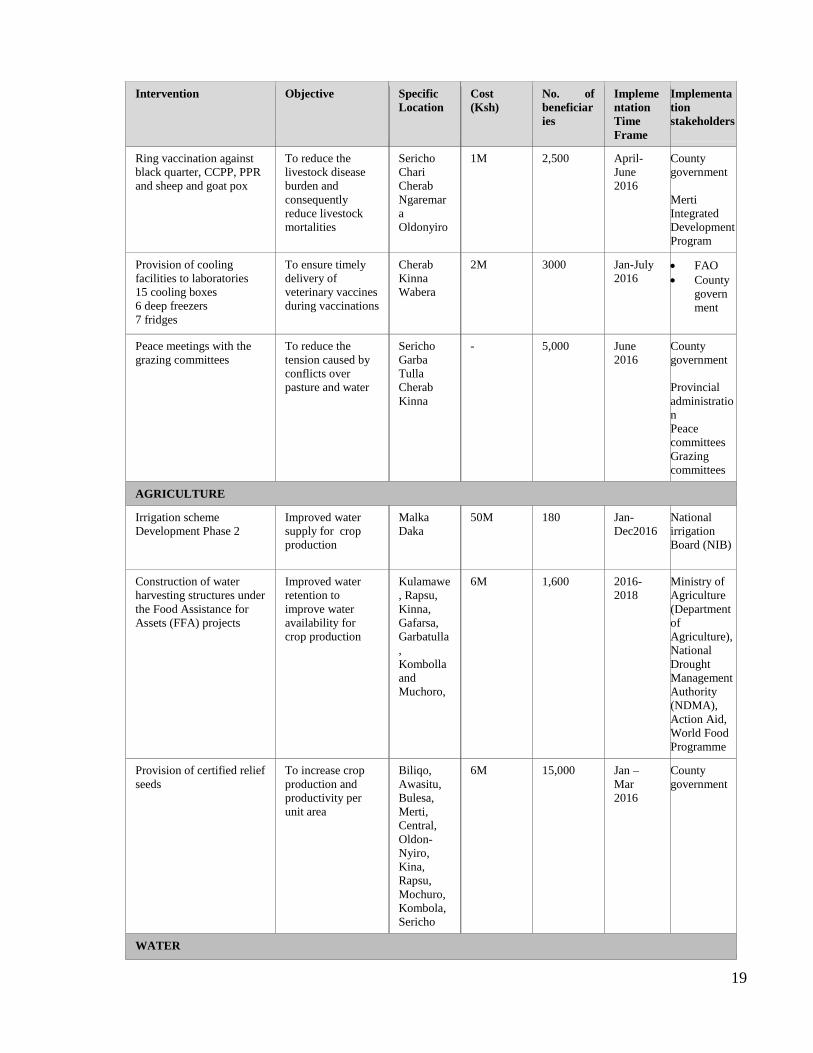
Ring vaccination against
black quarter, CCPP, PPR
and sheep and goat pox
To reduce the
livestock disease
burden and
consequently
reduce livestock
mortalities
Sericho
Chari
Cherab
Ngaremar
a
Oldonyiro
1M 2,500 April-
June
2016
County
government
Merti
Integrated
Development
Program
Provision of cooling
facilities to laboratories
15 cooling boxes
6 deep freezers
7 fridges
To ensure timely
delivery of
veterinary vaccines
during vaccinations
Cherab
Kinna
Wabera
2M 3000 Jan-July
2016 FAO
County
govern
ment
Peace meetings with the
grazing committees
To reduce the
tension caused by
conflicts over
pasture and water
Sericho
Garba
Tulla
Cherab
Kinna
- 5,000 June
2016
County
government
Provincial
administratio
n
Peace
committees
Grazing
committees
AGRICULTURE
Irrigation scheme
Development Phase 2
Improved water
supply for crop
production
Malka
Daka
50M
180 Jan-
Dec2016
National
irrigation
Board (NIB)
Construction of water
harvesting structures under
the Food Assistance for
Assets (FFA) projects
Improved water
retention to
improve water
availability for
crop production
Kulamawe
, Rapsu,
Kinna,
Gafarsa,
Garbatulla
,
Kombolla
and
Muchoro,
6M 1,600 2016-
2018
Ministry of
Agriculture
(Department
of
Agriculture),
National
Drought
Management
Authority
(NDMA),
Action Aid,
World Food
Programme
Provision of certified relief
seeds
To increase crop
production and
productivity per
unit area
Biliqo,
Awasitu,
Bulesa,
Merti,
Central,
Oldon-
Nyiro,
Kina,
Rapsu,
Mochuro,
Kombola,
Sericho
6M 15,000 Jan –
Mar
2016
County
government
WATER

20
Intervention Objective Specific
Location
Cost
(Ksh)
No. of
beneficiar
ies
Impleme
ntation
Time
Frame
Implementa
tion
stakeholders
Rehabilitation of water
supply systems
To improve
efficiency of water
supply systems
Dadachala
fe
/Malkagal
a and
Awarsitu
24M 2,000 Novembe
r 2015 to
June
2016
Northern
Water
Services
Board,
County
Government
Drilling and equipping of
boreholes
Improve access to
safe drinking water
for domestic use
Rumate,
Iresaboru,
Ngaremar
a,
Yakbarsad
i Barabate,
Dololo
Wachu
145M 9,000 July
2015-
June
2016
County
Government,
APHIA
Imarisha,
Northern
Water
Services
Board
(NWSB),
ADB,
County
Government
School Meals Programme
There are 170 schools under Home Grown School Meals Program with a total of 36,890
beneficiaries (Table 17).
Table 17: School Meals Programme coverage
6.2 Proposed Intervention
Table 18 shows the population in need to be assisted under General Distribution (GD) or Food
assistance For Assets (FFA).
Table 18: Food intervention required (Proposed population in need of assistance)
Division Population in the
division
Pop in need
(% Range
min – max )
Specific areas to be
targeted
Proposed mode of
intervention
Oldonyiro 15,388 50-55 Oldonyiro, Lenguruma,
Lengwenyi, Kawalash,
Nooloroi, Mokori,
GD/FFA
Sericho 12,099 45-50 Hawaye, Sericho, Eldera, GD/FFA
Central 24,294(Excludes
Isiolo town)
15-20 Burat, Ngaremara GD/FFA
Garba
Tulla
16,401 45-50 Tana, Malkadaka, Belgesh GD/FFA
Merti 20,341 60-65 Bassa, Alango, Mlandanur,
Lakole
GD/FFA
Kinna 14,618 40-45 Kulamawe, Barambate,
Duse
GD/FFA
S/County No. of schools Boys Girls Total
Merti 30 4,938 4,713 9,651
Isiolo 102 7,863 7,647 15,510
Garba Tulla 38 5,804 5,925 11,729
Total 170 18,605 18,285 36,890
21
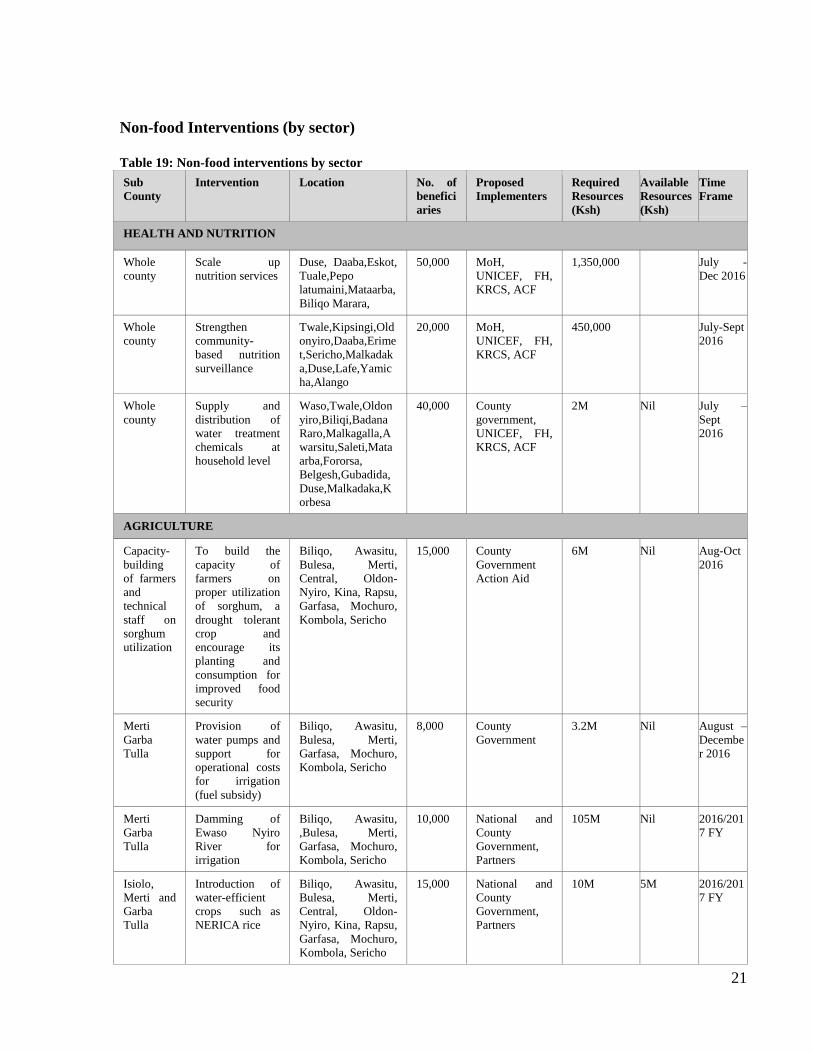
Non-food Interventions (by sector)
Table 19: Non-food interventions by sector
Sub
County
Intervention Location No. of
benefici
aries
Proposed
Implementers
Required
Resources
(Ksh)
Available
Resources
(Ksh)
Time
Frame
HEALTH AND NUTRITION
Whole
county
Scale up
nutrition services
Duse, Daaba,Eskot,
Tuale,Pepo
latumaini,Mataarba,
Biliqo Marara,
50,000 MoH,
UNICEF, FH,
KRCS, ACF
1,350,000 July -
Dec 2016
Whole
county
Strengthen
community-
based nutrition
surveillance
Twale,Kipsingi,Old
onyiro,Daaba,Erime
t,Sericho,Malkadak
a,Duse,Lafe,Yamic
ha,Alango
20,000 MoH,
UNICEF, FH,
KRCS, ACF
450,000 July-Sept
2016
Whole
county
Supply and
distribution of
water treatment
chemicals at
household level
Waso,Twale,Oldon
yiro,Biliqi,Badana
Raro,Malkagalla,A
warsitu,Saleti,Mata
arba,Fororsa,
Belgesh,Gubadida,
Duse,Malkadaka,K
orbesa
40,000 County
government,
UNICEF, FH,
KRCS, ACF
2M Nil July –
Sept
2016
AGRICULTURE
Capacity-
building
of farmers
and
technical
staff on
sorghum
utilization
To build the
capacity of
farmers on
proper utilization
of sorghum, a
drought tolerant
crop and
encourage its
planting and
consumption for
improved food
security
Biliqo, Awasitu,
Bulesa, Merti,
Central, Oldon-
Nyiro, Kina, Rapsu,
Garfasa, Mochuro,
Kombola, Sericho
15,000
County
Government
Action Aid
6M Nil Aug-Oct
2016
Merti
Garba
Tulla
Provision of
water pumps and
support for
operational costs
for irrigation
(fuel subsidy)
Biliqo, Awasitu,
Bulesa, Merti,
Garfasa, Mochuro,
Kombola, Sericho
8,000 County
Government
3.2M Nil August –
Decembe
r 2016
Merti
Garba
Tulla
Damming of
Ewaso Nyiro
River for
irrigation
Biliqo, Awasitu,
,Bulesa, Merti,
Garfasa, Mochuro,
Kombola, Sericho
10,000 National and
County
Government,
Partners
105M Nil 2016/201
7 FY
Isiolo,
Merti and
Garba
Tulla
Introduction of
water-efficient
crops such as
NERICA rice
Biliqo, Awasitu,
Bulesa, Merti,
Central, Oldon-
Nyiro, Kina, Rapsu,
Garfasa, Mochuro,
Kombola, Sericho
15,000 National and
County
Government,
Partners
10M 5M 2016/201
7 FY

22
Sub
County
Intervention Location No. of
benefici
aries
Proposed
Implementers
Required
Resources
(Ksh)
Available
Resources
(Ksh)
Time
Frame
LIVESTOCK
G/tulla,
Merti and
Central
Disease
surveillance
deworming and
vaccination
against PPR,
sheep and goat
pox, CCPP,
Black Quarter
Entire county 100,000 FAO, ILRI and
county
government
2M 1.2M
available
for
deworming
FAO,
ILRI and
county
governme
nt
G/tulla,
Merti and
Central
Pasture re-
seeding in
degraded
rangelands and
promotion of
fodder
production to
improve
availability of
livestock feed
Chari ward
Kinna ward
Burat ward
Oldonyiro ward
3000 ILRI,
Department of
livestock
production
1.5M
July-Oct
2016
Garba
Tulla
To hold peace
meetings with
grazing
committees in
order to curb
conflicts.
To fast track
legislations to
manage the
rangelands (such
as the rangeland
management bill
in the county’s
county assembly)
in order to
regulate livestock
influx
Garba Tulla 10000 County
government,
Provincial
administration,
Peace
committees
2M July to
Dec 2016
WATER
Merti
Garba
Tulla
Repair of
generator and
piping system
Bassa/Alango
Kinna 4,000
County Govt,
Water Service
Trust Fund,
Partners
6M 1M
August
October
2016
Merti,
Isiolo,
Garbatulla
Capacity
building of
water committees
on group
dynamics
Bassa, Ngaremara,
Duse, Korbesa
12,000
County
government,
Aphia Imarisha
1M 0.5M August -
October
EDUCATION
Merti
Garba
Tulla
Provision of
fortified porridge
All ECDE centers
11,449 County
government
July-Dec
2016