isaac kohane, "a data perspective on autonomy, human rights, and the end of normality"
Upload: the-petrie-flom-center-for-health-law-policy-biotechnology-and-bioethics
Post on 11-Apr-2017
130 views
TRANSCRIPT

A Data Perspective on Autonomy, Human Rights, and the End of
NormalityIsaac S. Kohane, MD, PhD

JAMA

NATURE BIOTECHNOLOGY VOLUME 24 NUMBER 1 JANUARY 2006 59
of glycosylation, respectively. A decrease in TNNT1 and an increase in SYNJ1 have been found to be associated with differentiation from human embryonic and hematopoietic stem cells, respectively22,23.
We found gene-concept relations for other phenotypic concepts, including diseases. The only gene relating to leukemia is DDX24; mean normalized expression of DDX24 drops from 0.71 in the six data sets mea-suring this gene not associated with leukemia to 0.44 in the four data sets with the annotation (Supplementary Fig. 1c online, P = 0.007, Q = 0.01). Interestingly, this gene was first cloned from a leukemia cDNA library24.
The concept of injury represents an environmental annotation and was related only to GPX3 (plasma glutathione peroxidase) and MAPK14 (mitogen-activated protein kinase 14). Both demonstrate a significant increase in mean normalized expression levels in the four data sets asso-ciated with injury compared with over 100 other data sets measuring these genes without this annotation (Supplementary Fig. 1d,e online, GPX3 increases from 0.56 to 0.97; MAPK14 increases from 0.52 to 0.89; for both, P < 1 × 10⁻¹⁵ and Q < 0.0002). Both genes have been shown to be related to injury of various forms. Increased expression of plasma
Slc
2a1
(228
7)
Slc2a1 (20525)
Slc2a1 (24778)
Pnl
iprp
1 (2
1253
Pnliprp1 (18946) Pnliprp1 (84028)
Hmgcs2 (15360)
Cox5b (12859) (94194)
9195)
TN
NI1
(24
62)
TNNI1 (7135)
Tnni1 (21952)
Tnni1 (29388)
PG
AM
MY
H6
(200
98) MYH6 (4624)
Myh6 (29556)
MY
BP
C1
(184
6)
MYBPC1 (4604)
Mybpc1 (362867) C0026845:Muscle C0596981:Muscle Cells
C0242695:Muscle, Skeletal
C0521324:Skeletal
0
0.2
0.4
0.6
0.8
142
039
047
826
147
726
640
033
047
649
326
038
648
647
934
087 36
335
822
147
035
7 836
512 18
128
617
788 85 44
914
536
776 21
321
446
121
515
747
228
719
815
6
Mea
n no
rmal
ized
exp
ress
ion
leve
l of
Hs.
PD
LIM
3
Mea
n no
rmal
ized
exp
ress
ion
leve
l of
MM
./Pdl
im3
GDS annotated with one or more of four muscle concepts
GDS annotated with none of four muscle concepts
0
0.2
0.4
0.6
0.8
1
419
491
255
458
364
273
463
63 466
253
332
468
165
174 64
366 62
399
276
489
238
254
278
256
GDS annotated with one or more of four muscle concepts
GDS annotated with none of four muscle concepts
c
ba
d
Figure 3 Network of relations between 46 biomedical concepts extracted from the annotations of data sets in Gene Expression Omnibus and 444 genes with differential expression associated with the presence or absence of the concept. (a) Light blue nodes are UMLS concepts. Pink nodes are genes with higher expression levels in data sets annotated with their related concept; light green nodes are genes with lower expression levels in annotated data sets. Pink and green nodes are contained within gray squares indicating ortholog families. Edges (dashed) between an ortholog family and concept indicate statistically significant relations between that concept and each included gene. The remaining edges (solid arrows) indicate existing hierarchical relations between UMLS concepts. (b) Muscle Cells and three related concepts were among the most highly connected concepts, and relate to increased expression of MYH6, MYBPC1, Mybph, TNNI1 and other genes. (c) Of the human genes related to Muscle Cells, PDLIM3 shows the greatest differential expression. There is a significant increase in the normalized expression of PDLIM3 in the eight data sets annotated with Muscle Cells (dark shaded bars) compared with the 34 data sets without (light shaded bars). X-axis labels indicate GEO data set numbers. (d) A similar significant pattern of association with Muscle Cells is seen with mouse Pdlim3.
ANALYS IS
©20
06 N
atur
e Pu
blis
hing
Gro
up h
ttp://
ww
w.n
atur
e.co
m/n
atur
ebio
tech
nolo
gy
NATURE BIOTECHNOLOGY VOLUME 24 NUMBER 1 JANUARY 2006 55
Creation and implications of aphenome-genome networkAtul J Butte1 & Isaac S Kohane2
Although gene and protein measurements are increasing in quantity and comprehensiveness, they do not characterize a sample’s entire phenotype in an environmental or experimental context. Here we comprehensively consider associations between components of phenotype, genotype and environment to identify genes that may govern phenotype and responses to the environment. Context from the annotations of gene expression data sets in the Gene Expression Omnibus is represented using the Unified Medical Language System, a compendium of biomedical vocabularies with nearly 1-million concepts. After showing how data sets can be clustered by annotative concepts, we find a network of relations between phenotypic, disease, environmental and experimental contexts as well as genes with differential expression associated with these concepts. We identify novel genes related to concepts such as aging. Comprehensively identifying genes related to phenotype and environment is a step toward the Human Phenome Project5.
In analyzing a cancer sample, such as one extracted from a lung tumor, a plethora of factors, such as phenotype and clinical history (for example, chief complaint of hemoptysis, family history or tumor size), environ-mental exposures (for example, duration of exposure to asbestos or ciga-rette smoke) and experimental conditions (for example, anesthesia or sample preparation) have to be considered besides the more basic aspects of its gene expression and proteomic pattern. Though these snapshots of genomic and physiological states have been used to determine thera-peutic action1, they cannot solely represent either the entire ‘envirome,’ defined in an extended version of the initial definition by Anthony et al. for the special case of mental disorders, as the totality of equivalent environmental influences contributing to all disorders and organisms5, or the ‘phenome’, the physical totality of all traits of an organism as defined by Mahner and Kary5–7, of the sample and organism.
Relations between enviromic concepts and phenomic concepts have been invaluable to medicine. For example, one such relation is the asso-ciation of environmental exposure to cigarette smoke with the phe-notype of lung cancer development. Comprehensively relating specific
concepts in the envirome and phenome to specific genes could thus lead to the identification of new disease-associated genes5. Though some phenomic data are available8, these are greatly overshadowed in size by the >60,000 microarray measurements in repositories such as the Gene Expression Omnibus (GEO)9. Even for microarray data stored using standards like Minimum Information About a Microarray Experiment (MIAME) and Microarray Gene Expression Markup Language (MAGE-ML)10,11, contextual annotations are represented by unstructured nar-rative text; determining the phenotype and environmental context is no longer a tractable manual process. A question we have sought to answer is whether prior investments in biomedical ontologies can provide lever-age in finding phenome-genome and envirome-genome relations.
We show here that a large set of phenome-genome and envirome-genome relations can be found within a public repository of transcrip-tome measurements, if the phenotypes and environmental context can be ascertained for each experiment, along with the expression measure-ments. We accomplished this by creating a system that extracts contex-tual concepts from the sample annotations in GEO, represents these concepts using the Unified Medical Language System (UMLS), unifies the gene expression measurements across data sets using NCBI Gene identifiers and finally relates the gene expression measurements to the contextual concepts (Fig. 1). UMLS is the largest available compendium of biomedical vocabularies, containing >130 biomedical vocabularies with ~1-million interrelated concepts12. UMLS already unifies vocab-ularies used in molecular biology and genomics, such as the Medical Subject Headings (MeSH), NCBI Taxonomy and the Gene Ontology, with medical vocabularies including the International Classification of Diseases and SNOMED International9,13,14.
Establishing a phenome-genome networkAfter manual elimination of incorrectly assigned concepts (Methods and Supplementary Note online), mappings to 4,127 UMLS concepts remained (from 296,843 mappings to 5,115 strings). Concepts were from 18 source vocabularies, with MeSH (23%), Read Codes (17%) and SNOMED International (14%) contributing the most. The GEO series description annotation was the most information rich, as it provided unique concepts (Supplementary Table 1 online). This was likely because GEO series descriptions are often dissimilar to each other, compared to sample descriptions, which are often repeated. As expected, the concepts mapping to the most annotations are cells and RNA (Table 1).
Parsing failed on too short annotations, containing only laboratory identifiers and few recognizable words, or too long for parsing to com-plete. Regardless, over 99% of GEO samples were successfully directly
1Stanford Medical Informatics, Departments of Medicine and Pediatrics, Stanford University School of Medicine, 251 Campus Drive, Room X-215, Stanford, California 94305-5479 USA. 2Informatics Program and Division of Endocrinology, Children’s Hospital Boston and Harvard Medical School, 300 Longwood Avenue, Boston, Massachusetts 02115 USA. Correspondence should be addressed to A.J.B. ([email protected]).
Published online 10 January 2006; doi:10.1038/nbt1150
A N A LY S I S
©20
06 N
atur
e Pu
blis
hing
Gro
up h
ttp://
ww
w.n
atur
e.co
m/n
atur
ebio
tech
nolo
gy
a.k.a.The unreasonable effectiveness of gene expression
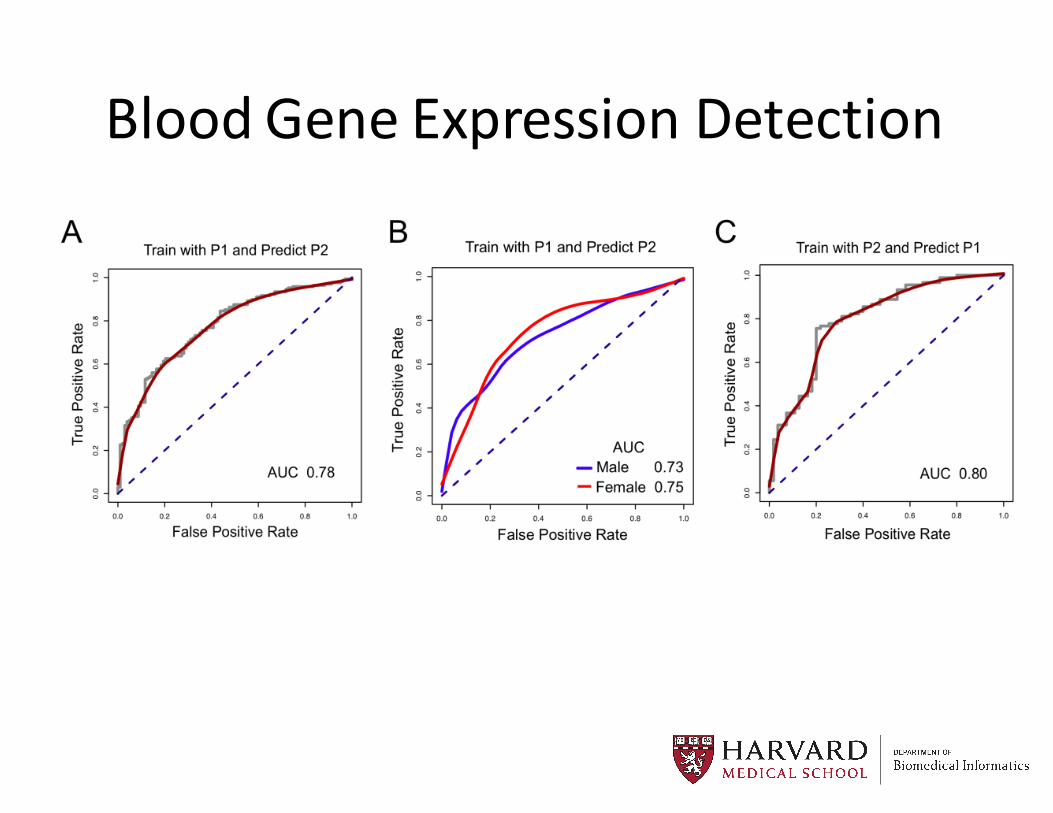
Blood Gene Expression Detection

Invited to HLS Meeting
“I think when Ari [Ne’eman] talks about autism and I talk about autism, we’re talking about people with different clusters of autism. I know he doesn’t like the word ‘cure.’ If my daughter could function the way Ari could, I would consider her cured,” says Singer. “I have to believe my daughter doesn’t want to be spending time peeling skin off her arm.”

Patterns across tens of thousands of patients…
6
Finale Doshi-Velez1 ,Yaorong Ge2 , Isaac Kohane1 1Harvard Medical School, 2Wake Forest University
Comorbidity Clusters in Autism Spectrum Disorders:A Time-Series Analysis Using Electronic Health Records
Motivation and ObjectiveThe distinct clinical trajectories of patients with autism spectrum disorders (ASD) has not been extensively studied, particularly as regards the clinical manifestations beyond the core neurobehavioral criteria defined in the Diagnostic and Statistical Manual of Mental Disorders (DSM). Understanding the patterns of co-occurrence of comorbidities is valuable for both
Generating hypotheses for common causes of these co-occurring comorbidities
Identifying patients at high risk for certain conditions based on a partial history
We use convenience sample of patients at a tertiary-care pediatric hospital was used to identifydistinct clinical trajectories of patients with ASD.
Patients4934 individuals (78% male) who were at least 15 years old with ICD9 codes of 299.00, 299.01, 299.80, 299.81, 299.90, 299.91 from the Boston Children's Hospital (from an original cohort of 13,740); 496 individuals (80% male) from Wake Forest University with the same criteria.
MethodsPreprocessing: (1) We grouped the 6905 distinct (non-procedure) ICD9 codes in the dataset into 802 PheWAS categories (dimensionality reduction). (2) We only considered PheWAS codes with at least 5% prevalence and patients with less than 50 of any particular code in 6-month period. This preprocessing step left us with 4927 individuals with 45 common category codes.
Clustering: For each patient, count the number of occurrences of each code in each 6-month window from age 0 to age 15. We then applied standard hierarchical clustering with Euclidean distance, Ward's linkage, and a minimum cluster size of 2% of the population.
Analysis: Significant elements of clusters were assessed by creating 15,000 permutations of random cluster assignments and creating an empirical chi-squared statistic distribution for the observed vs. expected number of code occurrences in each time window in each cluster.
Basic Cluster CharacteristicsFour subgroups were identified:
SubgroupSize Average Codes Proportion Male
Subgroup 1 120 150.0 (131.1-168.9) 0.6 (0.5-0.7)
Subgroup 2 197 178.6 (158.0-199.3) 0.7 (0.6-0.8)
Subgroup 3 212 103.6 (94.5-112.6) 0.8 (0.8-0.9)
Subgroup 4 4316 20.8 (19.9-21.6) 0.8 (0.8-0.8)
OutcomeSubgroup 1 Subgroup 2 Subgroup 3 Subgroup 4
Seizure 77.50 (70.03-84.97)
42.13 (35.24-49.03)
33.02 (26.69-39.35)
18.16 (17.01-19.32)
Psychiatric Disorders
6.67 (2.20-11.13)
9.64 (5.52-13.77)
33.02 (26.69-39.35)
5.84 (5.14-6.54)
GI Disorders 14.17 (7.93-20.41)
24.37 (18.37-30.36)
10.85 (6.66-15.04)
3.43 (2.89-3.97)
Auditory Disorders and Infections
55.83 (46.95-64.72)
87.82 (83.25-92.38)
47.17 (40.45-53.89)
23.12 (21.87-24.38)
Cardiac Disorders 30.83 (22.57-39.10)
32.99 (26.43-39.56)
24.06 (18.30-29.81)
6.93 (6.17-7.69)
patients
code counts0-6 months
code counts6-12 months
code counts12-18 months
patientclustering
Rates of ASD-Related ComorbiditiesWe see that subgroup 1 is characterized by seizures, subgroup 2 has higher rates of auditory disorders and infections, and subgroup 3 has much higher rates of psychiatric disorders. All three “sicker” subgroups have higher rates of cardiac disorders.
The trajectory of specific developmental delays (315 ICD9s) is also different for each group.
Inter-Hospital Prevalence ComparisonWe compared co-occurrences of seizures, psychiatric disorders, and GI disorders at Boston Children's Hospital and Wake Forest University.
Subgroup Characteristics
Su
bgro
up
1S
ubgro
up
2S
ubgro
up
3
The prevalence of psychiatric disorders at Boston
Children's Hospital was not correlated with seizure activity (Fisher's exact p=.17) or GI disorders (Fishers exact p = .04), but there was a significant correlation between GI disorders and seizures (Fisher's Exact p<0.001).
Similar results were obtained using data from 496 individuals at Wake Forest University: the prevalance of psychiatric disorders was not correlated with seizure activity (Fisher's Exact p = .13) or GI disorders (Fisher's Exact p = .64) but there was a significant correlation between GI disorders and seizures (Fisher's Exact p<0.001).
There was no significant difference between the statistics of the two hospital populations (chi-squared p = 0.22).
DiscussionLimitations: We are limited by the nature of EHR/ICD9 data, which are biased by the specialties available at each hospital and standards of diagnosis. For example, even though ASD is known to have a strong genetic component, we find a wide range of when ASD-codes appear between the different clusters.
Conclusions: Three distinct patterns of medical trajectories were identified by unsupervised clustering of electronic health record diagnoses. These may point to distinct etiologies with different genetic and environmental contributions.
Acknowledgements: We thank Julie Bickel for her detailed discussions and Jon Bickel for his assistance in providing the data.

0 5 10 15
020
40
60
80
Years
Cases
PDDCPEpilepsy
Autism or Autisms?

0 5 10 15
02
04
06
08
0
Years
Ca
ses
PDDCPEpilepsyOtitis m.Specific DDViral/Chlam

0 5 10 15
02
04
06
08
0
Years
Ca
ses
PDDCPEpilepsyOtitis m.Specific DDViral/ChlamPDDHyperkineticAnxiety

Genetics and Embryology of CAH


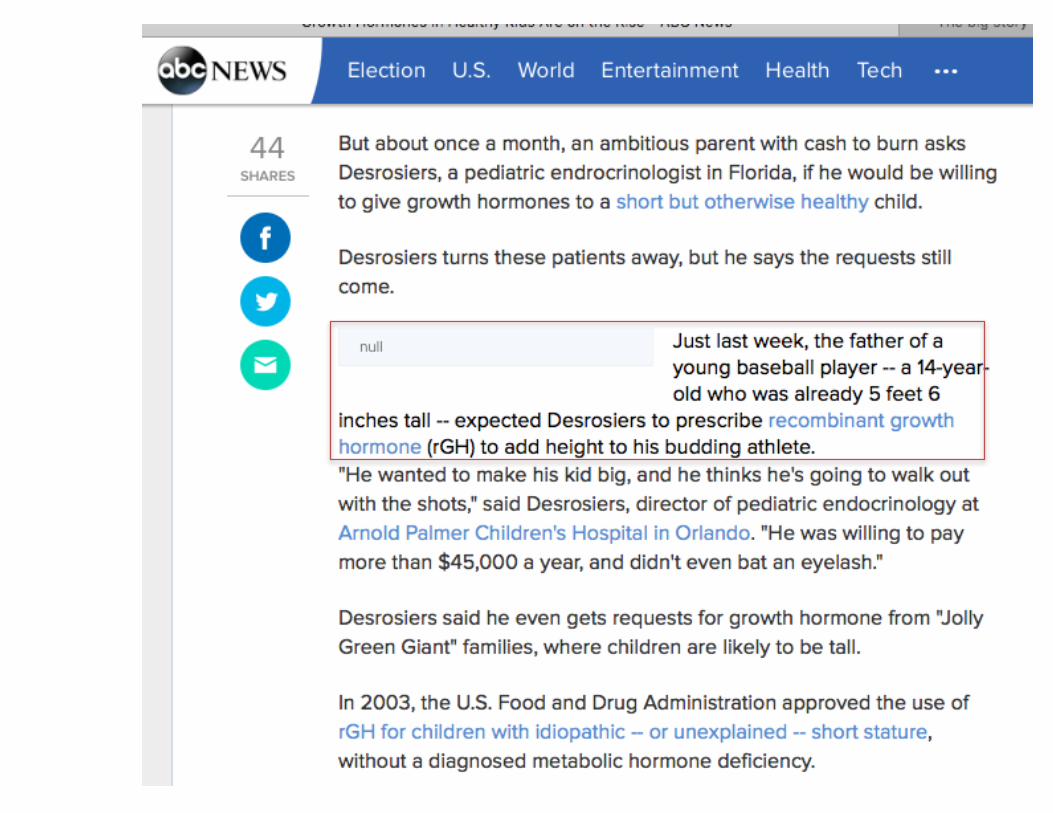
Dwarfism and GH-‐Deficiency
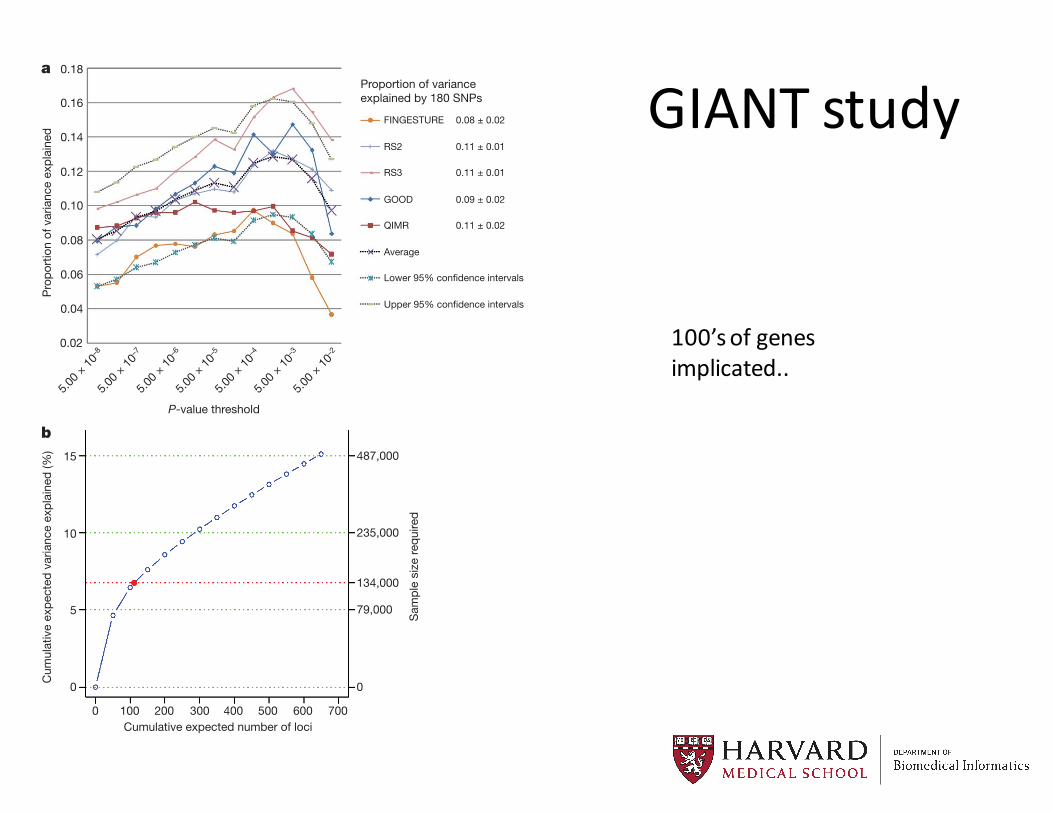
GIANT studyA further possible source of missing heritability is allelic heterogen-
eity: the presence of multiple, independent variants influencing a traitat the same locus. We performed genome-wide conditional analyses ina subset of stage 1 studies, including a total of 106,336 individuals. Eachstudy repeated the primary GWA analysis but additionally adjusted forSNPs representing the 180 loci associated at P , 5 3 1026 (Sup-plementary Methods). We then meta-analysed these studies in the sameway as for the primary GWA study meta-analysis. Nineteen SNPswithin the 180 loci were associated with height at P , 3.3 3 1027 (aBonferroni-corrected significance threshold calculated from the ap-proximately 15% of the genome covered by the conditioned 2 Mb loci;Table 1, Fig. 2, Supplementary Methods and Supplementary Figs 1and 3). The distances of the second signals to the lead SNPs suggestedthat both are likely to be affecting the same gene, rather than beingcoincidentally in close proximity. At 17 of 17 loci (excluding twocontiguous loci in the HMGA1 region), the second signal occurredwithin 500 kilobases (kb), rather than between 500 kb and 1 Mb, ofthis lead SNP (binomial test P 5 2 3 1025). Further analyses of allelicheterogeneity may identify additional variants that increase the pro-portion of variance explained. For example, within the 180 2-Mb loci,a total of 45 independent SNPs reached P , 1 3 1025 when we wouldexpect less than 2 by chance.
Although GWA studies have identified many variants robustly asso-ciated with common human diseases and traits, the biological signifi-cance of these variants, and the genes on which they act, is often unclear.We first tested the overlap between the 180 height-associated variantsand two types of putatively functional variants, non-synonymous (ns)SNPs and cis-expression quantitative trait loci (cis-eQTLs, variantsstrongly associated with expression of nearby genes). Height variantswere 2.4-fold more likely to overlap with cis-eQTLs in lymphocytesthan expected by chance (47 variants: P 5 4.7 3 10211) (Supplemen-tary Table 7) and 1.7-fold more likely to be closely correlated (r2 $ 0.8 inthe HapMap CEU sample) with nsSNPs (24 variants, P 5 0.004) (Sup-plementary Methods and Supplementary Table 8). Although thepresence of a correlated cis-eQTL or nsSNP at an individual locusdoes not establish the causality of any particular variant, this enrich-ment shows that common functional variants contribute to the causalvariants at height-associated loci. We also noted five loci where theheight associated variant was strongly correlated (r2.0.8) with var-iants associated with other traits and diseases (P , 5 3 1028), includ-ing bone mineral density, rheumatoid arthritis, type 1 diabetes,psoriasis and obesity, suggesting that these variants have pleiotropiceffects on human phenotypes (Supplementary Methods and Sup-plementary Table 9).
0.18
0.16
0.14
0.12
0.10
0.08
0.06
0.04
0.02
Pro
port
ion
of v
aria
nce
expl
aine
d
Proportion of varianceexplained by 180 SNPs
5.00 ×
10–8
5.00 ×
10–7
5.00 ×
10–6
5.00 ×
10–4
5.00 ×
10–5
5.00 ×
10–3
5.00 ×
10–2
P-value threshold
FINGESTURE 0.08 ± 0.02
RS2 0.11 ± 0.01
RS3 0.11 ± 0.01
GOOD 0.09 ± 0.02
QIMR 0.11 ± 0.02
Average
Lower 95% confidence intervals
Upper 95% confidence intervals
a
b15
10
5
0 0
79,000
134,000
235,000
487,000
0 100 200 300 400 500 600 700
Cum
ulat
ive
expe
cted
var
ianc
e ex
plai
ned
(%)
Sam
ple
size
requ
ired
Cumulative expected number of loci
Figure 1 | Phenotypic variance explained by common variants. a, Varianceexplained is higher when SNPs not reaching genome-wide significance areincluded in the prediction model. The y axis represents the proportion ofvariance explained at different P-value thresholds from stage 1. Results aregiven for five studies that were not part of stage 1. The proportion of variationexplained by the 180 SNPs is shown in the column to the right of the graph.b, Cumulative number of susceptibility loci expected to be discovered, includingalready identified loci and as yet undetected loci. The projections are based onloci that achieved a significance level of P , 5 3 1028 in the initial scan and thedistribution of their effect sizes in stage 2. The dotted red line corresponds toexpected phenotypic variance explained by the 110 loci that reached genome-wide significance in stage 1, were replicated in stage 2 and had at least 1% power.
Table 1 | Secondary signals at associated loci after conditional analysis
Second signal SNP Conditioned SNP ChromosomeSecond signal SNPposition
Distance of conditioned SNPfrom index SNP (base pairs) HapMap* r
2Second signal P valueafter conditioning
Second signal P valuepre-conditioning Gene
rs2280470 rs16942341 15 87,196,630 6,721 0.009 1 3 10214 1 3 10215 ACANrs10859563 rs11107116 12 92,644,470 141,835 0.003 3 3 10212 8 3 10210 SOCS2rs750460 rs5742915 15 72,028,559 95,127 0.004 4 3 10212 7 3 1028 PMLrs6938239 rs2780226 6 34,791,613 484,583 0.019 6 3 10212 9 3 10214 HMGA1rs7652177 rs572169 3 173,451,771 196,650 0.006 7 3 10211 1 3 10211 GHSRrs7916441 rs2145998 10 80,595,583 196,119 0.112 6 3 10210 3 3 1027 PPIFrs3792752 rs1173727 5 32,804,391 61,887 0.020 7 3 10210 4 3 1028 NPR3rs10958476 rs7460090 8 57,258,362 98,355 0.020 1 3 1029 5 3 10213 SDR16C5rs2353398 rs7689420 4 145,742,208 45,594 0.022 2 3 1029 1 3 10210 HHIPrs2724475 rs6449353 4 17,555,530 87,056 0.098 2 3 1029 8 3 10216 LCORLrs2070776 rs2665838 17 59,361,230 41,033 0.150 9 3 1029 1 3 10214 GH regionrs1401796 rs227724 17 52,194,758 60,942 0.005 2 3 1028 7 3 1027 NOGrs4711336 rs2780226 6 33,767,024 540,046 0.111 3 3 1028 5 3 1028 HMGA1rs6892884 rs12153391 5 170,948,228 187,815 0.000 4 3 1028 2 3 1025 FBXW11rs1367226 rs3791675 2 55,943,044 21,769 0.204 4 3 1028 0.1245 EFEMP1rs2421992 rs17346452 1 170,507,874 187,964 0.019 5 3 1028 1 3 1025 DNM3rs225694 rs7763064 6 142,568,835 270,147 0.001 1 3 1027 2 3 1026 GPR126rs10187066 rs12470505 2 219,223,003 393,610 0.022 2 3 1027 5 3 1028 IHHrs879882 rs2256183 6 31,247,431 241,077 0.016 2 3 1027 8 3 1028 MICA
*HapMap CEU phase II release 23. Nearest gene unless there is a known skeletal growth disorder gene in the locus. Positions are based on National Center for Biotechnology Information build 36. Nearestconditioned SNP where second signal occurs within 1 Mb of two conditioned SNPs.
LETTER RESEARCH
1 4 O C T O B E R 2 0 1 0 | V O L 4 6 7 | N A T U R E | 8 3 3
Macmillan Publishers Limited. All rights reserved©2010
100’s of genes implicated..

Criteria for Treatment
• “Growth hormone deficiency (GHD)”• “Idiopathic short stature (ISS), defined by height standard deviation score ≤-‐2.25” associated with growth rates unlikely to result in normal adult height, in whom other causes of short stature have been excluded
and a little story from 25 years ago

HCM

expected100 individuals
HCM Prevalence = 1:500HCM Inheritance = Autosomal Dominant
NHLBI ESP6503 individuals
observed
NHLBI ESP6503 individuals

Genetics-‐induced Health Disparities
18
• Hypertrophic Cardiomyopathy• Classical Autosomal dominant• 1:500 prevalence• Grounds for eliminating athletes from
teams• Affecting entire families
Confidential: For Review
Figure 1A
Figure 1B
Page 27 of 30
Confidential: Destroy when review is complete.
Submitted to the New England Journal of Medicine
123456789101112131415161718192021222324252627282930313233343536373839404142434445464748495051525354555657585960

Survival 3 Years After a WBC Test(White, Male, 50-69 Years;; Using Last WBC Between 7/28/05 and 7/27/06)
But over most of medicine…
• Even the most basic of autonomy, taking your data with you, is not the status quo.


What does data tell us about human rights and autonomy
• There is no “normal” but there are desired outcomes.• Utilities are not shared across parents, patients, providers and payors.
• Autonomy makes the data-‐sharing broader.• Broader data sharing highlights distinct utility functions.
• Activist-‐level data sharing today – Less energy required with #OpenData
• Much to be done in getting data analyses done “right”• In healthcare: Recognize and harness patients as collaborators.

Thank you