is there a future in nuclear power? talk given at earth, wind, & fire energy summit dallas,...
TRANSCRIPT

IS THERE A FUTURE IN NUCLEAR POWER?TALK GIVEN AT EARTH, WIND, & FIRE ENERGY SUMMIT
DALLAS, TEXAS, OCTOBER 4, 2014
ARJUN MAKHIJANI, PH.D.
WWW.IEER.ORG

Nuclear binary: All or nothing (24/7 or 0/365)
More than five dozen light water reactors prematurely shut for the long term or forever since 2011. Five in the United States for various reasons in 2013.
Nuclear is 24/7 until it is 0/365. Not so “baseload” as the industry would have you believe.
Nuclear is the most inflexible supply and incompatible with variable renewables. National Renewable Energy Lab high solar and wind scenario noted the need for flexible complements.
Nuclear is arguably the most undemocratic of all energy sources, though of course there are all the wars for oil to factor in.
Making plutonium just to boil water makes no sense.
Spending a lot of money and time on it makes even less (so we are in negative sense territory here).
But nuclear is a low CO2 source of energy. Can we do it without nuclear.
First some detail on nuclear.
2

Nuclear reactors – proliferation
Need 3,000 reactors – one a week to address CO2 globally in part.
2 to 3 uranium enrichment plants per year (one proposed for Idaho, 50 miles from Jackson Hole)
Annual global spent fuel: contain 90,000 bombs worth of plutonium per year if separated
3
Courtesy of Urenco
Photo courtesy of the U.S. Department of Energy. Image ID 2000033

Fresh fuel vs. spent fuel Fresh fuel 0.09 watts per metric ton of heat
Typical adult: 100 watts, more than thousand times as much as a ton of fresh fuel.
Fresh unirradiated fuel: low specific activity and once fabricated, very low risk.
Fresh spent fuel: death in seconds (if within a foot for instance).
100-year-old spent fuel: lethal dose in a few hours at one yard.
No good answer to the waste problem. So stop digging the spent fuel hole first.

Spent fuel from present U.S. reactor fleet
There will be ~100,000 metric tons of spent fuel (may be more) from the existing reactor fleet (exact amount will depend on relicensing)
It contains ~1,000 metric tons of plutonium, enough for ~120,000 nuclear bombs, if separated.
Indefinite storage could be catastrophic. Heuristic illustrations:
Strontium-90 in US inventory would, if diluted uniformly, contaminate the entire fresh water supply (groundwater and surface water) of the world to about 60 times the U.S. drinking water.
The Sr-90 inventory of a single twin-reactor nuclear power plant on Lake Michigan, such as the Donald C. Cook plant, would contaminate all the water in Lake Michigan to more than the drinking water limit even after a time lapse of more than 300 years: dispersal would be uneven and make make a wide area around the plant unlivable.
Plutonium-239 from one-twin reactor plant would be sufficient to contaminate all its water to more than the drinking water limit for about 80,000 years.
How about French approach?

How about France? The waste story
75-80 percent nuclear electricity
Reuse some Pu as fuel
Pay more ~$ 1 billion per year
10,000 bombs equivalent surplus Pu stored in France
100 million liters of liquid radioactive waste into English Channel per year pollution all the way to the Arctic
11 of 15 OSPAR government parties want it stopped
~99 percent waste content of spent fuel piling up – no repository yet and much opposition
Increase in repository waste volume – HLW plus GTCC
6
Copyright Pierre Gleizes / Greenpeace

LWR System Radwaste volumes (m3) with and without
reprocessing

Federal repository history
Early failure: Lyons. Kansas
1979 – preferred path for high-level waste and spent fuel is a repository – Interagency task Force
1982 Nuclear Waste Policy Act
1982-1986: a process marked by dismal science, ending with the political cancellation (after a meeting in the White House with then VP Bush’s staff) of the second repository.
1987: a political choice of Yucca Mountain, estimated in 1983 to be possibly the worst site (by the National Academies, though they did not say so in words – but data are there in the dose estimates) because there is no surface water for dilution (among other reasons).
Changing standards when Yucca Mountain deficiencies become evident (both EPA and NRC)
Since 2009 present impasse with Yucca Mountain in legal limbo, taxpayers paying for storage, and no path forward.
2012: court says NRC does not have a valid waste confidence document.
Note: The Department of Energy has never met a repository it did not like since the 1960s.
2014: WIPP fire and no valid analysis of cause
Temporary storage may well become permanent since all pressures to take it elsewhere will be lifted. As the history of utility contracts with DOE shows, legal documents are not enough to lead to actual action.

Basic geologic isolation system
Three elements of an isolation system:
Spent fuel, containers, engineered barriers
Repository backfill and sealing system (including shaft and drift sealing)
Host rock and geologic setting
Each element must be evaluated. Natural analogs for materials have been studied and need more attention. All elements must work together for containment and to provide redundancy. For instance, metal containers in an oxidizing environment, as in Yucca Mountain, invite problems. Metal containers in a reducing environment, as in Sweden, provide a sounder approach.

Should there be consolidated storage?
No repository
No safety standard
No scientific research on the technical feasibility of a geologic isolation system to meet safety standards
No independent institution apart from waste creators (governmental and private) to manage the repository process
An NERC that assumes that storage on site can be secure and can last for thousands of years with the government appropriating funds
“Consolidated storage” creates one more site, needless transportation risks
Inviting it is uninformed consent
10

Electricity system characteristics
1. Reliability
2. Resilience
3. Reasonable cost
4. Consumer choice and energy democracy
5. Low to zero emissions – not just low CO2 but also SOx, Nox
6. No drastic side effects like nuclear proliferation, catastrophic accidents, and wastes whose effects are multi-generational
7. Low water use and consumption
8. Resistance to malevolent actions
Nuclear has one out of eight – a failing grade in my book.
11

Residential and Commercial Efficiency Examples
Efficiency improvement of 3 to 7 times is possible per square foot
Existing homes more costly to backfit but much is still economical
Standards at the local and state level are needed
Zero net CO2 new buildings and communities by 2025 can be mandated
Residential Efficiency
0
10,000
20,000
30,000
40,000
50,000
60,000
70,000
U.S. Average,residential
Takoma co-housing Hanover house
Btu/ft2
Commercial Efficiency
0
20,000
40,000
60,000
80,000
100,000
120,000
US average,commercial
PA DEP Durant MiddleSchool, NC
Btu/ft2
12

Refrigerator standards and cost
13
14
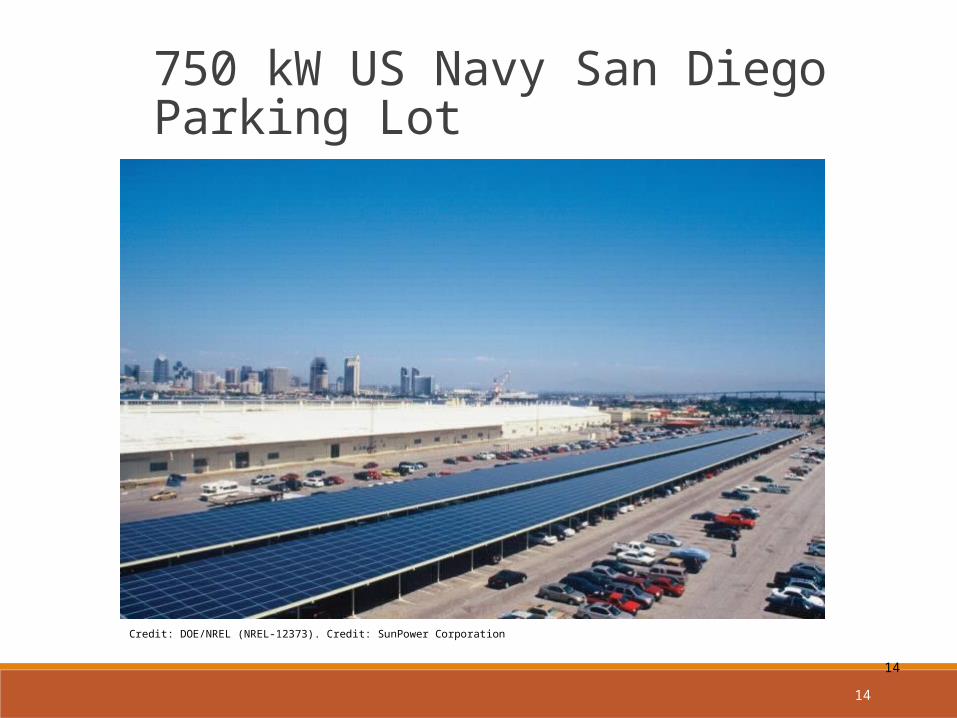
750 kW US Navy San Diego Parking Lot
14
Credit: DOE/NREL (NREL-12373). Credit: SunPower Corporation

First the great news – German small-medium system PV prices
15
Sou
rce:
BS
W-S
olar
201
2

Bright day, looming clouds
16
Source: www.mpoweruk.com
Credit: Avesun | Dreamstime.com

Dealing with intermittency
Smart grid: consuming devices talk to producing devices; storage devices, smart meters, mediate conversation.
Store heat while the sun shines. Store cold while the wind blows. Solar and wind integration Existing hydro backup Existing natural gas standby (U.S. has enormous surplus capacity), long-term: replace fuel with biogas (use aquatic plants, such as microalgae, as feedstock)
IGCC solid biomass (e.g., algae), geothermal, CHP Other storage elements, medium- to long-term (compressed air, including, vehicle-to-grid, dispatchable wind – produce compressed air instead of electricity at the turbine and generate electricity when needed, e.g., General Compression http://www.generalcompression.com
17

COMPRESSED AIR ENERGY STORAGE Compresse
d Air Energy Storage
Currently most promising in a wide variety of settings. Like compressed natural gas storage.
Geology requirements have to be met.
Source: http://www.sandia.gov/media/NewsRel/NR2001/norton.htm

19
The Ice Bear - Designed for building controls, reliability and serviceability – courtesy Ice Energy, www.ice-energy.com
• 30” door swing• magnetic “catch” in open position
• Hinge with positive stop and “latch”
• CoolData Controller™
• Refrigerant pump uses 100 W on peak
• Compressor location
• Door on opposite side for access to compressor and water pump
CoolData™ Controller is designed to monitor and control up to 200 building data points, serve as FDD and communicate with EthernetCourtesy of Ice Energy

Tesla: 0 to 60 in 4 secs. (goal); 200 mile range, 0.2 kWh/mile, off-the-shelf lithium-ion batteries combined in special battery pack
20
Courtesy of Tesla Motors

Sodium sulfur batteries with wind power in Japan
21
Courtesy of NGK Insulators

Modeling 100% Renewable MN
Mon Tues Wed Thurs Fri Sat Sun

Utah: Hourly demand, renewable supply and storage, summer week, fully renewable scenario. Note large amount of “spilled energy”

24
Electricity production
0
500
1000
1500
2000
2500
3000
3500
4000
4500
5000
2010 2015 2020 2025 2030 2035 2040 2045 2050
Year
Bill
ion
kWh
Coal Natural gasOil NuclearHydropower Geothermal, wood waste, landfill gas, etc.Biomass (solid) Biomass derived gas standbyGeothermal hot rock WindSolar PV central station and intermediate Solar PV small scaleSolar thermal and other Combined Heat and Power

25
End noteSlides are primarily a summary of Carbon-Free and Nuclear-Free: A Road Map for U.S. Energy Policy by Arjun Makhijani
Find the source citations in the downloadable version of the book, available at no cost, on the Web at http://www.ieer.org/carbonfree/CarbonFreeNuclearFree.pdf or contact IEER.
The book can be purchased in hard copy at www.ieer.org.
Graphics also from: Renewable Minnesota (2012) at http://www.ieer.org/reports/renewableminnesota, and eUtah, a Renewable Energy Roadmap (2010) at http://www.ieer.org/reports/eUtah2010.pdf.