is there a fundamental 300 hz limit to pulse rate discrimination in cochlear implants?
TRANSCRIPT

Research Article
Is There a Fundamental 300 Hz Limit to Pulse RateDiscrimination in Cochlear Implants?
PIETER J. VENTER1
AND JOHAN J. HANEKOM1
1Bioengineering, Department of Electrical, Electronic and Computer Engineering, University of Pretoria, Private Bag X20,Hatfield, 0028, Pretoria, South Africa
Received: 6 December 2012; Accepted: 28 May 2014
ABSTRACT
Literature often refers to a 300 pps limit for cochlearimplant (CI) electrical stimulation, above which pulserate discrimination deteriorates or above which ratepitch is not perceived to increase. The present studyinvestigated the effect on pulse rate difference limens(PRDLs) when using compound stimuli in whichidentical pulse trains were applied to multiple elec-trodes across the length of the electrode array andcompared the results to those of single-electrodestimuli. PRDLs of seven CI users were determined intwo stimulus pulse phase conditions, one in which thephase delays between pulses on different electrodeswere minimised (burst mode) and a second in whichthey were maximised (spread mode). PRDLs weremeasured at base rates of 100 to 600 pps in 100 ppsintervals, using compound stimuli on one, two, five,nine and 18 electrodes. As smaller PRDLs wereexpected to reflect improved rate pitch perception,18-electrode spread mode stimuli were also includedin a pitch ranking task. PRDLs improved markedlywhen multi-electrode compound stimuli were used,with average spread mode PRDLs across listenersbetween 6 and 8 % of the base rate in the wholerange tested (i.e. up to 600 pps). PRDLs continued toimprove as more electrodes were included, up to atleast nine electrodes in the compound stimulus.Stimulus pulse phase had a significant influence onthe results, with PRDLs being smaller in spread mode.Results indicate that pulse rate discrimination may bemanipulated with stimulus parameter choice so thatpreviously observed deterioration of PRDLs at 300 pps
probably does not reflect a fundamental limitation torate discrimination. However, rate pitch perceptiondid not improve in the conditions that resulted insmaller PRDLs. This may indicate that listeners usedcues other than pitch to perform the rate discrimina-tion task or may reflect limitations in the electricallyevoked neural excitation patterns presented to a ratepitch extraction mechanism.
Keywords: cochlear implants, rate pitch, ratediscrimination thresholds, multi-electrode stimuli,across-channel integration
INTRODUCTION
It has been known for a long time that users ofcochlear implants (CIs) can perceive pitch based oneither place cues or rate cues (Tong et al. 1982, 1983;Townshend et al. 1987), and it has been shown thatthese cues are independent (Tong et al. 1983; McKayet al. 2000). Several factors limit the effectiveness ofplace pitch coding in CI. Pitch-place mismatchesoften arise, as filter bands associated with electrodesare typically not matched to the cochlear locations ofthe electrodes (Nardo et al. 2008). Also, the limitednumber of physical electrodes (Eisen and Franck2005) and the effect of current spread (Boex et al.2003; Xi et al. 2009) both limit place pitch resolution.
Rate coding of pitch, on the other hand, mayprovide more precise control of pitch. Action poten-tials are entrained to stimulation pulses at lowstimulation pulse rates, resulting in these occurringat the stimulation pulse rate. Most CI users have goodpulse rate discrimination at low rates. It has been
Correspondence to: Johan J. Hanekom & Bioengineering, Departmentof Electrical, Electronic and Computer Engineering & University ofPretoria & Private Bag X20, Hatfield, 0028, Pretoria, South Africa.Telephone: +27 12 4202461; email: [email protected]
JARO (2014)DOI: 10.1007/s10162-014-0468-6D 2014 Association for Research in Otolaryngology JARO
Journal of the Association for Research in Otolaryngology

shown that some CI users can identify melodies whenpulse rate is varied on a single electrode channel (Pijland Schwarz 1995b) and can also identify musicalintervals (Pijl and Schwarz 1995a; McDermott andMcKay 1997; Pijl 1995, 1997). Pulse rate discrimina-tion varies greatly between users. Discriminationthresholds at a base rate of 200 pps have beenmeasured to be as small as 10 pps (McDermott andMcKay 1997) for some users and up to 100 pps(Townshend et al. 1987) for others. A repeatedobservation in the CI literature has been that CI usershave a steeply decreasing sensitivity to changes in therate of a pulse train applied to a single channel of a CIabove around 300 pps (Shannon 1983; Tong et al.1987; Townshend et al. 1987; McDermott and McKay1997; McKay et al. 2000; Zeng 2002). This has oftenbeen referred to as the "300-Hz limit" to ratediscrimination. This limit may restrict the usablerange of rate encoding of pitch in CIs (see, forexample, Carlyon et al. 2010a).
In contrast, normal hearing (NH) listeners pre-sented with filtered pulse trains can detect ratechanges at significantly higher base rates than CIusers discriminating electric pulse rates on a singleelectrode (Carlyon and Deeks 2002). NH listenersmay use phase-locking cues to estimate pure tonefrequencies of up to 2 kHz (Micheyl et al. 1998) orhigher. While phase-locking cues in mammals areweak above 4 to 5 kHz (Johnson 1980), the ability toestimate the pitch of pure tones may still depend ontemporal mechanisms up to 8 kHz (Moore and Ernst2012). This poses the question: is it possible forcochlear implantees to achieve smaller pulse ratediscrimination thresholds (or pulse rate differencelimens, PRDLs) than has been demonstrated?
A number of studies have endeavoured to answerthis question. Different approaches have been follow-ed, ranging from varying stimulus parameters and theplace of stimulation to adding more electrodes.Carlyon et al. (2010a) found that neither increasedstimulus duration nor addition of an amplitude rampto the stimulus had any significant influence on theupper limit of rate pitch. The rationale was thatstimulus manipulations that are expected to markedlyinfluence auditory nerve (AN) spike train patternsmay influence discrimination thresholds that rely ontemporal aspects of spike trains. They also establishedthat a more stochastic pattern of neural firing,obtained by the addition of 5,000-pps backgroundpulses, had no influence on the upper limit of ratepitch. One study tested rate discrimination thresholdswith deeply inserted electrodes using the MED-ELCOMBI 40+ implant (Baumann and Nobbe 2004), asit was thought that rate coding might be moreeffective closer to the apical end of the cochleabecause of its tuning to lower characteristic frequen-
cies. Applying stimulation pulses to a more apical site(in this case, about 25.5 mm from the round window)in the cochlea, however, did not result in improvedPRDLs. Some recent studies, though, did show thatstimulation of more apical neural populations result-ed in improved phase locking in cats (Middlebrooksand Snyder 2010) and indeed Macherey et al. (2011)found that the upper limit of temporal pitch could beextended somewhat when asymmetric pulses wereused on apical electrodes. Asymmetric pulses canpotentially direct stimulation more towards the co-chlear apex (Macherey and Carlyon 2012). Carlyon etal. (2008) showed that the deterioration of ratediscrimination thresholds at higher pulse rates couldnot be alleviated by introducing interaural timingcues in bilateral implantees. Kong et al. (2009) foundthat users of the Med-El C40+ implant performedsignificantly better at a rate discrimination task withpulse rates of 300 to 500 pps than a group of CochlearCI24 users. These improvements at higher rates werelater confirmed in a second study with the same groupof participants (Kong and Carlyon 2010). These twostudies suggest that CI design may influence ratediscrimination abilities of CI users to some extent, butthe high inter-subject variability of rate discriminationexperiments and the limited number of participantspreclude clear conclusions from these results.
The effects of using multiple electrodes for thecoding of rate pitch have not been investigated untilrelatively recently. The data of Macherey and Carlyon(2010) show some differences between single-channeland dual-channel stimuli. Dual-channel stimuli wereapplied to neighbouring electrode pairs, using narrowbipolar stimulation (BP+1 or BP+2 modes). Whilesingle-channel pitch ranking asymptoted at around300 pps for all participants, dual-channel pitchcontinued to increase beyond this point for three ofthe six participants, up to the highest rate tested(516 pps). However, when applying pulse trains toseven neighbouring electrodes (using MP1+2monopolar stimulation mode), Carlyon et al. (2010a)found no improvement over single-electrode stimuliin the upper limit of rate pitch.
The present study endeavoured to answer thequestion: will stimulation pulse trains applied over awide area of the cochlea (as wide as the electrodearray allows) yield better PRDLs than on a singleelectrode or a limited number of adjacent electrodes?The effect of two main stimulus manipulations onPRDL was tested wherein the stimulus phase wasvaried, as explained in the next section. As theintention of stimulus manipulations was to find waysto extend the range of rates over which CI listenershad good pulse rate discrimination ability and as theunderlying assumption was that the latter woulddirectly influence rate pitch and could potentially
VENTER AND HANEKOM: Limit to Pulse Rate Discrimination
expand the rate pitch range, pitch ranking was alsotested with the stimuli that were found to have thelargest influence on PRDLs.
Three main experiments were carried out with CIusers as participants. The objective of the firstexperiment was to determine whether smaller PRDLsthan those reported previously for single-electrodestimuli were possible in an all-electrode condition. Assmaller PRDLs were indeed observed, the secondexperiment considered the influence of the numberof electrodes in a compound stimulus. The thirdexperiment considered whether observed smallerPRDLs would reflect in improved rate pitch percep-tion. An additional experiment tested whether loud-ness cues may have influenced measured PRDLs.
METHODS
Participants and Equipment
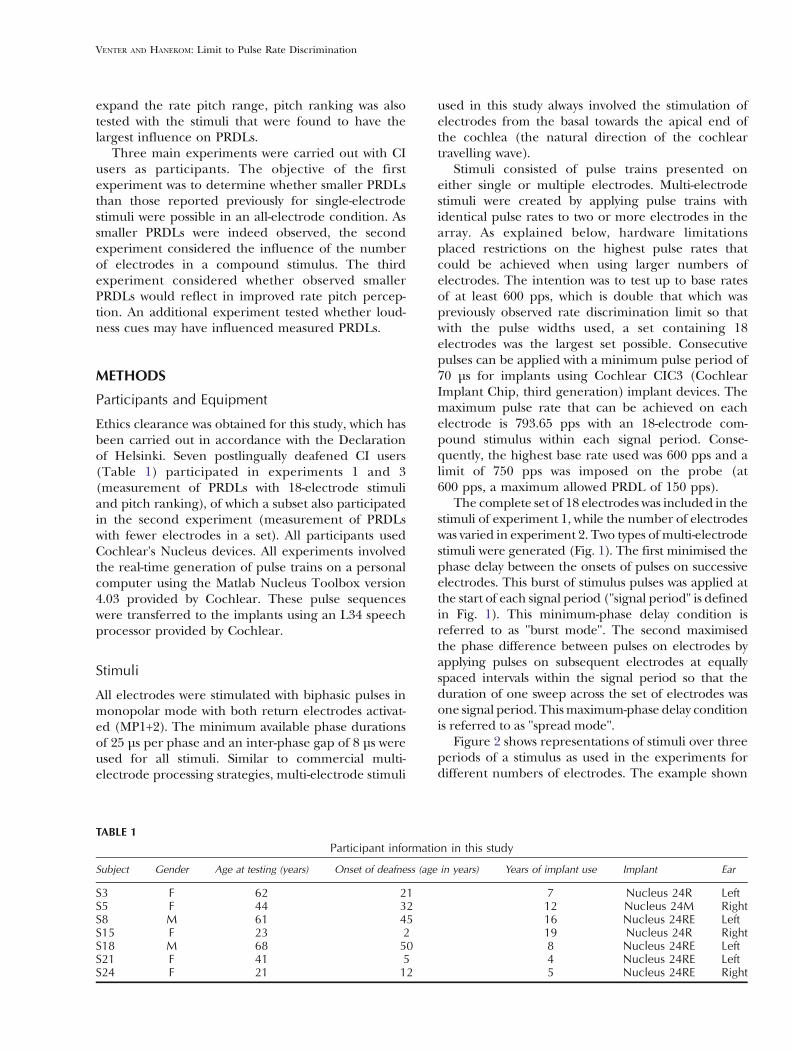
Ethics clearance was obtained for this study, which hasbeen carried out in accordance with the Declarationof Helsinki. Seven postlingually deafened CI users(Table 1) participated in experiments 1 and 3(measurement of PRDLs with 18-electrode stimuliand pitch ranking), of which a subset also participatedin the second experiment (measurement of PRDLswith fewer electrodes in a set). All participants usedCochlear's Nucleus devices. All experiments involvedthe real-time generation of pulse trains on a personalcomputer using the Matlab Nucleus Toolbox version4.03 provided by Cochlear. These pulse sequenceswere transferred to the implants using an L34 speechprocessor provided by Cochlear.
Stimuli
All electrodes were stimulated with biphasic pulses inmonopolar mode with both return electrodes activat-ed (MP1+2). The minimum available phase durationsof 25 μs per phase and an inter-phase gap of 8 μs wereused for all stimuli. Similar to commercial multi-electrode processing strategies, multi-electrode stimuli
used in this study always involved the stimulation ofelectrodes from the basal towards the apical end ofthe cochlea (the natural direction of the cochleartravelling wave).
Stimuli consisted of pulse trains presented oneither single or multiple electrodes. Multi-electrodestimuli were created by applying pulse trains withidentical pulse rates to two or more electrodes in thearray. As explained below, hardware limitationsplaced restrictions on the highest pulse rates thatcould be achieved when using larger numbers ofelectrodes. The intention was to test up to base ratesof at least 600 pps, which is double that which waspreviously observed rate discrimination limit so thatwith the pulse widths used, a set containing 18electrodes was the largest set possible. Consecutivepulses can be applied with a minimum pulse period of70 μs for implants using Cochlear CIC3 (CochlearImplant Chip, third generation) implant devices. Themaximum pulse rate that can be achieved on eachelectrode is 793.65 pps with an 18-electrode com-pound stimulus within each signal period. Conse-quently, the highest base rate used was 600 pps and alimit of 750 pps was imposed on the probe (at600 pps, a maximum allowed PRDL of 150 pps).
The complete set of 18 electrodes was included in thestimuli of experiment 1, while the number of electrodeswas varied in experiment 2. Two types of multi-electrodestimuli were generated (Fig. 1). The first minimised thephase delay between the onsets of pulses on successiveelectrodes. This burst of stimulus pulses was applied atthe start of each signal period ("signal period" is definedin Fig. 1). This minimum-phase delay condition isreferred to as "burst mode". The second maximisedthe phase difference between pulses on electrodes byapplying pulses on subsequent electrodes at equallyspaced intervals within the signal period so that theduration of one sweep across the set of electrodes wasone signal period. Thismaximum-phase delay conditionis referred to as "spread mode".
Figure 2 shows representations of stimuli over threeperiods of a stimulus as used in the experiments fordifferent numbers of electrodes. The example shown
TABLE 1Participant information in this study
Subject Gender Age at testing (years) Onset of deafness (age in years) Years of implant use Implant Ear
S3 F 62 21 7 Nucleus 24R LeftS5 F 44 32 12 Nucleus 24M RightS8 M 61 45 16 Nucleus 24RE LeftS15 F 23 2 19 Nucleus 24R RightS18 M 68 50 8 Nucleus 24RE LeftS21 F 41 5 4 Nucleus 24RE LeftS24 F 21 12 5 Nucleus 24RE Right
VENTER AND HANEKOM: Limit to Pulse Rate Discrimination

is for a signal period of 10 ms (100 pps stimulus rate).Note that the unit pulses per second used in theremainder of this text refers to the per-channel pulserate.
For the 18-electrode stimuli, electrodes 3 to 20were used. Stimuli involving fewer electrodes weregenerated by spreading the activated electrode setacross a similarly wide range across the cochlea. Forthe nine-electrode stimuli, every second electrode ofthe 18-electrode stimuli was omitted, resulting instimuli consisting of all even numbered electrodes
between 3 and 20. Likewise, five-electrode stimuliincluded electrodes 4, 8, 12, 16 and 20, while two-electrode stimuli included only electrodes 8 and 16.The single-electrode stimuli were applied in themiddle of the array on electrode 11. PRDLs weremeasured at base rates of 100 to 600 pps at intervals of100 pps for each of these stimulus conditions,explained below.
The 18-electrode and nine-electrode spread modestimuli of experiment 1 were used in experiment 3 (pitchranking) and an additional 700-pps stimulus was includ-
0 5 10 15 20
20
16
12
8
4
0 5 10 15 20
20
16
12
8
4
0 5 10 15 20
20
16
12
8
4
0 5 10 15 20
20
16
12
8
4
0 5 10 15 20
20
16
12
8
4
0 5 10 15 20
20
16
12
8
4
Time (ms)
Ele
ctro
des
TBurs St pread
100 pps
300 pps
600 pps
A D
B E
C F
FIG. 1. Exemplar electrode stimulation patterns for burst (leftcolumn) and spread (right column) mode stimuli are shown for acompound stimulus with five electrodes. Each vertical line representsa biphasic stimulation pulse. The three rows show examples of 100,300 and 600 pps stimuli, respectively, with 100, 300 and 600 ppssignals represented by these five-electrode stimuli appearing at the
top of the panels. T defines one signal period, which is 10 ms in thepulse trains in the top row. Burst mode stimuli occur at the beginningof a signal period, while spread mode stimuli are spread across asignal period. The bold horizontal bars indicate the duration of astimulus sweep relative to one period of the signal.
VENTER AND HANEKOM: Limit to Pulse Rate Discrimination

ed. The seven stimuli (with rates 100 to 700 pps in steps of100 pps and duration 500 ms) were carefully loudnessbalanced before commencement of the pitch rankingtask, as described in the next section. Stimuli werepresented at 85 % of dynamic range.
Loudness Balancing
Before experiments 1 and 2 commenced, loudnessbalancing was carried out to ensure that all base
rates were presented at the same loudness level.The reference loudnesses of all stimulus configura-tions (conditions with different numbers of elec-trodes, stimulated in spread and burst modes, i.e. atotal of nine stimulus configurations as shown inFig. 2) at all six base rates were carefully balancedto be the same. This was to ensure that presenta-tion level or loudness could not influence mea-sured PRDLs at different base rates or withdifferent stimulus configurations.
0 10 20 30
20
11
3
0 us
0 10 20 30
20
11
3
0 us
0 10 20 30
20
16
83
70 us
0 10 20 30
20
16
83
5.0 ms
0 10 20 30
20
12
4
280 us
0 10 20 30
20
12
4
8.0 ms
0 10 20 30
20
12
4
560 us
0 10 20 30
20
12
4
8.9 ms
0 10 20 30
20
11
3
1.2 ms
0 10 20 30
20
11
3
9.4 ms
Time (ms)
Ele
ctro
des
Burs St pread
1 electrode
2 electrodes
5 electrodes
9 electrodes
18 electrodes
A
B
C
D
E
F
G
H
I
J
FIG. 2. Three periods of the stimulation patterns used in thepresent study for different numbers of electrodes. Each vertical linerepresents a biphasic stimulation pulse. The stimuli shown are for achannel rate of 100 pps/channel. The two columns illustrate burstand spread mode stimuli, respectively. Three modes of stimulationare shown: single-electrode stimuli in panels (A) and (F), burst mode
stimuli that included two, five, nine, and 18 electrodes, respectively,in panels (B)–(E) and the same stimuli for spread mode in panels(G)–(J). Panels (A) and (F) are the same but were included in bothcolumns to simplify comparison with the burst and spread modestimuli in the two columns. The duration of each stimulus sweep isgiven next to the last stimulation pulse of the first sweep.
VENTER AND HANEKOM: Limit to Pulse Rate Discrimination

The reference sound was a compound stimulusproduced by stimulation of electrodes 5, 11 and 18 inspread mode at a base rate of 200 pps. The dynamicranges of each electrode (difference between acurrent level at a loud but comfortable loudness leveland the current level at threshold) from the clinicalmaps of the participants were used to obtain startingvalues of current levels. Participants first had to adjustthe reference sound to a comfortable loudness levelwhich had to be between 50 and 75 % of the dynamicrange for the compound stimulus. Each electrode inthe compound stimulus was stimulated at the samepercentage of dynamic range of the particular elec-trode. When adjusting the loudness, each electrode inthe set was adjusted by the same percentage ofdynamic range. This was based on a recent observa-tion that the adjustment of pulse rate had aninsignificant effect on the tilt and curvature ofthreshold and comfort level profiles (Wesarg et al.2010). After setting a comfortable level, participantshad to adjust the stimuli at all six base rates of all theother stimulus configurations (burst and spread modewith different numbers of electrodes, a total of 54conditions) to this reference loudness level.
The loudness balancing procedure consisted of thepresentation of two intervals (500 ms each, with a 300-ms quiet gap between these) of which the firstcontained the reference stimulus and the secondcontained one of the probe stimuli. The probestimulus could be adjusted to obtain a loudness equalto that of the reference sound. To adjust probestimulus loudness, all electrodes included in thecompound stimulus were adjusted in level by an equalpercentage of the dynamic ranges of the respectiveelectrodes.
In the experiments that followed (experiments 1and 2), the base and probe stimuli were alwayspresented at the current levels determined in theloudness balancing procedure with the pulse rate ofthe probe stimulus the only variable. Although all thereference stimuli (stimuli presented at a base rate)were loudness balanced, the probe stimuli were not,i.e. stimuli presented at rates that vary from the baserate during the staircase procedure used to determinethe PRDL (explained below) were not loudnessbalanced. The number of probe stimuli used duringthe staircase procedure made loudness balancingimpractical.
It is conceivable that small differences in rate (asthe probe rate varies from the base rate during thestaircase procedure) may have resulted in smalldifferences in loudness. Level roving was used insome studies to encourage listeners to attend to pitchdifferences, rather than to remaining loudness cues(e.g. Baumann and Nobbe 2004; Chatterjee andOberzut 2011). This approach is, however, not
universal and some authors preferred not to rovelevel (e.g. Kong et al. 2009; Carlyon et al. 2008; Zeng2002). The reason for this is that, although importantto eliminate possible loudness cues, level roving maybe a confounding factor that could influence the data.Carlyon et al. (2010b) showed that small leveldifferences could influence pitch judgements so thatroving may adversely influence a pitch perceptionexperiment. Roving generally degrades overall perfor-mance in pitch perception tasks (see, e.g. Cousineauet al. 2009). For example, Baumann and Nobbe(2004) showed that PRDLs more than doubled whenlevel roving was applied. The strength of the delete-rious effect of roving varied across listeners, and intheir work, Baumann and Nobbe decided on a level of5 % roving as an adequate compromise. The influ-ence on rate discrimination thresholds when presen-tation level varied by up to 5 % was seen as acceptablysmall.
The approach in the present study was different.To avoid the deleterious effect of roving in thepresent work, loudness was carefully balanced for allreference stimuli, but no level roving was used.Rather, an additional experiment was carried out todetermine whether loudness differences may poten-tially have influenced the measured rate discrimina-tion thresholds. Participants had to loudness balancea stimulus presented at the base rate against astimulus presented at a higher rate reflecting theirmeasured PRDL in a particular condition. This isexplained below (experiment 4).
Loudness balancing of stimuli for the pitch rankingexperiment closely followed the procedure used toloudness balance stimuli of experiments 1 and 2. Theseven base rates (100 to 700 pps) of each of the threeelectrode-number conditions (single, 9 and 18) wereloudness balanced to a reference stimulus in threeseparate loudness balancing tasks.
Procedure of Experiments 1 and 2: Measurementof PRDLs
PRDLs were measured using an adaptive four-intervaltwo-alternative forced choice (4I2AFC) procedure.Two intervals were presented with a silent gap of500 ms between these. Each interval contained two500-ms sound bursts separated by a silent gap of300 ms. The first sound burst in each interval waspresented at the base rate, while the second waspresented at the same rate in one interval and at arate differing from the reference in the other interval.This probe burst had a higher rate than the referenceand randomly appeared in either of the two intervals.Participants were asked to identify the interval wherethe two sound bursts differed in pitch. No feedback
VENTER AND HANEKOM: Limit to Pulse Rate Discrimination

was provided to indicate correct or incorrect re-sponses.
For the base rates of 100, 200, 300, 400, 500 and600 pps, the starting probe rates were 200, 300, 400,500, 650 and 750 pps, respectively. A two-down, one-up protocol was used, converging on the point wherethe listener could discriminate the base rate from theprobe rate 71 % of the time (Levitt 1971). Twosuccessive correct responses were required before theprobe rate was adjusted to be closer to the base rate,while one error resulted in a larger differencebetween probe and base rates. The difference be-tween the base and probe rates was initially adjustedby a factor of 1.6, and this factor was adjusted aftertwo and four reversals to values of 1.4 and 1.2,respectively. The adaptive procedure terminated afterten reversals. The PRDL values were estimated bytaking the geometric average between the rates of thelast six reversals.
With the expectation that single-electrode PRDLswould deteriorate steeply from a base rate of around300 pps, PRDLs were determined at base rates from100 up to 600 pps at intervals of 100 pps. Sixrepetitions were completed for each condition. Con-ditions were presented in a different random orderfor each participant, and participants had no training.Each participant completed around 42 h of experi-ments, divided into sessions of typically 3 h each.Participants were compensated for their time.
The maximum allowable probe rate was 750 pps, asexplained earlier. The experiment was aborted whenthe probe stimulus exceeded this limit. Also, it wasassumed that the procedure did not converge at aspecific base rate when the difference betweenreference and probe rates exceeded 500 pps. NoPRDL value was then recorded.
The analysis of variance (ANOVA) analyses that arereported in the "RESULTS" section were carried outwith SPSS version 21. For these analyses, the arith-metic means of the six repetitions of PRDL measure-ments in each condition were used. Zhao’s z statisticfor comparing curves (2011) was used (using themean and variance of the six PRDL measurements ineach condition) to determine if differences betweenPRDL curves were statistically significant. Theseanalyses were carried out with custom code developedin Matlab version 7.11.
Procedure of Experiment 3: Pitch Ranking
As the task in experiment 1 was to discriminatebetween rates by listening for pitch differences, itwas hypothesised that smaller PRDLs should alsoreflect improved rate pitch perception. Experiment3 characterised this by measuring the ability oflisteners to pitch rank stimuli of different rates. Since
the smallest PRDLs were obtained in 18-electrode andnine-electrode spread mode (see "RESULTS" sec-tion), differences in pitch ranking ability betweenmulti-electrode and single-electrode conditions wereexpected to be most prominent for these conditions.
Pitch ranking was carried out using the midpointcomparison procedure of Long et al. (2005) separate-ly for single-electrode, nine-electrode and 18-elec-trode spread conditions. This pitch rankingprocedure was repeated 15 times for each participant.Each rate was then assigned a pitch rank position,from 1 to 7.
Procedure of Experiment 4: Testing for LoudnessCues
To test whether loudness cues existed that may haveinfluenced PRDL data, the loudness of a stimulus at areference rate (the base rate) was balanced to theloudness of a probe stimulus presented at a rate thatwas just noticeably different from this, i.e. the proberate was the base rate plus the PRDL as determined inexperiment 1. These measurements were repeated foreach of the six base rates in 18-electrode spreadmode.
First, the reference (interval 1) was presented at itsloudness balanced level, and the participant’s task wasto adjust the probe (interval 2) to be equal in loudnessto the reference. The amount of adjustmentexpressed as percentage of dynamic range wasrecorded. This was repeated with the probe presentedat a fixed level so that the reference had to beadjusted. These two adjustments were repeated fourtimes to obtain eight loudness adjustments at eachbase rate. The same was repeated in a controlcondition where both stimuli (reference and probe)were presented at the base rate, alternating theinterval in which loudness had to be adjusted andrepeating to obtain eight loudness adjustments ateach base rate.
Zhao’s method for testing for differences betweencurves (Zhao 2011) was then used to determinewhether any loudness differences between the testand control conditions were significant. Zhao’s meth-od was used to obtain a t statistic for comparing thetest and control condition curves. Equivalence testing(Streiner 2003), in which the null hypothesis was thatthe two conditions differed by δ% or more of thedynamic range, was then carried out. Equivalenceintervals of δ=5 and 3 % were tested. The latter waschosen to be smaller than 5 %, a value at whichBaumann and Nobbe (2004) observed acceptablysmall influence of level variation on PRDLs. Failureto reject the null hypothesis would reflect theavailability of salient loudness cues so that participantscould have used loudness differences (rather than
VENTER AND HANEKOM: Limit to Pulse Rate Discrimination

pitch differences) to perform the discrimination task.Rejection of the null hypothesis would mean thatdifferences in loudness between the test condition(where rates of reference and probe differed) and thecontrol condition were smaller than 3 % of dynamicrange so that any loudness differences would beexpected to have little influence on the discriminationof pitch differences.
RESULTS
Experiment 1: PRDLs Using 18-Electrode Stimuli
Figure 3 contains the results for each of the partici-pants for single-electrode stimuli and for 18-electrodecompound stimuli (both burst and spread mode).The error bars indicate one standard deviation ateach of the measurement points. Participant S24 wasnot available for measurements in the burst mode.Figure 4 shows the same PRDL values averaged overall the participants. PRDLs in these figures areexpressed as a relative threshold (or Weber fraction),i.e. PRDL/base rate.
Trends in the rate discrimination thresholds forsingle-electrode stimuli were as expected. These areexpressed as relative thresholds (or relative PRDLs)below, with absolute values of the PRDL given inpulses per second as well. Relative thresholds for thedifferent participants were between 0.03 and 0.16,(i.e. PRDLs between 3 and 16 pps) at a base rate of100 pps and increased towards higher base rates. Thepreviously documented increase in growth rate ofPRDLs above 300 pps is reflected in the data of someparticipants, but not all, with a change in slope ataround 300 pps. The general trend was for single-electrode discrimination thresholds to increase steep-ly from a base rate of 300 pps. Average relativethresholds across participants increased by 0.16(PRDL of 32 pps), as base rate increased from 100 to200 pps, and by 0.33 (98 pps) and 0.48 (190 pps) asbase rate increased to 300 and 400 pps, respectively.Relative threshold differences between participantsalso increased as base rates increased (ranges of 0.13,0.47, 0.9 and 1.02 at base rates 100, 200, 300 and400 pps, respectively). For three of the participants,threshold values for single-electrode stimuli did notconverge (i.e. were larger than the set PRDL limits) atbase rates of 500 and 600 pps.
While relative thresholds for single-electrode stim-uli increased linearly, those of 18-electrode spreadmode (Fig. 4) remained almost constant with increas-ing base rates, and on average (across participants),this was always between 6 and 8 % of the base rate.Comparing 18-electrode spread mode thresholds withsingle-electrode thresholds, Zhao’s z statistic indicateda statistically significant difference (pG0.05) between
the relative PRDL curves of these two conditions forsix out of seven participants (S3: p=0.012, z=2.245; S5:pG0.0001, z=4.371; S8: p=0.012, z=2.240; S15, pG0.0001, z=8.929; S18: p=0.005, z=2.568; S21: p=0.0001, z=3.646) and approaching significance forparticipant S24 (p=0.063, z=1.530).
Relative thresholds for burst mode were betweenthose for single-electrode stimuli and those for spreadmode. A comparison of relative thresholds in 18-electrode burst mode with single-electrode thresholdsusing Zhao’s z statistic indicated a statistically signifi-cant difference (pG0.05) between the curves of thesetwo conditions for three of the participants (S5: pG0.001, z=3.039; S15: pG0.0001, z=6.187; S21: p=0.002,z=2.834), while the remaining participants did notshow a significant improvement (S3: p=0.161, z=0.992;S8: p=0.155, z=1.017; S18: p=0.218, z=0.780). Consid-ering Figure 4, relative thresholds in 18-electrodeburst mode tracked the single-electrode thresholds atthe low pulse rate end of the range tested (100 and200 pps) but tracked the spread mode thresholds atthe highest pulse rates tested (500 and 600 pps). Theaverage relative rate discrimination threshold forburst mode was 0.1 and 0.19 at base rates of 100 and200 pps, respectively, around the same as for thesingle-electrode condition. Average thresholds de-creased at rates above 300 pps and were lower thanthose for the single-electrode condition from thispulse rate onwards. The inter-participant differenceswere considerably smaller for this condition than forthe single-electrode stimuli.
Figure 4 shows that relative PRDLs of the maxi-mum-phase (spread) and minimum-phase (burst)modes approach each other as the base rate increases.This may be expected, since the inter-pulse delaysbetween different electrodes in the two modes will bethe same at approximately 790 Hz, where themaximum-phase shift is equal to the minimumachievable (hardware limit) time difference betweenpulses.
Experiment 2: PRDLs Using Two, Five and NineElectrodes
Participants S5, S15 and S24 repeated the experi-ments with two-, five- and nine-electrode compoundstimuli in both the burst (Fig. 2B–D) and spread(Fig. 2G–I) modes of stimulation. The results areshown in Figure 5 along with those of the single-electrode and 18-electrode stimuli of experiment 1.
Zhao’s z statistic for comparing curves (2011) wasused to determine if observed differences betweenrelative PRDL curves were statistically significant. Ascurves were individually compared across conditions,hypotheses tests were conducted using alpha levelsthat were Bonferroni corrected (alpha=0.0125). In
VENTER AND HANEKOM: Limit to Pulse Rate Discrimination

spread mode (right column of Fig. 5), using nineinstead of 18 electrodes made no statistically signifi-cant difference in relative PRDLs for all participantstested (S5: z=1.18, p=0.12; S15: z=0.45, p=0.33; S24: z=1.79, p=0.037). In all cases, however, using nineelectrodes rather than 18 resulted in increasedvariance in measurements. With five-electrode stimuli,measured relative PRDLs were significantly largerthan for 18 electrodes in two participants (S5: z=2.38, p=0.009; S15: z=1.95, p=0.026; S24: z=3.14, p=0.001). When two-electrode stimuli were used, relativePRDLs were significantly higher than for the five-electrode condition in participant S15 (z=2.78, p=0.003) but not in S5 (z=1.95, p=0.025) or S24 (z=0.056, p=0.48). There was no significant differencebetween single- and dual-electrode stimuli in two of
the participants (S5: z=1.89, p=0.029; S24: z=0.39, p=0.35), while these conditions differed significantly inS15 (z=3.22, p=0.001). Also, there was no significantdifference between any of the other conditions forparticipant S24. This was also the participant that hadthe lowest thresholds for single-electrode stimuli.
There was no significant difference between theaverage relative PRDLs measured for two, five or nineelectrodes for any of the three participants in burstmode (left column of Fig. 5), although the varianceincreased when fewer electrodes were used. Althoughrelative PRDLs in burst mode appear to be higher fortwo-electrode stimuli than for five-, nine- and 18-electrode compound stimuli in participants S5 andS15, these differences were not statistically significant(five-electrode, S5: z=1.09, p=0.14; S15: z=67, p=0.25;
200 400 6000
0.5
1
1.5 S3
118 Burst18 Spread
200 400 6000
0.5
1
1.5 S5
200 400 6000
0.5
1
1.5 S8
200 400 6000
0.5
1
1.5 S15
PR
DL
/Bas
e ra
te
200 400 6000
0.5
1
1.5 S18
200 400 6000
0.5
1
1.5 S21
200 400 6000
0.5
1
1.5 S24
Base rate (pps)
FIG. 3. Results of experiment 1. Weberfractions (PRDL/base rate) at differentbase rates for the single-electrode condi-tion (X markers), 18-electrode burst con-dition (solid markers) and 18-electrodespread condition (open markers) areshown. The seven panels show individualrelative PRDLs for seven participantsmeasured at base rates of 100, 200, 300,400, 500 and 600 pps with error barsindicating one standard deviation. Eigh-teen-electrode burst mode was not mea-sured for S24, and all other missing datapoints were rates for which the PRDLcould not be measured.
VENTER AND HANEKOM: Limit to Pulse Rate Discrimination

nine-electrode, S5: z=0.66, p=0.25; S15: z=1.38, p=0.083; 18-electrode, S5: z=0.99, p=0.16; S15: z=1.58,p=0.057).
The average relative PRDLs (across listeners) arereplotted in Figure 6 as a function of the number ofelectrodes in the compound stimulus. Figure 6A, Bshows the spread and burst mode data, respectively.Different curves are for the different base rates. Here,it can be seen more clearly that the number ofelectrodes used in a compound stimulus has consid-erable influence. The data were analysed in arepeated-measures ANOVA with phase mode ofstimulation (burst or spread), number of electrodesand base rate as the treatment factors. The effect ofphase mode of stimulation was not significant [F(1,2)=9.355, p=0.092]. Overall, the effect of the numberof electrodes was not significant [F(4,8)=2.25, p=0.27], but a significant interaction between numberof electrodes and phase mode [F(4,8)=4.265, p=0.039] and an almost significant interaction betweennumber of electrodes and base rate [F(8,20)=1.709,p=0.074] show that the influence of the number ofelectrodes on thresholds was dependent on both thebase rate and the phase mode. This can be seen inFigure 6. A strong dependence of relative PRDL onthe number of electrodes is observed for the higherbase rates in spread mode (Fig. 6A) but not for thelower base rates. A similar but weaker dependence ofrelative PRDL on number of electrodes is seen forburst mode (Fig. 6B). The dependence of theinfluence of the number of electrodes on relativePRDL is further reflected in interaction between base
rate, mode and number of electrodes thatapproached significance [F(20,40)=1.819, p=0.053],while the interaction between phase mode and baserate was not significant [F(5,10)=1.905, p=0.18].
Experiment 3: Pitch Ranking
Pitch ranking data obtained for all the participants ofthe first experiment are plotted in Figure 7.
While some participants had multi-electrode ratepitch that continued to increase up to the highestrates tested (S3, S5, S18 and S21), this was not true forall participants. Rate pitch of S24 also continued toincrease up to 600 pps for 18-electrode stimuli but notfor nine-electrode stimuli. Single-electrode and nine-electrode stimuli asymptoted at 300 pps for thisparticipant. S15 did not show rate pitch sensitivityabove 300 pps for multi-electrode stimuli, while single-electrode stimuli increased in pitch up to 500 pps. Allthree variations of electrode numbers asymptoted ataround 400 pps for S8.
The data were analysed in a repeated-measuresANOVA with number of electrodes and base rate asfactors. This indicates that rate influenced pitchsignificantly [F(6, 30)=24.44, p=0.003]. The ANOVAanalysis indicated that number of electrodes in astimulus set does not significantly influence pitch[F(2,10)=1.00, p=0.363]. Also, the interaction be-tween number of electrodes and rate was not signif-icant [F(12,60) = 1.026, p= 0.398] so that theobservation that relative PRDLs are influenced bythe number of electrodes, depending the base rate,was not reflected in the pitch ranking data.
In general, there was no clear relationship betweenpitch ranking and relative PRDL data. While ashallower slope of relative PRDLs across rate (18-electrode spread) sometimes corresponded to theexpected steeper slope in the pitch ranking curve(S3, S5 above 400 Hz, S18), the opposite was alsoobserved. Whereas the slopes for single-electrode and18-electrode spread condition relative thresholds didnot differ for S24, the slopes of the pitch ranking datadiffered markedly in these two conditions. Theopposite trend is seen in the data of S15 and S21,where small thresholds in the 18-electrode spreadcondition and large thresholds in the single-electrodecondition did not reflect in the ability to pitch rankthe different rates.
Experiment 4: Loudness Cues
Results from experiment 4 are shown in Figure 8.The null hypothesis (that the test and control
conditions did not differ by more than δ% of dynamicrange) was rejected for six of the seven participants atδ=5 % and for five participants when a value of δ=3 %
100 200 300 400 500 6000
0.1
0.2
0.3
0.4
0.5
0.6
Base rate (pps)
PR
DL/
Bas
e ra
te
1 Electrode18 Electrodes Burst18 Electrodes Spread
FIG. 4. Mean values over participants for each of the conditionsare shown in Figure 3.
VENTER AND HANEKOM: Limit to Pulse Rate Discrimination

was tested. The statistical power of the test isdetermined by the choice of δ and by the variancein individual data. Statistical power is above 0.8 for allparticipants when δ is above 5 % and above 0.8 for fiveparticipants for δ=3 %. The exceptions are S3 (0.55)and S21 (0.07) for whom low power at this choice of δresults from large variances in the loudness adjust-ment task. Two-tailed t tests with 14 degrees offreedom indicated that the probabilities that loudnessadjustments in the test condition (curve T) werelarger than loudness adjustments in the controlcondition (curve C) by more than 3 % of dynamicrange were smaller than p=0.05 for five participants(S3: t=1.59, p=1.86; S5: t=18.99, pG0.0001; S8: t=3.29,p=0.005; S15: t=4.96, pG0.0001; S18: t=2.35, p=0.03;S21: t=0.76, p=0.46; S24: t=11.71, pG0.0001). The nullhypothesis may also be rejected for S3 at δ=5.45 % (t=2.15, p=0.049) and for S21 at δ=5.15 % (t=2.15, p=
0.049). At these values of δ, statistical power is above0.8. This means that the two loudness adjustmentcurves (curves T and C) differed by less than 5.5 % ofdynamic range for all participants and by less than3 % for five out of seven participants. Based on theconclusions of Baumann and Nobbe (2004), theseloudness differences are not expected to have amarked influence on PRDL values. This is supportedby published data that suggest that rate does not havea strong influence on loudness at comfortably loudlevels. Data of McKay and McDermott (1998), shownin their Figure 5, indicate that loudness increased witha shallow slope with increasing pulse rate. Currentlevel had to be reduced by around 0.65 dB on averagefor their four subjects to maintain equal loudness asrate increased from 100 to 600 pps, i.e. for a rateincrease of, e.g. 50 pps in an adaptive procedure,current decrease would have to be 0.065 dB to
200 400 6000
0.5
1
1.5
S5 125918
200 400 6000
0.5
1
1.5
S5 125918
200 400 6000
0.5
1
1.5
S15
PR
DL/
Bas
e ra
te
200 400 6000
0.5
1
1.5
S15
200 400 6000
0.5
1
1.5
S24
200 400 6000
0.5
1
1.5
S24
Base rate (pps)
Burst Spread A B FIG. 5. Results of experiment 2: PRDL/base rate at different base rates for single-,two-, five-, nine- and 18-electrode condi-tions for burst mode (solid symbols in lefthand column) and spread mode (opensymbols in right hand column). Error barsindicate one standard deviation. Data forsingle-electrode and 18-electrode condi-tions are repeated from Figure 3.
VENTER AND HANEKOM: Limit to Pulse Rate Discrimination

maintain equal loudness. For a small DR, e.g. 5 dB,this is 1.3 % of DR. Differences this small are notexpected to provide prominent loudness cues to ratechanges, although weak loudness cues may have beenavailable. Loudness cues may have influenced PRDLdetermination at specific rates in the present data.Loudness adjustment variances were large for S21,reaching almost 10 % of DR, and this uncertaintyabout the loudness of stimuli may have influencedpitch discrimination, as is reflected in larger variancesin her relative PRDLs at 400 to 600 pps. However,loudness uncertainty across all rates tested alsoindicates that loudness could not provide a consistentcue. The largest loudness adjustments in experiment4 were for S3 at 400 and 500 pps at values smaller than7 % of dynamic range. Notably, the relative PRDLs ofS3 (Fig. 3) exhibited relatively large variances at 400
and 500 pps. This uncertainty in the pitch discrimi-nation task may have resulted from loudness differ-ences between the reference and probe so that PRDLdata at these two base rates may have been contam-inated by loudness differences.
DISCUSSION
Summary of Results
The main observations from the data are the following:
1. PRDLs of CI users improved when pulses wereapplied to multiple electrodes across the arrayinstead of on a single electrode. This was foundup to the highest rate tested (600 pps). Variationin the pattern of phase delays between pulses onmultiple electrodes had a significant influenceon the PRDLs. The maximum-phase delay pat-tern (spread mode) resulted in the smallestPRDLs, and in this condition, PRDLs systemati-cally decreased when more electrodes werestimulated.
2. This suggests that the 300-pps limit to rate discrim-ination observed for single electrodes does notreflect some fundamental limit but rather thatstimulus parameters may influence the upper limitof rate discrimination.
3. As PRDLs were significantly influenced by thenumber of electrodes in the maximum-phasecondition, these improvements were expected toreflect improved rate pitch perception. Therefore,rate pitch perception was tested in the conditionresulting in the largest improvement in PRDL (18-electrode spread). However, rate pitch did notreflect the significant effect of number of elec-trodes on PRDLs. Neither nine-electrode nor 18-electrode spread conditions resulted in statisticallysignificant improvement in pitch ranking above thesingle-electrode condition.
Comparison to Previous Rate Discrimination Data
Single-Electrode PRDLs
Rate dependence of single-electrode PRDLs followedthe trends of data in the literature. Similar topreviously published data (McDermott and McKay1997; McKay et al. 2000; Shannon 1983; Tong et al.1987; Townshend et al. 1987; Zeng 2002), single-electrode PRDLs generally deteriorated steeply atbase rates greater than 300 pps, although this wasnot true in all participants. S24 had unusually goodrelative PRDLs of 9, 10 and 19 % at base rates of 400,500 and 600 pps, respectively, for the single-electrodecondition. This is uncommon but not unprecedented.
1 2 5 9 180
0.1
0.2
0.3
0.4
0.5
Spread
1 2 5 9 180
0.1
0.2
0.3
0.4
0.5
Burst
Number of electrodes in compound stimulus
PR
DL/
Bas
e ra
te
100 pps200 pps300 pps400 pps500 pps600 pps
A
B
FIG. 6. The data of Figure 5 replotted in a different format. MeanPRDL/base rate across listeners are shown for different numbers ofelectrodes in a compound stimulus for spread mode (A) and burstmode (B). The different curves are for different base rates.
VENTER AND HANEKOM: Limit to Pulse Rate Discrimination

Although published data indicate that many CIlisteners have poor single-electrode pulse rate dis-crimination above 300 pps, exceptions have beenreported. For example, participant 5 in a study byMcKay et al. (1994) had relative PRDLs of around 8and 9 % for base rates of 400 and 500 pps. Morerecently, a group of CI users of the Med-El COMBI40+ implants were reported as being able to distin-guish a 35 % difference in single-electrode referencepulse rates of 400 and 500 pps with an accuracybetween 70 and 80 % (Kong et al. 2009).
Multi-Electrode PRDLs
Some conditions in the present study resembled thoseused in previous studies, and these resulted in similarfindings to those of earlier studies, as explainedbelow. However, some of the conditions differeddistinctly from those of earlier studies. First, previousmulti-electrode rate discrimination studies used fewer
electrodes, and no other studies have considered ratediscrimination thresholds with a number as large asnine or 18 electrodes. Bahmer and Baumann (2013)measured PRDLs of single-electrode and three-elec-trode stimuli, while the study of Chen et al. (2005)included conditions with two and four electrodes.Experiment 3 of Carlyon et al. (2010a) pitch rankedseven-electrode stimuli. Second, while previous studiesmostly used adjacent or closely spaced electrodes inmulti-electrode stimuli, the conditions in the presentstudy generally maximised the distance betweenelectrodes in a multi-electrode stimulus. The stimuliof Bahmer and Baumann (2013) were applied onthree adjacent electrodes and those of Carlyon et al.(2010a) on seven adjacent electrodes (8–14). Third,the multi-electrode phase conditions used vary acrossstudies. The maximum-phase condition (spread) ofthe present study resulted in a systematic effect ofrate. Six out of seven participants showed significantimprovements in PRDLs in the 18-electrode spread
200 400 6000
2
4
6
8 S3M
ean
pitc
h ra
nk
200 400 6000
2
4
6
8 S5
200 400 6000
2
4
6
8 S8
200 400 6000
2
4
6
8 S15
200 400 6000
2
4
6
8 S18
200 400 6000
2
4
6
8 S21
200 400 6000
2
4
6
8 S24
Base rate (pps)
19 (spread)18 (spread)
200 400 6000
2
4
6 Average
A
B
C
D
E
F
G
H
FIG. 7. Data for pitch ranking (experi-ment 3). Individual data are plotted onpitch rank axes in panels (A) to (G), witherror bars indicating one standard devia-tion, while panel (H) shows pitch rankingdata averaged over the seven participants.
VENTER AND HANEKOM: Limit to Pulse Rate Discrimination

mode condition as compared to their single- or dual-electrode results. This systematic decrease in ratediscrimination thresholds was not observed for theminimum-phase condition (burst). The same is truefor other studies that used minimum-phase condi-tions. Bahmer and Baumann (2013), using simulta-neous stimulation, did not find significant differencesin PRDLs between single- and multi-electrode stimuli.They noted, however, that a subgroup of theirparticipants had smaller PRDLs at higher rates forthe three-electrode condition. Chen et al. (2005),using minimum-phase stimuli similar to the burstcondition, also concluded that multi-electrode stimu-lation did not significantly influence rate pitchdiscrimination thresholds at the rates tested (up to1,000 pps). In contrast, Carlyon et al. (2010a), usingstimulation pulses that were spaced evenly over the
signal period (i.e. spread mode) on the differentelectrodes, did observe improved rate discriminationwith multi-electrode stimuli. PRDLs were not mea-sured, however.
Considering the present data together with theseprevious data, pulse rate discrimination appears to bedependent on the number of electrodes in a stimulusfor some but not all stimulus configurations. Specifi-cally, PRDLs are clearly dependent on stimulus phase.The systematic decrease in PRDLs with more elec-trodes was observed for spread mode stimuli but notfor burst mode stimuli. The data therefore suggestthat there is no fundamental limit to pulse ratediscrimination at 300 pps but that the upper limit ofrate discrimination is dependent on stimulus param-eters.
100 200 300 400 500 600
-10
0
10S5
100 200 300 400 500 600
-10
0
10S21
100 200 300 400 500 600
-10
0
10S18
100 200 300 400 500 600
-10
0
10S24
100 200 300 400 500 600
-10
0
10
Dyn
amic
ran
ge (
%)
S15
100 200 300 400 500 600
-10
0
10S8
100 200 300 400 500 600
-10
0
10
Pulse rate (pps)
S3
test conditioncontrol condition
FIG. 8. Loudness balancing data ofexperiment 4. Solid diamond markersindicate the average amount (arithmeticmean of eight loudness adjustments) bywhich loudness had to be adjusted whenthe reference and probe were presentedat different pulse rates, and open circlesshow the loudness adjustments in thecontrol condition (no difference in pulserate between reference and probe). Errorbars indicate the standard deviation of theeight repetitions.
VENTER AND HANEKOM: Limit to Pulse Rate Discrimination

Multi-Electrode Rate Pitch
Improvements in PRDLs were expected to reflect inimproved rate pitch perception. However, this was notborne out in the data. Likewise, Carlyon et al. (2010a)performed pitch ranking experiments with seven-electrode stimuli that shared similarity with those ofthe present study and observed no significant differ-ences in pitch ranking between single-electrode andmulti-electrode stimuli across a wide range of rates(112.5 to 1,800 pps). Potential explanations for theapparent disagreement between PRDL and pitchranking data are considered below.
Possible Explanations of the PRDL Data
Spatial and Temporal Integration in Overlapping NeuralPopulations
PRDLs are dependent on pulse timing (or stimulusphase) and on the number of electrodes in a stimulus.The latter covaries with distance between the elec-trodes used in the stimulus. All of these stimulusparameters are expected to influence neural firingpatterns. Two main effects in neural excitationpatterns are expected for the different stimulusvariations. First, adjacent electrodes may stimulate anoverlapping neural population as a result of currentspread from electrodes, with the amount of overlapdepending on the distance between electrodes. Theresulting interleaving of pulses in this overlappingpopulation is expected to increase the effective pulserate in this population. Second, the specific pattern ofinterleaving would depend on stimulus phase or pulsetiming, which remained the same for burst modestimuli (Fig. 1) as stimulus pulse rate increased, whileit depended on pulse rate in spread mode. Both theamount of overlap and the pattern of interleavingcould influence rate discrimination thresholds in atleast two ways.
First, observed differences in PRDLs in conditionswith different numbers of electrodes and differentstimulus phase patterns may have been influenced byloudness differences. A temporal integration model ofloudness in cochlear electrical stimulation (McKayand McDermott 1998) indicates that the number ofpulses in an integration window may have an influ-ence on loudness. For multi-electrode stimuli, wherepulses of adjacent or nearby electrodes may activateoverlapping neural populations, pulses separated byshort delays may lead to charge accumulation, andtherefore residual polarisation (De Balthasar et al.2003) on neural membranes of these nerve fibres.This may result in higher neural spike rates whenmultiple electrodes are stimulated (as opposed to thespike rates for single electrodes), potentially resultingin increased loudness. Because of decay of charge on
neural membranes, the effect on loudness from thistemporal integration mechanism is expected to beweaker for longer delays between pulses applied toadjacent electrodes. McKay and McDermott (1998)estimated that pulses separated by delays shorter thanaround 400 μs may have an accumulative effect onloudness, but this effect is unlikely to be important forlonger delays. For the present stimuli, the effect inspread mode would be smaller than in burst mode(the latter having no pulse delays between adjacentelectrodes of the stimulus set) but may still exist insome of the spread mode conditions. Pulse delaysbetween adjacent electrodes varied between 522 μs at100 pps and 70 μs at 600 pps for 18-electrode stimuliin spread mode and were longer for multi-electrodestimuli that incorporated fewer electrodes. The inten-tion of the loudness balancing procedure carried outacross all conditions was to compensate for thesepotential loudness cues.
However, loudness differences may still have hadan influence on PRDL measurements within a givencondition, as the increased-rate stimuli (relative to thebase rate) used during the staircase procedure werenot loudness balanced to the base rate, as explainedbefore. Multi-electrode stimuli may be expected tohave steeper slopes of the loudness vs. rate function asa result of more overlap in stimulated neural popula-tions so that the steepest slopes are expected inelectrode sets with the largest number of electrodes.Experiment 4 confirmed that these anticipated loud-ness differences were small in all participants. Fur-thermore, any effect of loudness cues on PRDLsshould be larger in burst mode than in spread mode.The data, however (Fig. 3), show that burst mode hadlarger relative PRDLs than spread mode, except at lowpulse rates, where the temporal integration model ofloudness would predict a small or non-existing effectof rate on loudness. Thus, loudness variation withpulse rate does not provide a consistent explanationfor the observed PRDLs.
A second explanation for the data to consider isadaptation. Litvak et al. (2001) showed that higherpulse rates can lead to more adaptation. From thisand because of interleaving of pulses, it is expectedthat stimuli with more electrodes would lead to moreadaptation. This may potentially be used as a cue todiscriminate between different rates. Carlyon et al.(2010a) argued that differences in adaptation forstimuli with different numbers of electrodes may inthis way allow rate changes to become discriminablebut would not necessarily lead to pitch changes. Inaddition, it is conceivable that burst mode would leadto more adaptation than spread mode at the samerate of stimulation so that adaptation may partiallyexplain differences in PRDLs between burst andspread modes. More adaptation would lead to lower
VENTER AND HANEKOM: Limit to Pulse Rate Discrimination

spike rates, and a mechanism that needs to discrim-inate between two different spike rates may fare worseif the spike rates were lower. Thus, adaptation mayprovide a feasible explanation for the differencesbetween the PRDLs of burst and spread modes andmay explain why significant differences in PRDLs donot lead to significant changes in perceived pitch.
Combining of Temporal Information Across Channels
Burst mode is more likely than spread mode toactivate overlapping neural populations when stimu-lation electrodes are spaced closely (e.g. in the 18-electrode condition) due to residual polarisation (DeBalthasar et al. 2003) so that smaller PRDLs may beexpected than in burst mode. However, smallerPRDLs were measured in spread mode so that PRDLsdo not appear to reflect residual polarisation. Fur-thermore, Figure 3 shows clear differences betweenspread and burst modes, pointing towards timing-sensitive differences in the processing of these. It isknown that information from different cochlear areasof electrical stimulation can be combined withpreservation of phase information: Carlyon et al.(2000) observed that CI users could detect phasedifferences between two widely separated electrodes,even in the presence of masker pulses between thetwo electrodes under test. Thus, given differences inthe PRDLs of spread and burst modes, it is possiblethat observed PRDLs reflect across-channel integra-tion. However, this does not explain why pitchperception did not improve with multi-electrodestimulation. This may mean that the data do notreflect an across-channel integration mechanism, orthat cues for rate pitch extraction were suboptimal(discussed below) or that non-pitch cues were used toperform the rate discrimination task.
Best Electrode Explanation
It is possible that discrimination thresholds weresmaller for multi-electrode stimuli simply becausethese included a "best electrode", i.e. it may be thata participant had better discrimination ability on oneparticular electrode than on others. If this were true,the probability that these better electrodes wereincluded would increase with a larger number ofelectrodes in a set. This best electrode hypothesis maybe ruled out for several reasons, however. Burst andspread modes delivered the same number of pulsesper stimulus period to the same set of electrodes, andthese multi-electrode stimuli were presented at equalloudness. The same best electrode would therefore beincluded. But, as shown in Figure 6, relative PRDLs inthese two modes were significantly different, whichcannot be explained by participant performancebeing in accordance with their best discrimination
ability on a particular electrode. Also, the data inFigure 6 show that the decrease in relative PRDL inspread mode was generally monotonic as the numberof electrodes in a set increased, although the specificelectrodes included in a multi-electrode set variedwith the number of electrodes included (see Fig. 2) sothat a best electrode included in some conditions maynot have been included in others. Finally, largedifferences were observed between relative PRDLsfor different pulse rates in burst mode but not inspread mode (e.g., compare panels A and B of Fig. 6,five-electrode and nine-electrode stimuli), pointing toa stimulus phase-sensitive mechanism.
Possible Explanations of the Pitch Ranking Data
Despite significant improvements in rate discrimina-tion ability, 18-electrode and nine-electrode spreadconditions did not result in significant improvementin rate pitch. Explanations for this are consideredbelow.
Non-Pitch Cues
While the PRDL data are not consistent with the useof loudness as a main cue, as argued above, loudnesscannot be entirely precluded as a potential cue. Asremarked by Carlyon et al. (2010a), listeners will useany available cue in a forced-choice procedure, andeven small loudness differences may (perhaps incombination with other cues) allow rates that differslightly to be discriminated. Also, adaptation (consid-ered above) may provide a reasonable explanation forimprovement in rate discrimination that does notresult in pitch differences.
Discrimination of Pitch Differences and Direction of PitchChange
Studies that considered the differences in sensitivity todetection of frequency or pitch changes and theidentification of the direction of change show thatthese two tasks may be served by separate neuralprocesses. Psychoacoustic data of patients that hadundergone selective surgical removal of temporal lobebrain tissue led Johnsrude et al. (2000) to thisconclusion, while Demany and Ramos (2005)interpreted their data as providing evidence ofspecialised frequency-shift detectors in the auditorypathway. So, although multi-electrode stimuli createaction potential trains from which stimulation ratedifferences can be detected more easily than fromsingle-electrode stimuli, it is conceivable that thesignal available to a separate mechanism specialisedfor extraction of rate pitch is no more salient than forsingle-electrode stimuli.
VENTER AND HANEKOM: Limit to Pulse Rate Discrimination

Suboptimality of Cues for Rate Pitch Extraction
Even though rate discriminability improves with multi-electrode stimuli, the possibility exists that the multi-electrode stimuli that were used are suboptimal forpitch extraction. Cedolin and Delgutte (2010) demon-strated that the pitch of harmonic complexes may beextracted from the relative timings of action potentialsfrom consecutive cochlear locations, i.e. locationsstimulated sequentially by the cochlear travelling wave.Consecutive pulses in a multi-electrode stimulus createaction potential patterns that to some extent emulatethe basal-to-apical cochlear delays of the cochleartravelling wave. Octopus cells of the cochlear nucleus(CN) appear to be specialised to compensate forcochlear delays by resynchronising neural activity fromthe consecutive cochlear regions activated by thecochlear travelling wave (McGinley et al. 2012). Anydivergence from the natural relative timing of actionpotentials originating from consecutive cochlear placesthat arrive at the CN may result in degrading ofresynchronisation. As such, the reliability of any mech-anism deeper into the auditory pathway that relies onsynchronised neural activity to extract rate pitch may becompromised. For example, pitch-sensitive neurons thathave been identified in the low-frequency region of theauditory cortex (Bendor et al. 2012) are sensitive totemporal envelope regularity.
CONCLUSION
It is not clear yet why stimuli that resulted in systematicand significant improvements in pulse rate discrimina-tion at higher rates do not have a marked effect on ratepitch perception. There does not appear to be afundamental limit to pulse rate discrimination at300 pps. Rather, the correct choice of stimulus parame-ters of multi-electrode stimuli allowed smaller PRDLs athigher pulse rates than those that are typically observedfor single-electrode stimuli. The failure of these stimuli toenhance rate pitch perception at high rates, however,may indicate that listeners used cues other than pitch toperform the rate discrimination task or may reflectlimitations in the electrically evoked neural excitationpatterns presented to a rate pitch extraction mechanismdeeper into the auditory pathway.
ACKNOWLEDGMENTS
The authors wish to thank all the participants for theircontribution. Also, we would like to thank the reviewers andassociate editor for their many constructive comments.Financial assistance by the National Research Foundation(South Africa) is acknowledged.
REFERENCES
BAHMER A, BAUMANN U (2013) New parallel stimulation strategiesrevisited: effect of synchronous multi electrode stimulation onrate discrimination in cochlear implant users. Cochlear ImplantsInt 14:142–149
BAUMANN U, NOBBE A (2004) Pulse rate discrimination with deeplyinserted electrode arrays. Hear Res 196:49–57
BENDOR D, OSMANSKI MS, WANG X (2012) Dual-pitch processingmechanisms in primate auditory cortex. J Neurosci 32:16149–16161
BOEX C, DE BALTHASAR C, KOS MI, PELIZZONE M (2003) Electrical fieldinteractions in different cochlear implant systems. J Acoust SocAm 114:2049–2057
CARLYON RP, DEEKS JM (2002) Limitations on rate discrimination. JAcoust Soc Am 112:1009–1025
CARLYON RP, GEURTS L, WOUTERS J (2000) Detection of small across-channel timing differences by cochlear implantees. Hear Res141:140–154
CARLYON RP, LONG CJ, DEEKS JM (2008) Pulse-rate discrimination bycochlear-implant and normal-hearing listeners with and withoutbinaural cues. J Acoust Soc Am 123:2276–2286
CARLYON RP, DEEKS JM, MCKAY CM (2010A) The upper limit oftemporal pitch for cochlear-implant listeners: stimulus duration,conditioner pulses, and the number of electrodes stimulated. JAcoust Soc Am 127:1469–1478
CARLYON RP, LYNCH C, DEEKS JM (2010B) Effect of stimulus level andplace of stimulation on temporal pitch perception by cochlearimplant users. J Acoust Soc Am 127:2997–3008
CEDOLIN L, DELGUTTE B (2010) Spatiotemporal representation of thepitch of harmonic complex tones in the auditory nerve. JNeurosci 30:12712–12724
CHATTERJEE M, OBERZUT C (2011) Detection and rate discriminationof amplitude modulation in electrical hearing. J Acoust Soc Am130:1567–1580
CHEN H, ISHIHARA YC, ZENG FG (2005) Pitch discrimination ofpatterned electric stimulation. J Acoust Soc Am 118:338–345
COUSINEAU M, DEMANY L, PRESSNITZER D (2009) What makes a melody:the perceptual singularity of pitch sequences. J Acoust Soc Am126:3179–3187
DE BALTHASAR C, BOËX C, COSENDAI G, VALENTINI G, SIGRIST A,PELIZZONE M (2003) Channel interactions with high-rate biphasicelectrical stimulation in cochlear implant subjects. Hear Res182:77–87
DEMANY L, RAMOS C (2005) On the binding of successive sounds:perceiving shifts in nonperceived pitches. J Acoust Soc Am117(2):833–841
EISEN MD, FRANCK KH (2005) Electrode interaction in pediatriccochlear implant subjects. J Assoc Res Otolaryngol 6:160–170
JOHNSON DH (1980) The relationship between spike rate andsynchrony in responses of auditory-nerve fibers to single tones.J Acoust Soc Am 68:1115–1122
JOHNSRUDE IS, PENHUNE VB, ZATORRE RJ (2000) Functional specificityin the right human auditory cortex for perceiving pitchdirection. Brain 123:155–163
KONG YY, CARLYON RP (2010) Temporal pitch perception at highrates in cochlear implants. J Acoust Soc Am 127:3114–3123
KONG YY, DEEKS JM, AXON PR, CARLYON RP (2009) Limits of temporalpitch in cochlear implants. J Acoust Soc Am 125:1649–1657
LEVITT H (1971) Transformed up-down methods in psychoacoustics.J Acoust Soc Am 49(Suppl 2):467–477
LITVAK L, DELGUTTE B, EDDINGTON D (2001) Auditory nerve fibreresponses to electric stimulation: modulated and unmodulatedpulse trains. J Acoust Soc Am 110:368–379
LONG CJ, NIMMO-SMITH I, BAGULEY DM, O'DRISCOLL M, RAMSDEN R,OTTO SR, AXON PR, CARLYON RP (2005) Optimizing the clinical fitof auditory brain stem implants. Ear Hear 26:251–262
VENTER AND HANEKOM: Limit to Pulse Rate Discrimination

MACHEREY O, CARLYON RP (2010) Temporal pitch percepts elicited bydual-channel stimulation of a cochlear implant. J Acoust Soc Am127(1):339–349
MACHEREY O, CARLYON RP (2012) Place-pitch manipulations withcochlear implants. J Acoust Soc Am 131:2225–2236
MACHEREY O, DEEKS JM, CARLYON RP (2011) Extending the limits ofplace and temporal pitch perception in cochlear implant users. JAssoc Res Otolaryngol 12:233–251
MCDERMOTT HJ, MCKAY CM (1997) Musical pitch perception withelectrical stimulation of the cochlea. J Acoust Soc Am 101:1622–1631
MCGINLEY MJ, CHARLES LIBERMAN M, BAL RM, OERTEL D (2012)Generating synchrony from the asynchronous: compensation forcochlear traveling wave delays by the dendrites of individualbrainstem neurons. J Neurosci 32:9301–9311
MCKAY CM, MCDERMOTT HJ (1998) Loudness perception withpulsatile electrical stimulation: the effect of interpulse intervals.J Acoust Soc Am 104:1061–1074
MCKAY CM, MCDERMOTT HJ, CLARK GM (1994) Pitch perceptsassociated with amplitude-modulated current pulse trains incochlear implantees. J Acoust Soc Am 96:2664–2673
MCKAY CM, MCDERMOTT HJ, CARLYON RP (2000) Place and temporalcues in pitch perception: are they truly independent? Acoust ResLett Online 1:25–30
MICHEYL C, MOORE BCJ, CARLYON RP (1998) The role of excitation-pattern cues and temporal cues in the frequency and modula-tion-rate discrimination of amplitude-modulated tones. J AcoustSoc Am 104:1039–1050
MIDDLEBROOKS JC, SNYDER RL (2010) Selective electrical stimulationof the auditory nerve activates a pathway specialized for hightemporal acuity. J Neurosci 30:1937–1946
MOORE BCJ, ERNST SMA (2012) Frequency difference limens at highfrequencies: evidence for a transition from a temporal to a placecode. J Acoust Soc Am 132:1542–1547
NARDO WD, CANTORE I, MARCHESE MR, CIANFRONE F, SCORPECCI A,GIANNANTONIO S, PALUDETTI G (2008) Electric to acoustic pitchmatching: a possible way to improve individual cochlear implantfitting. Eur Arch Otorhinolaryngol 265:1321–1328
PIJL S (1995) Musical pitch perception with pulsatile stimulation ofsingle electrodes in patients implanted with the Nucleuscochlear implant. Ann Otol Rhinol Laryngol 166:224–227
PIJL S (1997) Labeling of musical interval size by cochlear implantpatients and normally hearing subjects. Ear Hear 18:364–372
PIJL S, SCHWARZ DWF (1995A) Intonation of musical intervals bymusical intervals by deaf subjects stimulated with single bipolarcochlear implant electrodes. Hear Res 89:203–211
PIJL S, SCHWARZ DWF (1995B) Melody recognition and musicalinterval perception by deaf subjects stimulated with electricalpulse trains through single cochlear implant electrodes. J AcoustSoc Am 98:886–895
SHANNON RV (1983) Multichannel electrical stimulation of theauditory nerve in man. I. Basic psychophysics. Hear Res11:157–189
STREINER DL (2003) Unicorns do exist: a tutorial on "proving" thenull hypothesis. Can J Psychiatr 48:756–761
TONG YC, CLARK GM, BLAMEY PJ, BUSBY PA, DOWELL RC (1982)Psychophysical studies for two multiple-channel cochlear im-plant patients. J Acoust Soc Am 71:153–160
TONG YC, BLAMEY PJ, DOWELL RC, CLARK GM (1983) Psychophysicalstudies evaluating the feasibility of a speech processing strategyfor a multiple-channel cochlear implant. J Acoust Soc Am 74:73–80
TONG YC, CLARK GM, LIM HH (1987) Estimation of the effectivespread of neural excitation produced by a bipolar pair of scalatympani electrodes. Ann Otol Rhinol Laryngol 96:37–38
TOWNSHEND B, COTTER N, VAN COMPERNOLLE D, WHITE RL (1987) Pitchperception by cochlear implant subjects. J Acoust Soc Am82:106–115
WESARG T, BATTMER RD, GARRIDO LC, DILLIER N, GARCIA-IBEZ L, HEY M,MACIAS AR, IRUJO AH, MORSNOWSKI A, OFFECIERS EF, ZAROWSKI A,PESCH J, RYPKEMA G, SMOORENBURG GF (2010) Effect of changingpulse rate on profile parameters of perceptual thresholds andloudness comfort levels and relation to ECAP thresholds inrecipients of the Nucleus CI24RE device. Int J Audiol 49:775–787
XI X, JI F, HAN D, HONG M, CHEN A (2009) Electrode interaction incochlear implant recipients: comparison of straight and contourelectrode arrays. J Oto-Rhino-Laryngol 71:228–237
ZENG FG (2002) Temporal pitch in electric hearing. Hear Res174:101–106
ZHAO Z (2011) Power of tests for comparing trend curves withapplication to national immunization survey (NIS). Stat Med30:531–540
VENTER AND HANEKOM: Limit to Pulse Rate Discrimination