is conformation a fundamental descriptor in qsar? … is conformation a fundamental descriptor in...
TRANSCRIPT

760
Is conformation a fundamental descriptor in QSAR?A case for halogenated anestheticsMaria C. Guimarães, Mariene H. Duarte, Josué M. Silla and Matheus P. Freitas*
Full Research Paper Open Access
Address:Department of Chemistry, Federal University of Lavras, P. O. Box3037, 37200-000, Lavras, MG, Brazil
Email:Matheus P. Freitas* - [email protected]
* Corresponding author
Keywords:conformational analysis; isoflurane; QSAR; theoretical calculations;volatile anesthetics
Beilstein J. Org. Chem. 2016, 12, 760–768.doi:10.3762/bjoc.12.76
Received: 22 January 2016Accepted: 07 April 2016Published: 21 April 2016
Associate Editor: P. R. Schreiner
© 2016 Guimarães et al; licensee Beilstein-Institut.License and terms: see end of document.
AbstractAn intriguing question in 3D-QSAR lies on which conformation(s) to use when generating molecular descriptors (MD) for correla-
tion with bioactivity values. This is not a simple task because the bioactive conformation in molecule data sets is usually unknown
and, therefore, optimized structures in a receptor-free environment are often used to generate the MD´s. In this case, a wrong con-
formational choice can cause misinterpretation of the QSAR model. The present computational work reports the conformational
analysis of the volatile anesthetic isoflurane (2-chloro-2-(difluoromethoxy)-1,1,1-trifluoroethane) in the gas phase and also in polar
and nonpolar implicit and explicit solvents to show that stable minima (ruled by intramolecular interactions) do not necessarily co-
incide with the bioconformation (ruled by enzyme induced fit). Consequently, a QSAR model based on two-dimensional chemical
structures was built and exhibited satisfactory modeling/prediction capability and interpretability, then suggesting that these 2D
MD´s can be advantageous over some three-dimensional descriptors.
760
IntroductionQuantitative structure–activity relationship (QSAR) studies try
to find a correlation between chemical structures and the corre-
sponding bioactivities by means of molecular descriptors
(MD´s). In this way, molecular architecture and substitution
patterns in a series of congeneric molecules are described by
calculable or empirical data having some relationship with bio-
logical activity, becoming the technique useful for under-
standing the action mechanism of related drugs, as well as to
drive the synthesis of new drug like compounds.
Since the milestone work by Hansch and Fujita [1], a variety of
MD´s have been developed to improve the correlation of chemi-

Beilstein J. Org. Chem. 2016, 12, 760–768.
761
cal structures with bioactivity, ranging from hydrophobicity to
three-dimensional descriptors [2]. Indeed, the most popular
QSAR methods are based on molecular descriptors generated
from 3D molecular structures, such as the widely used tech-
niques based on molecular field analysis [3,4]. The problem
with most 3D-QSAR methods is that the bioactive conforma-
tion of the compounds in a data set is usually unknown and,
therefore, geometry optimization is carried out in a receptor-
free environment to generate the molecular structure and, subse-
quently, the 3D MD´s. While molecular conformation in
vacuum is governed by intramolecular interactions, the biocon-
formation is ruled by enzyme induced-fit; consequently, opti-
mized and bioactive geometries are probably different to each
other and, to obtain insight on the action mechanism of a drug
and substituent effects, MD´s should not be generated over
geometries optimized in a receptor-free environment. Efforts
have been made to attenuate the drawback of using a conforma-
tion that is possibly wrong, e.g., by using average conforma-
tions, ensemble and multidimensional methods [5-8], but the
risk of chemical–biological misinterpretation remains. Recep-
tor-dependent QSAR methods have also been developed [9],
but these are mostly complementary and are aimed at corrobo-
rating and/or rationalizing the results provided by the regres-
sion models, since the docking methodology itself provides
intermolecular energies and docking scores that correlate with
bioactivity. On the other hand, despite not encoding conforma-
tional information, 2D-QSAR can incorporate other stereo-
chemical properties and also account for group sizes, substitu-
ent type and 2D shape of molecules. These have shown to be
sufficient parameters to obtain satisfactory correlation with
bioactivity data and valuable understanding on structural
requirements for drug development.
Multivariate Image Analysis applied to QSAR (MIA-QSAR) is
a genuine 2D method, since descriptors are pixels of molecular
projections drawn as black and white wireframes [10] and, more
recently, as colored 2D-images (chemical structures) with
spheres representing atoms with sizes proportional to the
respective van der Waals radii [11]. The variance in the atom
color and coordinate of pixels in the images (the structural vari-
ance) explains the changes in the bioactivities block. Thus, the
MIA-QSAR method is an appropriate approach to probe the
validity of 2D-QSAR methods when the molecules in a data set
undergo rotational isomerization.
In order to test our hypothesis, the biological activities of a set
of volatile halogenated anesthetics were modelled using the
recent version of the MIA-QSAR method. In addition, the suit-
ability of applying 3D information obtained from high level
calculations (in a receptor-free environment) in QSAR model-
ling was evaluated using a comparative study of the optimized
and bioactive conformations of the fluorinated anesthetic isoflu-
rane, which binds to a 4-helix bundle protein (apoferritin) [12]
and to the integrin LFA1 enzyme [13].
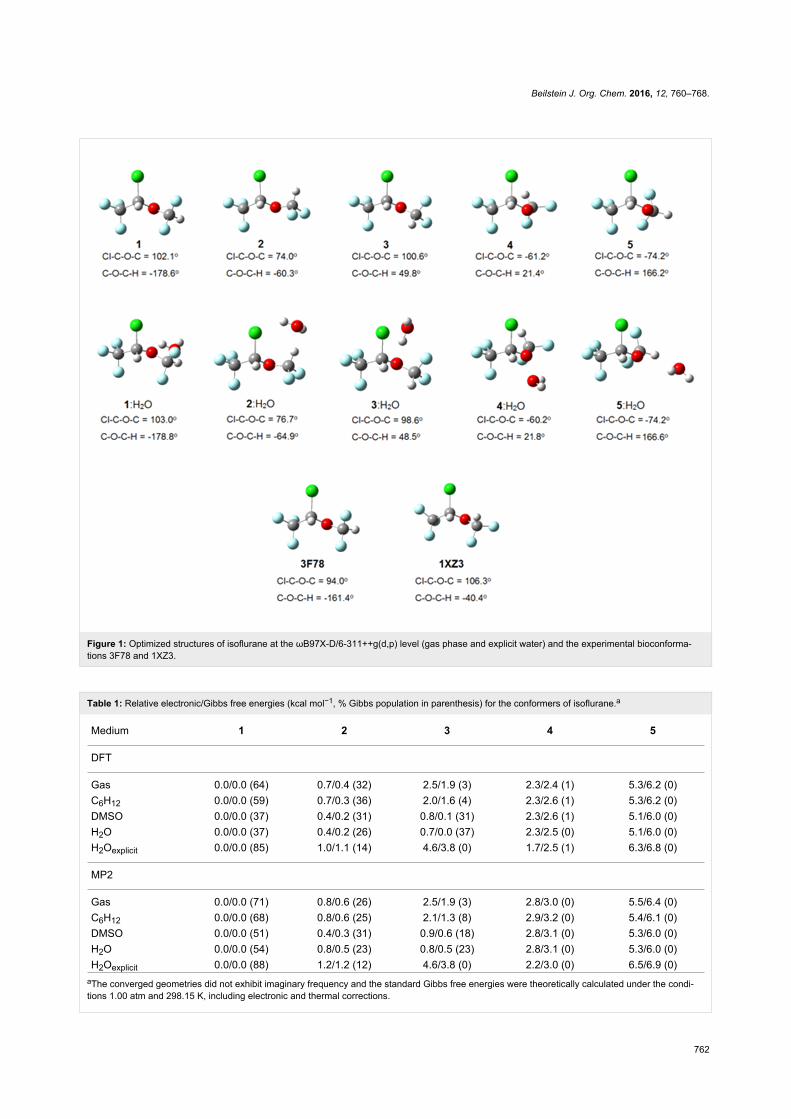
Results and DiscussionConformational analysis2-Chloro-2-(difluoromethoxy)-1,1,1-trifluoroethane (isoflurane)
undergoes rotational isomerization around two dihedral angles
(Cl–C–O–C and C–O–C–H) and, considering three limit orien-
tations for each of them (gauche, gauche' and anti), nine con-
formations are possible for isoflurane. However, geometry opti-
mization at the MP2/6-311++g(d,p) and ωB97X-D/6-
311++g(d,p) (a DTF method which includes dispersion effects)
levels converged to five energy minima for the gas phase,
implicit solvents (cyclohexane, DMSO and water, using the
polarizable continuum model), and using one explicit water
molecule as solvent to mimic a physiological medium
(Figure 1).
The results for the gas phase are in agreement with previous
calculations [14] and microwave experiments [15], where five
conformations were found, but only three could be experimen-
tally detected, due to their lower energies. These correspond to
conformers 1, 2 and 3 of Table 1, the most stable ones in the gas
phase and implicit solution. It is worth mentioning that, accord-
ing to our calculations, the solvent has a little effect on the
conformer populations, such as in enflurane [16], suggesting
that intramolecular interactions govern the conformational equi-
librium in a biological-free environment. Indeed, Lesarri et al.
[15] pointed out that anomeric effects owing to donor–acceptor
(LP → σ*) interactions are responsible for the conformational
preference of isoflurane. Despite the contribution from specific
hyperconjugative interactions representing the anomeric effects
(mainly LPO → σ*CF, Table 2), our natural bond orbital (NBO)
analysis indicates that the main conformers 1 and 2 are less
favored by electronic delocalization than 3, 4 and 5. Since the
overall energy of a system is a composition of repulsive Lewis
(steric and electrostatic) and attractive non-Lewis-type (hyper-
conjugation) contributions, the main factor governing the con-
formational stabilization of isoflurane comes from the more
classical steric and dipolar interactions, likewise sevoflurane re-
ported earlier [17].
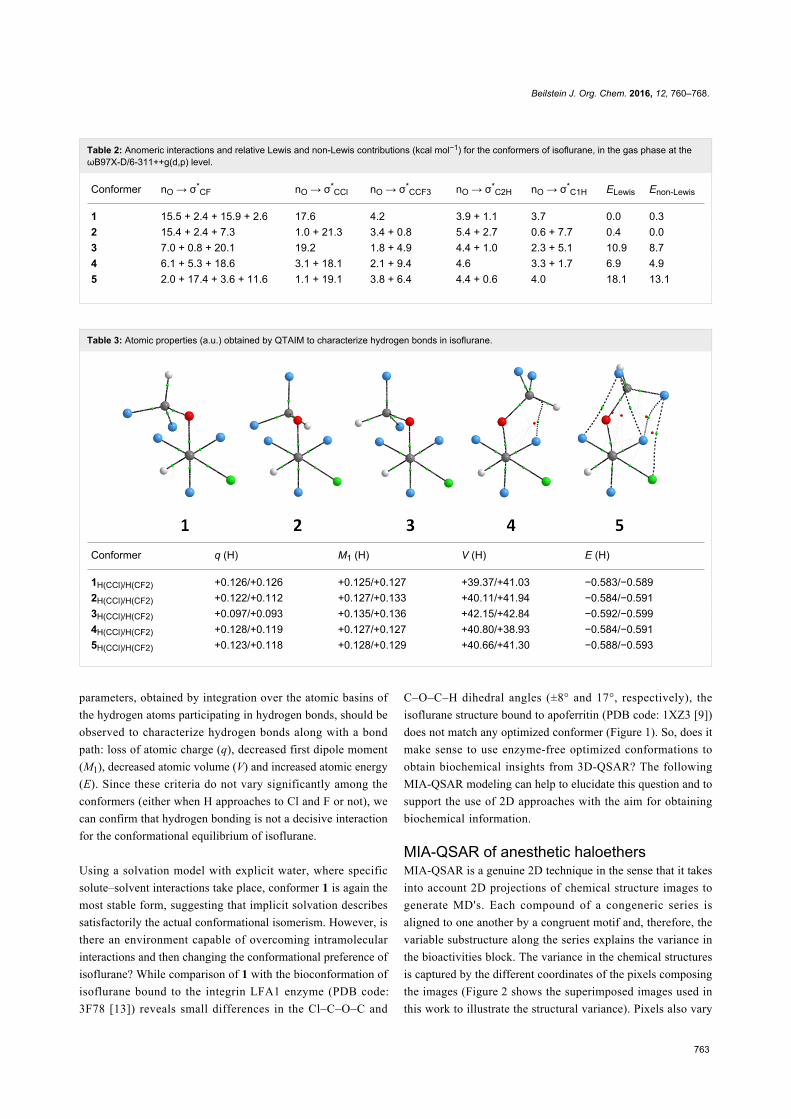
It has been proposed that intramolecular CH∙∙∙FC hydrogen
bond drives the conformational preference of enflurane [18]. In
order to check if such an interaction operates in isoflurane,
QTAIM (Quantum Theory of Atoms in Molecules) calculations
were performed for 1–5. The molecular graphs of Table 3 do
not exhibit F∙∙∙H or Cl∙∙∙H bond paths (only weak nonbonding
interactions are observed for the high energy conformers 4 and
5). According to Koch and Popelier [19], the following QTAIM
Beilstein J. Org. Chem. 2016, 12, 760–768.
762
Figure 1: Optimized structures of isoflurane at the ωB97X-D/6-311++g(d,p) level (gas phase and explicit water) and the experimental bioconforma-tions 3F78 and 1XZ3.
Table 1: Relative electronic/Gibbs free energies (kcal mol−1, % Gibbs population in parenthesis) for the conformers of isoflurane.a
Medium 1 2 3 4 5
DFT
Gas 0.0/0.0 (64) 0.7/0.4 (32) 2.5/1.9 (3) 2.3/2.4 (1) 5.3/6.2 (0)C6H12 0.0/0.0 (59) 0.7/0.3 (36) 2.0/1.6 (4) 2.3/2.6 (1) 5.3/6.2 (0)DMSO 0.0/0.0 (37) 0.4/0.2 (31) 0.8/0.1 (31) 2.3/2.6 (1) 5.1/6.0 (0)H2O 0.0/0.0 (37) 0.4/0.2 (26) 0.7/0.0 (37) 2.3/2.5 (0) 5.1/6.0 (0)H2Oexplicit 0.0/0.0 (85) 1.0/1.1 (14) 4.6/3.8 (0) 1.7/2.5 (1) 6.3/6.8 (0)
MP2
Gas 0.0/0.0 (71) 0.8/0.6 (26) 2.5/1.9 (3) 2.8/3.0 (0) 5.5/6.4 (0)C6H12 0.0/0.0 (68) 0.8/0.6 (25) 2.1/1.3 (8) 2.9/3.2 (0) 5.4/6.1 (0)DMSO 0.0/0.0 (51) 0.4/0.3 (31) 0.9/0.6 (18) 2.8/3.1 (0) 5.3/6.0 (0)H2O 0.0/0.0 (54) 0.8/0.5 (23) 0.8/0.5 (23) 2.8/3.1 (0) 5.3/6.0 (0)H2Oexplicit 0.0/0.0 (88) 1.2/1.2 (12) 4.6/3.8 (0) 2.2/3.0 (0) 6.5/6.9 (0)
aThe converged geometries did not exhibit imaginary frequency and the standard Gibbs free energies were theoretically calculated under the condi-tions 1.00 atm and 298.15 K, including electronic and thermal corrections.
Beilstein J. Org. Chem. 2016, 12, 760–768.
763
Table 2: Anomeric interactions and relative Lewis and non-Lewis contributions (kcal mol−1) for the conformers of isoflurane, in the gas phase at theωB97X-D/6-311++g(d,p) level.
Conformer nO → σ*CF nO → σ*
CCl nO → σ*CCF3 nO → σ*
C2H nO → σ*C1H ELewis Enon-Lewis
1 15.5 + 2.4 + 15.9 + 2.6 17.6 4.2 3.9 + 1.1 3.7 0.0 0.32 15.4 + 2.4 + 7.3 1.0 + 21.3 3.4 + 0.8 5.4 + 2.7 0.6 + 7.7 0.4 0.03 7.0 + 0.8 + 20.1 19.2 1.8 + 4.9 4.4 + 1.0 2.3 + 5.1 10.9 8.74 6.1 + 5.3 + 18.6 3.1 + 18.1 2.1 + 9.4 4.6 3.3 + 1.7 6.9 4.95 2.0 + 17.4 + 3.6 + 11.6 1.1 + 19.1 3.8 + 6.4 4.4 + 0.6 4.0 18.1 13.1
Table 3: Atomic properties (a.u.) obtained by QTAIM to characterize hydrogen bonds in isoflurane.
Conformer q (H) M1 (H) V (H) E (H)
1H(CCl)/H(CF2) +0.126/+0.126 +0.125/+0.127 +39.37/+41.03 −0.583/−0.5892H(CCl)/H(CF2) +0.122/+0.112 +0.127/+0.133 +40.11/+41.94 −0.584/−0.5913H(CCl)/H(CF2) +0.097/+0.093 +0.135/+0.136 +42.15/+42.84 −0.592/−0.5994H(CCl)/H(CF2) +0.128/+0.119 +0.127/+0.127 +40.80/+38.93 −0.584/−0.5915H(CCl)/H(CF2) +0.123/+0.118 +0.128/+0.129 +40.66/+41.30 −0.588/−0.593
parameters, obtained by integration over the atomic basins of
the hydrogen atoms participating in hydrogen bonds, should be
observed to characterize hydrogen bonds along with a bond
path: loss of atomic charge (q), decreased first dipole moment
(M1), decreased atomic volume (V) and increased atomic energy
(E). Since these criteria do not vary significantly among the
conformers (either when H approaches to Cl and F or not), we
can confirm that hydrogen bonding is not a decisive interaction
for the conformational equilibrium of isoflurane.
Using a solvation model with explicit water, where specific
solute–solvent interactions take place, conformer 1 is again the
most stable form, suggesting that implicit solvation describes
satisfactorily the actual conformational isomerism. However, is
there an environment capable of overcoming intramolecular
interactions and then changing the conformational preference of
isoflurane? While comparison of 1 with the bioconformation of
isoflurane bound to the integrin LFA1 enzyme (PDB code:
3F78 [13]) reveals small differences in the Cl–C–O–C and
C–O–C–H dihedral angles (±8° and 17°, respectively), the
isoflurane structure bound to apoferritin (PDB code: 1XZ3 [9])
does not match any optimized conformer (Figure 1). So, does it
make sense to use enzyme-free optimized conformations to
obtain biochemical insights from 3D-QSAR? The following
MIA-QSAR modeling can help to elucidate this question and to
support the use of 2D approaches with the aim for obtaining
biochemical information.
MIA-QSAR of anesthetic haloethersMIA-QSAR is a genuine 2D technique in the sense that it takes
into account 2D projections of chemical structure images to
generate MD's. Each compound of a congeneric series is
aligned to one another by a congruent motif and, therefore, the
variable substructure along the series explains the variance in
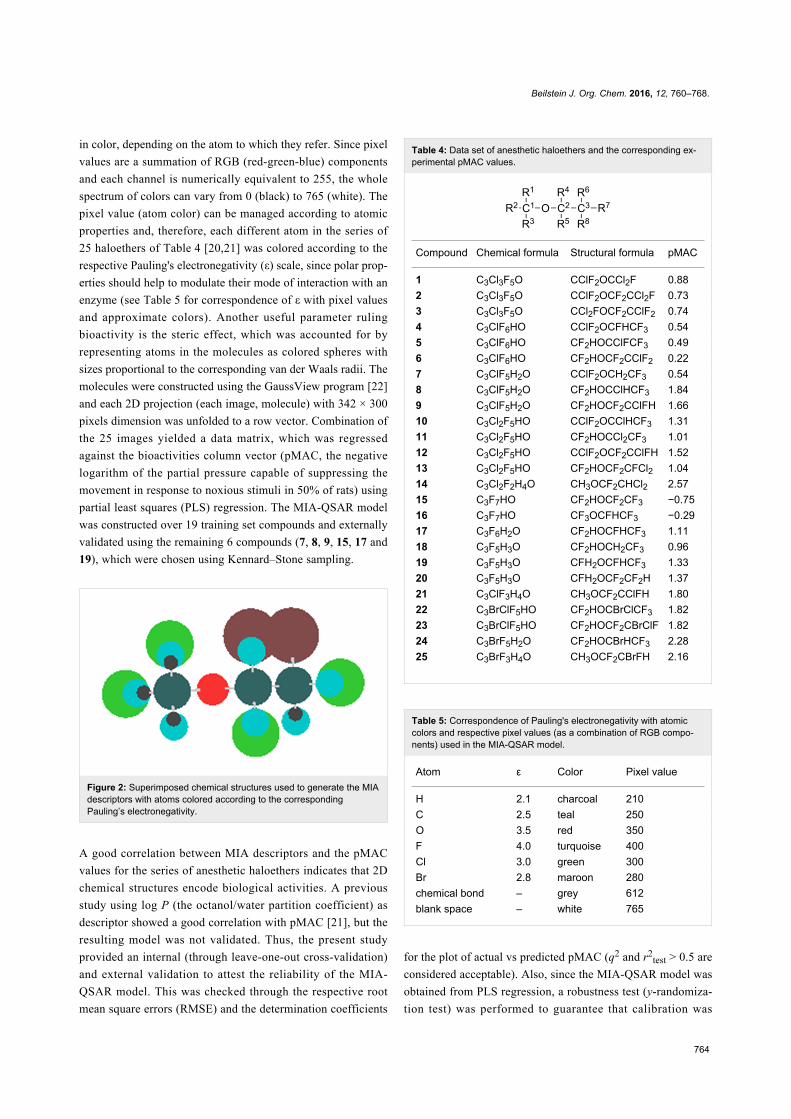
the bioactivities block. The variance in the chemical structures
is captured by the different coordinates of the pixels composing
the images (Figure 2 shows the superimposed images used in
this work to illustrate the structural variance). Pixels also vary
Beilstein J. Org. Chem. 2016, 12, 760–768.
764
in color, depending on the atom to which they refer. Since pixel
values are a summation of RGB (red-green-blue) components
and each channel is numerically equivalent to 255, the whole
spectrum of colors can vary from 0 (black) to 765 (white). The
pixel value (atom color) can be managed according to atomic
properties and, therefore, each different atom in the series of
25 haloethers of Table 4 [20,21] was colored according to the
respective Pauling's electronegativity (ε) scale, since polar prop-
erties should help to modulate their mode of interaction with an
enzyme (see Table 5 for correspondence of ε with pixel values
and approximate colors). Another useful parameter ruling
bioactivity is the steric effect, which was accounted for by
representing atoms in the molecules as colored spheres with
sizes proportional to the corresponding van der Waals radii. The
molecules were constructed using the GaussView program [22]
and each 2D projection (each image, molecule) with 342 × 300
pixels dimension was unfolded to a row vector. Combination of
the 25 images yielded a data matrix, which was regressed
against the bioactivities column vector (pMAC, the negative
logarithm of the partial pressure capable of suppressing the
movement in response to noxious stimuli in 50% of rats) using
partial least squares (PLS) regression. The MIA-QSAR model
was constructed over 19 training set compounds and externally
validated using the remaining 6 compounds (7, 8, 9, 15, 17 and
19), which were chosen using Kennard–Stone sampling.
Figure 2: Superimposed chemical structures used to generate the MIAdescriptors with atoms colored according to the correspondingPauling’s electronegativity.
A good correlation between MIA descriptors and the pMAC
values for the series of anesthetic haloethers indicates that 2D
chemical structures encode biological activities. A previous
study using log P (the octanol/water partition coefficient) as
descriptor showed a good correlation with pMAC [21], but the
resulting model was not validated. Thus, the present study
provided an internal (through leave-one-out cross-validation)
and external validation to attest the reliability of the MIA-
QSAR model. This was checked through the respective root
mean square errors (RMSE) and the determination coefficients
Table 4: Data set of anesthetic haloethers and the corresponding ex-perimental pMAC values.
Compound Chemical formula Structural formula pMAC
1 C3Cl3F5O CClF2OCCl2F 0.882 C3Cl3F5O CClF2OCF2CCl2F 0.733 C3Cl3F5O CCl2FOCF2CClF2 0.744 C3ClF6HO CClF2OCFHCF3 0.545 C3ClF6HO CF2HOCClFCF3 0.496 C3ClF6HO CF2HOCF2CClF2 0.227 C3ClF5H2O CClF2OCH2CF3 0.548 C3ClF5H2O CF2HOCClHCF3 1.849 C3ClF5H2O CF2HOCF2CClFH 1.6610 C3Cl2F5HO CClF2OCClHCF3 1.3111 C3Cl2F5HO CF2HOCCl2CF3 1.0112 C3Cl2F5HO CClF2OCF2CClFH 1.5213 C3Cl2F5HO CF2HOCF2CFCl2 1.0414 C3Cl2F2H4O CH3OCF2CHCl2 2.5715 C3F7HO CF2HOCF2CF3 −0.7516 C3F7HO CF3OCFHCF3 −0.2917 C3F6H2O CF2HOCFHCF3 1.1118 C3F5H3O CF2HOCH2CF3 0.9619 C3F5H3O CFH2OCFHCF3 1.3320 C3F5H3O CFH2OCF2CF2H 1.3721 C3ClF3H4O CH3OCF2CClFH 1.8022 C3BrClF5HO CF2HOCBrClCF3 1.8223 C3BrClF5HO CF2HOCF2CBrClF 1.8224 C3BrF5H2O CF2HOCBrHCF3 2.2825 C3BrF3H4O CH3OCF2CBrFH 2.16
Table 5: Correspondence of Pauling's electronegativity with atomiccolors and respective pixel values (as a combination of RGB compo-nents) used in the MIA-QSAR model.
Atom ε Color Pixel value
H 2.1 charcoal 210C 2.5 teal 250O 3.5 red 350F 4.0 turquoise 400Cl 3.0 green 300Br 2.8 maroon 280chemical bond – grey 612blank space – white 765
for the plot of actual vs predicted pMAC (q2 and r2test > 0.5 are
considered acceptable). Also, since the MIA-QSAR model was
obtained from PLS regression, a robustness test (y-randomiza-
tion test) was performed to guarantee that calibration was

Beilstein J. Org. Chem. 2016, 12, 760–768.
765
Figure 3: Plot of actual vs predicted pMAC obtained from the MIA-QSAR model.
not overfitted nor obtained by chance correlation; the y block
was randomized and subsequently regressed against the
intact matrix (ten times). Reliable models are achieved when
r2y-rand << r2, which is evaluated by cr2
p, defined ascr2
p = r × (r2 − r2y-rand)1/2 [23]. Values above 0.5 for cr2
p are
considered acceptable. The statistical results for 9 latent
variables (PLS components) illustrated in Figure 3 attest the
predictability and reliability of the MIA-QSAR, thus suggesting
that the 2D chemical structure indeed encodes biochemical
properties and that MIA descriptors can be useful to anticipat-
ing pMAC of prospective congeneric drug-like candidates.
MIA-QSAR and 3D-QSAR have already been compared to
each other in a variety of studies and the prediction results are
similar [10,24-26], but the confidence in the interpretation pro-
vided by conformation-dependent methods is questionable as
the minimum conformation may not necessarily represent the
bioactive conformation. Both MIA-QSAR and 3D-QSAR
methods are based on alignment rules and, therefore, they
should be applied to congeneric series. Non-congeneric data
sets are not within the applicability domain of MIA-QSAR and
alignment-based methods and, since the alignment does not
apply for these types of sets, the conformational landscape
would affect only some specific descriptors used in classical
QSAR, e.g., the 3D matrix-based descriptors available in the
Dragon software.
Thus, a major goal in QSAR is to determine and interpret the
chemical motifs/properties responsible for the observed biologi-
cal effects. We have checked that even the simple log P model
yields good prediction ability upon selection of test set com-
pounds using the Kennard–Stone sampling (r2test = 0.80); how-
ever, the main drawback of this analysis lies on the vague
notion of the group types and/or molecular positions that most
affect the pMAC values. Thus, the MIA descriptors were
searched as source of chemical interpretation for the QSAR
model. Because of the numerous MIA descriptors generated to
build the model, a straightforward analysis would not be an
easy task using the raw data. Thus, pre-filtration procedures
were performed in order to reduce the number of variables. In
this sense, the first approach was a measure of Shannon's
entropy (SE), corresponding to an unsupervised classification
variables filtering [27,28] applied to a 25 discrete intervals
scheme. Variables with less than 10% of the maximum SE
(SEMAX = log 25) were discarded. The variables were filtered
again through the correlation coefficient (x/x), with variables
removed for each set of variables with a x/x = 0.98 [29]. As the
data set under study is highly correlated, only two variables
(X1876 and X5979) were identified containing further informa-
tion regarding the anesthetic activity (pMAC). A careful analy-
sis of the reduced matrix (Table 6) reveals the approximate
positions of pixels X1876 and X5979 in the structural scaffold.
Therefore, principal component analysis (PCA) was applied to

Beilstein J. Org. Chem. 2016, 12, 760–768.
766
obtain information on how these coordinates affect the bioac-
tivity in terms of the two principal components PC1 (56.59%)
and PC2 (43.41%) (Figure 4). Since PCA is a pattern recogni-
tion tool, the set of compounds were classified in three levels
of anethestic intensity: low (pMAC ≤ 1.00 ), medium
(1.00 < pMAC < 2.00), and high (pMAC ≥ 2.00) levels.
Table 6: Reduced matrix with the selected descriptors and their ap-proximate coordinates in the images.
Compound X1876 X5979
1 300 3002 300 4003 300 4004 300 4005 400 3006 400 4007 300 2108 400 3009 400 40010 300 30011 400 30012 300 40013 400 40014 765 40015 400 40016 400 40017 400 40018 400 21019 400 40020 400 40021 765 40022 400 76523 400 40024 400 76525 765 400
From the PCA scores plot shown in Figure 4, three clusters are
observed: one at positive scores in PC1 (compounds with mod-
erate-to-high activities), another with negative scores in PC1
and around null scores in PC2 (compounds with moderate-to-
low activities), and the third one at negative scores in PC1 and
very positive scores in PC2 (compounds with low activities).
Variables X1876 and X5979 in the loadings plot are responsi-
ble for clustering these compounds according to the scores plot.
X5979 clearly separates compounds 22 (moderate activity) and
24 (high activity) from the remaining ones in PC2, due to their
high pixel value at this position (765, white – blank space in the
image). Bulk and hydrophobic substituents (R) at position R4
(surrounding X5979, see substituent numbering in Table 4)
have long C–R bonds and, therefore, the pixel variable is locat-
ed where small substituents (such as hydrogen, fluorine and
even chlorine) appear, while the bromine atom does not occupy
this coordinate because of its long bond distance with carbon.
From this, since compounds 22 and 24 contain a bromine sub-
stituent at position R4 and pertain to the moderate-to-high activ-
i t y c l a s s , s u c h a n h a l o g e n t e n d s t o f a v o r a n
improved anesthetic activity of congeneric haloethers in this
position.
PC1 explains most of the data variance and, therefore, variable
X1876 should play a significant role for the bioactivity pattern
of the data set compounds, because of its high loading in PC1.
In addition to 22 and 24, compounds 14, 21 and 25 (also
pertaining to the moderate-to-high activity class) lie in the
region with positive scores in PC1, while, e.g., compounds 7
and 18 (low activity compounds) have very negative scores in
PC1. In this case, the pixel value 765 at position X1876 indi-
cates the absence of a substituent (hydrogen at R1) and, conse-
quently, atoms encoded by high pixel values (e.g., 400 for the
small and electronegative fluorine atom, but mainly for the
small hydrogen atom) at R1 tend to strongly favor the increase
in pMAC of anesthetic derivatives.
Because the absence of intermolecular hydrogen bonds be-
tween enflurane (a similar anesthetic haloether) and the integrin
LFA1 enzyme [16], the structural requirements mentioned
above should be dictated by hydrophobic interactions of R4
with amino acid residues and by low steric effects surrounding
R1. Thus, 2D structural information provided by MIA descrip-
tors (particularly related to the connectivity of different atoms
in the present case) was capable of modeling and interpreting
biochemical information of a series of anesthetic haloethers,
without considering the conformation.
ConclusionIt has been shown that a predictive and biochemically inter-
pretable QSAR model can be obtained through bidimensional
descriptors. Conformational insights could refine the analysis,
but the risk of using wrong conformations could cause misinter-
pretation of the results. This eminent risk was assessed by in-
vestigating the conformational isomerism of isoflurane, whose
bioconformation in at least one biological target is significantly
different from the geometries optimized in a biological-free
environment. A more secure option would be to obtain the
ligand geometries inside an enzyme active site. Since conforma-

Beilstein J. Org. Chem. 2016, 12, 760–768.
767
Figure 4: PCA plots for the mean-centered data of the 25 anesthetic haloethers.
tional search inside a receptor normally gives the mode of inter-
action between substrate and enzyme, as well as the intermolec-
ular interaction energy (related to the ligand–receptor affinity
and, consequently, to the bioactivity), further QSAR analysis
would be of limited utility.
AcknowledgementsThe authors thank FAPEMIG (grant number APQ-00383-15),
CAPES and CNPq for the financial support of this research, as
well as by the scholarships (to M.C.G, M.H.D and J.M.S.) and
fellowship (to M.P.F.).
References1. Hansch, C.; Fujita, T. J. Am. Chem. Soc. 1964, 86, 1616–1626.
doi:10.1021/ja01062a0352. Cherkasov, A.; Muratov, E. N.; Fourches, D.; Varnek, A.; Baskin, I. I.;
Cronin, M.; Dearden, J.; Gramatica, P.; Martin, Y. C.; Todeschini, R.;Consonni, V.; Kuz’min, V. E.; Cramer, R.; Benigni, R.; Yang, C.;Rathman, J.; Terfloth, L.; Gasteiger, J.; Richard, A.; Tropsha, A.J. Med. Chem. 2014, 57, 4977–5010. doi:10.1021/jm4004285
3. Cramer, R. D., III; Patterson, D. E.; Bunce, J. D. J. Am. Chem. Soc.1988, 110, 5959–5967. doi:10.1021/ja00226a005
4. Klebe, G.; Abraham, U.; Mietzner, T. J. Med. Chem. 1994, 37,4130–4146. doi:10.1021/jm00050a010
5. Hopfinger, A. J.; Wang, S.; Tokarski, J. S.; Jin, B.; Albuquerque, M.;Madhav, P. J.; Duraiswami, C. J. Am. Chem. Soc. 1997, 119,10509–10524. doi:10.1021/ja9718937
6. Vedani, A.; Dobler, M. J. Med. Chem. 2002, 45, 2139–2149.doi:10.1021/jm011005p
7. Vedani, A.; Dobler, M.; Lill, M. A. J. Med. Chem. 2005, 48, 3700–3703.doi:10.1021/jm050185q
8. Pissurlenkar, R. R. S.; Khedkar, V. M.; Iyer, R. P.; Coutinho, E. C.J. Comput. Chem. 2011, 32, 2204–2218. doi:10.1002/jcc.21804
9. Pan, D.; Tseng, Y.; Hopfinger, A. J. Chem. Inf. Comput. Sci. 2003, 43,1591–1607. doi:10.1021/ci0340714
10. Freitas, M. P.; Brown, S. D.; Martins, J. A. J. Mol. Struct. 2005, 738,149–154. doi:10.1016/j.molstruc.2004.11.065
11. Barigye, S. J.; Freitas, M. P. Int. J. Quant. Struct.-Prop. Relat. 2016, 1,64–77. doi:10.4018/IJQSPR.2016010103
12. Liu, R.; Loll, P. J.; Eckenhoff, R. G. FASEB J. 2005, 19, 567–576.doi:10.1096/fj.04-3171com
13. Zhang, H.; Astrof, N. S.; Liu, J. H.; Wang, J. H.; Shimaoka, M.FASEB J. 2009, 23, 2735–2740. doi:10.1096/fj.09-129908
14. Hermann, A.; Mack, H.-G.; Oberhammer, H. J. Fluorine Chem. 2000,101, 223–231. doi:10.1016/S0022-1139(99)00163-3
15. Lesarri, A.; Vega-Toribio, A.; Suenram, R. D.; Brugh, D. J.;Nori-Shargh, D.; Boggs, J. E.; Grabow, J.-U.Phys. Chem. Chem. Phys. 2011, 13, 6610–6618.doi:10.1039/c0cp02465a
16. Andrade, L.; Silla, J. M.; Stephens, S. L.; Marat, K.; da Cunha, E. F. F.;Ramalho, T. C.; van Wijngaarden, J.; Freitas, M. P. J. Phys. Chem. A2015, 119, 10735–10742. doi:10.1021/acs.jpca.5b08087
17. Freitas, M. P.; Bühl, M.; O'Hagan, D.; Cormanich, R. A.;Tormena, C. F. J. Phys. Chem. A 2012, 116, 1677–1682.doi:10.1021/jp211949m
18. Michalska, D.; Bieńko, D. C.; Czarnik-Matusewicz, B.;Wierzejewska, M.; Sandorfy, C.; Zeegers-Huyskens, T.J. Phys. Chem. B 2007, 111, 12228–12238. doi:10.1021/jp073772r
19. Koch, U.; Popelier, P. L. A. J. Phys. Chem. 1995, 99, 9747–9754.doi:10.1021/j100024a016
20. Koblin, D. D.; Laster, M. J.; Ionescu, P.; Gong, D.; Eger, E. I., II;Halsey, M. J.; Hudlicky, T. Anesth. Analg. (Hagerstown, MD, U. S.)1999, 88, 1161–1167. doi:10.1213/00000539-199905000-00036
21. Mehdipour, A. R.; Hemmateenejad, B.; Miri, R. Chem. Biol. Drug Des.2007, 69, 362–368. doi:10.1111/j.1747-0285.2007.00506.x
22. GaussView; Gaussian, Inc.: Wallingford, CT, USA.23. Mitra, I.; Saha, A.; Roy, K. Mol. Simul. 2010, 36, 1067–1079.
doi:10.1080/08927022.2010.503326

Beilstein J. Org. Chem. 2016, 12, 760–768.
768
24. Freitas, M. P. Chemom. Intell. Lab. Syst. 2008, 91, 173–176.doi:10.1016/j.chemolab.2007.11.002
25. Antunes, J. E.; Freitas, M. P.; Rittner, R. Eur. J. Med. Chem. 2008, 43,1632–1638. doi:10.1016/j.ejmech.2007.10.019
26. Cormanich, R. A.; Freitas, M. P.; Rittner, R. J. Braz. Chem. Soc. 2011,22, 637–642. doi:10.1590/S0103-50532011000400004
27. Godden, J. W.; Stahura, F. L.; Bajorath, J. J. Chem. Inf. Comput. Sci.2000, 40, 796–800. doi:10.1021/ci000321u
28. Barigye, S. J.; Marrero-Ponce, Y.; Martínez-López, Y.; Torrens, F.;Artiles-Martínez, L. M.; Pino-Urias, R. W.; Martínez-Santiago, O.J. Comput. Chem. 2013, 34, 259–274. doi:10.1002/jcc.23123
29. Duarte, M. H.; Barigye, S. J.; Freitas, M. P.Comb. Chem. High Throughput Screening 2015, 18, 208–216.doi:10.2174/1386207318666141229123349
License and TermsThis is an Open Access article under the terms of the
Creative Commons Attribution License
(http://creativecommons.org/licenses/by/2.0), which
permits unrestricted use, distribution, and reproduction in
any medium, provided the original work is properly cited.
The license is subject to the Beilstein Journal of Organic
Chemistry terms and conditions:
(http://www.beilstein-journals.org/bjoc)
The definitive version of this article is the electronic one
which can be found at:
doi:10.3762/bjoc.12.76