is cluster theory in need of renewal? - diva portal230951/...companies to localize in proximity of...
TRANSCRIPT

Is cluster theory in need of renewal? – Porter’s Diamond revised
Department of business studies FEC6103 Bachelor Thesis International Business Program December 2007
Tutors: Christer Ekelund
Elin Smith
Authors: Martin Persson Adis Šabanović
Henrik Wester

Acknowledgements
First, to our tutors Christer Ekelund and Elin Smith for guiding us in
the intense world of thesis writing and Annika Fjelkner for helping
us improving our linguistic skills. To Pierre Carbonnier, for the help
with the statistics software. To Åsa Kronqvist, for the technical
aspects of our thesis. She compiled the online-questionnaire
perfectly, despite our frequent changes.
To Tage Dolk for facilitating the contacting of key persons in
Swedish clusters, and Patrik Ordelius for assisting us in spreading
the questionnaire. To Hans Wester for testing the questionnaire and
to all the participating companies for helping us increase the
response rate for our empirics.
Finally, to our families for enduring absent family members.
Thank you.
Kristianstad, 2007
Martin Persson Adis Šabanović Henrik Wester

Dedicated to
Freja
Edvin and Linnea
Abstract
In the globalized world of today, ironically, companies find
competitive advantages in locating in proximity of each other. These
highly present industrial groupings are called clusters. A popular
model to describe the benefits of a cluster environment is the
Porter’s Diamond, also called the Diamond Model.
Since the Diamond Model was published in 1990, there is a need of
complements, in order for it to fit the dynamic business world of
today. Hence, the purpose of this thesis is to examine the benefits of
a cluster environment with theories from four different designated
perspectives other than Porter’s Diamond. This, to see if these
theories can complement the Diamond Model to show a more
contemporary, and comprehensive picture of the benefits in a cluster
environment.
The research is intended to examine if the theoretically stated
benefits can be recognized by the companies situated in a cluster
environment. A compilation is created by the theoretical framework
and tested with the Diamond Model to see if it presents a better
picture of cluster benefits. The thesis conclusions fortified the saying
“age before beauty”, at least if age is complemented with a social
attitude.
Key words: Porter, Porter’s Diamond, Perspectives, Cluster,
Cluster benefits, Agglomeration
Table of contents
1. INTRODUCTION ...................................................................................- 7 -
1.1 BACKGROUND................................................................................... - 7 - 1.2 DEFINITION....................................................................................... - 9 - 1.3 BENEFITS IN A CLUSTER ENVIRONMENT ............................................ - 9 - 1.4 CRITICS OF PORTER’S CLUSTER THEORIES ...................................... - 10 - 1.5 RESEARCH OBJECTIVES................................................................... - 11 - 1.6 LIMITATIONS................................................................................... - 13 -
2 METHOD...............................................................................................- 15 - 2.1 CHOICE OF METHODOLOGY ............................................................ - 15 - 2.2 RESEARCH PHILOSOPHY.................................................................. - 16 - 2.3 CHOICE OF THEORY ........................................................................ - 16 - 2.4 SUMMARY....................................................................................... - 17 -
3 THEORETICAL FRAMEWORK.......................................................- 18 - 3.1 THE FOUR PERSPECTIVES ................................................................ - 18 -
3.1.1 The Micro Economic perspective ..............................................- 18 - 3.1.2 The Macro Economic perspective .............................................- 23 - 3.1.3 The Social Scientific perspective ...............................................- 27 - 3.1.4 The Economic Geographic perspective.....................................- 30 -
3.2 THEORETICAL COMPILATION .......................................................... - 31 - 4 EMPIRICAL METHOD.......................................................................- 35 -
4.1 RESEARCH STRATEGY..................................................................... - 35 - 4.2 TIME HORIZON ................................................................................ - 35 - 4.3 DATA COLLECTION METHOD.......................................................... - 36 - 4.4 POPULATION ................................................................................... - 36 - 4.5 SAMPLE SELECTION ........................................................................ - 37 - 4.6 OPERATIONALIZATION.................................................................... - 38 - 4.7 DATA ANALYSIS.............................................................................. - 40 - 4.8 RELIABILITY AND VALIDITY............................................................ - 41 -
5 ANALYSIS.............................................................................................- 42 - 5.1 EMPIRICAL FINDINGS ...................................................................... - 42 - 5.2 TESTS.............................................................................................. - 43 -
5.2.1 Mean value with standard deviation .........................................- 43 - 5.2.2 Kruskal-Wallis test ....................................................................- 44 -
5.3 RESEARCH PROPOSALS & HYPOTHESIS ........................................... - 45 - 5.4 CRITIQUE ........................................................................................ - 51 - 5.5 CONCLUSIONS................................................................................. - 51 -
6. THESIS CONCLUSIONS.....................................................................- 56 - 6.1 DISCUSSION .................................................................................... - 56 - 6.2 PRACTICAL RELEVANCE.................................................................. - 56 - 6.3 SELF CRITICISM............................................................................... - 57 -
REFERENCES................................................................................................- 59 - ARTICLES ...................................................................................................... - 59 - BOOKS .......................................................................................................... - 61 - INTERNET ...................................................................................................... - 61 -
APPENDICES .................................................................................................- 62 - [APPENDIX 1] EMAIL (SWEDISH)................................................................... - 62 - [APPENDIX 2] EMAIL..................................................................................... - 63 - [APPENDIX 3] EMAIL 2 (SWEDISH) ................................................................ - 64 - [APPENDIX 4] EMAIL 2 .................................................................................. - 65 -

[APPENDIX 5] BENEFITS ................................................................................ - 66 - [APPENDIX 6] QUESTIONNAIRE (SWEDISH) ................................................... - 72 - [APPENDIX 7] QUESTIONNAIRE ..................................................................... - 79 - [APPENDIX 8] KRUSKAL-WALLIS TEST ......................................................... - 83 - [APPENDIX 9] THE DIAMOND MODEL ........................................................... - 84 - MEAN VALUE PER BENEFIT............................................................................ - 84 - [APPENDIX 10] THE FOUR PERSPECTIVES ...................................................... - 85 - MEAN VALUE PER BENEFIT............................................................................ - 85 -
List of Tables
Table 1 – Cluster publications 1953-2004 ..........................................................- 8 - Table 2: Benefits that may complement the Diamond Model............................- 45 - Table 3: Means comparison, Diamond Model and SMITH ..............................- 46 - Table 4: Kruskal-Wallis test, difference between industries per benefit ...........- 47 - Table 5: Kruskal-Wallis test, highest ranking industry per benefit...................- 48 - Table 6: Kruskal-Wallis test, difference between industries per perspective....- 49 - Table 7: Kruskal-Wallis test, highest ranking industry per perspective............- 50 - Table 8: Statistically proven difference between industries ..............................- 52 - Table 9: Socially related benefits ......................................................................- 54 - Table 10: Mean rank of socially related benefits ..............................................- 54 -
List of Figures
Figure 1: The Diamond Model..........................................................................- 19 - Figure 2: Diamond Model benefits extracted from the Micro Ec. perspective .- 32 - Figure 3: The SMITH; Diamond Model complemented by four perspectives...- 33 - Figure 4: Operationalization of the different perspective’s benefits.................- 39 - Figure 5: Mean value of all benefits per perspective........................................- 42 - Figure 6: Overall means per perspective, standard deviation in brackets .......- 43 - Figure 7: Diamond model with the positive social atmosphere amendment.....- 55 -

- 7 -
1. Introduction
In the globalized world of today, ironically, companies find competitive
advantages in locating in proximity of each other. These highly present
industrial groupings are called clusters. This chapter describes the
definition of a cluster, what the benefits are regarded to be, what the
authors of this thesis consider to be a shortcoming in a well utilized
cluster theory, and the purpose of this thesis. To start off, a short
historical background is presented.
1.1 Background
In 1990, Professor Michael E. Porter published his book The Competitive
Advantage of Nations where a new business term was introduced;
clusters. The appellation referred to the paradoxical behaviour of related
companies to localize in proximity of each other, in order to find
competitive advantages in the globalized business environment. These
groups of interlinked companies situated in a geographically limited area
are today widely referred to as clusters. The tendency is hardly new, even
though clustering has occurred throughout history in many epochs.
During the late nineteenth century, macro economist Alfred Marshall
pointed at the groupings of heavy industry companies, which became the
industrial districts. Marshall called the behaviour “agglomeration” which
is an ancestor to the term clustering (Marshall, 1890/1920).
The cluster environment is impelled by one, or a collaboration of three
actors: The business-world, whose strive for competitiveness fuels cluster
initiatives, the academic world, where advanced research contributes to
the clusters attractiveness, and regional/national policy-makers, whose
wish to attract business acts nurturing. This triad is sometimes referred to
as the triple helix (Lindqvist, Malmberg & Sölvell, 2002).

- 8 -
Silicon Valley (semiconductors, IT) in California, USA, might be the
world’s most outstanding example of a cluster. Hollywood (movie
production) also in California, USA, is a famous second one. These two
areas are great examples of regions of agglomerated companies in high
concentrations. Smaller industrial districts might be regarded as clusters
by local policy-makers in order to market the region, while some do not
consider them clusters. Lindqvist et al. (2002) distinguish between
business-world clusters, which are big actors in a national perspective and
smaller local clusters that are big actors in the local region (Lindqvist et
al., 2002).
Clustering has many synonyms, depending on what author, theory
perspective et cetera, one is studying. In the article “What qualifies as a
cluster theory?” (Maskell & Kebir, 2004) the term cluster, along with its
relatives, was looked up in the ISI (Institute for scientific information)
knowledge database, to see how the occurrence of the terms has evolved
over time (Table 1):
Table 1 – Cluster publications 1953-2004
Term looked up in ISI database 1950s-1980s 1990s 2000s
Frequency
Cluster(s)/clustering of firm(s) 0 9 15
Agglomeration 74 305 380
- geographic(al) agglomeration(s) 0 4 7
- spatial agglomeration(s) 3 17 23
- agglomeration(s) of (same
industry) firm(s)
5 71 50
Geographic(al) concentration(s) 3 32 51
Spatial concentration(s) 7 32 30
Localised/localized industries/firms 0 5 7
Growth pole 9 12 5
Innovative milieu(s) 0 26 8
Industrial district(s) 10 126 95
(DRUID Working Paper No. 05-09, what qualifies as a cluster theory, Maskell & Kebir,
2004, p 2, transcripted)

- 9 -
As one can see from the table all the terms for clustering are not new, but
are generally increasing in use and implementation over time. One
example is “geographical concentration” which generated three hits in the
database during the period 1950s - 1980s, 32 in the 1990s and finally 51
in the current decade.
1.2 Definition
In Micro Economic theory a cluster can be defined as “geographic
concentrations of interconnected companies, specialized suppliers,
service providers, firms in related industries, and associated institutions in
particular fields that compete but also cooperate” (Harvard Business
School, 1999). This is the most commonly used definition, published by
Porter in his book The Competitive Advantage of Nations from 1990
(Harvard Business School, 1999). Despite the fashion of using Porter’s
definition, there is no general agreement of what exactly qualifies as a
cluster and the concept has been criticized for having vague boundaries
and limitations (Martin & Sunley, 2003).
A list of recognized clusters can be found on the European Cluster
Observatory (ECO) Webpage. This webpage lists clusters, according to
Porter’s definition, within the 27 European Union countries along with
Iceland, Norway, Switzerland, Turkey and Israel (ECO, 2007). The list
acknowledges more of the local clusters as well, but is similar in
character to the definition used by Lindqvist et al (2002). The ECO
webpage will be used for this thesis to facilitate the definition of a cluster,
because the deficiency of a generally accepted definition of the term
cluster could easily turn out to be problematic otherwise.
1.3 Benefits in a cluster environment
Every day, companies all over the world are fiercely trying to find
competitive edges in order to stay ahead of competition. A paradox in
today’s world of globalization is that one way of finding this edge, is for
companies to settle in the same geographical location, thus finding
- 10 -
strength in numerous alleged benefits. Such benefits are stated to be:
lower costs of infrastructure, boosted technological level by intense
competition, increased level of trust, suppliers and customers in the
proximity, et cetera. Opinions on clusters’ stated benefits are not
homogenous but vary a lot. Some claim that the combined good of a
successful cluster is higher than the combined good of the same
companies if scattered, and some say that cluster is just a fashionable
term lacking empiric evidence.
Studies have shown that a global market is well functioning for
standardized and preferably digitalized information, but when a particular
solution is needed and innovations and people are volatile, a localized
market (e.g. clusters) works better, as human capital moves slow and
social capital does not move at all (Lindqvist et al., 2002).
Sölvell explains that companies are rarely highly innovative in isolated
environments. Researches show that a big part of all innovations is a
result of the interplay with the environment (Sölvell, 2002).
As stated before, the cluster environment has vividly been argued for by
Michael E. Porter. His easy applied theories have caught the attention of
many policy-makers around the globe. One of his most criticized models
for benefits of cluster environments is called Porter’s Diamond (referred
to as The Diamond Model). The Diamond Model enumerated numerous
benefits, for example supporting industries, competition, the in-flow of a
specialized labour-force, boosted innovation, et cetera. But even the
widely acclaimed Diamond Model gets older and this leaves gaps to fill.
1.4 Critics of Porter’s cluster theories
Ron Martin and Peter Sunley of University Of Cambridge, UK, have
pointed massive critique at the “cluster-thinking” in general and
specifically towards Michael Porter. They argue that even though the
cluster concept is indeed very popular, the rush to employ it has resulted in

- 11 -
many missed fundamental empirical and theoretical questions (Martin &
Sunley, 2003). They claim that what Porter is presenting, with his
Diamond Model, is not a model but a mere “way of thinking” concerning
national economy. They also claim that (ibid., p 9):
However, although the definition and conceptual elasticity of the cluster concept can be seen as a positive strength, in that it permits a wide range of cases and interpretations to be included, we consider it to be problematic.
Thus calling the cluster thinking a “chaotic concept”, Martin & Sunley
would have wished for a more academic approach to Porter’s theories. To
conclude Martin and Sunley’s article, here is a quote from the chapter
“selective empirics and the cluster creation game” (ibid., p 18):
Obviously, a vaguely defined and theorized concept does not lend itself to easy or precise empirical definitions. In fact, in most applications the geographical mapping of clusters is surprisingly unsophisticated and stylistic. Whilst Porter’s diagrammic ‘flow diagrams’ of particular cluster of (upstream and downstream) interlinked activities are often detailed, his ‘cluster maps’ are extraordinary simplistic and unexplained.
Martin & Sunley mean that Porter gives an all too simplistic view of
clusters, with vague boundaries and too many question marks left
unanswered. The pointed critic at Porter is one of the reasons why the
purpose of this thesis is to examine if Porter’s Diamond is in need of
renewal. This is further discussed in the next paragraph.
1.5 Research objectives
Porter’s research from 1990 is today seventeen years old. During this
period of time important factors, for example the Internet, have entered
the dynamic business world and influenced companies and how they
relate to competitors, suppliers, customers, networks, knowledge et
cetera. This means of course that the rules of competition have changed.
- 12 -
Porter often sees clusters from a Micro Economic perspective, videlicet,
how the companies benefit from a cluster environment. Since the
introduction of the Diamond Model, a number of theories from different
schools have been presented. Each theory present its own cluster benefits,
although some benefits occur in more than one theory, only slightly
disguised. Porter argues his Diamond Model to be generally applicable,
but as other theories are presented over time, there are a number of
benefits not accounted for in the Diamond Model.
An article search provided reasons to suspect that the Diamond Model
does not reveal the whole picture of cluster benefits; hence it leaves some
important aspects out. In addition to some other Micro Economic benefits
which have not been taken in consideration, benefits from a few other
angles would help to fill out the gaps that are present in Porter’s Diamond
Model.
The obtained benefits from the additional cluster theories have been
classified into four perspectives; Micro Economic, where benefits are
accounted for in terms of competitiveness for the companies, for example
boosted innovation, shared costs, scope et cetera. The Diamond Model
will be presented in the Micro Economic perspective. The Macro
Economic perspective points out the clusters contribution to a nation’s
competitiveness. The Social Science perspective deals with relations,
networking and other social factors that are critical for the business
environment, and finally Economic Geography, which resembles the
Macro Economic perspective but focuses on a geographical region
instead of the whole nation, for example, a cluster.
Benefits are presented after each perspective in the theoretical framework
chapter, and compiled into a figure which adds the new benefits to the
popular Diamond Model. This compiled figure will provide more of a
complete picture of the benefits of the cluster environment, not only from
a Micro Economic point of view. It is found after the four perspectives in
the theoretical compilation.

- 13 -
The original Diamond Model describes what criteria a business region
must meet in order to build an international competitive cluster
environment in a Macro Economic perspective. Consequently, some of
these criteria must be beneficial for the individual companies, since a
successful cluster is consisting of successful companies. This is how the
criteria of the Diamond Model are converted into Micro Economic
benefits.
It is stated in theory that all clusters are unique; hence, attempts to
recreate existing successful clusters have proven unsuccessful, with a
large capital black hole left behind (Osama & Popper, 2003). This raises
the question if there is a difference between industries as well. To
examine if there is a difference between industries what is ranked as the
most beneficial qualities of the cluster environment, could add interesting
aspects to the research problem.
The problems found with the cluster environments would turn out to be:
First, does Porter’s Diamond Model need supplementary factors added to
it, in order to better suit the dynamic business world of today? Second,
does a figure compiled from the Diamond Model and the four
perspectives present a better picture of the benefits of a cluster
environment? And finally, is there a difference between the different
industries in clusters, in terms of which benefits are regarded to be the
most critical ones?
1.6 Limitations
The authors of this thesis limit themselves to examine Swedish clusters,
to minimize costs of contacting the companies and to facilitate
communications with these. The European Cluster Observatory List will
provide defined clusters to select the population from. Even though only
Swedish clusters are contacted, it does not mean that foreign companies

- 14 -
will be left out from the population. In the Swedish clusters, several
foreign companies’ subsidiaries are located.
Four perspectives of cluster theory has been designated; Micro Economic,
Macro Economic, Social Science and Economic Geographic perspectives.
The theories used are classified into these four perspectives, and only
benefits stated in the theoretical framework will be taken in consideration.
For the empirics, each question represents one benefit, and the
questionnaire is intended for employees in the positions of CEO, market
manager or employee with a strategic position for responding the
questionnaire.

- 15 -
2 Method
This chapter explains the different choices made concerning the method
for this thesis. It starts with choice of methodology where a short
summary of how the thesis has been developed scientifically is presented.
Thereafter, the research philosophy is discussed followed by choice of
theory. The section then ends with a short chapter summary.
2.1 Choice of Methodology
The purpose of this thesis is to see if there is a need to update Michael
Porter’s Diamond Model, concerning the benefits in a cluster
environment. A central point in this thesis is therefore the Diamond
Model.
The benefits have been divided in the literature into four different
perspectives. These are called: the Micro Economic, Macro Economic,
Social Scientific and Economic Geographic perspectives. Out of the
different perspectives and Porter’s Diamond Model a combined model of
benefits have been created. Hence a deductive approach, discussed further
in the research philosophy, is applied in this thesis.
Beside the Diamond Model, findings from other authors within the field
of clusters and cluster benefits will be of use. In the final analysis, this
compiled model will be evaluated against the hypothesis and general
research questions. The purpose of this model is to explore which of the
benefits the companies see as most valuable in a cluster environment.
And thereafter, depending on the results, implement it as a cluster benefit
model.

- 16 -
2.2 Research philosophy
When consulting the “research onion” in Saunders, three major research
philosophies are presented (Saunders, Lewis & Thornhill, 2007). These
are: positivism, realism and interpretivism (ibid.). The starting point in
this thesis is the Porter’s Diamond Model. In the positivistic philosophy
“you are likely to use existing theory to develop hypothesis” (ibid., p
103). This indicates a use of a positivistic philosophy in this thesis. A
Positivistic philosophy is also said to be used when one is “working with
an observable social reality and that the end product of such research can
be law-like generalizations that are similar to those that are produced by
the natural and physical scientists” (ibid., p 103). The thesis aims to
observe and study the companies’ points of view and the benefits they see
in a cluster environment. For doing so a questionnaire could be applied. A
questionnaire is a type of study that fit with the positivistic research
approach. From the questionnaire quantifiable data can be gathered,
which will lead to statistical analysis.
Building the research problem on already existing theories mean a use of
a deductive approach. The opposite, called an inductive approach, would
not be suitable for this thesis since the research is based on already
existing theories.
2.3 Choice of Theory
This paragraph gives an overview of the collection of literature.
Kristianstad University and the Internet were the two main sources for
finding relevant books and articles. In the beginning efforts were made to
obtain as much information as possible concerning Michael Porter’s
Diamond Model, and to identify the benefits. Thereafter, findings from
other authors from other perspectives and fields were studied to
complement Porter’s model. Authors that were found useful were
Marshall (1890/1920), Weber (1929), the GRET research group (2006)
and the IMP research group (1982) among others. These contributed to
create the final model, SMITH, where all findings are gathered.

- 17 -
2.4 Summary
This chapter has presented the methodology, philosophy, approach, and
choice of theory used in this thesis. In the choice of methodology, the
purpose and main structure for the thesis were presented. Thereafter the
research philosophy was defended through the use of a positivistic view.
The deductive approach was selected to the use of already existing
models and theories as starting point for the thesis. Finally, a short review
of applied theories for the thesis was presented.

- 18 -
3 Theoretical framework
This chapter presents the theoretical framework of this thesis. Four
different theory perspectives are presented: the Micro Economic, Macro
Economic, Social Scientific and Economic Geographic perspective.
Thereafter a model compiled of benefits from several theories originating
from the four perspectives is presented, which will act as a new cluster
benefit model.
3.1 The four perspectives
The perspective classification makes it easier to understand and to follow
the theoretic findings, as well as identifying the benefits. In these
different perspectives different authors’ contributions within cluster
theory will be accounted for. The theoretic framework will start with the
Micro Economic perspective and foremost Porter’s findings since he is
the one that has contributed most within cluster theory, and has provided
the core theory of this thesis; the Diamond Model.
3.1.1 The Micro Economic perspective The authors of the Micro Economic perspective are Michael Porter, Bertil
Ohlin, Edgar M. Hoover and Alfred Weber. These authors have made
relevant contributions within the field of cluster and agglomeration theory
in a Micro Economic perspective.
Common for the authors are that they think of a cluster as a nurturing
place for the individual company to be situated in. The cluster is a place
where the company evolves, setting the foundation for being competitive
and to be internationally prosperous in the future.
One of the gurus, whose ideas have come to be the favourite among
policy-makers around the world, is Professor Michael Porter of Harvard

- 19 -
Factor endowments
Demand conditions
Related and supporting Industries
Chance Government
Firm strategy, structure, and
rivalry
Business School. He is one of the advocates of clusters and has made
numerous statements concerning the benefits of clustering. For example
why clusters outperform outsourcing in terms of preventing hidden costs
of management coordination, inventory, delays, risks and lead time. It
also prolongs product cycles and speeds up innovation compared to
outsourcing (Harvard Business School, 2003). As mentioned earlier,
Porter talks about the paradox of globalization and clusters where, despite
a world wide tendency of globalization, clustering proves to be the
general recipe of competitiveness (Harvard Business School, 1999). One
commonly used model when trying to explain why some nations are more
successful in a Macro Economic perspective than others when building a
strong cluster scene is the previously mentioned Porter’s Diamond also
known as The Diamond Model or The competitive Diamond (Porter,
1990/1998). Porter’s work is based on extensive research, covering one
hundred industries in ten different countries, conducted in 1990 and later
published in his book The Competitive Advantage of Nations. The
Diamond Model is the core theory which this thesis is based upon (Porter,
1990/1998, p 127):
The Diamond Model
presents the four
essential cornerstones
needed to attain a
successful cluster, thus a
competitive national
strategy. In addition, two
external factors, labelled
chance and government,
are added to the model.
Figure 1: The Diamond Model
In order to sieve the converted Micro Economic benefits, a description of
the model will be presented, followed by a presentation of the benefits
recognized in the model.
- 20 -
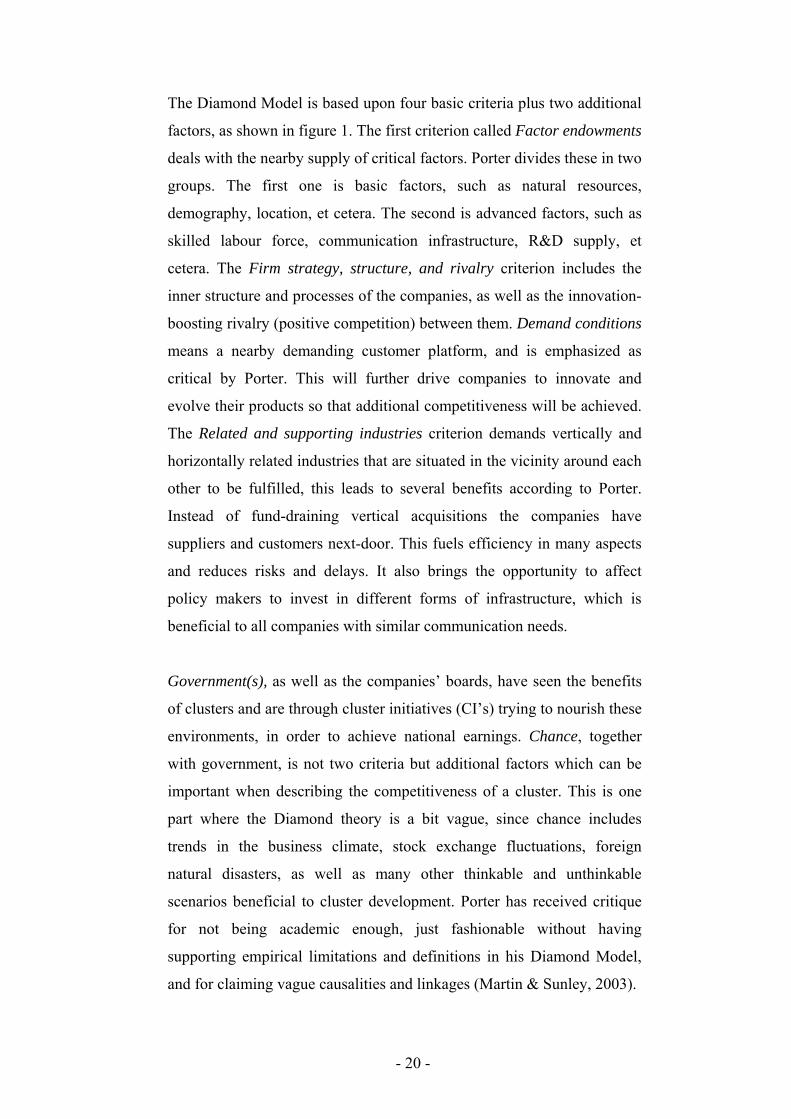
The Diamond Model is based upon four basic criteria plus two additional
factors, as shown in figure 1. The first criterion called Factor endowments
deals with the nearby supply of critical factors. Porter divides these in two
groups. The first one is basic factors, such as natural resources,
demography, location, et cetera. The second is advanced factors, such as
skilled labour force, communication infrastructure, R&D supply, et
cetera. The Firm strategy, structure, and rivalry criterion includes the
inner structure and processes of the companies, as well as the innovation-
boosting rivalry (positive competition) between them. Demand conditions
means a nearby demanding customer platform, and is emphasized as
critical by Porter. This will further drive companies to innovate and
evolve their products so that additional competitiveness will be achieved.
The Related and supporting industries criterion demands vertically and
horizontally related industries that are situated in the vicinity around each
other to be fulfilled, this leads to several benefits according to Porter.
Instead of fund-draining vertical acquisitions the companies have
suppliers and customers next-door. This fuels efficiency in many aspects
and reduces risks and delays. It also brings the opportunity to affect
policy makers to invest in different forms of infrastructure, which is
beneficial to all companies with similar communication needs.
Government(s), as well as the companies’ boards, have seen the benefits
of clusters and are through cluster initiatives (CI’s) trying to nourish these
environments, in order to achieve national earnings. Chance, together
with government, is not two criteria but additional factors which can be
important when describing the competitiveness of a cluster. This is one
part where the Diamond theory is a bit vague, since chance includes
trends in the business climate, stock exchange fluctuations, foreign
natural disasters, as well as many other thinkable and unthinkable
scenarios beneficial to cluster development. Porter has received critique
for not being academic enough, just fashionable without having
supporting empirical limitations and definitions in his Diamond Model,
and for claiming vague causalities and linkages (Martin & Sunley, 2003).

- 21 -
The Micro Economic benefits which can be drafted from the Diamond
Model are boosted innovation, which springs out of the environment of
having the related companies in vicinity. Competition, or rivalry, which
fuels several beneficial attributes of a company. Supporting industries is
the third benefit, and it also contributes to the fourth; Specialized labour
pool, in the sense that it helps to attract the right people and to market the
region. Reduced costs of infrastructure, arises with the strength of the
group, since incentives for policy-makers to invest in infrastructure is
easier to present if several companies can make use of such an
investment. These benefits are presented in a bold font in the Micro
Economic benefits list at the end of the chapter.
A continuance of other contributions within the Micro Economic
perspective will now be presented. Bertil Ohlin (1933) and Edgar M.
Hoover (1937, 1948) further discusses benefits in an agglomeration
economy (Bekele & Jackson, 2006, p 3) with:
Economies of scale and scope within the firm, the development of varied labour markets and pools of specialized skills, enhanced interaction between local suppliers and customers, savings on transport costs and shared infrastructure.
These are benefits not accounted for in Porter’s work, except
infrastructure, which will be regarded as a Diamond Model benefit,
because of the identical characteristics. These characteristics made them
important for the theoretical framework.
Ohlin & Hoover were interested in how the individual company was
influenced by co-location and, more generally, which conditions that
made the company more productive than other companies that were not
co-located (van Oort, 2004). Compared to Marshall’s Macro Economic
work (presented in the next perspective), which dealt with the positive
effects of geographical concentration of industry, Ohlin and Hoover have
a more individual firm perspective. This is why it is placed in the Micro

- 22 -
Economic perspective. The benefits of Scope and Economies of Scale and
Enhanced Interaction Business to Business are Ohlin & Hoover’s
contributions to the Micro Economic benefits.
Alfred Weber’s book Theory of the location of industries from 1929
discusses several important factors concerning agglomerations. His
foremost work lies in finding factors for finding the optimal location and
minimal cost for manufacturing plants. He came to the conclusion that
three factors decide where the optimum location for the industry is, so
that costs are minimized for transportation and labour. Optimal
transportation distance deals with the ratio of weight and distance
between raw materials and finished products. Lower cost labour may
justify longer transport distances and finally the Agglomeration and
deglommeration factor which handles the balance between the two
extremes (Weber, 1929).
Weber’s efforts to show the optimal location can be seen in one of his
models, the isodapanes model. This is an essential part of Weber’s
contributions within the field of agglomeration theory where he shows
where companies can enjoy the benefits of an agglomeration economy
(Weber, 1929). He has also made several mathematical contributions
showing how the optimum location for the individual firm in an
agglomeration theory could function. Weber’s contributions to the
benefits in the compilation will be logistics. His discussion of a big labour
force which lowers the cost of labour and thereby legitimizes longer
transport routes generates the logistical benefit.
To summarize the Micro Economic perspective, clusters function as a
place where the right supporting industries are located, which means that
together companies can get important benefits like better logistic
solutions, shared orders which means lower costs of order, transportation
and time savings. Being within the same industry allows for shared
infrastructure among the companies located in the vicinity.

- 23 -
Micro Economic benefits
(Diamond benefits in bold)
• Enhanced interaction business to business
• Supporting industries • Reduced costs of infrastructure • Economies of scale • Scope • Competition / Rivalry • Logistics • Specialized Labour pool • Boosted innovation
Being located in a cluster benefits the company in that way that there is
an enhanced interaction of businesses. The company can use scope and
economies of scale to specialize on its products to certain companies
within the cluster giving the company a strong customer base. In a cluster
it is easier to access specialized skilled labour due to interconnection of
companies with a similar labour pool.
Rivalry, or competition, between companies in a cluster creates an
atmosphere in which companies
strive to stay ahead of competitors.
Boosted innovation is a creation
from the favourable rivalry that is
formed in a cluster. In a cluster,
innovative R&D is seen as
important, being a platform where
collaboration as well as
competition takes place as a
cornerstone.
3.1.2 The Macro Economic perspective The Macro Economic perspective is showing how a nation’s economy is
affected by the benefits. From the Macro Economic point of view, a
flourishing industrial cluster should contribute to an improved national
economy. Publications from Alfred Marshall and Örjan Sölvell are
included in this perspective.
Macro economist Alfred Marshall was first to mention the development
of clusters, designated agglomeration at the time, which was thought to be
an explanation of the economic development of industrial districts.
Industrial districts were referred to as a concentration of economic
activities in a city or a region (Kuah, 2002). With this theory as a starting
point, it built a framework for other theories to develop for today’s
clusters.

- 24 -
Marshall’s classical analysis of agglomeration phenomenon from 1890
explained that companies within the same branch were actively striving to
be collocated and thereby increase the possibility to build a constant
market for competence (Marshall, 1890/1920). Constant market for
competences creates pools of labour which is the first benefit from the
Macro Economic perspective. The more firms specialize and advance in
respective businesses, the bigger is the chance of creating geographically
pooled labour markets. This is no more complicated than the bonds
between supply and demand, so a concentration of labour is to be
expected wherever a successful cluster emerges.
The labour pool is a great resource for the companies involved in a cluster
environment but also very good for the competitiveness of a nation. This
motivating force developed industrial complexes with positive
externalities, or benefits, with agglomerations of interrelated firms and
industries. Marshall explains that these benefits were caused by three
major forces (Kuah, 2002):
• Knowledge flows and knowledge spillovers between firms
• Specialized inputs and services from supporting industries
• A geographically pooled labour market
The benefit of knowledge flows and spillovers, emerge when knowledge
is moving autonomously from one firm to another so that the nation itself
gains a richer basis of knowledge. For instance; Knowledge flows as well
as knowledge spillovers are a result of firms’ constant urge for unique
knowledge and development in order to be more competitive. This
development of knowledge is spreading to the businesses around, thanks
to the proximity. With specialized knowledge that is created as a result of
agglomeration, firms can accomplish special technological developments
that they otherwise, if located somewhere else, never could perform
(Marshall, 1890/1920).
- 25 -
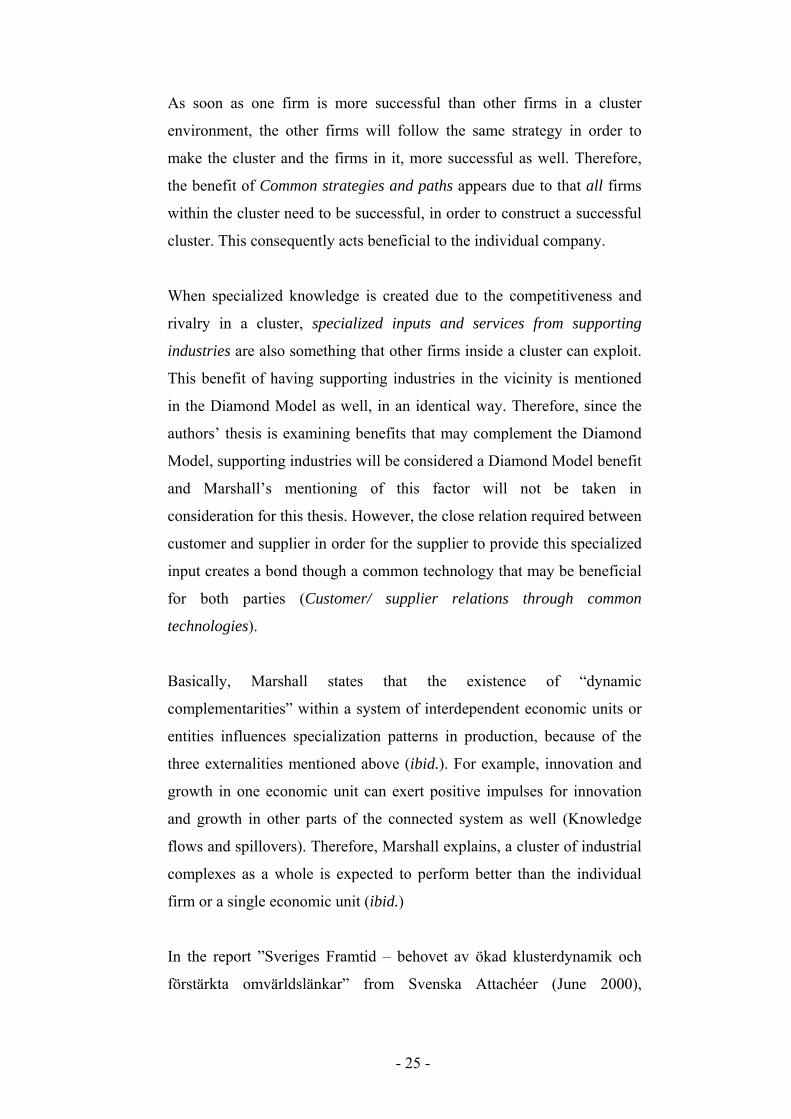
As soon as one firm is more successful than other firms in a cluster
environment, the other firms will follow the same strategy in order to
make the cluster and the firms in it, more successful as well. Therefore,
the benefit of Common strategies and paths appears due to that all firms
within the cluster need to be successful, in order to construct a successful
cluster. This consequently acts beneficial to the individual company.
When specialized knowledge is created due to the competitiveness and
rivalry in a cluster, specialized inputs and services from supporting
industries are also something that other firms inside a cluster can exploit.
This benefit of having supporting industries in the vicinity is mentioned
in the Diamond Model as well, in an identical way. Therefore, since the
authors’ thesis is examining benefits that may complement the Diamond
Model, supporting industries will be considered a Diamond Model benefit
and Marshall’s mentioning of this factor will not be taken in
consideration for this thesis. However, the close relation required between
customer and supplier in order for the supplier to provide this specialized
input creates a bond though a common technology that may be beneficial
for both parties (Customer/ supplier relations through common
technologies).
Basically, Marshall states that the existence of “dynamic
complementarities” within a system of interdependent economic units or
entities influences specialization patterns in production, because of the
three externalities mentioned above (ibid.). For example, innovation and
growth in one economic unit can exert positive impulses for innovation
and growth in other parts of the connected system as well (Knowledge
flows and spillovers). Therefore, Marshall explains, a cluster of industrial
complexes as a whole is expected to perform better than the individual
firm or a single economic unit (ibid.)
In the report ”Sveriges Framtid – behovet av ökad klusterdynamik och
förstärkta omvärldslänkar” from Svenska Attachéer (June 2000),

- 26 -
Macro Economic benefits
• Knowledge spillovers • Knowledge flows • Pool for labour market • Customer/supplier relations
through common technology • Standardization • Cooperation • Technology development • Common strategies & paths
Professor Örjan Sölvell describes some of the most important cluster
benefits.
Sölvell claims that the idea of companies being part of a whole system
has, in modern times, become central, both in economic and in industrial
thinking (Sölvell, 2000). Several different system-conceptions are partly
completing and partly competing with each other. Most system-
conceptions emerge from companies that are connected in some way
through different types of relations and that these relations make it
possible and profitable to consider the industry as one whole system or
several systems of relating companies, rather than a couple of free-
standing companies (ibid.).
Firms inside a cluster tend to share conditions and culture. For the
purpose of making business more effective and easier, rules and
conditions are created by standardization and logistic costs can be shared
between firms, two important benefits of clustering (ibid.). According to
Sölvell, the sharing of conditions and culture develops into cooperation
and by doing so, the positive effects of clustering can be best exploited.
To summarize the Macro Economic perspective, governments need to
constantly nurse and take care of their productive regions. The constant
flow of incentives must be given and
aimed at the most creative and
industrial regions. Diversity should
be prioritized and the pools of
specialized labour market should be
given special attention.
Specialization is essential if a
country wants to be a leader in some
special business areas.

- 27 -
3.1.3 The Social Scientific perspective Within the Social Scientific approach the massive work of the IMP group
is represented. The IMP group, which stands for The
Industrial/International Marketing and Purchasing research group, started
their work in the late 1970’s (Tikkanen, 1998). IMP discusses networks
and the importance of strong relationships, high trust and control in a
buyer/seller relationship, information flows and knowledge creations
(IMP group, 1982).
Even though The IMP Group consists of many contributing authors, it is
referred to as the work of The IMP group. Axelsson and Easton (also IMP
group members) are the only members that are cited as individual
authors, due to extensive use of their contributions in this thesis.
There are two different approaches within the IMP group. The first one,
just mentioned as IMP1, deals with an Interaction Approach between
buyers and sellers (ibid.). From the book of IMP group (1982) some
characteristics can be seen as well as benefits from the interaction
approach. The interaction approach is based on the Inter-Organizational
Theory, New Institutional Theory and relevant marketing contributions
within the field (ibid.). The inter-organizational theory can be divided
into to three different areas; organization based studies, studies based on
several organizations and studies of the organization in a societal context
(ibid.).
The organization based theory deals with the setting (environment), the
relationship between organizations within it and its dependency to access
certain inputs within the given environment (ibid.). Studies based on
several organizations can best be explained with a quote of Håkansson
(ibid., p. 19):
In order to obtain necessary resources, the organization is seen to develop relations with a number of other organizational units and thus it enters into a network of relationships.

- 28 -
The new Institutional theory presented by Williamson in 1975, discusses
transaction cost in two different situations. First one is a transaction
(exchange) in a market setting between separable units. Second is a
transaction within an organizational unit (internalization) (ibid.). There
are incentives to internalize operations when transaction costs get too
high in the market (ibid.). The benefits that can be extracted here are;
Access to resources, Networks and the lowering of transaction costs.
The Industrial Network theory, known as IMP2, was created sometime
around the middle of the 1980’s and is a continuance on IMP1 (Tikkanen,
1998). The main focus lies on networks and “the buyer/seller
relationships with an emphasis on issues related to power and control in a
marketing channel” (Axelsson & Easton, 1992, p 9). This adds the benefit
of Power/ control in channels to the Social Scientific perspective.
From the book of Axelsson and Easton (1992) some outlines can be
drawn as well as benefits from industrial networks. Relationships in a
network “implies that the firms are prepared to interact with each other
and expect each other to do so” (ibid., p. 9), this means that there needs to
be a clear understanding between the firms and their objectives.
Relationships and cooperation may be created to get access to different
important variables seen from the individual firm, new technologies, new
process or a new market entry (ibid.,). The new technology is acquired
through sharing and this generates the benefit of sharing technologies.
Positive aspects of entering into a relationship can be that “relationships
allow of a more effective acquisition of resources and sale of product”
(ibid., p. 9). This can be seen from the way of increasing sales or
decreasing costs, but also in an increasing intentional knowledge transfer
between firms. One other factor is that “relationships also provide
continuity and stability” (ibid., p. 9). Knowledge transfer and Stability are
extracted as benefits from these statements of Axelsson and Easton.

- 29 -
Social Scientific benefits • Access to resources • Lower transaction costs • Networks • Power/control in channels • Trust • Sharing technologies • Stability • Knowledge transfer • Uncertainty reduction
Other positive aspects in a relationship are that of getting access to a
network of firms. This access “implies a measure of control over another
organization and, through that organization, the environment” (ibid., p.
10). The control, that the access to other firms gives, works as uncertainty
reduction and thus makes the stability of the network and the individual
firm stronger. Another important factor that the firm gets access to in a
network is the information flow within the network (ibid.). Control is
already mentioned as a benefit but Uncertainty reduction adds to the list.
Axelsson & Easton continue to discuss the positive aspects of
relationships in networks. A factor they call social exchange can build
trust and reduce risk in a network (ibid., p. 10):
Social exchange relations evolve in a slow process, starting with minor transactions in which little trust is required because little risk is involved and in which both partners can prove their trustworthiness, enabling them to expand their relation and engage in major transactions.
IMP group writes that an organization
enters into a relationship to access
certain inputs or resources within a
given environment. In a social context
the organization works as an efficient
exchange place of values. Further on
the interaction approach builds one
part on the work of Williamson, who
wrote that there are incentives to
internalize in an organization when
transaction costs gets too high in the market. The lowering of transactions
cost should also withstand when thinking of networks and clusters. The
mentioning of the critical benefit of Trust is the last benefit added to the
Social Scientific perspective.

- 30 -
To summarize the work of the IMP group, they state that an industrial
network gives access to resources and technology. It reduces risk and
uncertainty, builds trust, control, power and stability. Networks can also
be used to get access to knowledge and shared information.
3.1.4 The Economic Geographic perspective Economic Geography is the study of a geographical region, and the
economic activities within it. From a cluster perspective, Economic
Geography describes the logics behind geographical location of
businesses, their trade, transportation patterns as well as world trade.
Economic Geography is the least contributing perspective in this thesis,
but it has a few benefits that can utilize.
Within industrial dynamics a widely known conception is the regional
agglomerations conception (Sölvell, 2000). During the 1990’s, Regional
agglomeration conception experienced a rebirth when it comes to
condensed industry milieus (clusters).
Regional agglomeration theories have contributed to the ambition to
understand the importance of geographical closeness for the industrial
system’s functionality (Malmberg, 1996).
Further research within the Economic Geography field has been
conducted by the researchers of GREMI and GRET. GREMI stands for
Groupe de Recherche Européen sur les Milieux Innovateurs and was
established by Philippe Aydalot in 1984 (Grandi, 2005, p. 9). This is
GRET’s description of research conducted by GREMI (GRET, 2006, p 1)
GREMI has been working on building a conceptual framework aimed at understanding the role of local dynamics in the more general transformations of the economy and the society, as well as in proposing policies.
The ‘milieu’, as GREMI calls it, is affected by social, cultural and
environmental factors. Grandi says “all these aspects combine to create a
- 31 -
Economic Geographic benefits (Innovative milieu)
• Technological development • Learning • Social/cultural environment
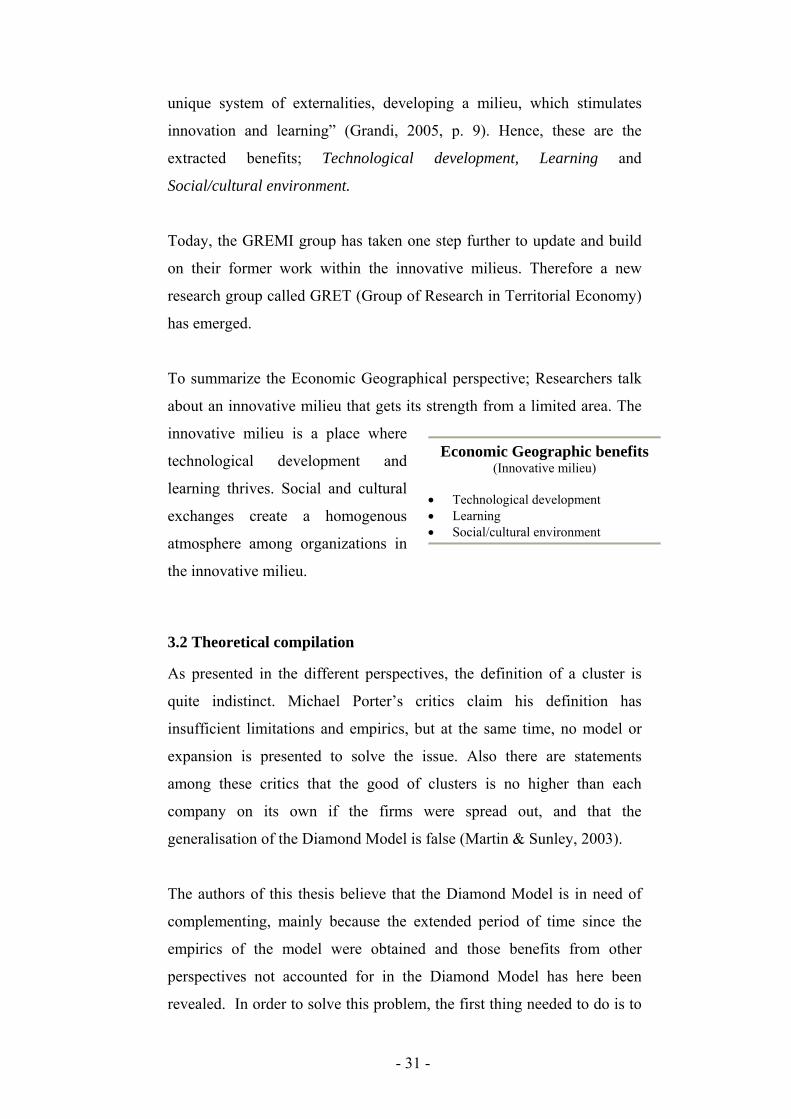
unique system of externalities, developing a milieu, which stimulates
innovation and learning” (Grandi, 2005, p. 9). Hence, these are the
extracted benefits; Technological development, Learning and
Social/cultural environment.
Today, the GREMI group has taken one step further to update and build
on their former work within the innovative milieus. Therefore a new
research group called GRET (Group of Research in Territorial Economy)
has emerged.
To summarize the Economic Geographical perspective; Researchers talk
about an innovative milieu that gets its strength from a limited area. The
innovative milieu is a place where
technological development and
learning thrives. Social and cultural
exchanges create a homogenous
atmosphere among organizations in
the innovative milieu.
3.2 Theoretical compilation
As presented in the different perspectives, the definition of a cluster is
quite indistinct. Michael Porter’s critics claim his definition has
insufficient limitations and empirics, but at the same time, no model or
expansion is presented to solve the issue. Also there are statements
among these critics that the good of clusters is no higher than each
company on its own if the firms were spread out, and that the
generalisation of the Diamond Model is false (Martin & Sunley, 2003).
The authors of this thesis believe that the Diamond Model is in need of
complementing, mainly because the extended period of time since the
empirics of the model were obtained and those benefits from other
perspectives not accounted for in the Diamond Model has here been
revealed. In order to solve this problem, the first thing needed to do is to

- 32 -
extract the Diamond Model’s benefits out of the Micro Economic
perspective (fig. 2), in order to get a clear picture of which benefits are
going to complement the Diamond Model.
Figure 2: Diamond Model benefits extracted from the Micro Economic perspective
With the Diamond Model’s benefits extracted, the benefits found in the
four different perspectives are compiled into a figure (fig. 3), designated
Summarized Milieu description, Irrespective of Theoretical Heritage
(SMITH):
Micro Economy • Enhanced interaction
business to business • Supporting
industries • Reduced costs of
infrastructure • Economies of scale • Scope • Competition • Logistics • Specialized Labour
pool • Boosted innovation
Diamond Model • Supporting industries • Reduced costs of
infrastructure • Competition / Rivalry • Specialized Labour
pool • Boosted innovation
Micro Economy (Remaining benefits)
• Enhanced interaction business to business
• Economies of scale • Scope • Logistics

- 33 -
Figure 3: The SMITH; Diamond Model benefits complemented by the four perspectives
With the SMITH figure, two research proposals are formed, along with
one hypothesis. These are as follows:
Research proposal 1: There are benefits found outside the
Diamond Model that are ranked higher than the benefits found in
the Diamond Model.
This is the main research proposal of this thesis and why the research is
conducted. The claim that the Diamond Model is out of date leads to the
search for a better alternative, which is the background of the second
research proposal:
Research proposal 2: The SMITH provides a higher ranked mean
than the Diamond Model.
The figure is a compilation of benefits from four perspectives and should
be able to cover more of the benefits found in the dynamic business world
of today. Nevertheless, since being dynamic, the different businesses are
Micro Economy • Economies of scale • Scope • Enhanced interaction
business to business • Logistics
Macro Economy • Knowledge spillovers • Pool for labour market • Customer/ supplier
relations through common technology
• Applied development, standardization
• Cooperation • Technology
development • Common strategies &
paths • Knowledge flows
Social Science • Access to resources • Lower transactions
cost • Networks • Power/control in
channels • Trust • Sharing
technologies • Stability • Knowledge transfer • Uncertainty
reduction
Economic Geography (Innovative milieu)
• Technology • Learning • Social/ cultural
environment
Diamond Model • Boosted innovation• Supporting
industries • Competition /
Rivalry • Specialized labour
pool • Reduced costs of
infrastructure

- 34 -
not guaranteed to pull in the same direction, thus resulting in the
following hypothesis:
Hypothesis 1:
a) Benefits are ranked differently between industries
b) The perspectives compiled benefits are ranked differently
between industries
One may assume that different industries have somewhat different use of
the different benefits, since they all have their own prerequisites, and
paths of development. This is the background of the assumption of
hypothesis number three. A test, if the different perspectives compiled
benefits showed any difference will further add information of the
difference between the industries.
Two general research questions are also formulated to further investigate
the experienced benefits from clustering:
• Which benefit is ranked the highest?
• What perspective has the highest ranked mean?
The SMITH will act as the foundation for the questionnaire, in order to
see if the research proposals are true and if the hypothesis is accepted or
discarded. The operationalization of how the benefits are translated into
statements is further described in chapter three, which is method.

- 35 -
4 Empirical method
This chapter first presents the research strategy, giving the reader an
outline of the strategy used throughout the thesis. Thereafter the time
horizon as well as the data collection method is shortly described. A
profound description of population and sample selection are presented.
In addition operationalization, data analysis, reliability and validity are
presented.
4.1 Research Strategy
The research strategy used in this thesis is a survey, conducted through a
questionnaire. The use of a questionnaire allows for easy comparison of
quantitative data. Quantitative data are described by Saunders et al.
(2007) as “Often obtained by using a questionnaire administered to a
sample, these data are standardized, allowing easy comparison”
(Saunders et al, 2007, p 138). Therefore, it is possible to analyse
“particular relationships between variables and to produce models of
these relationships” (ibid., p 138).
Conducting a questionnaire gave an opportunity to investigate how
benefits in a cluster were seen from the companies’ perspective.
Analysing the questionnaire showed relationships and made it possible to
test hypothesis.
4.2 Time horizon
This thesis is based upon a cross-sectional study, which means that it is a
“study of a particular phenomenon at a particular time” (ibid., p 148). The
questionnaire was conducted over a very short period of time, and thus
gave a mere picture. The compiled model was created and thereafter
tested with cluster benefits in a current setting.
- 36 -
4.3 Data Collection Method
In this part, an explanation of how the data was collected in the survey is
shown. Data can be collected in many ways (Saunders et al, 2007), trough
observations, interviews and questionnaires et cetera. When having a
positivistic philosophy and a deductive approach a questionnaire is often
followed and used.
In this thesis the best way to measure companies’ opinions were through
a web based questionnaire. The main reasons for thinking a web based
questionnaire was the only way were: time limit, money and the
generalization factor. First, the time consuming factor would be too high
if trying to set up meetings with all those companies that should be in the
research population. Second, transportation costs to meet all companies
through interviews or handing them questionnaires would be extremely
high. Third, enough companies needed to be reached to be able to get
answers that could be generalized. By creating a web based survey
companies in the population could be reached through e-mail addresses,
at a low cost and in time.
It is said that web questionnaires generates a very low response rate
(Saunders et al., 2007). But, for this thesis the authors thought that it was
the only way of conducting the survey. This argument was used because
it was important to be able to generalize the final result, which would not
been able for example with qualitative interviews, a case study or a
regular questionnaire. To get started an existing template was used for
inspiration and design (Mayer, 2003).
4.4 Population
Because of many varied definitions of clusters, one clear definition was
important to use when finding the population. If not, the ability to defend
why certain companies was chosen for the questionnaire would be
extremely hard. It was therefore crucial to find an already outspoken

- 37 -
cluster ‘map’, were the chosen population come from. During the theory
search a web page was found on the internet called Cluster observatory.
This page lists clusters in 32 countries; but only contact information to
the Swedish clusters is presented. The clusters are based on the cluster
definition used by Michael Porter. The page is owned and presented by
the Center for Strategy and Competitiveness (CSC) at the Stockholm
School of Economics, which of course makes it very reliable and
accredited. There was now the possibility to reach more than 1000
companies located in over 30 cluster environments. 29 clusters were
located in Sweden as one was located in Denmark.
It is possible to obtain lists of companies’ email addresses from an
Internet-based employment directory or via a search engine, but was not
recommended (Saunders et al, 2007). Therefore the respondents were
found manually in each separate cluster organization. From there the
names of the companies and the right respondents e-mail addresses or
phone numbers were located. “Internet-and intranet-mediated
questionnaires are usually administrated in one or two ways: via email or
via a website” (ibid., p 389). Of those over 1000 companies from the
beginning, some form of contact information could be found to 809
respondents. Those that could not be located were unlisted or protected
by the cluster organization in some way or another, which hindered the
authors of this thesis to contact them.
4.5 Sample selection
Of the 809 contacts, 415 were to e-mail addresses. The remaining
contacts were to phone numbers. Most of the e-mail addresses were to
CEOs or market managers. To get as high response rate as possible,
personal e-mail addresses were used instead of sending to “info@”
addresses. Before launching the questionnaire, a test respondent was
contacted to evaluate the questionnaire. The test respondent was a person
well used of working in a cluster environment, with a history of business-
strategic employment. Of the 415 e-mail addresses that were used, 8

- 38 -
could not be delivered to the respondent. Therefore 407 e-mails were sent
away. In the e-mail, an explanation of the research was presented as well
as an appeal to the contact to answer the web based questionnaire
(Appendix 1, 2). In the e-mail the link to the questionnaire was attached.
“Covering email and good design of the survey will help to ensure a high
level of response” (ibid., p 389). To obtain a higher response rate, a
decision was made to randomly call each 10th company from the contact
list who had not been contacted through e-mail (Appendix 3, 4). As many
companies as possible were called during the remaining time of the
questionnaire. An additional 39 e-mails were therefore sent to
respondents e-mail addresses after telephone based agreements. A total of
446 e-mails with an attached link to the questionnaire were sent out. Of
the 446 e-mails sent, 72 responses were received. This generates a total
response rate of 16 percent (16.14 %).
The questionnaire had a lower limit of collected answers to be accepted
as empirical base for an analysis. The limit was set to a minimum of 50
returned and answered questionnaires. The goal was to get over 100
complete and answered questionnaires. In the end 72 responses were
received. For being a web based questionnaire the response rate is
acceptable.
4.6 Operationalization
Each of the benefits in the SMITH model is represented by a statement in
the questionnaire, which reflects the current benefit. Respondents in the
survey will take position to it through choices graded 1 -7, where “1”
equals if respondent does not agree at all and “7” equals agrees
completely. A more specific description of how each benefit is
operationalized is found in appendix 5, but this is the general
operationalization (fig. 4):

- 39 -
Figure 4: Operationalization of the different perspective’s benefits.
Micro Economy • Economies of scale • Scope • Enhanced interaction
business to business • Logistics
Macro Economy • Knowledge spillovers • Pool of labour market • Customer/ supplier
relations through common technology
• Applied development, standardization
• Cooperation • Technology
development • Common strategies &
paths • Knowledge flows
Social Science • Access to resources • Lower transaction
costs • Networks • Power/control in
channels • Trust • Sharing technologies • Stability • Knowledge transfer • Uncertainty reduction
Economic Geography • Technology • Learning • Social/ cultural
environment
Diamond Model • Boosted innovation • Supporting industries • Competition • Specialized labour
pool • Reduced costs of
infrastructure
The Diamond Model originates from the Micro Economic perspective, so no additional effort to get the companies perspective was needed. The statements are put in a way so that the respondents know if the statements regard the cluster in general or with specific business partners within the cluster.
The Micro Economic perspective is operationalized in the same way as the Diamond Model. Specific words, not regarded as common have been formulated in a more common terminology, for example scope.
Two of these benefits were extra carefully formulated when operationalized, these were “Knowledge spillovers” and “Knowledge flows”. Extra effort was put into the statement to ensure the respondents that the spillovers were created autonomously and that the flows occur thanks to the proximity. The rest of the benefits were not expressed in a terminology foreign to companies in the different theories.
The benefits of the Social Scientific perspective are not formulated in a special terminology in the theories, so the statements were easy to operationalize. No statements were considered hard to understand by the test respondent either, so a high level of understanding from the “real” respondents was anticipated.
The benefits from the Economic Geography perspective of our thesis originate from the GREMI group, where an innovative milieu is emphasized. This milieu is also emphasized in the statements regarding technology and learning, to make respondents answer to if this milieu is present or not.

- 40 -
4.7 Data analysis
The research proposals and the hypothesis will be tested as follows:
Research proposal 1: There are benefits found outside the Diamond
Model that are significantly ranked higher than the benefits found in
the Diamond Model. A mean of each benefit from the Diamond Model
will be calculated, and the lowest ranked benefit as well as the highest
ranked benefit will be tested with all benefits of the SMITH figure. This,
to see what benefits outside the Diamond Model is worth complementing
with, and if they are ranked higher at all.
Research proposal 2: The SMITH provides a higher ranked mean
than the Diamond Model. The mean of the benefits from the SMITH
will be compared to the mean of the Diamond Model. If the SMITH
shows a higher mean, we can draw the conclusion that it provides a better
picture of cluster benefits than the Diamond Model. This test will
unfortunately contain a statistical flaw; the standard deviation will be a
“mean standard deviation” and will not show the spread amongst the
different deviations, since the different perspectives have an unequal
number of benefits.
Hypothesis 1: a) Benefits are ranked differently between industries
b) The perspectives compiled benefits are ranked differently
between industries. These two hypotheses will be tested with a
Kruskal-Wallis test to see if the difference can be statistically
proven. The significance of difference will affect the conclusions
whether a compiled or complemented model can be regarded as
generally applicable.

- 41 -
4.8 Reliability and validity
It was important to contact the appropriate employee that had insight in
the company’s strategic business plans, for the sake of validity. With such
a small sample as this survey provided, one can not be certain that this
survey will turn out the same way if conducted again. A larger population
would provide a wider picture and decrease the graph’s fluctuation of
each answer. This is problematic for reliability as well as for validity
reasons.
The similarity of the benefits, which consequently leads to a similarity of
the statements, means that the survey would probably not render the same
results if the questionnaire was sent to the same respondents once again,
since the statement can turn out problematic to tell apart. We consider this
a theoretical drawback which we are not able to counteract. Only
companies listed as members of cluster organizations were contacted, in
order to ensure that the companies themselves are aware of the cluster
environment.

- 42 -
5 Analysis
In this chapter, the empirical findings are shortly displayed and the
general research questions are answered. The different tests used are
presented. The research proposals, along with the hypothesis are
thereafter tested and findings are analyzed. Finally, critique and a
conclusion end the chapter.
5.1 Empirical findings
The survey generated quite an extensive amount of figures. Due to space
saving reasons, the frequency tables of each question will not be
presented. Instead, the mean value of each benefit is presented. The
benefit with the highest mean rank within each perspective is marked
with an asterisk (figure 5):
Figure 5: Mean value of all benefits per perspective
As seen in figure 5, the Diamond Model presents an even overall rank
while the other perspectives present a higher variation within each group
(consult appendix 9 and 10 for standard deviation). The first general
research question of which benefit received the highest mean rank, turned
- 43 -
out to be Technological development, from the Economic Geography
perspective.
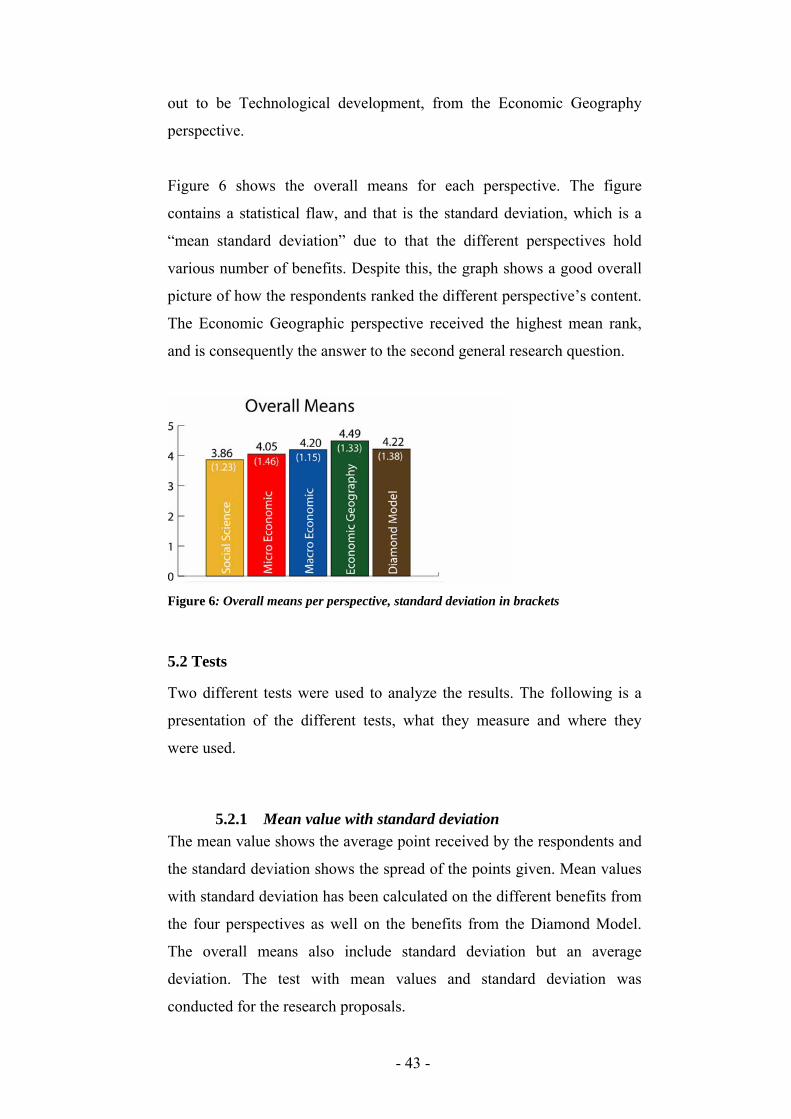
Figure 6 shows the overall means for each perspective. The figure
contains a statistical flaw, and that is the standard deviation, which is a
“mean standard deviation” due to that the different perspectives hold
various number of benefits. Despite this, the graph shows a good overall
picture of how the respondents ranked the different perspective’s content.
The Economic Geographic perspective received the highest mean rank,
and is consequently the answer to the second general research question.
Figure 6: Overall means per perspective, standard deviation in brackets
5.2 Tests
Two different tests were used to analyze the results. The following is a
presentation of the different tests, what they measure and where they
were used.
5.2.1 Mean value with standard deviation The mean value shows the average point received by the respondents and
the standard deviation shows the spread of the points given. Mean values
with standard deviation has been calculated on the different benefits from
the four perspectives as well on the benefits from the Diamond Model.
The overall means also include standard deviation but an average
deviation. The test with mean values and standard deviation was
conducted for the research proposals.
- 44 -
5.2.2 Kruskal-Wallis test The Kruskal-Wallis test is used when more than two unrelated samples
with different variables shall be tested. It is similar to the Mann-Whitney
test, but the Mann-Whitney can only be used with a maximum of two
unrelated samples. If the scores received by each benefit have little
difference between them, their mean rank should be similar (Cramer,
1994). If the difference in ranking the benefits by the different industries
is strong, the significance level for the specific benefit should be between
zero and five per cent, between five and ten per cent indicates some
significance. In the cases of a level above ten per cent, no significance
can be proven.
The test was used for the hypothesis. Since our respondents were
unevenly distributed among the industries, only four contained enough
respondents to be tested; those were IT, Metal, Biomedicine and Other.

- 45 -
5.3 Research proposals & Hypothesis
Research proposal 1: There are benefits found outside the Diamond
Model that are ranked higher than the benefits found in the Diamond
Model.
The benefit from the Diamond model with the highest ranking was
Specialized Labour Pool (mean value of 4.43), and the lowest ranked
benefit was Competition/Rivalry (mean value of 4.00). The table below
displays the benefits that are outside the Diamond model and have the
higher or same mean value than the highest rank in the Diamond model
(Table 2):
Table 2: Benefits that may complement the Diamond Model
Benefits ranked higher than the highest ranked Diamond benefit Mean Std.
Deviation
Knowledge spillovers (Macro) 4.5556 1.53723
Knowledge flows (Macro) 4.6528 1.49327
Knowledge transfers (S. Sc) 4.5972 1.57140
Technological development (Ec. Geo) 4.9028 1.57587
Enhanced B2B interaction (Micro) 4.7917 1.57388
Networks (S. Sc) 4.8333 1.66995
Cooperation (Macro) 4.7500 1.79004
Benefits ranked higher than the lowest ranked Diamond benefit Mean Std.
Deviation
Pool for labour market( Macro) 4.2639 1.69501
Technology development (Macro) 4.0141 1.55373
Customer/ supplier relations through common technology (Macro)
4.1111 1.75672
Economies of scale (Micro) 4.3380 1.77236
Trust (S. Sc) 4.3333 1.53824
Social and cultural factors (Ec. Geo) 4.2394 1.55347
Learning through innovative milieu (Ec. Geo) 4.2857 1.60744
Access to resources (S. Sc) 4.3099 1.65263
The seven benefits above the dashed line are all ranked higher than the
highest benefit in the diamond model and would thereby make a strong
complement. The remaining eight benefits below the dashed line were
ranked higher than the lowest ranked benefit of the Diamond Model, and

- 46 -
would consequently make a good complement. Since the test revealed
benefits that presented a higher ranked mean than the lowest ranked
benefit, and even some that were ranked higher than the highest ranked
mean of the Diamond Model; the hypothesis is accepted.
Research proposal 2: The SMITH provides a higher ranked mean
than the Diamond Model.
This hypothesis is tested with a comparison of the means from the
Diamond Model and the mean from the SMITH (Table 3):
Table 3: Means comparison, Diamond Model and SMITH
Diamond Model Valid 67
N Missing 5
Mean value 4.2209 Std. Deviation 1.37780
SMITH
Valid 55 N
Missing 17 Mean value 4.0633 Std. Deviation 1.20122
The test shows that the SMITH does not present an overall higher mean
than the Diamond Model (4.06 compared to 4.22). However, a wider
array of benefits is presented in the SMITH than in the Diamond Model
(29 compared to 5). When describing benefits in a cluster environment,
the SMITH may be applicable to show a multi-facetted perspective in
terms of benefits. In the end, it did not generate a higher mean than the
Diamond Model.

- 47 -
Hypothesis 1: a) Benefits are ranked differently between industries
The Kruskal-Wallis test was applied on the four groups IT, Metal,
Biomedicine and Other since these industries were the only ones with
enough respondents to perform a test of statistical relevance.
The test showed a significant difference between the industries in the
following benefits (Table 4):
Table 4: Kruskal-Wallis test, difference between industries per benefit
Boosted innovation (Diamond)
Technology development (Macro)
Sharing technologies (S. Sc)
Technological development (Ec. Geo)
Supporting industries (Diamond)
Asymp. Sig. .027 .048 .081 .046 .064
C/ S. relations through common tech (Macro)
Economies of scale (Micro)
Learning through innovative milieu (Ec. Geo)
Stability (S. Sc)
Logistics (Micro)
Asymp. Sig. .037 .021 .025 .011 .055
In table 4, a significance level below five per cent (≤0.05) showed a
strong significance, and between five and ten per cent (≤0.10) showed
some significance. Over ten per cent presented no significance at all and
these benefits are not accounted for in table 4 (for full significance table,
consult appendix 8). The test showed that the biggest difference between
the industries was in Stability, from the Social Scientific perspective.
Nine other benefits showed significant difference in percentages varying
from two point one per cent (Economies of scale) and eight point one per
cent (Sharing technologies). Given that the benefits were ranked
differently between the industries in ten out of twenty-nine cases, the
hypothesis is discarded.

- 48 -
The following table is a presentation of which industry ranked the current
benefits the highest. The industry with the highest mean rank
consequently ranked it the highest (Table 5). For example, in the benefit
supporting industries the industry Biomedicine had the highest mean
rank.
Table 5: Kruskal-Wallis test, highest ranking industry per benefit
Industry N Mean Rank Other 20 33.88 IT 18 21.56 Metal 8 18.81 Biomedicine 7 30.71
Boosted innovation (Diamond)
Total 53 Other 21 32.55 IT 18 20.81 Metal 8 23.00 Biomedicine 7 34.71
Technology development (Macro)
Total 54 Other 21 32.29 IT 18 20.17 Metal 8 31.44 Biomedicine 7 27.50
Sharing technologies (S. Sc)
Total 54 Other 22 28.84 IT 18 22.56 Metal 8 25.81 Biomedicine 7 41.86
Technological development (Ec. Geo)
Total 55 Other 20 31.53 IT 18 21.11 Metal 8 22.00 Biomedicine 7 34.93
Supporting industries (Diamond)
Total 53 Other 22 32.16 IT 18 19.81 Metal 8 27.44 Biomedicine 7 36.64
Customer/ supplier relations through common technology (Macro)
Total 55 Other 22 31.59 IT 16 21.63 Metal 8 19.94 Biomedicine 7 21.81
Learning through innovative milieu (Ec. Geo)
Total 50 Other 21 29.81 IT 18 18.69 Metal 8 34.81 Biomedicine 7 34.86
Economies of scale (Micro)
Total 54 Other 21 33.67 IT 17 18.68 Metal 7 20.57 Biomedicine 7 29.93
Stability (S. Sc)
Total 52 Other 22 30.73 IT 17 19.06 Metal 8 33.31 Biomedicine 7 31.21
Logistics (Micro)
Total 54
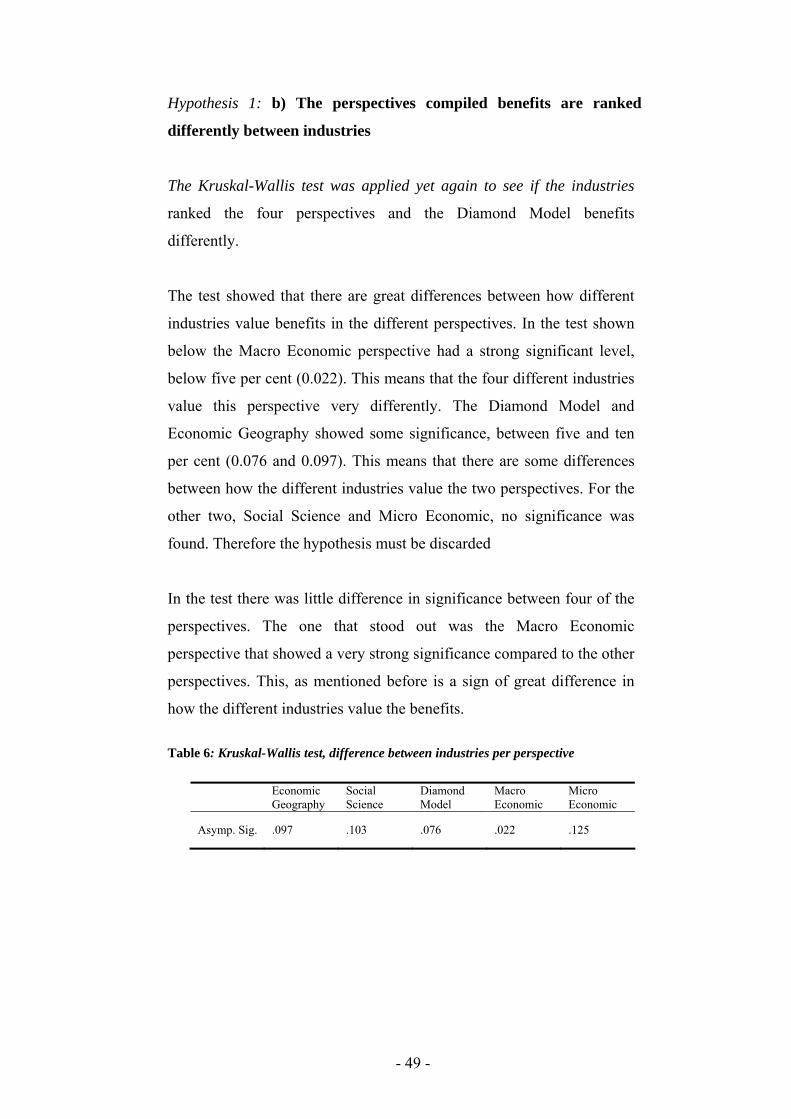
- 49 -
Hypothesis 1: b) The perspectives compiled benefits are ranked
differently between industries
The Kruskal-Wallis test was applied yet again to see if the industries
ranked the four perspectives and the Diamond Model benefits
differently.
The test showed that there are great differences between how different
industries value benefits in the different perspectives. In the test shown
below the Macro Economic perspective had a strong significant level,
below five per cent (0.022). This means that the four different industries
value this perspective very differently. The Diamond Model and
Economic Geography showed some significance, between five and ten
per cent (0.076 and 0.097). This means that there are some differences
between how the different industries value the two perspectives. For the
other two, Social Science and Micro Economic, no significance was
found. Therefore the hypothesis must be discarded
In the test there was little difference in significance between four of the
perspectives. The one that stood out was the Macro Economic
perspective that showed a very strong significance compared to the other
perspectives. This, as mentioned before is a sign of great difference in
how the different industries value the benefits.
Table 6: Kruskal-Wallis test, difference between industries per perspective
Economic Geography
Social Science
Diamond Model
Macro Economic
Micro Economic
Asymp. Sig. .097 .103 .076 .022 .125

- 50 -
In this table below, a presentation of which industry ranked the different
perspectives the highest is shown. The industry with the highest mean
rank consequently ranked it the highest (Table 7). For example, in the
perspective Economic Geographic the industry of Biomedicine had the
highest mean rank.
Table 7: Kruskal-Wallis test, highest ranking industry per perspective
Industries N Mean Rank Other 22 26.84 IT 15 21.40 Metal 8 24.56 Biomedicine 7 38.57
Economic Geographic
Total 52 Other 18 31.33 IT 17 20.18 Metal 7 20.50 Biomedicine 7 24.93
Social Science
Total 49 Other 17 30.06 IT 18 20.75 Metal 8 19.69 Biomedicine 7 33.29
Diamond Model
Total 50
Other 21 32.02 IT 17 18.26 Metal 7 23.00 Biomedicine 7 33.43
Macro Economic
Total 52 Other 18 28.69 IT 17 18.41 Metal 8 26.88 Biomedicine 6 30.08
Micro Economic
Total 49

- 51 -
5.4 Critique
When conducting an analysis, as many answers as possible from the
questionnaire, is of course beneficial to the survey. The questionnaire for
this thesis was answered by 72 respondents. With a higher response rate,
and thereby a higher sample, the analysis would be easier to generalize.
As mentioned in the empirical findings, the standard deviation used for
comparing means per perspective is a mean standard deviation. Due to
that the different perspectives inhibit various numbers of benefits,
analyzing them has its flaws.
The sample collected from the questionnaire presented some indications
that some questions should have been created differently. For instance,
when choosing the industry ‘other’ in the questionnaire, the respondents
should have been able to fill in the industry they belong to in an open
field. This way, a more profound analysis of differences in benefits
between industries could be made.
5.5 Conclusions
The first hypothesis showed that the SMITH contained benefits that are
ranked higher than the lowest ranked benefit of the Diamond model, and
even benefits that are ranked higher than the highest ranked benefit of
the Diamond model. The seven benefits ranked higher than the highest
benefit from the Diamond Model are:
1. Knowledge spillovers (Macro) 2. Knowledge flows (Macro) 3. Knowledge transfers (S. Sc) 4. Technological development (Ec. Geo) 5. Enhanced B2B interaction (Micro) 6. Networks (S. Sc) 7. Cooperation (Macro)
The majority of the seven top ranked benefits involve either social
relations (3, 5, 6, 7) or the knowledge exchange (1, 2), intentional or
unintentional, between companies. Only Technological development (4)
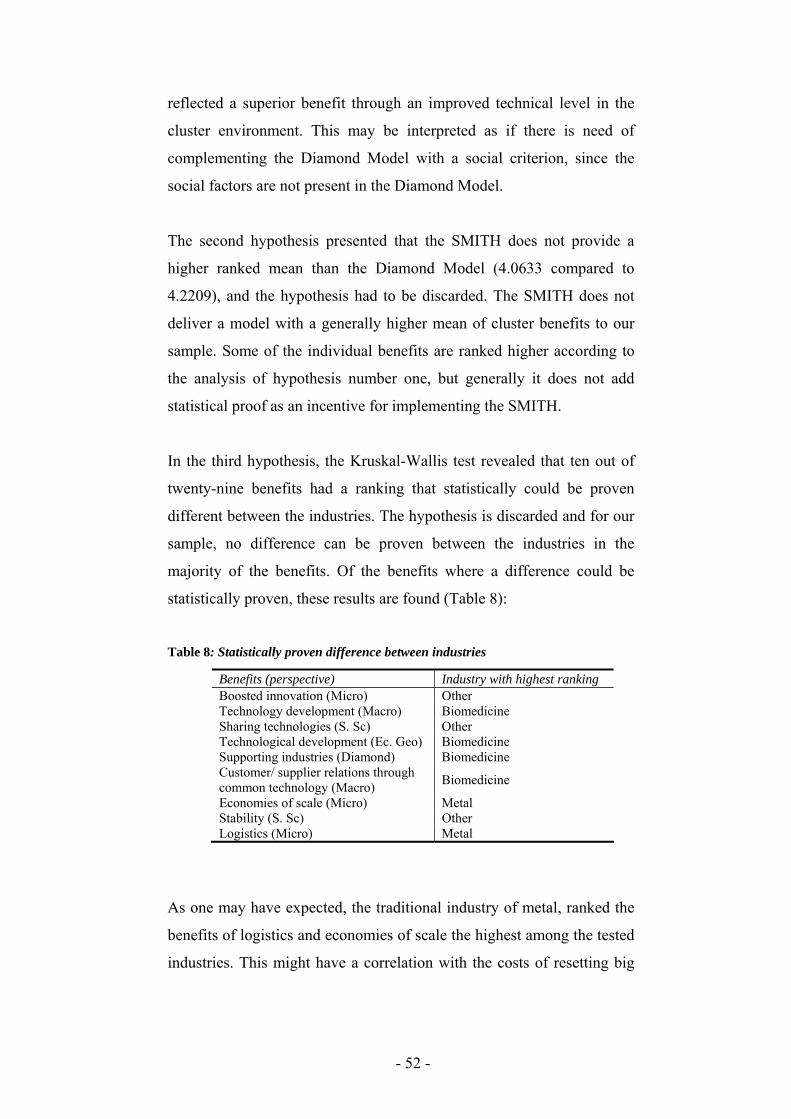
- 52 -
reflected a superior benefit through an improved technical level in the
cluster environment. This may be interpreted as if there is need of
complementing the Diamond Model with a social criterion, since the
social factors are not present in the Diamond Model.
The second hypothesis presented that the SMITH does not provide a
higher ranked mean than the Diamond Model (4.0633 compared to
4.2209), and the hypothesis had to be discarded. The SMITH does not
deliver a model with a generally higher mean of cluster benefits to our
sample. Some of the individual benefits are ranked higher according to
the analysis of hypothesis number one, but generally it does not add
statistical proof as an incentive for implementing the SMITH.
In the third hypothesis, the Kruskal-Wallis test revealed that ten out of
twenty-nine benefits had a ranking that statistically could be proven
different between the industries. The hypothesis is discarded and for our
sample, no difference can be proven between the industries in the
majority of the benefits. Of the benefits where a difference could be
statistically proven, these results are found (Table 8):
Table 8: Statistically proven difference between industries
As one may have expected, the traditional industry of metal, ranked the
benefits of logistics and economies of scale the highest among the tested
industries. This might have a correlation with the costs of resetting big
Benefits (perspective) Industry with highest ranking Boosted innovation (Micro) Other Technology development (Macro) Biomedicine Sharing technologies (S. Sc) Other Technological development (Ec. Geo) Biomedicine Supporting industries (Diamond) Biomedicine Customer/ supplier relations through common technology (Macro) Biomedicine
Economies of scale (Micro) Metal Stability (S. Sc) Other Logistics (Micro) Metal

- 53 -
machines to different product lines and the cost of transporting heavy
goods.
The biomedicine industry ranked the technological benefits the highest
along with the benefit of supporting industries, which can be seen from a
technological perspective as well in terms of receiving technologically
advanced input. Unfortunately, no further information is available in the
empirical material regarding what industries are present in the “other”
category. This prevents a further analysis of which industries ranked
boosted innovation, sharing technologies and stability the highest.
From the hypothesis 3b the Kruskal-Wallis test showed that there is a
strong significance in how the industries value different benefits within
the Macro Economic perspective (0.22). For the Diamond Model and
Economic Geography some significance was shown (0.076 and 0.097).
For the other two, Social Science and Micro Economic, no significance
was found. The hypothesis is therefore discarded, even tough there were
strong statistically differences in some cases.
When looking at the analysis for the first hypothesis, a high ranking of
the benefits related to social factors becomes evident. The social
scientific perspective did not produce a high mean compared to the other
perspectives, but if the market oriented benefits are removed and the
social benefits from the other perspectives are added, the following
highly ranked benefits appear (Table 9):

- 54 -
Table 9: Socially related benefits
Benefits Average ranking
Trust (S. Sc)
Networks (S. Sc)
Enhanced B2B communication (Micro)
Knowledge Spillovers (Macro)
Knowledge flows (Macro)
Cooperation (Macro)
Social and cultural factors (Ec. Geo)
Knowledge transfers (S. Sc)
4.33
4.83
4.79
4.56
4.65
4.75
4.25
4.60
Knowledge flows and spillovers are included as social factors, hence
knowledge is transferred through relational bonds between companies
irrespective if it is intentional or not.
Table 10: Mean rank of socially related benefits
The high mean ranking of this group (table 10) of benefits is
considerably higher than the Diamond Model’s mean ranking (4.60
compared to 4.22). All these competitive benefits can best be sieved in
an environment of positive social bonds. This leads to the creation of a
new group of benefits for the Diamond Model not previously taken in
consideration, in order to achieve the highest competitive advantage
possible. The benefits are gathered in a group designated Positive Social
Atmosphere (Fig. 7):
N Minimum Maximum Mean Std. Deviation
Socially rel. benefits
8 4.25 4.83 4.5950 .21071
Valid N 8

- 55 -
Factor endowments
Demand conditions
Related and supporting Industries
Chance Government
Firm strategy, structure, and
rivalry
Positive Social Atmosphere
Figure 7: The Diamond model with the positive social atmosphere amendment
This positive social atmosphere contains the benefits that considerably
outranked most of the benefits considered in this thesis, and they are all
important to implement, in order to achieve the highest competitive
advantage for the cluster region. This amendment would contain the
previously mentioned benefits, which, from a Macro Economic
perspective, would create a new criterion for the Diamond Model, for a
better adaptation to the dynamic business world of today.
The differences between the industries affect the applicability of a few
of the included benefits, but for the highest ranked benefits of the
socially related benefits, no difference between industries could be
statistically proven, which implies the general applicability of the
amendment.

- 56 -
6. Thesis conclusions
This chapter concludes the thesis. A discussion of our findings, the
practical relevance of the thesis, some well-needed self-criticism and
suggestions of future research finalizes the work.
6.1 Discussion
Our findings presented implications of the need of an amendment to the Diamond
Model, designated Positive Social Atmosphere. According to our research, it
contains benefits which are very important in order to achieve the highest
competitive advantage possible for companies, and consequently for the cluster.
The overall better detailed description of criteria needed for a successful cluster,
generates a better picture for policy-makers when trying to find competitive edges
in the globalized economy of the world.
6.2 Practical relevance
The findings of this thesis could be useful for many actors in the cluster
environment. Cluster initiators like local policy-makers can further
improve their knowledge of cluster environments and what the
experienced competitive benefits are regarded among the companies
situated in a cluster. Factors that are hard to measure and display in
numbers, like social relations, can be obtained from the findings of this
thesis and implemented when marketing a cluster.
The survey showed a high ranking of the social connections between
companies in the clusters, and these benefits are hard to obtain awareness
of, just from figures provided by the cluster companies.
- 57 -
6.3 Self criticism
A positive attitude regarding the time limit turned out to be a major
disadvantage for the authors, and efforts to try to obtain a more evenly
distributed population, in terms of industries, would probably have helped
to show results of higher validity. Feedback from the respondents
provided information of how the design of the questionnaire could have
been better. The authors concur. A more profound knowledge of SPSS
(the statistical software used) would have saved critical hours when
compiling the results of the empirics.
6.4 Future research questions
In an article in the Economical Development Journal, fall 2006, PhD
Steven W. Popper and PhD Athar Osama discuss how to improve the
quality of policy advice in the creation of clusters. Ever since the Silicon
Valley success, leaders around the world have tried to create economic
clusters in an attempt to replicate the Silicon Valley phenomenon in their
own regions and cities (Osama & Popper, 2006). It is important to
improve the “quality and relevance of research and analysis from which
the policy advice is ultimately derived”, hence, Popper and Osama
highlight some points that are important when analysing clusters in order
to successfully establish competitive and productive regions.
Governments and various public actors play an important role in this
process. Arguments for cluster policy must be established with regards to
development of clusters. In most cases today, unfortunately, these are
often vaguely formulated and this results in low stimulation of new
cluster build ups (ibid.). A future profound research might provide an
answer to how competitive clusters can be created, by learning from other
clusters, but adapted to the new prerequisites of the current environment.
The empirics collected in this thesis contain information regarding more
than just what industry the company belongs to. If these figures are
analyzed, they may reveal interesting information regarding the
correlation between different company variables and the different

- 58 -
benefits. For example turnover, number of employees, company age et
cetera.
- 59 -
References
Articles Bekele, W.G. & Jackson, W.R. (2006). ‘Theoretical Perspectives on
Industry Clusters’ [online] (cited 28 September 2007) Available
from <URL:http://www.rri.wvu.edu/pdffiles/bekelewp2006-5.pdf>
Burger, M., van der Knaap, B. & van Oort, F. (2007). ’A Treatise on the
Scale-Dependency of Agglomeration Externalities and the
Modifiable Areal Unit Problem’ [online] (cited 4 October 2007)
Available from <URL:http://www.mjburger.net/
Agglomeration_MAUP.pdf>
Callegati, E. & Grandi, S. (2005) ‘CLUSTER DYNAMICS AND
INNOVATION IN SMEs:THE ROLE OF CULTURE’ [online]
(cited 1 October 2007) Available from
<URL:http://www.eblacenter.unito.it/WP/2005/3_WP_Ebla.pdf>
Colletis-Wahl, K., Corpataux, J., Crevoisier, O., Kebir, L., Pequeur, B. &
Peyrache-Gadeau, V. (2006). ‘The Territorial Economy: A General
Approach in order to Understand and Deal with Globalisation
[online] (cited 16 October 2007) Available from
<URL:http://www2.unine.ch/webdav/site/socio/shared/documents/
publications/workingpapers/wp_2006_01_e.pdf>
IMP Project Group. (1982). ‘International Marketing and Purchasing of
Industrial Goods: An Interaction Approach’ [online] (cited 16
October 2007) Available from <URL:http://www.impgroup.org/
uploads/books/InternationalMarketing.pdf>
Kuah, T. H. A. (2002). ‘Cluster theory and Practice: Advantages for the
Small Business Locating in a Vibrant Cluster’ [online] (cited 10
September 2007) pages 206-228, Available from
<URL:http://websrv.ewu.edu/groups/cbpacea/2002FallArticles/clus
tertheoryandpractice-advantagesforthesmallbusinesslocatingina
vibrantcluster.pdf >
- 60 -
Lindqvist, G., Malmberg, A. & Sölvell, Ö. (2002). ’ Svenska
klusterkartor: En statistisk inventering av kluster i Sverige 2002 ’
[online] (cited 2 October 2007] Available from <URL: http://www.
clusterobservatory.eu/upload/Svenska_klusterkartor.pdf>
Martin, R. & Sunley, P. (2003). ‘Deconstructing clusters: chaotic concept
or policy panacea?’ Journal of Economic Geography 3: Oxford
University Press.
Maskell, P. & Kebir, L. (2005) ’What Qualifies as a Cluster Theory?’
[online] (cited 25 September 2007) Available from
<URL:http://www.druid.dk/wp/pdf_files/05-09.pdf>
Mayer, H. (2003). ‘A guide for analyzing industry clusters in the Portland
– Vancouver Metropolitan Region’ [online] (cited 25 October
2007) Available from <URL: www.pdx.edu/media/i/m/
ims_neoclustermonitor.pdf>
Osama, A. & Popper, W. S. (2006) ‘Creating Economic Clusters; The
Policy Challenge’ [online] (cited 28 September 2007) Available
from <URL:http://www.angletechnologyus.com/inthenews/
ED_Journal_Article.pdf >
Sölvel, Ö. (2000) ‘Sveriges Framtid – behovet av ökad klusterdynamik
och förstärkta omvärldslänkar’ [Online] (cited 2 October
2007) Available from <URL:http://www.clusterobservatory. eu/
upload/stattreport.pdf>
Tikkanen, H. (1998) ‘The network approach in analyzing international
marketing and purchasing operations: a case study of a European
SME’s focal net 1992-95’ [online] (cited 25 September 2007)
Available from <URL:http://www.emeraldinsight.com/Insight/
ViewContentServlet ?Filename=/published/emeraldfulltextarticle/
pdf/0800130202.pdf>

- 61 -
Books Cramer, D. (1994). ‘Introducing statistics for social research – step by
step calculations and computer techniques using SPSS’, London:
Routledge.
Easton, G. (1992). Industrial Networks: a review in Axelsson, B. &
Easton, G. (eds) ‘Industrial Networks: A new view of reality’.
London: Routledge. pp. 1-27.
Marshall, A. (1920). ‘Principle of economics’ (8th ed.) Repr. London:
Macmillan Press Ltd. (First edition published 1890)
Porter, M.E. (1998). ‘The competitive advantage of nations’ Repr. New
York: Free press. (First edition published 1990)
Saunders, M., Lewis, P. & Thornhill, A. (2007). ‘Research Methods for
Business Students’, (4th edn) Harlow: FT Prentice Hall.
Weber, A. (1929) Theory of the location of industries. Trans. Friedrich,
C. J. Chicago: University of Chicago Press.
Internet Aisner, J. (1999). ‘Porter’s perspective: Competing in the global
economy’ [online] (cited 25 September, 2007) Available from
<URL:http://hbswk.hbs.edu/item/3329.html>
Silverthorne, S. (2003). ‘New Cluster Mapping Project Helps Companies
Locate Facilities’ [online] (cited 25 September, 2007) Available
from <URL:http://hbswk.hbs.edu/item/3245.htm>

- 62 -
Appendices
[Appendix 1] Email (Swedish) Hej! Vi är tre studenter som läser sista året på civilekonomprogrammet vid Högskolan Kristianstad. Vår examensuppsats är inom företagsekonomi och undersöker olika fördelar i klustermiljöer. Er hjälp skulle vara av stor vikt för vår undersökning och därför ber vi om ca 10 minuter av Er tid att besvara vår webbenkät. Er medverkan är betydelsefull! Anledningen till att vi kontaktat just Ert företag och Er personligen är att vi behöver Er åsikt angående klustermiljöer. Er kontaktuppgift har vi hittat genom klassificerade klusterorganisationer på clusterobservatory.eu. För att nå enkäten klicka på länken nedanför. Länken leder till Kristianstad Högskolans interna webb nät. Vi ber er att fylla i vår enkät så fort som möjligt då undersökningen stänger på måndag den 19/11-2007 klockan 3. http://www.luvit.hkr.se/eval/pub/81072 Tack ännu en gång för din medverkan! Med vänliga hälsningar, Martin Persson, Adis Sabanovic och Henrik Wester

- 63 -
[Appendix 2] Email Hello! We are three students studying our senior year at Kristianstad University. We are conducting our bachelor thesis in business administration and are examining different benefits in cluster environments. Your participation is of great importance to us, and therefore we ask for ten minutes of your time to answer our web based questionnaire. The reason why we ask you (to participate as a representative for your company) is because we need your opinion concerning benefits in cluster environments. We have found your contact information at clusterobservatory.eu. To obtain the questionnaire, please click the link below. The Survey is located at Kristianstad University’s protected web space. We kindly ask you to fill in the questionnaire as soon as possible, as the survey closes Monday 07-19-11, at 15:00. http://www.luvit.hkr.se/eval/pub/81072 Thanks for your participation in our survey! Sincerely, Martin Persson, Adis Sabanovic and Henrik Wester

- 64 -
[Appendix 3] Email 2 (Swedish) Hej! Jag skickar här enligt vårt telefonsamtal länken till vår undersökning. Information om undersökningen finns mer utförligt beskrivet i webbenkäten. Klicka på länken här under för att komma till enkäten. http://www.luvit.hkr.se/eval/pub/81072 Tack för din medverkan. Den är viktig för vår undersökning! Med vänliga hälsningar, Martin Persson, Adis Sabanovic och Henrik Wester

- 65 -
[Appendix 4] Email 2 Hello! In accordance to our telephone conversation, I hereby send you the link to our survey. Further information regarding the survey is included in our web based questionnaire, which can be obtained from the link below. http://www.luvit.hkr.se/eval/pub/81072 Thank you for your participation, it is of great importance for our survey! Sincerely, Martin Persson, Adis Sabanovic and Henrik Wester

- 66 -
[Appendix 5] Benefits
This is the specific version of how the benefits are operationalized.
No. Benefit Operationalization
1 Knowledge spillovers
(Macro Economic)
The spillovers are valuables to the
surrounding companies that
occur from the development
taking place inside separate
companies. The statement
emphasizes that the spillovers are
contributed autonomously,
similar to a bonus for the
surrounding.
2 Knowledge flows
(Macro Economic)
These flows are stated to generate a
higher value because of the
proximity of the cluster, it is
therefore compared to if the
companies were geographically
scattered.
3 Knowledge transfers
(Social Science)
In comparison to statement number
one, these knowledge transfers
are deliberate to create value for
all parties, so this is emphasized
in the statement.
4 Pool for labor market
(Macro Economic)
This pool for labor market is
operationalized with the
utterance of “favorable supply of
labor” to emphasize a hefty
supply of human resources
attracted by the cluster.
5 Pool of specialized
Labour
Similar to statement number four but
with the amendment of the word

- 67 -
(Micro Economic) “specialized” to distinguish
between the macro- and Micro
Economic benefits.
6 Boosted innovation
(Micro Economic)
This benefit is operationalized by the
emphasis on external factors that
are stated to boost the
technological ability of a
company in a cluster, and with
competition as an example.
7 Technologic
development
(Macro Economic)
Statement is reflecting the benefit by
mentioning that the companies
around contributes to the
development of new technology.
8 Sharing technologies
(Social Science)
With emphasis on that companies
deliberately share technologies,
this statement shall reflect the
wish of companies to gain from
each others R&D.
9 Technological
development
(Economic Geographic)
The statement is pointing at the
general technological
development level in the cluster,
and if the respondents
experience an increase thanks to
the surrounding.
10 Supporting industries
(Micro Economic)
The increased chance of persuading
a supplier to realign the
production to a specialized
output in a cluster is intended to
be reflected with the mentioning
of proximity.
11 Reduced cost of
infrastructure
(Micro Economic)
To operationalize the stated
difference of being situated
within the cluster or outside in

- 68 -
terms of costs for infrastructure,
the term “…can be shared with
companies with similar
communication needs” shall
reflect the geographical
meaning.
12 Customer/ supplier
relations through
common technology
(Macro Economic)
Intends to reflect upon the positive
impact common systems have on
relations. It reduces market
failures, and the statement
clarifies this with a comparison
between cluster- and non-cluster
environments in terms of the use
of standards.
13 Enhanced interaction
B2B (Micro Economic)
Interaction is dependant on distance,
the comparison between the
geographically limited cluster
and the spread out companies
outside it highlights this.
14 Economies of scale
(Micro Economic)
The closeness to business partners
and the joint effort of putting the
geographical area as a target for
customers is highlighted to
facilitate the respondents
understanding of why economies
of scale occur in cluster
environments, if they recognize
it.
15 Scope
(Micro Economic)
The term “…adapt a cost efficient
scope, thanks to geographical
closeness” is used to see if
respondent experience a
facilitation with the cluster

- 69 -
environment when setting scope
on the production line.
16 Competition/Rivalry
(Micro Economic)
To highlight the positive aspect of
competition and to clarify that it
is that aspect we are examining,
the term “positive competition” is
utilized
17 Trust
(Social Science)
By distinguish between the trust
within the cluster and outside, we
wish to examine is there is a
higher degree of trust in the
cluster environment in general,
than outside.
18 Networks
(Social Science)
By distinguishing between the
respondents networking within
the cluster and outside, we wish
to examine if the networks are
stronger in the cluster
environment in general, than
outside.
19 Cooperation
(Macro Economic)
The Macro Economic stated benefit
of cooperation is reflected by a
simple comparison is the
respondents feel an enhanced
cooperation between themselves
and business partners in the
cluster, compared to the relations
they experience with business
partners outside the cluster.
20 Common strategies and
paths
(Macro Economic)
Strategies and paths are baked into
one word in statement,
designated only as “strategies”.
The addition of “…and/or goals”

- 70 -
is to clarify the diverse
opportunities of collaboration
between business partners.
21 Social and cultural
factors (Economic
Geographic)
What sounds more of a benefit from
the social scientific perspective is
emphasized by mentioning
within the cluster, which is the
current geographical area, and
thereby clarified to originate
from the economic geography
perspective.
22 Learning through
innovative milieu
(Economic Geographic)
The causality of that an innovative
milieu results in faster learning
is stated and the statement finally
adds “…in your cluster” to
examine if this is the case for the
respondent. The word “milieu” is
replaced with “environment” to
avoid misunderstandings.
23 Control
(Social Science)
Examples are used to clarify why a
cluster environment is to prefer,
according to theory, if control of
the product’s value chain is
desired
24 Stability
(Social Science)
The cluster environment is compared
to a scattered company
environment to see if
respondents can identify an
economic stability of being
located in a cluster.
25 Uncertainty reduction
(Social Science)
Operationalized through examples of
uncertainties, and the use of the
word proximity when reflecting

- 71 -
upon the benefits of having
customers and suppliers in the
vicinity.
26 Logistics
(Micro Economic)
The use of “Your cluster
environment facilitates logistical
solutions” plus examples and
that this results in shorter
geographical routes will
operationalize logistics.
27 Applied development,
standardization
(Macro Economic)
The statement operationalizes the
stated benefit by emphasizing
that standardized systems are
more common with business
partners within the cluster than
with a business partner outside
the cluster.
28 Lowers transactional
costs
(Social Science)
A number of transactional costs are
accounted for to ensure the
respondent of the wide range of
factors considered transactional
costs.
29 Access to resources
(Social Science)
The cluster offers contacts with other
companies and individuals who
may play a key part in the
acquisition of a relevant
resource. Therefore, the
mentioning of contacts is a
cornerstone of the statement.

- 72 -
[Appendix 6] Questionnaire (Swedish)
Denna enkäts syfte är att undersöka de företagsekonomiska fördelarna med
att ha närbesläktade företag (antingen företag från andra steg i
produktvärdekedjan eller företag som sysslar med liknande verksamhet) i
geografisk närhet, en så kallad klustermiljö.
Enkäten tar ca tio minuter att genomföra. Svaren kommer att hanteras
konfidentiellt och användas till en kandidatuppsats inom företagsekonomi.
Om ni har några frågor om enkäten så går det bra att kontakta Henrik
Wester på telefon 0704-33 94 44, eller skicka ett mail till
Tack för er medverkan!
Företagsnamn:
Bransch:
IT Kommunikation
Transport Produktionsteknik
Metall Bildhantering/publicering
Biomedicin Energi
Skog Underhållning
Medicin Hälsoteknik
Mat & Design Bygg / Byggmaterial Annat
Etableringsår för ert företag:
Etableringsort för företaget/ kontoret:
Verksamhetsort idag:
Etableringsår i närområdet:
Omsättning år 2006:
Antal årsanställda år 2006:
Respondentens befattning:
Jag vill få en länk skickad till mig så jag kan ta del av uppsatsen när den
publiceras i Januari. E-postadress:

- 73 -
NEDAN FÖLJER 29ST PÅSTÅENDEN SOM VI ÖNSKAR ATT NI FRÅN ERT FÖRETAGSPERSPEKTIV TAR STÄLLNING TILL OCH GRADERAR PÅ EN SKALA 1-7. 1 BETYDER INSTÄMMER EJ OCH 7 BETYDER INSTÄMMER HELT. EN DEL AV FRÅGORNA KAN TE SIG LIKARTADE MEN MÄTER OLIKA VARIABLER, SÅ VAR GOD LÄS FRÅGORNA NOGA. TACK FÖR ER MEDVERKAN!
1 2 3 4 5 6 7
1. Klustermiljön ni befinner er i gör
så att ert företag bidrar autonomt
till kunskapsutvecklingen hos
andra företag i klustret.
2. Det finns ett kunskapsflöde
mellan företag i klustret som
skapar högre värde för alla
parter, jämfört mot vad som
skulle förekomma om företagen
låg på olika geografiska platser.
3. Kunskap sprids medvetet mellan
företag i ert kluster för att skapa
en vinn/vinn situation bland
inblandade parter.
4. Er klustermiljö medför god
tillgång till arbetskraft.
5. Er klustermiljö medför god
tillgång till specialiserad
arbetskraft.
6. Er klustermiljö medför att
innovationsförmågan i ert
företag ökar, tack vare

- 74 -
utomstående faktorer i klustret
såsom konkurrens från liknande
företag.
7. Er klustermiljö med liknande
företag i närheten, bidrar till er
teknologiska utveckling.
8. Inom er klustermiljö delas
teknologiska kunskaper mellan
samarbetspartners i klustret.
9. Er klustermiljö innebär att den
teknologiska utvecklingen ökar
mer i området generellt, jämfört
om företagen låg geografiskt
isolerade från liknande
industrier.
10. Leverantörer inom klustret kan,
tack vare tryggheten med
närheten, förse er med
specialiserade varor och tjänster,
som utanför klustermiljön hade
varit svårare att tillgå, eller
förmå leverantörer att tillverka.
11. I er klustermiljö så kan
kostnaden för infrastruktur
minskas då det i en grupp är
lättare att ge beslutsfattande
myndigheter incitament att
investera i infrastruktur i

- 75 -
området, jämfört med om ni
befunnit er utanför klustermiljön.
12. Då användandet av
standardiserad teknologi och
system är vanligare i en
klustermiljö mellan
samarbetspartners, bidrar det till
att kund-/leverantörsrelationer
inom klustret blir starkare än
utanför en klustermiljö.
13. Dialog och samarbete mellan er
och affärspartners i klustret
underlättas, tack var miljön,
jämfört med samarbetspartners
utanför den.
14. Fördelar med storskalig
produktion uppnås lättare i er
klustermiljö, då det finns en
närhet till företag inom samma
bransch och kunder vet vart de
skall vända sig när de söker
specifika produkter.
15. Er klustermiljö ger möjlighet för
er att på ett kostnadseffektivt sätt
anpassa bredd och djup i ert
produktsortiment, då ni har en
närhet till kund i och med
klustret.

- 76 -
16. Rivaliteten mellan liknande
företag i klustret skapar en
positiv konkurrens på så sätt att
den driver er att ständigt
utvecklas och hitta nya
lösningar.
17. Tilltron mellan er och era
affärspartners i klustret är större
generellt än mellan er och era
affärspartners utanför klustret.
18. Klustermiljön erbjuder
möjligheter att med
medaffärspartners skapa nätverk
som generellt är stakare än
nätverket till företag utanför
klustret.
19. Er klustermiljö leder till ökat
samarbete mellan er och era
affärspartners, jämfört om ni låg
geografiskt spridda från
varandra.
20. Den klustermiljö ni befinner er i,
bidrar till att ni kan utveckla
gemensamma strategier och/eller
mål med affärspartners inom
klustret.
21. Det har skapats en gemensam
kulturell och social miljö i
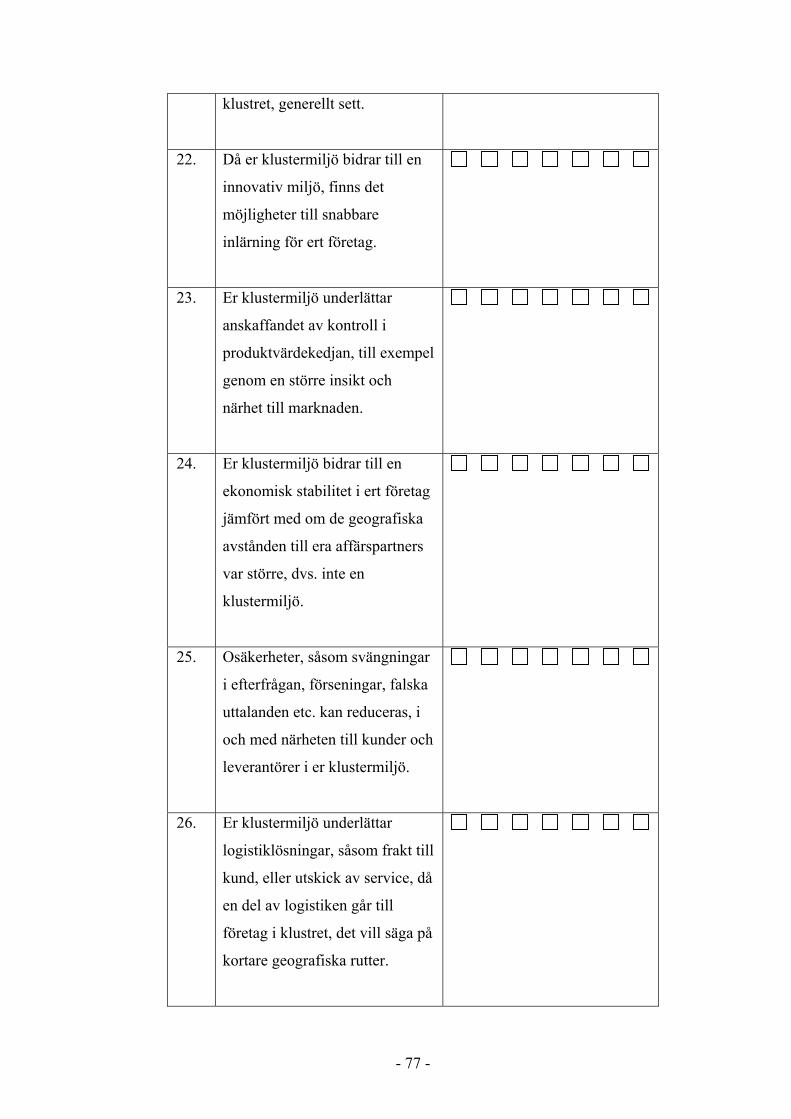
- 77 -
klustret, generellt sett.
22. Då er klustermiljö bidrar till en
innovativ miljö, finns det
möjligheter till snabbare
inlärning för ert företag.
23. Er klustermiljö underlättar
anskaffandet av kontroll i
produktvärdekedjan, till exempel
genom en större insikt och
närhet till marknaden.
24. Er klustermiljö bidrar till en
ekonomisk stabilitet i ert företag
jämfört med om de geografiska
avstånden till era affärspartners
var större, dvs. inte en
klustermiljö.
25. Osäkerheter, såsom svängningar
i efterfrågan, förseningar, falska
uttalanden etc. kan reduceras, i
och med närheten till kunder och
leverantörer i er klustermiljö.
26. Er klustermiljö underlättar
logistiklösningar, såsom frakt till
kund, eller utskick av service, då
en del av logistiken går till
företag i klustret, det vill säga på
kortare geografiska rutter.

- 78 -
27. En högre användning av
standardiserade system och
produkter mellan ert företag och
era affärspartners sker i
klustermiljön, jämfört mellan er
och era affärspartners utanför
klustret.
28. Er klustermiljö sänker
transaktionskostnader, såsom
kostnader för förseningar,
inventeringar, kundkontakter,
marknadsföring, resor, etc., då
de geografiska avstånden till
affärspartners i klustret är
avsevärt mindre.
29. Er klustermiljö underlättar
tillgången till resurser som är
relevanta till er
företagsverksamhet.

- 79 -
[Appendix 7] Questionnaire
This is the questionnaire translated from Swedish into English:
1. Your cluster environment results in your company’s autonomous contribution to the development of knowledge in the other companies of the cluster. 2. There is a flow of knowledge among the companies in the cluster,
which generates a higher value compared to if the companies were situated
in geographically scattered locations.
3. Knowledge is deliberately spread among companies in your cluster
environment to create a win/win situation for all concerned parties.
4. Your cluster environment results in a favourable supply of labour
5. Your cluster environment results in a favourable supply of specialized
labour
6. Your cluster environment results in an increase of your company’s
innovation ability, thanks to external factors of the cluster, for example
competition.
7. Your cluster environment with related companies around, contributes
to the technological development of your company.
8. Technological knowledge is shared in your cluster environment
between business partners.
9. Your cluster environment contributes to a higher momentum in the
technological development of the area in general; compared to if the
companies were to be geographically isolated from similar industries.

- 80 -
10. Suppliers within the cluster can provide you with specialized input,
thanks to the proximity, which outside the cluster would be hard to obtain,
or persuade suppliers to manufacture.
11. The cost of infrastructure can be reduced thanks to your cluster
environment, since incentives to policy-makers are easier to provide in a
group, compared to if you were to be located outside the cluster
environment.
12. Since the use of standardized technologies and systems is more
common in a cluster environment between business partners compared to
outside a cluster, customer-supplier relations grow stronger here.
13. Business to business interaction within the cluster is facilitated, thanks
to the environment, compared to interaction with business partners outside
it.
14. Economies of scale are more easily obtained in your cluster
environment, since there is closeness to similar companies, and customers
know where to go in search for specific products.
15. Your cluster environment gives you an opportunity to adapt a cost
efficient scope, thanks to the geographical closeness to your customers in
the cluster.
16. The rivalry between similar companies in the cluster creates a positive
competition which impels you to constantly develop and find new solutions.
17. The trust between your company and your business partners is
generally higher, than the trust between you and your business partners
outside the cluster

- 81 -
18. Your cluster environment offers opportunities to form networks with
other companies that are stronger in general, than your network of
companies outside the cluster.
19. Your cluster environment leads to an enhanced cooperation with your
business partners, compared to if you were geographically scattered.
20. Your cluster environment contributes to the possibility to develop
common strategies and/or goals with your business partners in the cluster
21. A joint cultural and social environment has been formed in the cluster,
if seen in general.
22. There are opportunities of faster learning in an innovative environment
for your company in your cluster.
23. Er klustermiljö underlättar anskaffandet av kontroll i
produktvärdekedjan, till exempel genom en större insikt och närhet till
marknaden.
24. Your cluster environment contributes to an economic stability for your
company, compared to if the geographical distances were greater, videlicet a
non-cluster environment.
25. Uncertainties, such as swings in demand, delays, false statements et
cetera, can be reduced thanks to the proximity to customers and suppliers in
your cluster environment.
26. Your cluster environment facilitates logistical solutions, such as freight
or the sending of service, since some of the logistics are planned to
companies in the cluster, videlicet shorter geographical routes.

- 82 -
27. Your company uses standardized systems and products with your
business partners inside the cluster to a higher degree, than with your
business partners outside the cluster.
28. Your cluster environment lowers transactional costs, such as costs of
delays, inventory, customer relations, marketing, travel et cetera, since the
geographical distances to business partners in the cluster are considerably
reduced.
29. Your cluster environment facilitates the access to resources, relevant to
your business, by facilitating the acquisition of contacts.
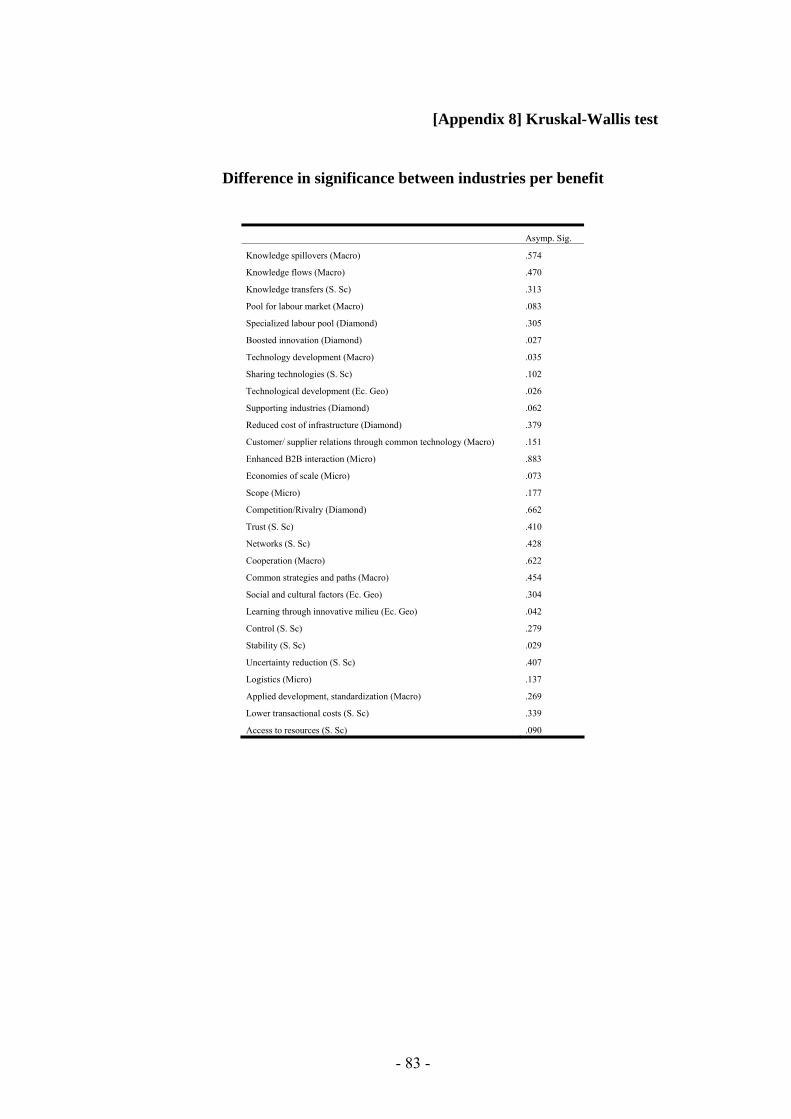
- 83 -
[Appendix 8] Kruskal-Wallis test
Difference in significance between industries per benefit
Asymp. Sig.
Knowledge spillovers (Macro) .574
Knowledge flows (Macro) .470
Knowledge transfers (S. Sc) .313
Pool for labour market (Macro) .083
Specialized labour pool (Diamond) .305
Boosted innovation (Diamond) .027
Technology development (Macro) .035
Sharing technologies (S. Sc) .102
Technological development (Ec. Geo) .026
Supporting industries (Diamond) .062
Reduced cost of infrastructure (Diamond) .379
Customer/ supplier relations through common technology (Macro) .151
Enhanced B2B interaction (Micro) .883
Economies of scale (Micro) .073
Scope (Micro) .177
Competition/Rivalry (Diamond) .662
Trust (S. Sc) .410
Networks (S. Sc) .428
Cooperation (Macro) .622
Common strategies and paths (Macro) .454
Social and cultural factors (Ec. Geo) .304
Learning through innovative milieu (Ec. Geo) .042
Control (S. Sc) .279
Stability (S. Sc) .029
Uncertainty reduction (S. Sc) .407
Logistics (Micro) .137
Applied development, standardization (Macro) .269
Lower transactional costs (S. Sc) .339
Access to resources (S. Sc) .090
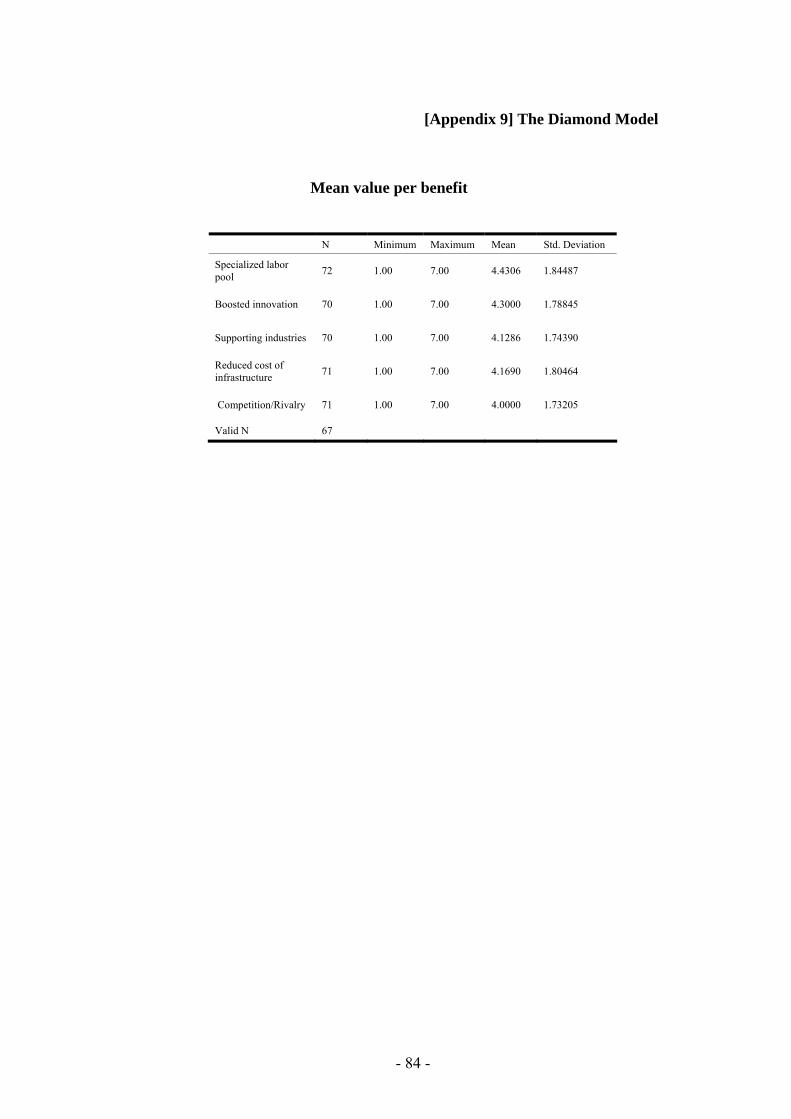
- 84 -
[Appendix 9] The Diamond Model
Mean value per benefit
N Minimum Maximum Mean Std. Deviation
Specialized labor pool 72 1.00 7.00 4.4306 1.84487
Boosted innovation 70 1.00 7.00 4.3000 1.78845
Supporting industries 70 1.00 7.00 4.1286 1.74390
Reduced cost of infrastructure 71 1.00 7.00 4.1690 1.80464
Competition/Rivalry 71 1.00 7.00 4.0000 1.73205
Valid N 67

- 85 -
[Appendix 10] The four perspectives
Mean value per benefit
N Minimum Maximum Mean Std.
Deviation Knowledge spillovers (Macro)
72 1.00 7.00 4.5556 1.53723
Knowledge flows (Macro) 72 1.00 7.00 4.6528 1.49327
Knowledge transfers (S. Sc) 72 1.00 7.00 4.5972 1.57140
Pool for labor market (Macro) 72 1.00 7.00 4.2639 1.69501
Technology development (Macro) 71 1.00 7.00 4.0141 1.55373
Sharing technologies (S. Sc) 71 1.00 7.00 3.8592 1.57929
Technological development (Ec. Geo) 72 1.00 7.00 4.9028 1.57587
Customer/ supplier relations through common technology (Macro)
72 1.00 7.00 4.1111 1.75672
Enhanced B2B interaction (Micro) 72 1.00 7.00 4.7917 1.57388
Economies of scale (Micro) 71 1.00 7.00 4.3380 1.77236
Scope (Micro) 68 1.00 7.00 3.7794 1.84347
Trust S.Sc) 72 1.00 7.00 4.3333 1.53824
Networks (S. Sc) 72 1.00 7.00 4.8333 1.66995
Cooperation (Macro) 72 1.00 7.00 4.7500 1.79004
Common strategies and paths (Macro)
72 1.00 7.00 3.9861 1.74011
Social and cultural factors (Ec. Geo)
71 1.00 7.00 4.2394 1.55347
Learning through innovative milieu (Ec. Geo)
70 1.00 7.00 4.2857 1.60744
Control (S. Sc) 72 1.00 7.00 3.6111 1.76472
Stability (S. Sc) 68 1.00 7.00 3.0882 1.51347
Uncertainty reduction (S. Sc) 70 1.00 7.00 3.2571 1.62129
Logistics (Micro) 71 1.00 7.00 3.4507 1.93309
Applied development, standardization (Macro) 69 1.00 7.00 3.0290 1.62672
Lower transactional costs (S. Sc) 71 1.00 7.00 3.4225 1.86442
Access to resources (S. Sc) 71 1.00 7.00 4.3099 1.65263
Valid N 57