is clean diesel an oxymoron? - clean air...
TRANSCRIPT

Is Clean Diesel an Oxymoron?
H. Christopher [email protected]
Department of Civil, Construction, and Environmental Engineering
North Carolina State UniversityRaleigh, NC 27695
NC BREATHE ConferenceApril 8, 2016Charlotte, NC

Topics• Diesel Engines• Emission Standards• Emissions and Air
Quality Trends• Technologies• Real-World Emissions
– On-Road – Non-Road
2

Diesel Engines
• Compression Ignited• High pressure ratio• Higher thermal efficiency than gasoline engines• Excess air• Relatively low emissions of products of incomplete
combustion:– Carbon monoxide– Hydrocarbons
• Relatively high engine-out emissions of nitrogen oxides (NOx):
– Nitric oxide (NO)– Nitrogen dioxide (NO2)
• Relatively high engine-out particulate matter (PM) emissions

Vehicles in the U.S.
• Highway (2013) Total: 255,876,822Light Duty: 236,010,230*Motorcycle 8,404,687Truck – single 8,126,007Truck – combo 2,471,349Bus 864,549
• Non-Road Freight Loco. 25,033Amtrak Loco. 418Construction (examples)
Excavators: 109,000Rubber tire loaders 133,000Backhoes 323,000
*3.1% of the light duty vehicle fleet is diesel

U.S. Heavy Duty Vehicle NOx and PM Emission Standards: 1998 - present

Emission Standards for Diesel Vehicles
• Light Duty: Same as for Gasoline Vehicles• Heavy Duty On-Road (typical approaches)
–Tier 1: Engine design–Tier 2: Exhaust Gas Recirculation (EGR)–Tier 3: EGR, Diesel Oxidation Catalyst (DOC)
+ Diesel Particulate Filter (DPF)–Tier 4: EGR + Selective Catalytic Reduction,
DOC + DPF• Diesel Non-Road
–Similar strategy, standards differ by engine size

Exhaust Gas Recirculation
Exhaust gas lowers the peak flame temperature, thereby reducing the rate of NOx production.

Truck Emission Controls Required Under “Tier 4” Standards: Diesel Particulate Filters

Diesel Particle Filter Regeneration
• Passive regeneration»Catalyze oxidation of carbon»Catalyze oxidation of NO to NO2, followed by
NO2 oxidation of carbon »Requires sufficiently high exhaust temperature
• Active regeneration–Heat the DPF with an external energy source
»Unburned fuel from engine»Fuel injected into exhaust gas»Electric heating

Heavy Duty Vehicle NOx Control

Fuel Quality Regulations

U.S. National Emission Inventory: Nitrogen Oxides
0
5,000
10,000
15,000
20,000
25,000
30,00020
0220
03
2004
2005
2006
2007
2008
2009
2010
2011
2012
2013
2014
Annu
al T
ons
NO
x
Year
Highway VehiclesNon-Road VehiclesElectric UtilitiesIndustrial CombustionOther

U.S. National Emission Inventory: Primary PM2.5
0
500
1,000
1,500
2,000
2002
2003
2004
2005
2006
2007
2008
2009
2010
2011
2012
2013
2014
Annu
al T
ons
PM2.
5
Year
Highway VehiclesNon-Road VehiclesElectric UtilitiesIndustrial CombustionOther

U.S. National Air Quality Trends: Nitrogen Dioxide

U.S. National Air Quality Trends: Ozone

U.S. National Air Quality Trends: PM2.5

Proposed Heavy Duty Vehicle Fuel Economy Standard
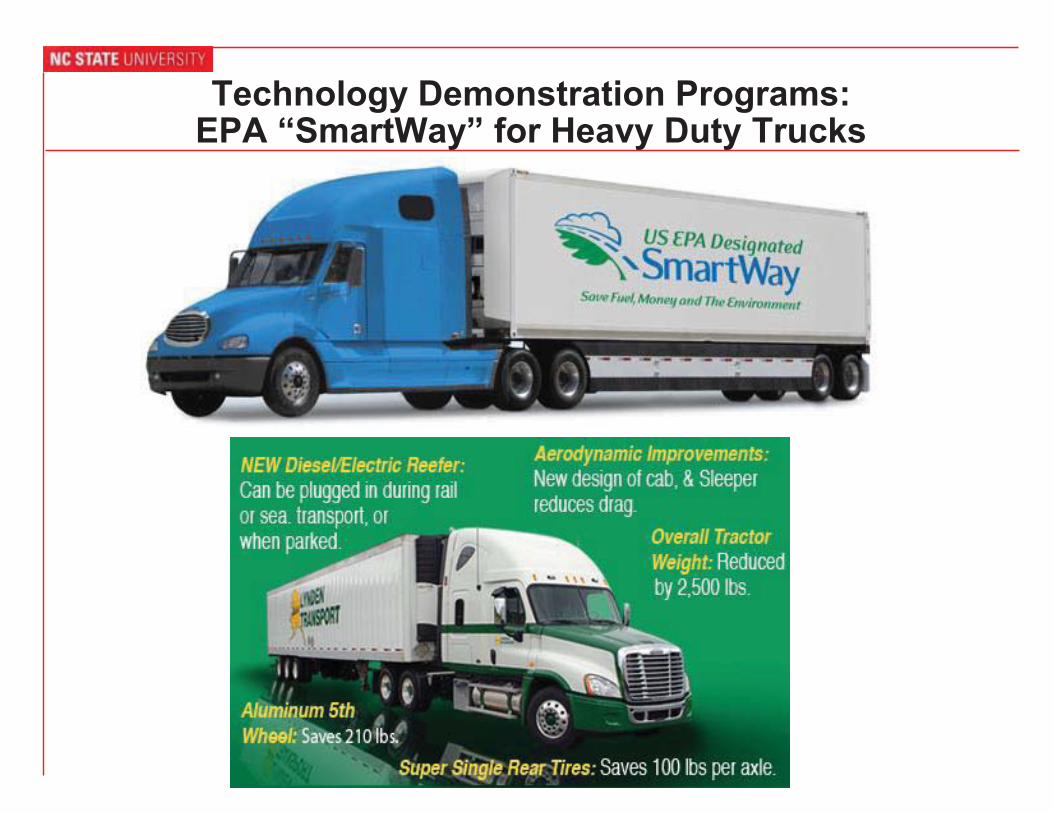
Technology Demonstration Programs:EPA “SmartWay” for Heavy Duty Trucks

Examples of Real-World Field Studies to Evaluate Diesel Emissions
• Reducing extended idling emissions• Evaluation of in-use effectiveness of emission
controls–Combination trucks–Vocational trucks (e.g., refuse trucks)–Nonroad construction equipment
• Biodiesel• Engine rebuild• Operator behavior

Long-Haul Sleeper Cab Trucks in the US• Approximately 680,000
long-haul sleeper cab trucks
• Rest stops required by Federal Hours of Service (HOS) regulations
• Base engine idling to provide “hotel” services
• Long-haul truck idle hours are estimated to range from 1,460 to 1,800 hours annually
Source: Volvo Trucks North America http://www.volvo.com/trucks/na/en-us
• Freight truck idling is estimated to consume 7% of freight truck fuel

Auxiliary Power Units
• Auxiliary power units (APUs) :
– Small diesel engine-generator
– Power for electrical air conditioning, heating, and auxiliary loads
Source: Mechron Power Systems http://www.ccslightning.com/

Study Methodology10 Fleet-A Trucks
With APU-A With APU-B
Data Acquisition System
10 Fleet-B Trucks
With APU-A With APU-B
Average In-service time: 11,300 hours (as of 2/29/07)
Average In-service time: 8,500 hours (as of 2/29/07)

Combined Multi-Monthly Route Map for 20 Field Trucks

0
50
100
150
200
250
300
1 2 3 4 5 6 7 8 9 10 11 12 13 14 15 16 17 18 19 20
Truck Number
Annu
aliz
ed N
O E
mis
sion
(kg/
yr)
.
Base Engine Scenario Actual Scenario
NOx Emissions During Stops
Fleet A
Fleet B
Avoided NO emissions:For Fleet A: (Average: 48%; Range: 16-77%)For Fleet B: (Average: 12%; Range: 0.5-45%) Through 2/29/2008

25
InstrumentationTest Truck
Exhaust Sampling Probes
PEMS
PEMS Connections

26
Measured Trucks
a 2010 model year Truck 0121 is Mack. All other trucks are International.b DOC = Diesel Oxidation Catalyst; DPF = Diesel Particulate Filter;
EGR = Exhaust Gas Recirculation; SCR = Selective Catalytic Reduction
Trucka YearOdom. (miles)
ChassisModel
EngineDisp.(L)
EngineModel
HP Emissions Controlb
5715 1999 303,744 2574 6X4 10.8 ISM-370 370 -
6415 2005 235,202 9400I 6X4 15.0 ISX-500 500 EGR
6667 2007 61,008 9200I 15.0 ISX-500 500 EGR, DOC, DPF
0009 2009 72,831 9200I 15.0 ISX-500 500 EGR, DOC, DPF
0121 2010 29,229 CHU613 12.8MP8-445C
445 EGR, DOC, DPF, SCR

27
Routes forDelivery of Highway Maintenance Supplies
N. WILKESBORO
CASTLE HAYNE
CLINTON
4
BURGAW
RALEIGH
1GREENSBORO HERTFORD
MANNS HARBOR3
SELMA
WILSON
5
#
WINSTON-SALEM
Route ID Number
NORTH CAROLINA
1,2

28
0
20
40
60
80
100
120
5715 6415 6667 0009 0121
NO
x(g
/gal
)
Truck Number
HighwayArterial
Comparison of Trucks: Fuel-Based NO Emission Rates
1999 2005 2007 2009 2010
Fuel-Based Emission Rates Similar Between “Bounding” Cycles

29
0
0.1
0.2
0.3
0.4
0.5
0.6
5715 6415 6667 0009 0121
PM "
Opa
city
" (g
/gal
)
Truck Number
HighwayArterial
Comparison of Technologies: PM
PM is estimated using laser light scattering. These results are not intended as accurate emission rates, but rather to indicate relative differences.
1999 2005 2007 2009 2010

Types of Measured Refuse Trucks
Front-Loader: Diesel (6) Roll-Off: Diesel (6)
Side-Loader: Diesel (6)Side-Loader: CNG (3)
Front-Loader: CNG (3)

Instrumentation
Portable Emissions Meas. Sys. (PEMS)
Engine Control Unit (ECU) Readout
Exhaust Probes
GPS units

Route of Roll-off 3
170 miles7 cans
52 tons

Selective Catalytic Reduction Effectiveness
• The two Roll-Off Trucks with SCR had cycle average NO emission rates 87 percent lower than that of the four Roll-Off Trucks without SCR.
• The one Side-Loader Truck with SCR had cycle average NO emission rate 93 percent lower than the five trucks without SCR.

Diesel Particle Filter Effectiveness
• Of the diesel trucks, 3 front-loaders, 2 roll-offs, and 4 side-loaders had DPF
• Front-loaders: 98% average PM reduction• Roll-offs: 96% average PM reduction• Side-loaders:
– Overall: 88% average PM reduction– One 2008 DPF had just been serviced and apparently
was not working well: 64% PM reduction– Another 2008 DPF averaged 88% PM reduction– The 2010 and 2012 DPFs averaged 99% PM reduction

Field Data Collection for Dump Trucks

Study Design for Dump Truck Field Measurements
Single – Tier 1
Single – Tier 2
Tandem – Tier 1
Tandem – Tier 2
Vehicle Type Number Tested
4
4
2
2
All vehicles are part of NCDOT Division 5

Dump Truck Study Region:Wake County, North Carolina

Field Measurement of 8 Cement Mixers: B20 vs. Petroleum Diesel
• Four cement mixers measured in Atlanta, GA• Four measured in Vancouver, British
Columbia, Canada

Example: Installation of the PEMS on Construction Vehicles

• Study Location : Division 4 (Nash County) and Division 5 (Wake County)• Data Collection Scheduling
– 15 Tests with Petroleum Diesel and 15 Tests with B20 Biodiesel– Based on Regular NCDOT Duty Schedule
Overview of Study Design for Field Measurement
Vehicle TypeNumber of Vehicles Tested
Tier 0 Tier 1 Tier 2 Tier 3
Backhoes 1 2 2
Front-End Loaders 3 1
Motor Graders 2 2 1 1

Biodiesel vs. Diesel: Results from Real-World Tests of 35 Vehicles
a NO emissions were corrected based on ambient temperature and humidity
Type Vehicle NO a Opacity HC CO
Onroad
Dump Truck (12) -10 -10 -21 -11
Cement Mixer (8) -0.25 -20 -27 -27
Average -5.1 -15 -24 -19
Nonroad
Backhoe (5) -4.1 -17 -27 -17
Front-End Loader (4) -1.0 -19 -35 -42
Motor Grader (6) -0.16 -18 -17 -17
Average -1.8 -18 -26 -25
Overall (35) -3.5 -16 -25 -22

Emissions Reductions for Higher Tier vs. Lower Tier
Vehicle Engine Tiers NO(as NO2)a
Opacity-based PM HC CO
BackhoeTier 1 vs Tier 0 -7.0 0 -36 -49
Tier 2 vs Tier 0 -8.0 -48 -46 -86
Tier 2 vs Tier 1 -1.0 -48 -15 -72Front-End
Loader Tier 2 vs Tier 1 -23 -15 -57 -23
Motor Grader
Tier 1 vs Tier 0 -18 -15 -3.8 -51
Tier 2 vs Tier 0 -25 -37 -33 -60
Tier 3 vs Tier 0 -49 -42 -63 -74
Tier 2 vs Tier 1 -8.9 -26 -30 -18
Tier 3 vs Tier 1 -39 -31 -61 -47
Tier 3 vs Tier 2 -33 -6.8 -48 -35
a NO emissions were corrected based on the ambient temperature and humidityb This results are based on the average of two fuels

43
B20 and B35 - Rubber Tire Loaders
1. Scoop Material
4. Load Truck
2. Carry Material
3. Lift Bucket

44
NOx Emission Rate (g/gal)

45
PM Emission Rate (g/gal)

Effect of Engine Rebuild
Before Rebuild – Spring 2008

Engine Rebuild
During Rebuild – Summer 2009

Engine Rebuild
After Rebuild – Fall 2009

Railyard and Dynamometer Test Results: Prime Mover Engine NO Emission Rate

50
Biodiesel: Measured Locomotives
Three locomotives, each with an EMD12-710 Prime Mover Engine: 2-stroke, 12-cylinder, 140 L, 3000 hp

51
AMTRAK Piedmont Route
Distance: 173 milesTravel time (RGH CLT): 3 hr, 15 minSpeed: 79 mph (max), 55 mph (avg)

52
Portable Emissions Measurement System
Axion system by Clean Air Technologies
International, Inc.
• Non-dispersive infrared (NDIR) for CO2, CO, HC
• Electrochemical sensor for NO, O2
• Light scattering particulate matter measurement
53
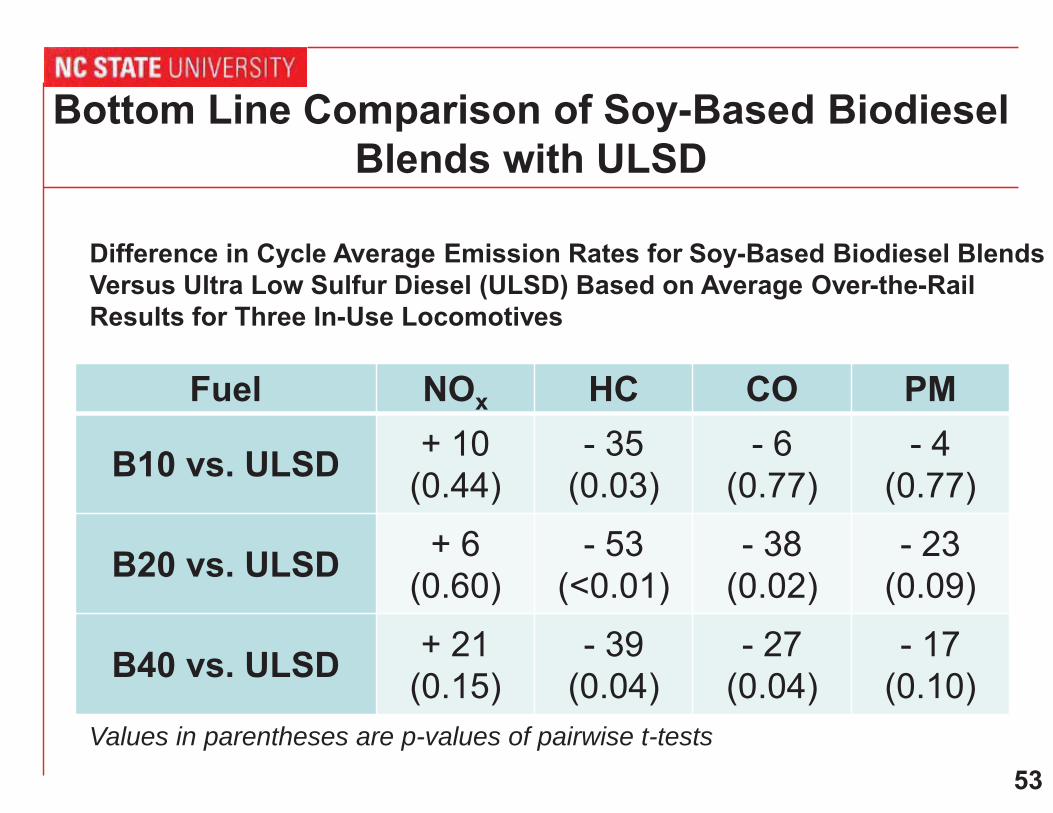
Bottom Line Comparison of Soy-Based Biodiesel Blends with ULSD
Fuel NOx HC CO PM
B10 vs. ULSD + 10(0.44)
- 35(0.03)
- 6(0.77)
- 4(0.77)
B20 vs. ULSD + 6(0.60)
- 53(<0.01)
- 38(0.02)
- 23(0.09)
B40 vs. ULSD + 21(0.15)
- 39(0.04)
- 27(0.04)
- 17(0.10)
Difference in Cycle Average Emission Rates for Soy-Based Biodiesel Blends Versus Ultra Low Sulfur Diesel (ULSD) Based on Average Over-the-Rail Results for Three In-Use Locomotives
Values in parentheses are p-values of pairwise t-tests

54
Operator and Locomotive NOx EmissionsTrip Total NOx Emissions for Six Engineers on the Piedmont Route Using Locomotive NC 1893 Emission Rates
Avg. NOx Emiss. (kg)Lowest to Highest
1 Engineer D (25.8)2 Engineer F (27.3)3 Engineer C (27.6)4 Engineer B (30.3)T5 Engineer A (31.7)T5 Engineer E (31.7)

55
Operator and Locomotive PM EmissionsTrip Total PM Emissions for Six Engineers on the Piedmont Route Using Locomotive NC 1893 Emission Rates
Avg. PM Emiss. (kg)Lowest to Highest
1 Engineer C (1.12)2 Engineer D (1.15)3 Engineer F (1.24)4 Engineer E (1.38)5 Engineer B (1.40)6 Engineer A (1.42)

56
Summary
• Real-world emissions from in-use diesels are decreasing in the U.S.
• Biodiesel can help reduce emissions from older vehicles• Advanced emission controls appear to be working and are
effective• Results may be sensitive to duty cycle and operator
behavior• Some design issues to be worked out• Fleet turnover will lead to lower in-use emissions• Long-term durability of controls needs to be monitored

Transportation, Energy, Emissions