is bitcoin like gold? an examination of the hedging and safe haven properties of the virtual...
DESCRIPTION
Whilst there has been significant focus on the virtual currency bitcoin in the financial media, to date there has been limited academic discourse in the economic and financial literature. This dissertation is a first attempt at exploring the developing correlations between bitcoin and more traditional asset classes. In particular I attempt to answer a specific question: Is bitcoin like gold? I qualitatively discuss the theory underlying this idea with reference to bitcoin’s decentralised nature, fixed money supply and creation by “mining”. In addition I focus on gold’s role as a hedge and a safe haven for stocks, bonds and currencies with a view to determining whether bitcoin could play a similar role. Using a GARCH analysis for the US and EU I find that for the most part bitcoin returns are statistically independent of equity and bond markets due to the low correlations estimated. An interesting finding of my research is that bitcoin may play a weak hedge and safe haven role for sovereign debt markets in the US and Europe, which could be explained by its exogeneity to the global network of financial institutions and governments. I also find that bitcoin may be a hedge for the euro, but not for the dollar. In addition the estimated coefficients for currency markets are consistently larger than those representing equities or bonds, supporting the idea that bitcoin is an alternative monetary asset.TRANSCRIPT

Is Bitcoin like Gold?
An Examination of the Hedging and Safe Haven
Properties of the Virtual Currency
Report on research presented in partial fulfilment of the requirements
of the examination for
MASTER OF SCIENCE IN FINANCE
Cormac Ennis
Supervisor: Dr. Constantin Gurdgiev
Trinity College Dublin
August 2013

i
Abstract
Whilst there has been significant focus on the virtual currency bitcoin in the
financial media, to date there has been limited academic discourse in the
economic and financial literature. This dissertation is a first attempt at
exploring the developing correlations between bitcoin and more traditional
asset classes. In particular I attempt to answer a specific question: Is bitcoin
like gold? I qualitatively discuss the theory underlying this idea with reference
to bitcoin’s decentralised nature, fixed money supply and creation by “mining”.
In addition I focus on gold’s role as a hedge and a safe haven for stocks,
bonds and currencies with a view to determining whether bitcoin could play a
similar role. Using a GARCH analysis for the US and EU I find that for the
most part bitcoin returns are statistically independent of equity and bond
markets due to the low correlations estimated. An interesting finding of my
research is that bitcoin may play a weak hedge and safe haven role for
sovereign debt markets in the US and Europe, which could be explained by
its exogeneity to the global network of financial institutions and governments.
I also find that bitcoin may be a hedge for the euro, but not for the dollar. In
addition the estimated coefficients for currency markets are consistently
larger than those representing equities or bonds, supporting the idea that
bitcoin is an alternative monetary asset.

ii
Executive Summary
Designed and implemented by an anonymous programmer (or team of
programmers), bitcoin is to date the most successful and widely used
example of a virtual currency. It is a “…digital, decentralised, partially
anonymous currency not backed by any government or other legal entity, and
not redeemable for gold or any other commodity” (Grinberg, 2011, p. 160). In
the short time since its inception in 2010 the price of one bitcoin has
fluctuated dramatically against the US dollar from an initial price of $0.05 to a
high of over $260. This exponential growth has attracted attention from
investors and widespread coverage in the financial media. Despite the
significant media coverage, to date there has been an absence of extensive
academic discourse within the economic and financial literature on the topic
of bitcoin. My primary research focus is on exploring bitcoin as an exotic
asset and investigating the developing correlations and informational
dependencies between bitcoin and other markets. In particular, I address the
anecdotal evidence, often featured in the financial media, that bitcoin may
behave like a form of virtual gold. This comparison has led to the idea that:
like gold, bitcoin may perform as a hedge or a safe haven against more
conventional securities.
The dissertation begins by providing an overview of the relevant academic
literature with a focus on the questions: what is bitcoin? And how is bitcoin
like gold? The two most interesting aspects of bitcoin as a currency system
are its decentralised nature and its fixed money supply. Bitcoin is
decentralised as it is not issued or managed by any one central authority.
Bitcoins are instead created by a process called ‘mining’. This involves users
running a program on their computers to solve complex mathematical
problems with the help of other computers on the network. For each problem
solved miners are rewarded with a fixed amount of newly created bitcoins as
an incentive for supporting the security and integrity of the network. The
amount of money created by mining is determined by an algorithm which
ensures that the supply of bitcoins is fixed. The total number of bitcoins in
existence will approach, but never reach, 21 million by approximately the year

iii
2040. This built in scarcity, along with the use of the term mining, has led to
frequent comparisons with gold, and bitcoin’s description as a “synthetic
commodity money” (Selgin, 2013). The fixed supply means that as long as
demand is increasing, through increased adoption by new users, the virtual
currency will be intrinsically deflationary. Whilst this poses problems for its
use as a currency, it is attractive to investors pursuing high returns.
Gold is generally found to be a monetary asset and performs as an effective
hedge against inflation and US dollar devaluations. I argue that bitcoin may
play a similar role due to its deflationary nature and its insulation against the
activities of central banks, which may from time to time debase the currencies
they manage. In addition as it is essentially an alternative currency, intuitively
one would expect that the relationship between bitcoin and currencies to be
the strongest which would support the idea that bitcoin is a monetary asset.
The relationship between gold and equity and bond markets is also well
documented. Generally gold is found to have a clear negative relationship
with stocks and to have little relationship with bonds. A reason put forward for
this by Ciner, Gurdgiev et al. (2010, revised 2012) is that “gold is a market
sentiment proxy that is more likely to impact riskier assets than fixed income
securities.” Due to the low participation in the bitcoin market by institutional
investors, there is a lack of clearly defined capital flows between the virtual
currency and traditional capital markets which intuitively would lead to low
correlations. Bitcoin’s exogeneity to the conventional financial system may
however allow it to play a hedge role against sovereign debt markets as it
does not rely on the reputation or supervision of any national or supranational
body.
Gold’s role as a safe haven in times of extreme negative returns is also well
documented. Historically it has been found to be a safe haven for equities,
bonds, and the dollar. However, in more recent studies the idea of gold as a
safe haven has been challenged with a possible reason being that the rise in
popularity of gold linked products “has caused a decline in its primary
attraction for many financial market participants, which is the notion that gold

iv
can be trusted as a safe haven against [the] equity market volatility” (Ciner,
Gurdgiev et al., 2010, revised 2012).
In order to determine whether bitcoin is a hedge or a safe haven for various
asset classes I use two econometric models based on those used by Baur
and Lucey (2010) and Ciner, Gurdgiev et al. (2010, revised 2012). For
estimation I include variables to represent stocks, bonds and currencies for
both US and EU markets. The equity market proxies are major indices from
both regions, the bond market proxies are benchmark ten year government
bond yields (using German bonds for the EU) and the currencies are the US
dollar and the euro. I estimate two GARCH (1, 1) models, one to determine
bitcoin’s correlations with each asset class, and one focusing on correlations
with periods of extreme negative returns. If bitcoin is a hedge it will be
negatively correlated with other assets on average and if it is a safe haven it
will be negatively correlated with periods of extreme negative returns. For
extreme negative shocks I use quantiles representing the bottom 5 and 10%
of returns for stocks and currencies, and the top 5 and 10% of spikes in yields
for bonds.
My results show that bitcoin does not play a hedge or a safe haven role for
US equity markets and is positively correlated with stock returns on average.
For European markets bitcoin returns are negatively correlated with stock
returns on average, meaning bitcoin could possibly play a hedge role. It is
important to note that the estimated coefficients are small and of varying
significance indicating that bitcoin returns are largely orthogonal to equity
markets in both the EU and US, and suggesting that bitcoin may have a role
as a diversifier.
For US and EU bond markets I find that bitcoin is a hedge as it is positively
correlated with yields. In addition, I find that bitcoin is a safe haven for EU
markets for both quantiles and a safe haven for US markets for the most
extreme periods of spikes in yields (top 5% quantile). The coefficient
estimates for the effect of changes in bond yields on bitcoin are small
indicating a weak relationship between the two markets. Despite the weak

v
relationship, the fact that bitcoin is negatively correlated with bonds on
average (positively correlated with yields) is interesting as this indicates that it
may play a different role in financial markets to that played by gold.
For currency markets, the coefficient estimates representing bitcoin’s
relationship with the dollar are consistently positive, whilst those with the euro
are consistently negative, implying that bitcoin may serve as a hedge against
the euro but not the dollar. I also find that bitcoin may play a safe haven role
for extreme negative returns on the dollar but not on the euro. It is interesting
to note that the estimated coefficients for the currency markets are
consistently larger than those representing equity or bond markets. This is
supportive of the idea that bitcoin is a monetary asset, a similarity it shares
with gold.
My main conclusion from estimation is that currently bitcoin returns are largely
orthogonal to returns in other markets. It is important to realise that as an
asset bitcoin is still in an early development stage. As a result of this the
correlations between it and other markets are much more volatile than those
between more mature asset classes. If bitcoin adoption continues at the
current rate and a clear regulatory framework is put in place, it is likely that
more institutional investors will enter the market, strengthening the
correlations between bitcoin and other more traditional investment vehicles.
Further research could focus on the dynamic nature of these developing
relationships, perhaps using a dynamic conditional correlation (DCC)
methodology similar to that used by Ciner, Gurdgiev et al. (2010, revised
2012). In addition the results from estimating bitcoin’s relationship to bond
markets could be studied further. For the Eurozone in particular the effect of
changes in the spread between core and periphery bond yields on bitcoin
could be examined as these are likely to better reflect negative shocks to the
European bond market.

vi
Acknowledgements
I would like to express my deepest appreciation to all those who provided me
with help in writing my masters dissertation, without whom it would not have
been possible.
In particular, to my supervisor Dr. Constantin Gurdgiev I would like to say
спасибо (thank you) for his advice, guidance and inspiration throughout my
research. Furthermore I would like to thank my parents, Frank and Irene, for
their continued support.

vii
Table of Contents
1: Introduction ............................................................................................................... 1
2: Literature Review ..................................................................................................... 2
2.1: What is bitcoin? ................................................................................................. 2
2.2: How is bitcoin like gold? ................................................................................... 8
3: Data and Descriptive Statistics ............................................................................... 13
3.1: Data .................................................................................................................. 13
3.2: Descriptive Statistics........................................................................................ 14
3.3: Basic Correlation Study ................................................................................... 16
4: Econometric Model................................................................................................. 18
4.1: Hypotheses and Definitions ............................................................................. 18
4.2: Model 1 ............................................................................................................ 18
4.3: Model 2 ............................................................................................................ 20
5: Empirical Analysis .................................................................................................. 23
5.1: Model 1 ............................................................................................................ 23
5.1.1: US Market ................................................................................................. 23
5.1.2: EU Market................................................................................................. 26
5.2: Model 2 ............................................................................................................ 28
5.2.1: US Market ................................................................................................. 28
5.2.2: EU Market................................................................................................. 30
6: Conclusion .............................................................................................................. 33
References ................................................................................................................... 36
Appendix ..................................................................................................................... 39
viii
List of Tables
Table 1: Summary Results for Model 1 of US market ................................... 24
Table 2: Summary Results for Model 1 of EU market ................................... 27
Table 3: Summary Results for Model 2 of US market ................................... 29
Table 4: Summary Results for Model 2 of EU market ................................... 31
Table 5: Avg daily volume traded by currency .............................................. 39
Table 6: Descriptive statistics for US market data ......................................... 47
Table 7: Descriptive statistics for EU market data and bitcoin ....................... 48
Table 8: Summary statistics for rolling 30-day correlations ........................... 50
Table 9: Result of GARCH, T-GARCH and IGARCH estimation for Model 1.1
US market (S&P 500) ................................................................................... 51
Table 10: Result of GARCH, T-GARCH and IGARCH estimation for Model 1.2
US market (Dow Jones) ............................................................................... 52
Table 11: Result of GARCH, T-GARCH and IGARCH estimation for Model 1.3
US market (Russell 2000)............................................................................. 53
Table 12: Result of GARCH, T-GARCH and IGARCH estimation for Model 1.1
EU market (Eurostoxx 50) ............................................................................ 54
Table 13: Result of GARCH, T-GARCH and IGARCH estimation for Model 1.2
EU market (Dax) ........................................................................................... 55
Table 14: Result of GARCH, T-GARCH and IGARCH estimation for Model 2.1
US market (S&P 500) ................................................................................... 56
Table 15: Result of GARCH, T-GARCH and IGARCH estimation for Model 2.2
US market (Dow Jones) ............................................................................... 57
Table 16: Result of GARCH, T-GARCH and IGARCH estimation for Model 2.3
US market (Russell 2000)............................................................................. 58
Table 17: Result of GARCH, T-GARCH and IGARCH estimation for Model 2.1
EU market (Eurostoxx 50) ............................................................................ 59
Table 18: Result of GARCH, T-GARCH and IGARCH estimation for Model 2.1
EU market (Dax) ........................................................................................... 60
ix
List of Figures
Figure 1: Volume of bitcoin traded by currency ............................................. 39
Figure 2: Expected total no. of bitcoin over time ........................................... 40
Figure 3: Breakdown of virtual currency scheme types ................................. 40
Figure 4: Illustration of bitcoin transactions ................................................... 41
Figure 5: Plot of bitcoin price (Linear scale) .................................................. 41
Figure 6: Plot of bitcoin price (Logarithmic scale) ......................................... 42
Figure 7: Plot of level of S&P 500 Index ....................................................... 42
Figure 8: Plot of level of Dow Jones index .................................................... 43
Figure 9: Plot of level of Russell 2000 index ................................................. 43
Figure 10: Plot of US government ten year bond yield .................................. 44
Figure 11: Plot of US 10 year yield (left axis) and S&P 500 (right axis) ......... 44
Figure 12: Plot of level of US Dollar index .................................................... 45
Figure 13: Plot of level of Eurostoxx 50 index ............................................... 45
Figure 14: Plot of level of German dax index ................................................ 46
Figure 15: Plot of German government ten year bond yield .......................... 46
Figure 16: Plot of level of euro currency index .............................................. 47
Figure 17: Rolling 30-day correlations with US equity market ....................... 48
Figure 18: Rolling 30-day correlations with EU equity market ....................... 49
Figure 19: Rolling 30-day correlations with bond yields ................................ 49
Figure 20: Rolling 30-day correlations with currency markets ....................... 50
1
1: Introduction
The objective of this dissertation is to conduct an in-depth economic and
financial study of the virtual currency Bitcoin. A comprehensive econometric
analysis of the currency will be undertaken so as to determine bitcoin’s
position within the universe of investable assets and to contribute to the
limited academic literature on the topic. The study of informational
dependencies across asset classes is of benefit to market participants in that
it can guide and inform their investment strategies. Bitcoin as it exists
currently is an exotic asset unlikely to feature in many investors portfolios.
However, already since its inception it has seen exponential growth along
with widespread media coverage. This dissertation is therefore a first attempt
at exploring the developing correlations that exist between bitcoin and other
more traditional investment vehicles. In particular, I address the anecdotal
evidence, often featured in the financial media, that bitcoin may behave like a
form of virtual gold. This comparison is often based on commentator’s
opinions that part of bitcoin’s value as an investment, like gold, is a result of
its ability to perform as a hedge or a safe haven against more conventional
securities. I formally address this issue empirically through the use of
econometric techniques.
The remainder of this dissertation is organised as follows: Chapter 2 will
provide an overview of the academic literature relevant to bitcoin attempting
to answer the questions: What is bitcoin? and how is bitcoin like gold?
Chapter 3 will discuss the data to be used in estimation and the summary
descriptive statistics. Chapter 4 will discuss the econometric methodology
used. Chapter 5 will outline and infer meaning from the results of estimation
and finally Chapter 6 will contain my concluding remarks.

2
2: Literature Review
In this chapter I will discuss most of the relevant scholarly literature that exists
on the topic of bitcoin. As previously stated as a motivation for research,
whilst there has been significant coverage of bitcoin in the financial media; the
quantity of academic discourse on the topic has been limited. As a result I
have been forced to widen the scope of what are acceptable sources for
review, with a good degree of material coming from within the online bitcoin
community. Due to the source of much of my material, care has been taken to
screen for any bias which may be present.
2.1: What is bitcoin?
Bitcoin is to date the most successful and widely used example of a virtual
currency. It is “…a digital, decentralized, partially anonymous currency not
backed by any government or other legal entity, and not redeemable for gold
or any other commodity” (Grinberg, 2011, p. 160). It was developed and
implemented by an anonymous programmer (or team of programmers) under
the pseudonym Satoshi Nakamoto in 2009 and has since achieved a certain
degree of international recognition as a result of widespread media coverage.
The bitcoin system operates at a global level and enables users to purchase
both real and virtual goods and services in exchange for units of the currency,
thereby competing with traditional currencies such as the US dollar and the
euro. Bitcoin is not pegged to any currency, with the exchange rate being set
by supply and demand in the market. All major currencies can be exchanged
for bitcoins on a number of online exchanges with Mt.Gox the most popular,
handling approximately 65% of all Bitcoin exchange trading1. As of writing,
the majority of all Bitcoin exchange transactions are with the US dollar2. An
interesting development in the distribution of bitcoin exchange transactions is
the digital currencies surge in popularity in China. In the first two quarters of
2013 the Chinese Yuan’s share has risen from approximately 1% of global
1 Source: www.bitcoincharts.com
2 See Figure 1 and Table 4 in appendix. Approximately 80% of all bitcoin exchange
transactions are with the US dollar at time of writing. (Source: www.bitcoincharts.com)

3
exchange volume to close to 6%. This is largely attributed to a short
documentary on bitcoin which aired on state-run broadcaster CCTV at the
end of March. Some bitcoin commentators have viewed this as a deliberate
move by the Chinese government to undermine the dollar’s reserve status, as
they have repeatedly called for a move away from the current dollar
dominated system3.
Since its inception in 2009 the value of one bitcoin has fluctuated dramatically
against the US dollar from an initial price of approximately $0.05 for one
bitcoin to a high of over $260. As of the time of writing over 11 million bitcoins
have been created and the current “market cap” of all bitcoins is close to one
billion US dollars. The price appreciation of bitcoin has been staggering given
that a “coin” has no intrinsic value, making bitcoin in some respects the most
trust based of all currencies. The use of the term “market cap”, taken from a
major bitcoin data publishing website, outlines one of the issues with bitcoin’s
status as a currency. Many users view the bitcoins they hold less as a
currency and more as a share on any and all developments in the whole
bitcoin space. This view of bitcoin as an investment is one of the primary
motivations for this research as a first attempt to estimate bitcoins relative
position within the universe of financial assets.
The “protocol” under which the bitcoin system operates was originally outlined
in a paper published online by Nakamoto (2009) in the aftermath of the global
financial crisis. Trust in the financial system is a recurring theme in the paper
with Nakamoto drawing attention to the “inherent weaknesses of the trust
based model” and stating that “What is needed is an electronic payment
system based on cryptographic proof instead of trust” (p. 1). Whilst Nakamoto
is explicitly referring to the online payments system, many bitcoin proponents
have latched on to the fact that the virtual currency is exogenous to the well-
established global financial system as one of its major strengths, allowing
users to insulate themselves against the interventionist policies of central
banks.
3 See Wall Street Journal article on comments of Governor of Bank of China Zhou Xiaochuan.
(http://online.wsj.com/article/SB123780272456212885.html)
4
The bitcoin system functions similarly to Bit Torrent, the popular peer-to-peer
file sharing software. According to the Oxford English Dictionary Online a
peer-to-peer network is:
“…[a network] in which each computer can act as a server for the others,
allowing shared access to files and peripherals without the need for a central
server.”
The key aspect of this definition as it relates to bitcoin is “without the need for
a central server”. Bitcoin is “designed as a decentralised system where no
central monetary authority is involved” (ECB, 2012, p. 24). This means that
the currency is not issued or managed by any one central organisation such
as the US Federal Reserve or the European Central Bank, nor is there a need
for the involvement of any other financial institutions in bitcoin transactions.
The technical aspects of the bitcoin payment system are difficult to
understand for most people not from a relevant technical background.
However, for my purposes a basic description of the process, drawing on that
featured in the ECB’s (2012) paper, will suffice4. In order to conduct bitcoin
transactions users must download and run the free and open-source software
(the bitcoin client). Users “coins” are then stored on their computers in a file
called a wallet, with all responsibilities regarding securing and backing up
these digital wallets falling to the individual user. Nakamoto (2009) defines an
electronic coin (bitcoin) “as a chain of digital signatures.” Each owner has two
“keys”, one public and one private, which are used to digitally “sign” any
transactions. Each computer on the network contains a ledger (called the
“block chain5”) of all previous transactions, which is one way the system
avoids the need for any trusted third party. Figure 4 in the appendix provides
a simplified illustration of how a bitcoin transaction works. First the future
owner must send his public key to the current owner . The original
4 For a full technical discussion of how the bitcoin system operates see Nakamoto, S. (2009)
‘Bitcoin: A Peer-to-Peer Electronic Cash System’, 5 “A block chain is a transaction database that is shared by all nodes participating in a system
based on the Bitcoin protocol. A full copy of a currency’s block chain contains every
transaction ever executed in the currency.” (https://en.bitcoin.it/wiki/Block_chain)
5
owner then transfers the bitcoins by “digitally signing a hash6 of the previous
transaction and the public key of the next owner” (Nakamoto, 2009, p. 2).
Each individual bitcoin contains a record of all previous transactions, with
each additional transaction becoming embedded as part of this code. All
transactions are then broadcast to the network, which verifies that a bitcoin
transfer has taken place by looking at the “timestamp7” which is contained in
the transaction hash, in a process called “mining”. These verified transactions
then become a matter of public record and are added to the block chain.
The ECB (2012) defines “mining” as:
“…the process of validating transactions by using computing power to find
valid blocks8 (i.e. to solve complicated mathematical problems)”.
“Miners” are incentivised to support the security and integrity of the network
by verifying transactions, as for each new block that is solved the successful
miner is rewarded with a set amount of newly created bitcoins. This process
is how bitcoins are initially distributed in the absence of any central authority.
Nakamoto (2009, p. 4) describes the mining process as “analogous to gold
miners expending resources to add gold to circulation”, with the resources in
question being computational and electrical power. The system is designed
so that as more miners join the network, the “problem difficulty adjusts to
ensure that bitcoins are created at a predetermined rate and not faster or
slower.” (Grinberg, 2011, p. 163) In addition, the algorithm which determines
the rate of creation of bitcoins is set to half four times over the life of the
currency as the total monetary base reaches certain predetermined levels910.
The total number of bitcoins in existence will approach, but never reach, 21
6 “A hash, or hash value, is the value returned by an algorithm that maps large data sets to
smaller data sets of fixed length.” (ECB, 2012, p. 23) “The same hash will always result from
the same data, but modifying the data by even one bit will completely change the hash.”
(https://en.bitcoin.it/wiki/Hash) 7 A timestamp is simply the time of day recorded in a digital transaction, so as to determine
transaction order in electronic payment systems. 8 “A block is a record of some or all of the most recent Bitcoin transactions that have not yet
been recorded in any prior blocks.” (https://en.bitcoin.it/wiki/Block_chain) 9 See Fig. 2 in Appendix.
10 The first of these levels was reached in November 2012 when the mining reward halved
from 50 bitcoins per successful block to 25 bitcoins.

6
million by approximately the year 2040, from which point on “miners are
expected to finance themselves through transaction fees.” (ECB, 2012, p. 25)
As a result of the ever-increasing difficulty of successful bitcoin mining
purpose built “mining rigs” have been developed with vastly superior
computational ability to the average PC. In addition, miners have also
organised themselves into profit sharing “pools” to hedge against the risk of
running the bitcoin client for long periods of time and receiving no reward due
to the stochastic element involved in the mining process.
The built-in scarcity in the bitcoin system, along with the frequent
comparisons with gold (mining, etc.) has led to bitcoin’s description as a
“synthetic commodity money” (Selgin, 2013) and is one of the most
interesting aspects of the currency from a monetary point of view. The fixed
money supply means that as long as bitcoins use is growing the currency will
be intrinsically deflationary, resulting in accusations that it may lead to a
deflationary spiral. This deflationary nature also contributes to users views of
bitcoin as more of an asset than a currency and has drawn large numbers of
speculators to bitcoin, resulting in two major boom and bust cycles.
Economists generally agree that constant deflation is a very destructive force
in modern economies, leading to hoarding as the value of money is expected
to increase over time. However, in the case of bitcoin as it “is not the currency
of a country or currency area and is therefore not directly linked to the goods
and services produced in a specific economy” the negative macro-economic
impact of any deflation are unlikely to pose a major issue (ECB, 2012, p.25).
As part of the transaction process users never have to disclose their identity
leading to a high degree of anonymity in the system with the result that bitcoin
is often described as “digital cash” (ECB, 2012, p. 25). Bitcoin has
experienced its fair share of controversy because of this anonymity with early
users latching on to its ability “to facilitate money laundering, tax evasion, and
trade in illegal drugs and child pornography.” (Grinberg, 2011, p. 161) These
illicit activities have of course brought the virtual currency to the attention of
regulatory bodies, such as the ECB and FinCEN (a bureau of the US
Department of Treasury).
7
The ECB paper, which I have used extensively as a resource so far, focuses
largely on the relevance of virtual currency schemes for central banks.
Although the paper refers generally to “virtual currency schemes”, “bitcoin”
appears over 100 times throughout the document and takes up the majority of
the discussion11. The authors identify a number of ways through which bitcoin
may impact central banks key responsibilities of maintaining price and
financial stability. They conclude that bitcoin does not pose a risk to price
stability due to its stable (fixed) money supply, and does not pose a risk to
financial stability due to its limited connection to the real world economy. With
regard to regulation they determine that bitcoin does fall within central banks
responsibilities and that the lack of supervision could pose an issue in the
future, highlighting difficulties arising from the legal uncertainty surrounding
the currency. So far US regulatory bodies have remained relatively quiet
regarding the legality of bitcoin, however, FinCEN “issued guidance clarifying
that bitcoin exchanges are considered Money Transmitters and are required
to obtain all proper licenses to conduct business in the US.” (TGB, 2013, p.
21)
The infrastructure surrounding bitcoin has developed rapidly in the years
since its inception and includes “exchanges, transaction service providers,
market information and chart providers, escrow providers, joint mining
operations and so on.” (Grinberg, 2011, p. 165) A surprising consequence of
this according to a study by Christin and Moore (2013) is that the majority of
“risk Bitcoin holders face stems from interacting with these intermediaries,
who act as de facto central authorities” (p. 9). They find that approximately
45% of bitcoin exchanges have closed often resulting in customers losing
money that they are unable to withdraw. This exchange risk has led to wild
periods of market volatility with both major bitcoin price crashes attributed to
problems with the most popular bitcoin exchange Mt. Gox, however, this
statement is based on anecdotal evidence.
11
The paper also features a second case study of another virtual currency, Linden Dollars,
which are an in-game currency featured in popular online role playing game Second Life.

8
The degree of uncertainty regarding the safety of funds transferred to online
exchanges is a serious barrier to the development of bitcoin as a currency or
an asset, and highlights the need for some form of regulatory framework. Any
regulation is likely to come hand in hand with a tax treatment, which will
remove one of bitcoins major strengths as an asset, its tax free nature. In May
2013 the US Government Accountability Office (GAO) published a report to
the US Senate Committee on Finance in relation to the tax compliance of
virtual currencies. They recommended that the IRS provide additional
guidance regarding online currencies and highlighted uncertainties with how
to characterise income and how to calculate the basis for gains as possible
issues. They find that the uncertainty in relation to how to characterise income
“depends on whether the virtual economy activity or virtual currency unit is to
be treated as property, barter, foreign currency, or a financial instrument”
(GAO, 2013, p. 13). Any form of regulatory or tax treatment represents a
double edged sword for bitcoin proponents who are largely attracted by the
currencies independence from the global financial system, but who also hope
for a more widespread adoption which will only happen should the fears of
more conventional investors be allayed.
2.2: How is bitcoin like gold?
The majority of my discussion so far has been of a descriptive nature
regarding how bitcoin works and the major issues it may face in future.
However, my main research focus is on determining bitcoins relative
relationships with conventional asset classes such as stocks, bonds and
currencies. From my survey of the available academic literature and
publications in the financial media I have come across various comparisons
between bitcoin and gold. The ECB lays the economic foundations of bitcoin
with the Austrian school of economics, well known proponents of a return to
the gold standard, and it can be argued that bitcoin represents an ultimate
form of denationalised money given that it is not controlled by any
government or other central authority. They further develop this relationship
by stating that bitcoin is “inspired by the former gold standard” (2012, p. 22).
Whilst I have briefly discussed the unique monetary aspects of the currency a
9
full discussion of the economic philosophy underlying bitcoin is outside the
scope of this paper. In this section, I intend to develop the comparison
between bitcoin and gold not as a form of money but as an asset class.
Exponents of bitcoin’s virtues argue that as it is an alternative currency and
payment system that does not depend on a network of financial institutions,
but rather is “based on cryptographic proof instead of trust” (Nakamoto, 2009,
p. 1). As a result users are insulated against the risks posed by sovereign
currencies and debt such as inflation and default risk. This is particularly
relevant when we consider bitcoin was created in the aftermath of the global
financial crisis in 2008 when public trust in governments and financial
institutions was at a low. This also gives weight to the comparison between
bitcoin and gold, as gold is in theory used to protect against similar risks.
Capie, Mills and Wood (2005) argue that gold has remained attractive as an
asset as:
“It is durable, divisible, and, for many years over a large part of the world, was
indeed the ultimate standard of value.”
Like gold bitcoin is durable, it cannot be destroyed easily, although it can be
lost or stolen but the same can be said for physical gold. Bitcoins are also
“divisible to eight decimal places enabling their use in any kind of transaction,
regardless of the value” (ECB, 2012, p. 21). Unlike gold however, bitcoin
obviously lacks the historical significance resulting from hundreds of years of
use as a store of value. Interestingly bitcoin has gained significant popularity
among libertarians and others from similar ideological backgrounds that have
traditionally been seen as major “gold bugs”. The philosophical links between
bitcoin and the Austrian school are likely to play a major role here and no
doubt fears about the effects of the unconventional monetary policies being
pursued by central banks since the financial crisis have added fuel to the fire.
One major advantage of investing in bitcoin rather than gold are the much
lower costs involved. To gain exposure to gold investors main options are
physical gold, the futures market and gold-linked funds. As of the time of

10
writing to gain exposure to bitcoin investors can only purchase bitcoins. One
of the main issues with buying physical gold is the cost of storage, for bitcoin
these costs are basically zero. Gold futures contracts involve physical delivery
so to gain exposure investors who only wish to speculate on the market must
enter into and close out positions to avoid taking delivery and having to pay
storage costs. For longer term investors in the futures market, they must roll
out of the expiring month contract and into the next active contract which
compounds the fees they must pay to the exchange. As bitcoin is basically
free to hold this is not an issue for investors and in addition bitcoin exchange
fees are much lower in comparison to those charge by conventional financial
exchanges. Gold-linked funds, such as ETFs, have seen a major surge in
popularity in recent years; however, these also charge transaction and
storage fees. As a result of its low cost nature, if bitcoin could serve a similar
purpose in the markets, i.e. as a hedge and safe-haven, it could offer a much
cheaper alternative to gold, benefitting investors.
Intuitively one would expect that the relationship between bitcoin and
currencies be the strongest, as bitcoin is in essence an alternative currency.
The academic literature on gold’s role as a monetary asset is well developed
and it is consistently found that gold is an effective hedge against inflation12,
and against US dollar devaluations13. One possible explanation given for this
role as provided by Capie, Mills et al. (2005) is that:
“…gold cannot be produced by the authorities that produce currencies. This
means that those who can increase the supply of money and therefore, from
time to time, debase its value cannot by similar means debase the value of
gold.” (p. 351)
The same can be argued for bitcoin as a result of its fixed money supply and
decentralised nature which could make it a natural hedge for currencies.
12
See Fortune (1987), Moore (1990), Taylor (1998), Ghosh, Levin et al. (2004), Worthington
and Pahlavani (2007), Blose (2010), and Wang, Lee et al. (2010). 13
See Johnson and Soenen (1997), Capie, Mills et al. (2005), Tully and Lucey (2007),
Sjaastad (2008), Hammoudeh, Sari et al. (2009), and Ciner, Gurdgiev et al. (2010, revised
2012).
11
Gold’s role as a hedge14 for stock and bond markets has also been tested
extensively. Baur and Lucey (2010), Baur and McDermott (2010), and Ciner,
Gurdgiev et al. (2010, revised 2012) find a clear negative relationship
between gold and stock returns on average indicating that gold is a hedge for
equity markets. However, they find that “there is little relation between gold
and bond prices, in general” (Ciner, Gurdgiev, et al., 2010, revised 2012, p.
9). A potential explanation they provide is that “gold is a market sentiment
proxy that is more likely to impact riskier assets than fixed income securities”
(Ciner, Gurdgiev et al. (2010, revised 2012, p. 9).
Another well documented role that gold plays in financial markets is as a safe
haven in times of extreme negative returns. Baur and Lucey (2010), and Baur
and McDermott (2010) find that gold “can and does act as a safe haven for
bonds as well as stocks” (Lucey, 2011, p. 12). Ciner, Gurdgiev et al. (2010,
revised 2012) also find the same relationship to hold for gold, bonds, and the
dollar. However, they found that “gold in fact does not act as a safe haven for
equities” (p. 11). They present a possible reason for this as being that the rise
in popularity of gold based ETFs and other gold-linked indices “has caused a
decline in its primary attraction for many financial market participants, which is
the notion that gold can be trusted as a safe haven against [the] equity market
volatility” (p. 11).
Although the degree of informational dependency between bitcoin and
traditional capital markets needs to be tested statistically, intuitively a low
correlation is likely. This may be due to the fact that as of yet there are
unlikely to be many institutional investors in the bitcoin market, due to the low
liquidity and lack of regulation, which could make the virtual currency a
natural hedge against equity and bond markets. Whilst bitcoin’s monetary
structure could make it a hedge against currency depreciations and inflation,
its exogeneity to the conventional financial system could allow it to play a
hedge role against sovereign debt markets as it does not rely on the
reputation or supervision of any national or supranational body, and should be
14
See Baur and Lucey (2010), Baur and McDermott (2010) and Ciner, Gurdgiev et al. (2010,
revised 2012).

12
insulated to some degree from the contagion which allowed the spread of the
2008 crisis from the subprime market in the US to the rest of the world.

13
3: Data and Descriptive Statistics
3.1: Data
The data to be examined consists of daily observations and covers the period
between 19 July 2010 and 21 June 2013. As bitcoin was only established in
2010 this is the earliest date from which reliable data is available. The end
date was chosen to both maximise the size of the data set whilst allowing
sufficient time to conduct econometric analyses. I include a broad range of
variables to represent stock, bond, and currency markets. The data are drawn
from both US and European markets.
The Bitcoin data consists of the bitcoin-US dollar exchange rate and is quoted
in dollars per bitcoin. The raw daily data is in seven-day week format;
however, as the data for the other assets are in five-day week format the
weekend data was dropped. All bitcoin data was obtained from
www.bitcoincharts.com, a leading source of Bitcoin exchange rate and
volume data.
To represent the US equity market I use the Standard & Poor’s 500 Index
(S&P 500), the Dow Jones Industrial Average Index (DJIA), and the Russell
2000 Index. The S&P 500 was chosen as it is widely regarded as one of the
best gauges of blue chip companies in the US. The Dow Jones Industrial
Average is one of the longest running stock indices in the world. It represents
30 of the largest US companies drawn from a diverse range of industries. It is
often quoted as a leading index due to the fact that its component companies
are some of the most actively traded in the US equity market. The inclusion of
the Russell 2000 allows estimation of the relationship between bitcoin and the
broader US stock market. Whereas the S&P 500 and the Dow Jones only
feature large-cap companies, the Russell 2000 also features small- and mid-
cap companies.
To represent the European equity market I use the Eurostoxx 50 Index and
the Deutsche Aktien Index (DAX). The Eurostoxx 50 is an index containing 50
14
of the largest blue chip European companies. It covers equities from 12
different Eurozone countries and as such is a good indicator of the overall
European equity market. The German stock index (the Dax) is an index
featuring 30 of the largest companies traded on the Frankfurt stock exchange.
Germany is the largest economy in the Eurozone and so its main stock index
is again a good indicator of the general health of European markets. All equity
index data was obtained from Bloomberg.
To represent the US bond market I use Bloomberg’s US generic government
ten year yield, which provides a rolling, constant maturity series of the yield
on the benchmark US government bond. For the European bond market I use
Bloomberg’s German generic government ten year yield, which again
provides a rolling, constant maturity series of the yield on the benchmark core
Eurozone bond.
To represent currencies I use the Federal Reserve’s trade weighted US dollar
index which is an index of the US dollars relative strength against a basket of
foreign currencies. For the euro I use Bloomberg’s Correlation Weighted
Index which is an index of the euro’s relative strength against a representative
basket of world currencies.
The series were grouped by geographic location with the US equity, bond and
currency data to be used together for group estimation, and the EU equity,
bond and currency data also to be used together. As bitcoin is currently tax
free in most jurisdictions none of the series to be used for estimation are tax
adjusted.
3.2: Descriptive Statistics
Figures 5 to 16 in the Appendix present plots of the price (level) of each asset
over time. Figure 5 is a plot of the price of bitcoin in US dollars over time on a
linear scale. The price of bitcoin was less than $1 until the beginning of 2011.
The first speculative bubble and crash in the virtual currency occurred in June
2011 when the price peaked at around $30. The price then crashed due to an
attack on one of the main exchanges which resulted in the theft of a large
15
quantity of bitcoins. The price of bitcoin began to grow at a parabolic rate at
the beginning of 2013. It eventually reached an all-time high of $266 per
bitcoin before plummeting sharply. It has since levelled off and is trading in a
range of approximately $80 to $100 at the time of writing. Figure 6 presents a
plot of the price of bitcoin against a logarithmic scale. It displays a definite
upward trend with the price seeming to revert to the mean following each of
the bubbles and crashes. It makes more sense to view Bitcoin prices on a log
scale since the price has grown exponentially due to constant adoption by
new users.
US stock prices as measured by the S&P 500, the Dow Jones and the
Russell 2000 have increased over the period of the sample and are all close
to their all-time highs. Equity prices in the US experienced a sharp downward
correction in Q3 2011 due to fears of a Eurozone breakup as a result of talk
that Greece may be the first country forced to leave the monetary union.
Yields on benchmark US treasury notes have fallen over the period of the
sample, due largely to the US Federal Reserve’s policy of ultra-low interest
rates, reaching their all-time low in Q2/3 2012. Figure 11 in the appendix
shows a plot of ten year yield and the S&P 500. In it we can clearly see that
the sharp drop in yields in Q3 2011 corresponds with a fall in the aggregate
level of stock prices (as measured by the S&P) for the same period. This is
representative of “risk-off” behaviour in the markets as investors leave riskier
investments and gravitate towards the perceived lower risk of US
Government securities, bidding up prices and pushing down yields. Figure 12
shows that the US dollar depreciated against a representative basket of
foreign currencies up until Q3 2011, following which it appreciated, again
likely due to the policies of the Fed.
European equity markets as measured by the Eurostoxx 50 have fallen over
the period of the sample and are still well below pre-crisis (2007) highs. The
German Dax index has increased over the period of the sample and is
currently close to its all-time highs similar to the US indices. The spread
between the German and aggregate European equity markets reflects the
economic imbalance between Germany, a core Eurozone country, and the

16
more peripheral nations. Both the Eurostoxx and the Dax experienced a
sharp downward correction in Q3 2011, due to the escalating Eurozone crisis,
with the Eurostoxx correcting most severely. Yields on the ten year German
Bund have fallen over the period of the sample. A sharp move down in Q3
2011 has been followed by a continuing downward trend, with yields reaching
their all-time lows in Q3 2012. The Euro weakened against a representative
basket of foreign currencies up until Q3 2012, following which it appreciated.
Much of this down trend can likely be attributed to the strengthening US dollar
(from Q3 2011) along with the escalating Eurozone crisis.
Tables 6 and 7 in the appendix present a summary of descriptive statistics for
the log returns of each series for both the US and EU markets. If we take the
standard deviation of returns to measure an asset’s riskiness, then Bitcoin is
by far the riskiest over the sample period. This is followed by equities, with the
Russell 2000 index the riskiest and the Dow Jones the least risky. For this
sample EU equity markets are also riskier on average than US markets. The
US dollar is more volatile than the Euro over the sample period. Finally bonds
are the least risky investment as the returns examined represent a change in
yield and not overall returns. A student’s t-test on each of the sample means
indicates that the mean returns of each of the series representing stocks,
bonds and currencies are not statistically different from zero. However, the
mean return on bitcoin is positive and statistically different from zero at the
0.02% level indicating a positive trend in the data.
3.3: Basic Correlation Study
Figures 17 to 20 in the appendix present plots of rolling thirty-day correlations
between the log returns on each asset class and bitcoin. Figure 17 presents
the correlations between bitcoin returns and returns on US equity market
indices. There does not appear to be any clear trend in the data and the
correlation fluctuates from negative to positive over time. The correlation
remains generally low and positive between August 2011 and August 2012,
and appears to be on average more positive than negative. In general the
correlation appears to be negatively skewed, as more extreme negative

17
values are observed than positive. The correlations between bitcoin returns
and returns on European equity markets are presented in figure 18. Again
there does not appear to be any clear trend in the data with the series
fluctuating between negative and positive values. The plot appears to be
positively skewed with more extreme positive values observed than negative
ones.
Figure 19 presents a plot of rolling 30-day correlations between bitcoin
returns and changes in bond yields for the US and Germany. The series
again oscillate between negative and positive values with more positive
values observed, which implies a negative correlation with bond prices,
however, this will need to be tested empirically. Finally figure 20 presents the
rolling 30-day correlations between bitcoin and returns on the US dollar and
euro currency indices. The clear negative correlation between the dollar and
euro is apparent as both series are generally moving in opposite directions.
The relationship between currencies and bitcoin appears to be the most
volatile which intuitively makes sense as bitcoin is in essence an alternative
currency. Also it is interesting to note that while the correlations with both
series fluctuate between negative and positive, the relationship with the euro
seems to be on average more positive, whilst the relationship with the dollar
appears to be more negative.
These plots of rolling correlations are useful for gaining an insight into what, if
any, informational dependencies exist between bitcoin and other asset
classes. It must be noted that the correlations fluctuate a lot over time,
implying weak relationships in general. A possible explanation for this is that
bitcoin is still in its development stage; if more institutional investors enter the
market then its relationships with other asset classes will become more
defined.

18
4: Econometric Model
4.1: Hypotheses and Definitions
This section outlines the econometric models I will use to test whether bitcoin
is a hedge, a diversifier, or a safe haven drawing on the econometric models
featured in papers by Capie, Mills and Wood (2005), Baur and Lucey (2010)
and Ciner, Gurdgiev and Lucey (2010, revised 2012). Through these tests I
hope to address the question: as an asset, does bitcoin behave like gold? My
null and alternate hypotheses are therefore:
(4.1.1)
(4.1.2)
Here the condition “behave like gold” explicitly refers to whether bitcoin works
as a safe haven or a hedge for other assets.
Baur and Lucey (2010) define a hedge as:
“…an asset that is uncorrelated or negatively correlated with another asset or
portfolio on average.” (p. 219)
They go on to define a safe haven as:
“…an asset that is uncorrelated or negatively correlated with another asset or
portfolio in times of market stress or turmoil.” (p. 219)
Finally, it may be the case that bitcoin is a diversifier which they define as:
“…an asset that is positively (but not perfectly) correlated with another asset
or portfolio on average.” (p. 219)
4.2: Model 1
To address these questions I will run two separate models. The first model, to
test whether bitcoin is a hedge or a diversifier against stocks, bonds and
currencies, has a mean equation of the form:

19
(4.2.1)
Where the returns on each asset are calculated by taking the first difference
of the logarithm to ensure each series were stationary 15 and ,
, , and are the returns on bitcoin, stocks, bond yields and
currencies respectively. For this model the hypotheses are therefore:
(4.2.2)
(4.2.3)
An examination of the residuals of an ordinary least squares (OLS) estimation
of the mean equation for each group of series suggested the use of a
GARCH16 model, which is consistent with the work done by previous papers
(Capie et al. 2005 etc.). Financial time series often “exhibit periods of
unusually high volatility followed by more tranquil periods of low volatility”
(Asteriou and Hall, 2006, p. 249); this is known as volatility clustering. When
this is the case the assumption of the OLS methodology, that the variance of
the error term is constant and time-invariant (is homoskedastic) is violated
and we say that the variance is heteroskedastic (Hill, Griffiths and Lim, 2012,
p. 299). When time series exhibit heteroskedasticity it is often best to
dynamically model the variance using the ARCH17 class of models. GARCH
models are generalised ARCH models which allow for the capture of “long
lags in the shocks with only a few parameters” (Hill et al., 2012, p. 526),
allowing for more parsimonious estimation. I estimated a number of different
15
To formally test for stationarity Augmented Dickey Fuller unit root tests were applied to
each series. Cointegration was also tested for as non-stationary series can be related to one
another if they are cointegrated. The logarithm of each series was found to be not cointegrated
with any of the other series. 16
Further testing was performed on the residuals to confirm the presence of autoregressive
heteroskedasticity such as an ARCH-LM test and an examination of a correlogram of the
squared residuals. 17
Auto-Regressive Conditional Heteroskedasticity
20
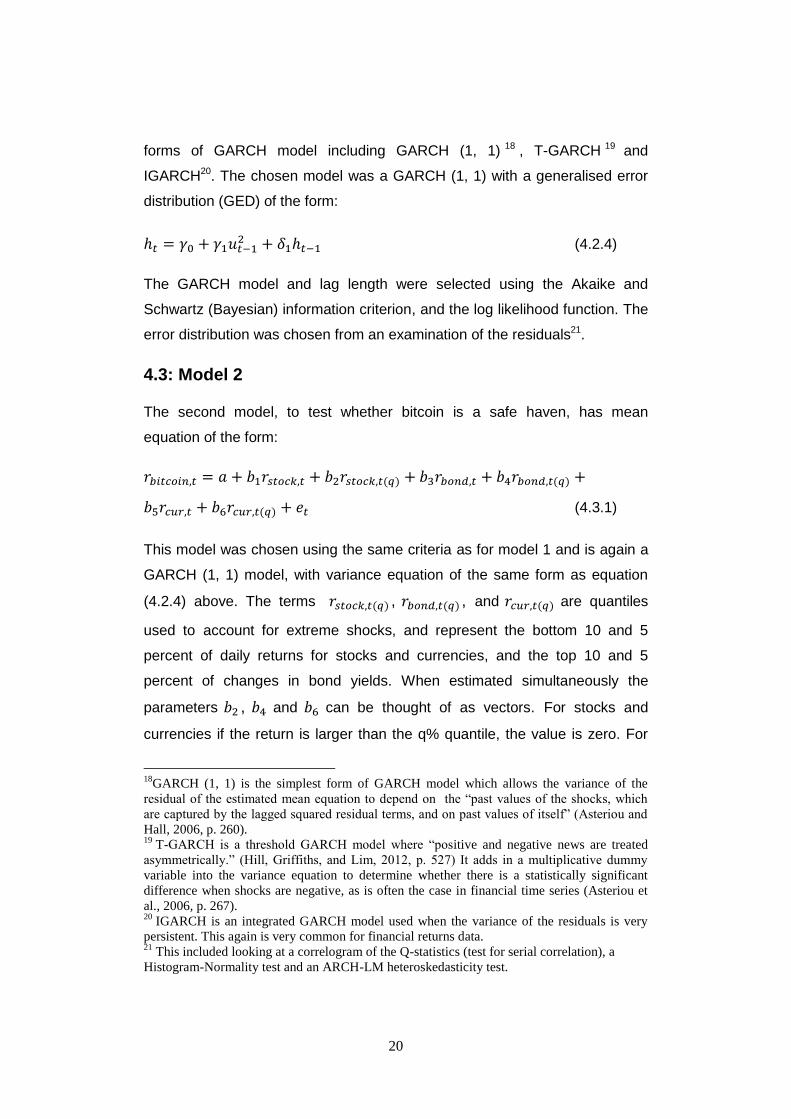
forms of GARCH model including GARCH (1, 1) 18 , T-GARCH 19 and
IGARCH20. The chosen model was a GARCH (1, 1) with a generalised error
distribution (GED) of the form:
(4.2.4)
The GARCH model and lag length were selected using the Akaike and
Schwartz (Bayesian) information criterion, and the log likelihood function. The
error distribution was chosen from an examination of the residuals21.
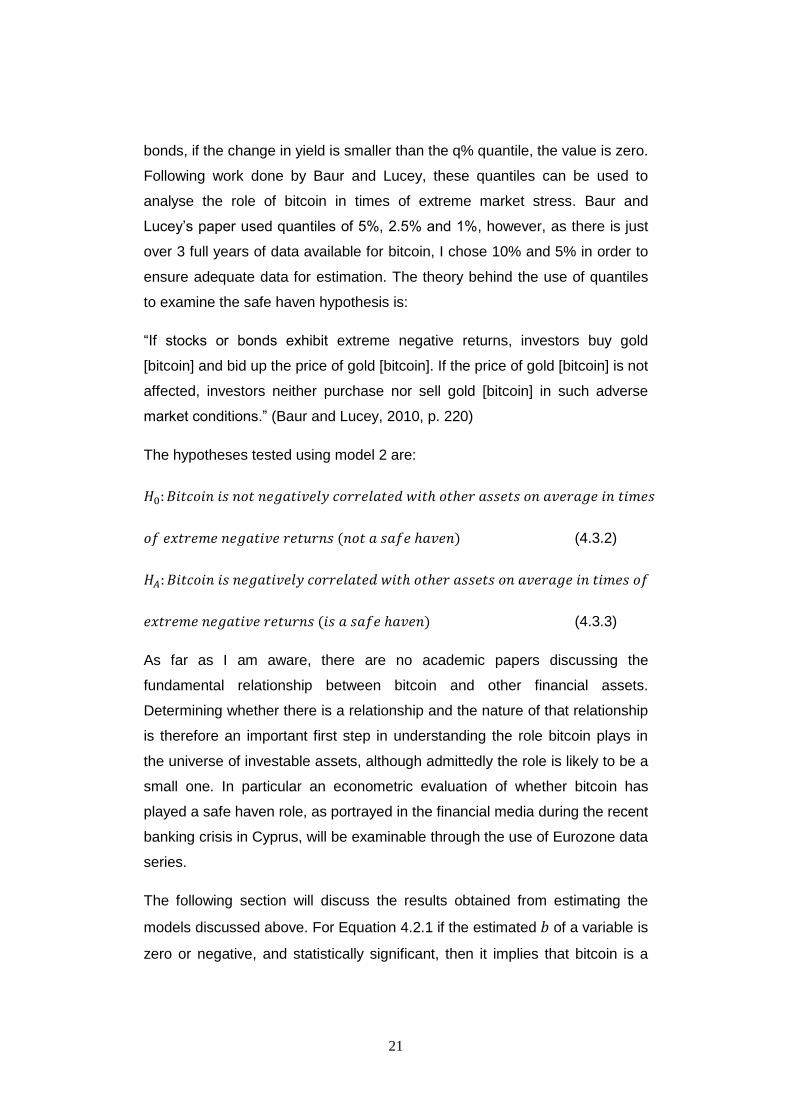
4.3: Model 2
The second model, to test whether bitcoin is a safe haven, has mean
equation of the form:
(4.3.1)
This model was chosen using the same criteria as for model 1 and is again a
GARCH (1, 1) model, with variance equation of the same form as equation
(4.2.4) above. The terms , , and are quantiles
used to account for extreme shocks, and represent the bottom 10 and 5
percent of daily returns for stocks and currencies, and the top 10 and 5
percent of changes in bond yields. When estimated simultaneously the
parameters , and can be thought of as vectors. For stocks and
currencies if the return is larger than the q% quantile, the value is zero. For
18
GARCH (1, 1) is the simplest form of GARCH model which allows the variance of the
residual of the estimated mean equation to depend on the “past values of the shocks, which
are captured by the lagged squared residual terms, and on past values of itself” (Asteriou and
Hall, 2006, p. 260). 19
T-GARCH is a threshold GARCH model where “positive and negative news are treated
asymmetrically.” (Hill, Griffiths, and Lim, 2012, p. 527) It adds in a multiplicative dummy
variable into the variance equation to determine whether there is a statistically significant
difference when shocks are negative, as is often the case in financial time series (Asteriou et
al., 2006, p. 267). 20
IGARCH is an integrated GARCH model used when the variance of the residuals is very
persistent. This again is very common for financial returns data. 21
This included looking at a correlogram of the Q-statistics (test for serial correlation), a
Histogram-Normality test and an ARCH-LM heteroskedasticity test.
21
bonds, if the change in yield is smaller than the q% quantile, the value is zero.
Following work done by Baur and Lucey, these quantiles can be used to
analyse the role of bitcoin in times of extreme market stress. Baur and
Lucey’s paper used quantiles of 5%, 2.5% and 1%, however, as there is just
over 3 full years of data available for bitcoin, I chose 10% and 5% in order to
ensure adequate data for estimation. The theory behind the use of quantiles
to examine the safe haven hypothesis is:
“If stocks or bonds exhibit extreme negative returns, investors buy gold
[bitcoin] and bid up the price of gold [bitcoin]. If the price of gold [bitcoin] is not
affected, investors neither purchase nor sell gold [bitcoin] in such adverse
market conditions.” (Baur and Lucey, 2010, p. 220)
The hypotheses tested using model 2 are:
(4.3.2)
(4.3.3)
As far as I am aware, there are no academic papers discussing the
fundamental relationship between bitcoin and other financial assets.
Determining whether there is a relationship and the nature of that relationship
is therefore an important first step in understanding the role bitcoin plays in
the universe of investable assets, although admittedly the role is likely to be a
small one. In particular an econometric evaluation of whether bitcoin has
played a safe haven role, as portrayed in the financial media during the recent
banking crisis in Cyprus, will be examinable through the use of Eurozone data
series.
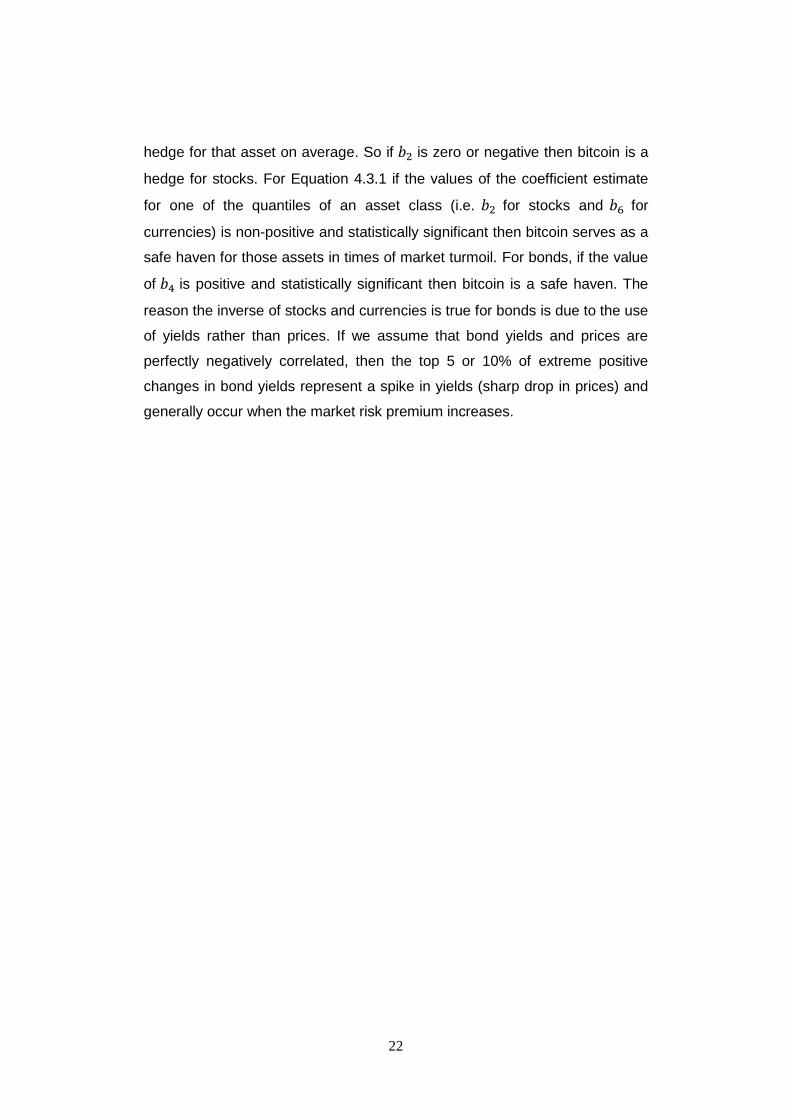
The following section will discuss the results obtained from estimating the
models discussed above. For Equation 4.2.1 if the estimated of a variable is
zero or negative, and statistically significant, then it implies that bitcoin is a
22
hedge for that asset on average. So if is zero or negative then bitcoin is a
hedge for stocks. For Equation 4.3.1 if the values of the coefficient estimate
for one of the quantiles of an asset class (i.e. for stocks and for
currencies) is non-positive and statistically significant then bitcoin serves as a
safe haven for those assets in times of market turmoil. For bonds, if the value
of is positive and statistically significant then bitcoin is a safe haven. The
reason the inverse of stocks and currencies is true for bonds is due to the use
of yields rather than prices. If we assume that bond yields and prices are
perfectly negatively correlated, then the top 5 or 10% of extreme positive
changes in bond yields represent a spike in yields (sharp drop in prices) and
generally occur when the market risk premium increases.

23
5: Empirical Analysis
This section outlines the results obtained from estimating the models
described in Chapter 4. The results are broken down into those obtained from
each model by market.
5.1: Model 1
5.1.1: US Market
The summary results from estimating model 1 for the US market are
presented in table 1 below. The coefficient estimates for the average effects
of stock returns on bitcoin returns are not statistically significant. However,
they are all positive on average implying that whilst for the sample tested the
relationship between bitcoin and the US equity market is weak the direction of
this relationship may be positive. The coefficient estimates for the average
effect of a change in bond yields on bitcoin returns are significant at the 10%
level only in model 1.1 with the S&P 500 as the equity market proxy. They are
however, consistently low and positive implying a negative relationship
between bitcoin returns and bond prices. This means that bitcoin could serve
as a hedge for the US bond market. The estimates for the average effect of
returns on the US dollar are only significant (at the 5% level) in model 1.2 with
the Dow Jones as the equity market variable. However, the estimates are all
consistently positive and the effect is much stronger than for equities or bonds
which supports the idea that bitcoin is a monetary asset.
The estimated ARCH (1) and GARCH (1) terms in the variance equations are
all positive and highly statistically significant. In addition they are all very
similar in size indicating that the model is relatively robust and is an
appropriate selection for modelling the conditional variance of the system.
24
TABLE 1: SUMMARY RESULTS FOR MODEL 1 OF US MARKET
US Model 1.1 (S&P 500) US Model 1.2 (DJIA) US Model 1.3 (Russell 2000)
Bitcoin Coeff. Est. Std err. P-value Coeff. Est. Std. err. P-value Coeff. Est. Std. err. P-value
0.0022 0.0007 0.0009*** 0.0021 0.0006 0.0004*** 0.0026 0.0007 0.0003*** 0.0771 0.0823 0.3489 0.1228 0.0861 0.1538 0.0749 0.0733 0.3067 0.0481 0.0286 0.0924* 0.0367 0.0276 0.1828 0.0228 0.0319 0.4762 0.2979 0.2133 0.1624 0.3768 0.1964 0.0550* 0.2961 0.2079 0.1544
Var. eq.
0.0001 0.0000 0.0395** 0.0001 0.0000 0.0483** 0.0001 0.0000 0.0448** 0.3232 0.0724 0.0000*** 0.3164 0.0710 0.0000*** 0.3158 0.0692 0.0000*** 0.7559 0.0339 0.0000*** 0.7630 0.0331 0.0000*** 0.7599 0.0328 0.0000***
*, **, *** indicate significance at 10, 5, and 1% respectively.
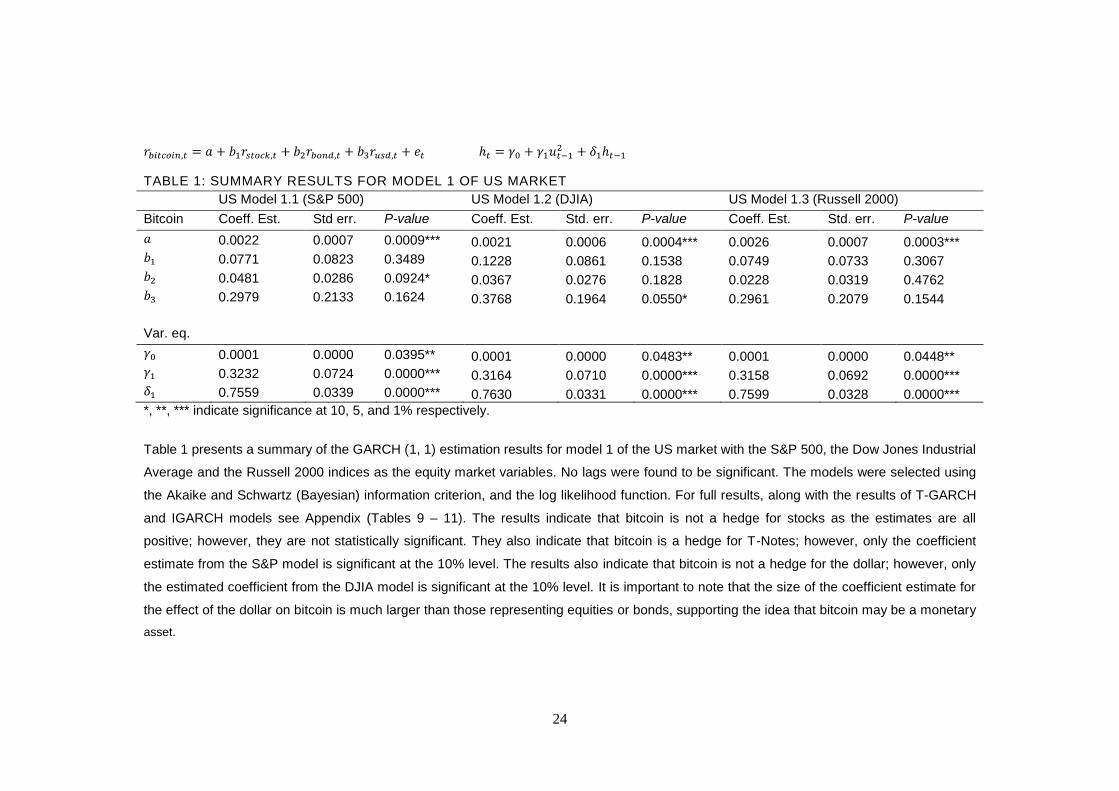
Table 1 presents a summary of the GARCH (1, 1) estimation results for model 1 of the US market with the S&P 500, the Dow Jones Industrial
Average and the Russell 2000 indices as the equity market variables. No lags were found to be significant. The models were selected using
the Akaike and Schwartz (Bayesian) information criterion, and the log likelihood function. For full results, along with the results of T-GARCH
and IGARCH models see Appendix (Tables 9 – 11). The results indicate that bitcoin is not a hedge for stocks as the estimates are all
positive; however, they are not statistically significant. They also indicate that bitcoin is a hedge for T-Notes; however, only the coefficient
estimate from the S&P model is significant at the 10% level. The results also indicate that bitcoin is not a hedge for the dollar; however, only
the estimated coefficient from the DJIA model is significant at the 10% level. It is important to note that the size of the coefficient estimate for
the effect of the dollar on bitcoin is much larger than those representing equities or bonds, supporting the idea that bitcoin may be a monetary
asset.
25
Overall the results from estimating model 1 for the US market are
inconclusive given the varying significance of the estimated coefficients. I fail
to reject the null hypothesis that bitcoin is not negatively correlated with
equities on average. For model 1.2 the coefficient estimate for the relationship
between bitcoin and the dollar is positive and significant at the 10% level, in
which case I accept the null that bitcoin is not negatively correlated with the
US dollar on average. In the case of bonds, for model 1.1 I reject the null and
accept the alternate hypothesis at the 10% level as bitcoin is positively
correlated with changes in bond yields (negatively correlated with prices).
One positive result from estimation is that the direction and strength of the
relationships between bitcoin returns and the returns on other assets are
relatively consistent. The fact that for the most part the estimated coefficients
are not significant implies that bitcoin returns may be orthogonal to equities,
bonds and the US dollar. This may mean that while bitcoin is not strictly a
hedge, using the definition supplied by Baur and Lucey (2010), it may be a
natural hedge due to the low and insignificant correlations with other asset
classes. In addition the low correlations imply that bitcoin is a diversifier.

26
5.1.2: EU Market
The summary results from estimating model 1 for the EU market are
presented in table 2. The coefficient estimates for the average effect of bitcoin
returns on European equity market returns are never significant implying that
no clear relationship exists. In addition, the relationships represented by the
coefficient estimates from models 1.1 and 1.2 are in opposing directions
making interpretation more difficult. The coefficient estimates for the average
effect of a change in bond yields on bitcoin returns are positive and
statistically significant at the 5% level in both models, and at the 1% level in
model 1.1. These estimates are 0.1645 and 0.0692 for models 1.1 and 1.2
respectively. This implies that bitcoin is a hedge for Eurozone bond markets
on average, as represented by German ten year bond yields. The coefficient
estimates for the average effect of returns on the euro index on bitcoin returns
are not statistically significant. In addition the signs vary across both models
again causing interpretation difficulties. The ARCH and GARCH coefficients
from estimating the variance equation are all positive and statistically
significant at the 1% level.
Overall the results from estimating model 1 for the EU market are
inconclusive regarding equity and currency markets as a result of the
insignificant and contradictory coefficient estimates. I therefore fail to reject
the null hypothesis that bitcoin returns are not negatively correlated with EU
equity markets and the euro on average. However, in the case of European
bond markets I can reject the null, and accept the alternate hypothesis as
bitcoin returns are positively correlated with changes in German bond yields
(negatively correlated with prices) meaning that bitcoin appears to be a hedge
for European bond markets. It is important to note that the strength of this
relationship varies a good deal across both models meaning that whilst the
direction of the relationship may be statistically significant, the degree to
which changes in bond yields affect changes in bitcoin returns is uncertain.
27
TABLE 2: SUMMARY RESULTS FOR MODEL 1 OF EU MARKET
EU Model 1.1 (Eurostoxx) EU Model 1.2 (Dax)
Bitcoin Coeff. Est. Std err. P-value Coeff. Est. Std. err. P-value
0.0035 0.0007 0.0000*** 0.0033 0.0007 0.0000*** -0.0660 0.0414 0.1109 0.0539 0.0792 0.4962 0.1645 0.0292 0.0000*** 0.0693 0.0277 0.0123** -0.2184 0.2318 0.3461 0.2027 0.2434 0.4050
Var. eq.
0.0001 0.0000 0.0352** 0.0001 0.0000 0.0326** 0.3034 0.0701 0.0000*** 0.3136 0.0706 0.0000*** 0.7651 0.0341 0.0000*** 0.7583 0.0342 0.0000***
*, **, *** indicate significance at the 10, 5 and 1% levels respectively.
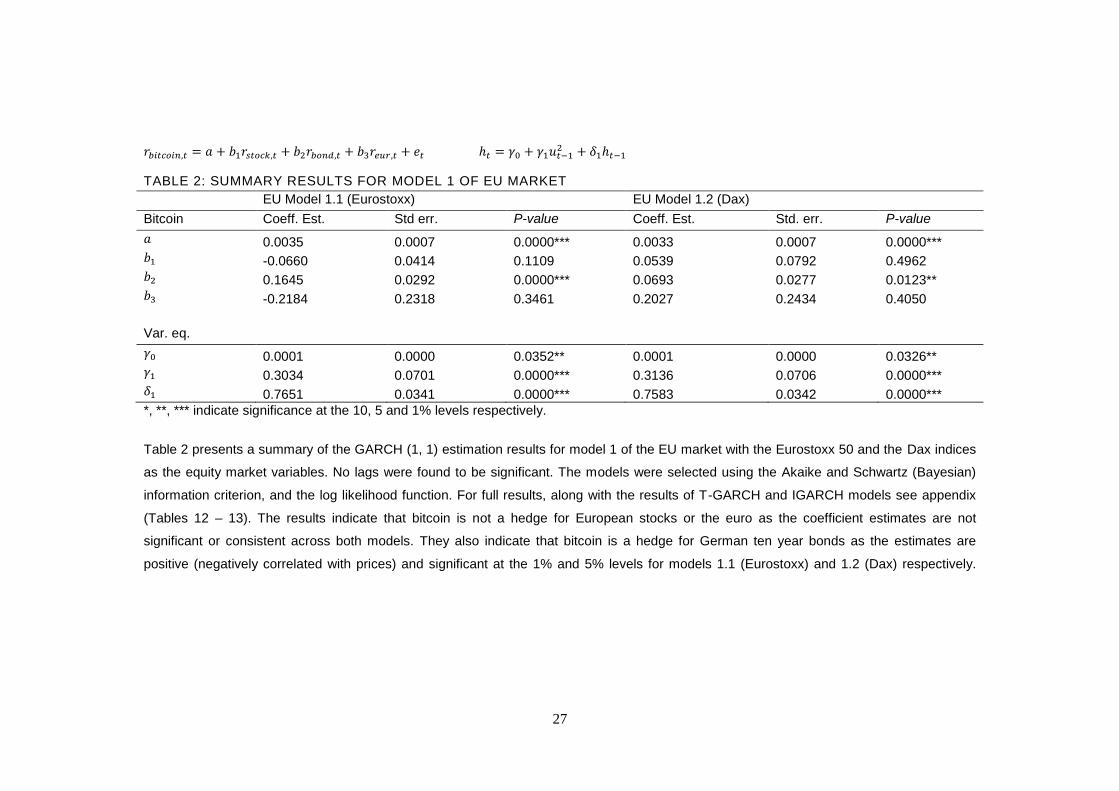
Table 2 presents a summary of the GARCH (1, 1) estimation results for model 1 of the EU market with the Eurostoxx 50 and the Dax indices
as the equity market variables. No lags were found to be significant. The models were selected using the Akaike and Schwartz (Bayesian)
information criterion, and the log likelihood function. For full results, along with the results of T-GARCH and IGARCH models see appendix
(Tables 12 – 13). The results indicate that bitcoin is not a hedge for European stocks or the euro as the coefficient estimates are not
significant or consistent across both models. They also indicate that bitcoin is a hedge for German ten year bonds as the estimates are
positive (negatively correlated with prices) and significant at the 1% and 5% levels for models 1.1 (Eurostoxx) and 1.2 (Dax) respectively.

28
5.2: Model 2
5.2.1: US Market
The summary results from estimating model 2, to test whether bitcoin serves
as a safe haven for the US market are presented in table 3. The reactions in
the bitcoin market following periods of extreme negative stock returns are
positive22 and not significant23, indicating that bitcoin is not a safe haven for
US equities. The estimated coefficients for the effect of extreme positive
spikes in US bond yields (falls in prices) on the bitcoin market are negative for
the 90% quantile and positive for the 95% quantile. This implies that bitcoin
can function as a safe haven for the most extreme spikes in bond yields;
however, none of the coefficients are statistically significant. The coefficient
estimates for the average effect of extreme dollar devaluations are negative
on average24. This implies that bitcoin may function as a safe haven in times
of extreme returns against the dollar; however, none of these estimates are
statistically significant.
The estimated coefficients for the average effect of returns on equities, bond
yields and the dollar are consistent with those found in model 1 indicating that
the direction of the relationships may be correct, although they are for the
most part insignificant. It is worth noting that for models 2.1 and 2.2 the
coefficients representing the relationship between bitcoin and the dollar are
positive and statistically significant at the 10 and 5% levels respectively. The
effect of a change in the relative strength of the dollar on bitcoin are again
stronger than the effects of changes in equity or fixed income markets, which
supports the notion that bitcoin is a monetary asset.
22
For the model using the Russell 2000 index as the equity market proxy the variable
representing the 5% quantile is negative, however, the sign of this result is not consistent with
the other coefficients estimated. 23
For the model using the Dow Jones index as the equity market proxy the variable
representing the 5% quantile is positive and significant at the 5% level, however, the
significance of this result is not consistent with the other coefficients estimated. 24
Apart from the coefficient estimate of the 5% quantile in the Dow Jones model which is
positive.

29
TABLE 3: SUMMARY RESULTS OF MODEL 2 FOR US MARKET
US Model 2.1 (S&P 500) US Model 2.2 (DJIA) US Model 2.3 (Russell 2000)
Bitcoin Coeff. Est. Std err. P-value Coeff. Est. Std. err. P-value Coeff. Est. Std. err. P-value
0.0021 0.0008 0.0088*** 0.0039 0.0008 0.0000*** 0.0025 0.0008 0.0028***
0.1340 0.0998 0.1792 0.0191 0.1184 0.8720 0.0168 0.0816 0.8372
(10%) 0.0542 0.1756 0.7577 0.1091 0.1504 0.4681 0.1385 0.1929 0.4728
(5%) 0.1360 0.1761 0.4401 0.3225 0.1571 0.0400** -0.0056 0.2167 0.9792
0.0251 0.0369 0.4962 0.0240 0.0325 0.4602 0.0519 0.0306 0.0901*
(90%) -0.1086 0.0963 0.2598 -0.1172 0.0899 0.1922 -0.0679 0.1024 0.5069
(95%) 0.0406 0.1010 0.6874 0.0653 0.0878 0.4570 0.0321 0.1115 0.7732
0.4797 0.2634 0.0686* 0.5250 0.2381 0.0274** 0.3778 0.2721 0.1651
(10%) -0.0223 0.3909 0.9544 -0.4366 0.5429 0.4213 -0.2601 0.5696 0.6479
(5%) -0.2226 0.4620 0.6299 0.2686 0.5383 0.6178 -0.2415 0.6428 0.7072
Var. eq.
0.0001 0.0000 0.0553* 0.0001 0.0000 0.0454** 0.0001 0.0000 0.0520*
0.3223 0.0726 0.0000*** 0.3125 0.0694 0.0000*** 0.3204 0.0713 0.0000***
0.7625 0.0330 0.0000*** 0.7653 0.0326 0.0000*** 0.7626 0.0330 0.0000***
*, **, *** indicate significance at the 10, 5 and 1% levels respectively.
Table 3 presents a summary of the GARCH (1, 1) estimation results for model 2 of the US market with the S&P 500, the Dow Jones Industrial
Average and the Russell 2000 indices as the equity market variables. For full results, along with the results of T-GARCH and IGARCH
models see appendix (Tables 14 – 16). The results suggest that bitcoin has a strong positive correlation with the US dollar (statistically
significant at the 10 and 5% level in models 2.1 and 2.2 respectively). Bitcoin is not strictly a safe haven for any of the markets tested but is
negatively correlated with extreme dollar devaluations indicating some safe haven properties. Bitcoin is also positively correlated with
extreme positive yield changes indicating that it may function as a safe haven for the most extreme periods of increased risk in the bond
market. Bitcoin is not a hedge or a safe haven for equities as it is positively correlated on average and during periods of market turbulence.
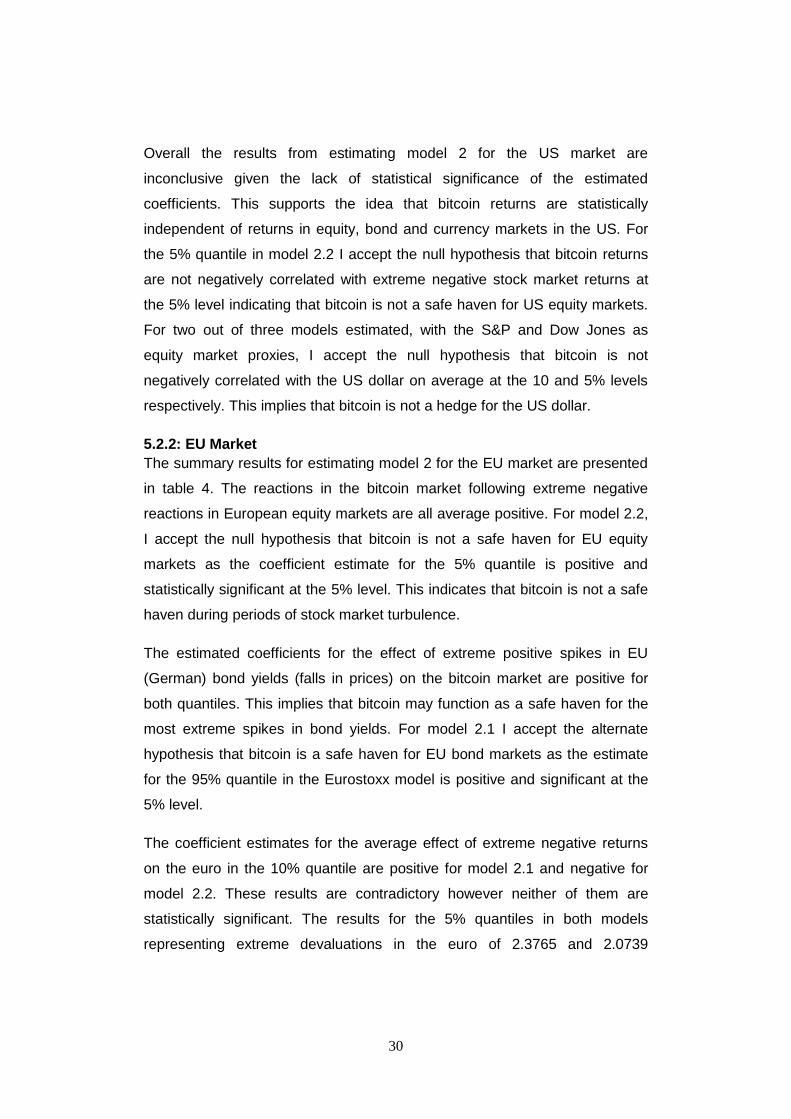
30
Overall the results from estimating model 2 for the US market are
inconclusive given the lack of statistical significance of the estimated
coefficients. This supports the idea that bitcoin returns are statistically
independent of returns in equity, bond and currency markets in the US. For
the 5% quantile in model 2.2 I accept the null hypothesis that bitcoin returns
are not negatively correlated with extreme negative stock market returns at
the 5% level indicating that bitcoin is not a safe haven for US equity markets.
For two out of three models estimated, with the S&P and Dow Jones as
equity market proxies, I accept the null hypothesis that bitcoin is not
negatively correlated with the US dollar on average at the 10 and 5% levels
respectively. This implies that bitcoin is not a hedge for the US dollar.
5.2.2: EU Market
The summary results for estimating model 2 for the EU market are presented
in table 4. The reactions in the bitcoin market following extreme negative
reactions in European equity markets are all average positive. For model 2.2,
I accept the null hypothesis that bitcoin is not a safe haven for EU equity
markets as the coefficient estimate for the 5% quantile is positive and
statistically significant at the 5% level. This indicates that bitcoin is not a safe
haven during periods of stock market turbulence.
The estimated coefficients for the effect of extreme positive spikes in EU
(German) bond yields (falls in prices) on the bitcoin market are positive for
both quantiles. This implies that bitcoin may function as a safe haven for the
most extreme spikes in bond yields. For model 2.1 I accept the alternate
hypothesis that bitcoin is a safe haven for EU bond markets as the estimate
for the 95% quantile in the Eurostoxx model is positive and significant at the
5% level.
The coefficient estimates for the average effect of extreme negative returns
on the euro in the 10% quantile are positive for model 2.1 and negative for
model 2.2. These results are contradictory however neither of them are
statistically significant. The results for the 5% quantiles in both models
representing extreme devaluations in the euro of 2.3765 and 2.0739
31
TABLE 4: SUMMARY RESULTS OF MODEL 2 FOR EU MARKET
EU Model 2.1 (Eurostoxx) EU Model 2.2 (Dax)
Bitcoin Coeff. Est. Std err. P-value Coeff. Est. Std. err. P-value
0.0036 0.0010 0.0002*** 0.0026 0.0009 0.0030*** -0.0271 0.0629 0.6672 -0.0012 0.0869 0.9892 (10%) 0.2150 0.1379 0.1191 0.1491 0.2067 0.4706 (5%) 0.0022 0.1179 0.9854 0.3477 0.1440 0.0158** 0.0501 0.0339 0.1395 0.0649 0.0388 0.0946* (90%) 0.0866 0.0635 0.1728 0.0823 0.0986 0.4042 (95%) 0.1205 0.0585 0.0395** 0.0736 0.0936 0.4318 -0.3905 0.2419 0.1065 -0.0457 0.2635 0.8623 (10%) 0.7948 0.8037 0.3227 -0.5668 0.7916 0.4740 (5%) 2.3765 0.9784 0.0151*** 2.0739 0.9901 0.0362**
Var. eq.
0.0001 0.0000 0.0485** 0.0001 0.0000 0.0313** 0.3148 0.0723 0.0000*** 0.3191 0.0725 0.0000***
0.7635 0.0340 0.0000*** 0.7534 0.0353 0.0000***
*, **, *** indicate significance at the 10, 5 and 1% levels respectively.
Table 5 presents a summary of the GARCH (1, 1) estimation results for model 2 of the EU market with the Eurostoxx 50 and Dax indices as
the equity market variables. For full results, along with the results of T-GARCH and IGARCH models see Appendix (Tables 17 – 18). The
results indicate that bitcoin may be a hedge (negatively correlated) but is not a safe haven (positive and significant at 5% level in model 2.2)
for EU equity markets. The results show that bitcoin is a hedge (positive and significant at 10% level in model 2.2) and a safe haven (positive
and significant at 5% level in model 2.1) for EU bond markets. They also indicate that bitcoin may be a hedge for the euro, but is not a safe
haven due to a very strong positive correlation with the 5% quantile of extreme euro devaluations (significant at 5% level in both models).

32
respectively are both statistically significant at the 5% level and indicate that
bitcoin does not function as a safe haven in times of extreme euro
devaluations.
The coefficient estimates for the average effect of returns on equities, bonds
and the euro on the bitcoin market are consistent across the models and with
the results of model 1.1 above. This may give a clearer idea of the general
direction of the relationships tested and could be an indicator that the
contradictory results from model 1.2, with the Dax as the equity market proxy,
are due to a poorly fitting model. For the average effect of equity market
returns on bitcoin returns the estimated coefficients are both small and
negative, however, neither of them are statistically significant. For bond
yields, the estimated coefficients are both small and positive, implying a
negative relationship between bond prices and bitcoin. For model 2.2 the
estimated coefficient is statistically significant at the 10% level indicating that
bitcoin is a hedge for the EU bond market. For euro returns, the values of the
estimated coefficients are both negative implying that bitcoin may serve as a
hedge for the euro, however, they are not statistically significant.
Overall the results from estimating model 2 for the European market provide
further support for the idea that bitcoin returns are orthogonal to returns in
equity markets, given the small size and lack of statistical significance of the
estimated coefficients. I find that bitcoin plays a hedge and a safe haven role
for European bond markets. I also find that bitcoin may play a role as a
hedge, but is not a safe haven for the euro.
33
6: Conclusion
In this dissertation I investigate the correlations between bitcoin and equity,
bond, and currency markets in the US and Europe using daily data. The
purpose of this analysis is to determine bitcoin’s characteristics as an
investable asset. Qualitatively I argue that bitcoin can be viewed as a form of
virtual gold due to a number of similarities in its design such as its durability
and divisibility. Commentators have drawn attention to the similarities
between bitcoin and the former gold standard, namely the fixed supply of
bitcoin which grows at a predetermined rate. This comparison is backed up by
the use of gold related terminology such as “mining” for the creation of new
bitcoins. From reviewing the literature on the topic I find that generally the role
gold plays in financial markets is as a hedge or a safe haven during periods of
market turbulence. I argue that in theory bitcoin could play the same role due
to its exogeneity to the established network of markets and financial
institutions. The investigation of correlations between asset classes is of
importance as it can benefit market participants in guiding and informing their
investment strategies. As bitcoin continues to grow it may play a greater role
in investor’s portfolios as a low cost alternative to gold.
Empirically I find that bitcoin is not a hedge or a safe haven for US equity
markets and is positively correlated with stock returns for every model
estimated, however, all of the coefficients are small and none of the estimates
are statistically significant suggesting a weak relationship. This indicates that
bitcoin may play a role as a diversifier. For EU equity markets three out of the
four coefficients estimated indicate a negative relationship between bitcoin
and stock returns. This suggests that bitcoin could play a hedge role however
none of the estimates are statistically significant. In addition bitcoin is
positively correlated with extreme negative returns on EU equities indicating it
is not a safe haven. The lack of statistical significance and the small size of all
estimated coefficients indicate that bitcoin returns are orthogonal to equity
returns.
34
For the US bond market I find that bitcoin is a hedge as it is positively
correlated with bond yields in all of the models estimated. In addition, it may
serve as a safe haven for the most extreme periods of spikes in yields
(represented by the 95% quantile). The results of the models estimated for
European markets consistently show that bitcoin is a hedge and a safe haven
for bonds. The coefficient estimates for the effect of changes in bond yields
on bitcoin returns are small suggesting a weak relationship between the two
markets. Therefore I find that bitcoin may serve as a hedge against falling
bond markets. This may be due to the inflation protection that the deflationary
bitcoin can afford; however, a longer sample would be needed to test this
idea given that over the lifetime of the virtual currency interest rates and
inflation have been at consistently low levels.
For currency markets, the coefficient estimates representing bitcoin’s
relationship with the dollar are consistently positive and those with the euro
are consistently negative. This implies that bitcoin could serve as a hedge
against euro devaluations, but is not a hedge against the dollar. I also find
that bitcoin may play a safe haven role for extreme negative returns on the
dollar but does not play the same role for the euro. In fact bitcoin has a strong
positive correlation with extreme euro devaluations (as measured by the 5%
quantile). It is interesting to note that the estimated coefficients for the
currency markets, whilst not all significant, are consistently larger than those
representing equity and bond markets. This is supportive of the idea that
bitcoin is a monetary asset, which is a similarity that it shares with gold.
My main conclusion from estimation is that for the sample tested bitcoin
returns appear for the most part to be relatively statistically independent of
equity and bond markets. Where there is a statistically significant relationship
the size of the estimated coefficients is generally small indicating a weak
relationship. Stronger relationships appear to exist with currency markets but
the lack of consistently significant estimates is a major issue. I therefore fail to
reject the null hypothesis that as an asset, bitcoin does not behave like gold,
given that for the sample tested bitcoin returns appear to be relatively
orthogonal to returns on stocks, bonds and the dollar.

35
It is important to note that as bitcoin has only been in existence for a number
of years, its relationships with other markets are more volatile than those
between more mature asset classes. These correlations are based on capital
flows across markets and are often learned over time. If bitcoin adoption
continues at the current rate and a clear regulatory framework is put in place,
it is likely that more institutional investors will enter the market, strengthening
the correlations between bitcoin and other more traditional investment
markets. Future research could focus on the dynamic nature of these
correlations, perhaps using a similar methodology as that pursued by Ciner,
Gurdgiev et al. (2010, revised 2012).
The small sample size was one of the major issues I faced in my empirical
study of the virtual currency. Despite this problem I feel that this dissertation
was worthwhile as a primary investigation of the relationship between bitcoin
and more established markets. In addition it is important to note that the
period since bitcoin’s inception has been one of changing correlations even
across well established markets due to the unprecedented level of
unconventional monetary policy, which no doubt has also had some effect on
the bitcoin market. Future research could extend the data examined not only
through time but also across more markets. For the Eurozone in particular it
may be interesting to examine the effect of changes in the spread between
core and periphery bond yields on bitcoin, as these are likely to better
represent negative shocks to the European bond market.
36
References
Archer, P., G. Schvey, J. Schvey and J. Stacke (2013), ‘2013 Bitcoin Mid-
Year Review and Outlook’, The Genesis Block. Available from:
http://thegenesisblock.com/bitcoin-mid-year-review-and-outlook/
Asteriou, D., and S. Hall (2007), Applied Econometrics: A Modern Approach
using Eviews and Microfit. Published by: Palgrave Macmillan (London)
Batson, A. (2009), ‘China takes aim at the dollar’, Wall Street Journal, (March
24, 2009). Available from:
http://online.wsj.com/article/SB123780272456212885.html
Baur, D., and B. Lucey (2010), ‘Is gold a hedge or a safe haven? An analysis
of stocks, bonds and gold.’ Financial Review 45.2: 217-229. Available from:
http://onlinelibrary.wiley.com/doi/10.1111/j.1540-6288.2010.00244.x/full
Bitcoin Charts, Available at: http://bitcoincharts.com/
Blose, L. (2010), ‘Gold Prices, Cost of Carry, and Expected Inflation’, Journal
of Economics and Business 62(1): 35-47.
Capie, F., C. Mills and G. Wood (2005), ‘Gold as a Hedge against the Dollar.’
Journal of International Financial Markets. Available from:
http://ejournal.narotama.ac.id/files/Gold%20as%20a%20hedge%20against%2
0the%20dollar.pdf
Ciner, C., C. Gurdgiev and B. Lucey (2010; Revised 2012), ‘Hedges and Safe
Havens – An Examination of Stocks, Bonds, Oil, Gold and the Dollar.’ Bonds,
Oil, Gold and the Dollar. Available from:
http://papers.ssrn.com/sol3/papers.cfm?abstract_id=1679243
Christin, C., and T. Moore (2013), ‘Beware the Middleman: Empirical Analysis
of Bitcoin-Exchange Risk.’ Available from: http://fc13.ifca.ai/proc/1-2.pdf
ECB (2012), ‘Virtual Currency Schemes’. Available from:
http://www.ecb.int/pub/pdf/other/virtualcurrencyschemes201210en.pdf

37
Fortune, J. (1987), ‘The Inflation Rate of the Price of Gold, Expected Prices
and Interest Rates’, Journal of Macroeconomics 9(1): 71-82.
GAO (2013), ‘Virtual Economies and Currencies – Additional IRS Guidance
Could Reduce Tax Compliance Risks’. Available from:
http://www.gao.gov/assets/660/654620.pdf
Ghosh, D., E. Levin, P. Macmillan and R. Wright (2004), ‘Gold as an Inflation
Hedge’, Studies in Economics and Finance 22: 1-25.
Grinberg, R. (2011), ‘Bitcoin: An Innovative Alternative Digital Currency’,
Hastings Sci. & Tech. LJ 4: 159. Available from:
http://heinonline.org/HOL/Page?handle=hein.journals/hascietlj4&div=6&g_sen
t=1&collection=journals
Hammoudeh, S., R. Sari and B. Ewing (2009), ‘Relationships among strategic
commodities and with financial variables: A new look’, Contemporary
Economic Policy 27(2): 251-264.
Hill, R., W. Griffiths and G. Lim (2012), Principles of Econometrics (4th
Edition). Published by: John Wiley & Sons (Asia)
http://bitcoin.org/
Johnson, R., and L. Soenen (1997), ‘Gold as an investment asset -
perspectives from different countries’, Journal of Investing 6(3): 94-99.
Lucey, B. (2011), ‘What do academics think they know about gold.’ The
Alchemist 62: 12-14. Available from:
http://www.lbma.org.uk/assets/Alch6203Lucey.pdf
Moore, G. (1990), ‘Gold Prices as a Leading Index of Inflation’, Challenge 33:
52-56.
Nakamoto, S. (2009), ‘Bitcoin: A Peer-to-Peer Electronic Cash System’.
Available from: http://bitcoin.org/bitcoin.pdf
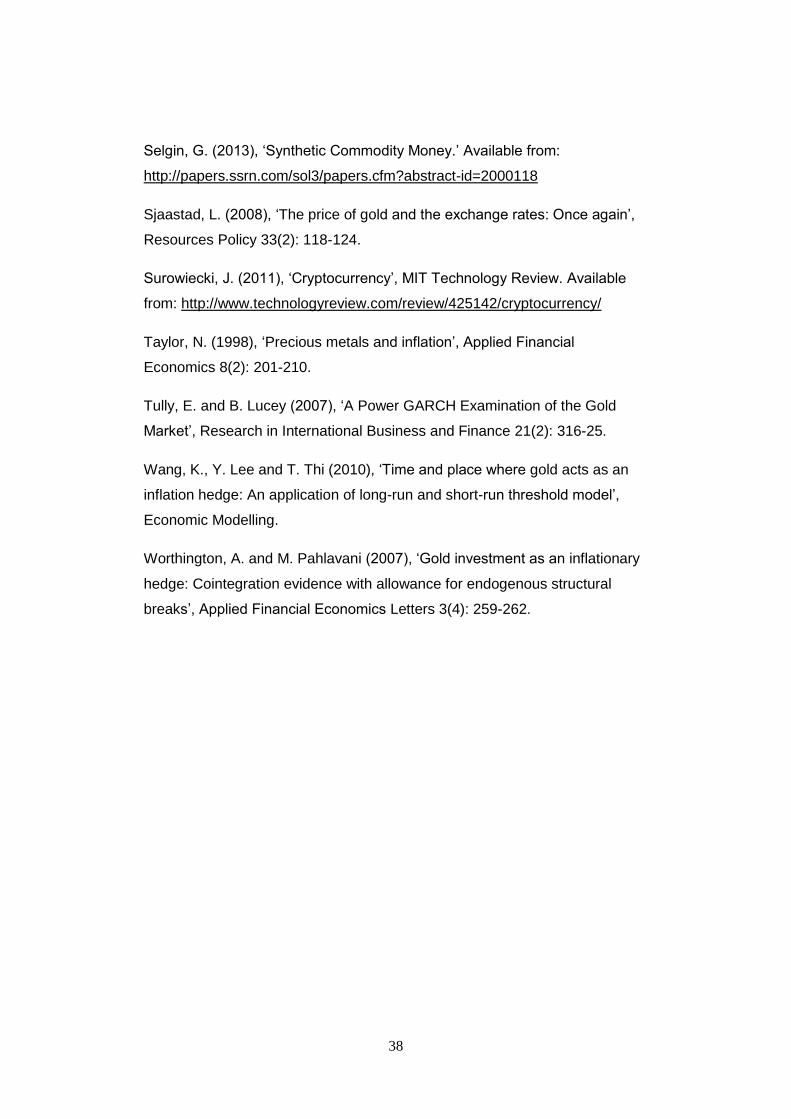
38
Selgin, G. (2013), ‘Synthetic Commodity Money.’ Available from:
http://papers.ssrn.com/sol3/papers.cfm?abstract-id=2000118
Sjaastad, L. (2008), ‘The price of gold and the exchange rates: Once again’,
Resources Policy 33(2): 118-124.
Surowiecki, J. (2011), ‘Cryptocurrency’, MIT Technology Review. Available
from: http://www.technologyreview.com/review/425142/cryptocurrency/
Taylor, N. (1998), ‘Precious metals and inflation’, Applied Financial
Economics 8(2): 201-210.
Tully, E. and B. Lucey (2007), ‘A Power GARCH Examination of the Gold
Market’, Research in International Business and Finance 21(2): 316-25.
Wang, K., Y. Lee and T. Thi (2010), ‘Time and place where gold acts as an
inflation hedge: An application of long-run and short-run threshold model’,
Economic Modelling.
Worthington, A. and M. Pahlavani (2007), ‘Gold investment as an inflationary
hedge: Cointegration evidence with allowance for endogenous structural
breaks’, Applied Financial Economics Letters 3(4): 259-262.

39
Appendix
FIGURE 1: VOLUME OF BITCOIN TRADED BY CURRENCY
Source: www.bitcoincharts.com
TABLE 5: AVG DAILY VOLUME TRADED BY CURRENCY
Vol. in Bitcoin25 as a %
Total 53,579.86
USD 41,257.52 77.00%
EUR 4,494.64 8.39%
CNY 3,405.23 6.36%
AUD 938.74 1.75%
GBP 655.84 1.22%
Source: www.bitcoincharts.com
25
Calculated as a 15-day EMA of volumes traded for top five most commonly exchanged
currencies.
-
50,000.00
100,000.00
150,000.00
200,000.00
250,000.00
300,000.00
350,000.00
-
5,000
10,000
15,000
20,000
25,000
30,000
35,000
EUR CNY AUD GBP USD (right axis)
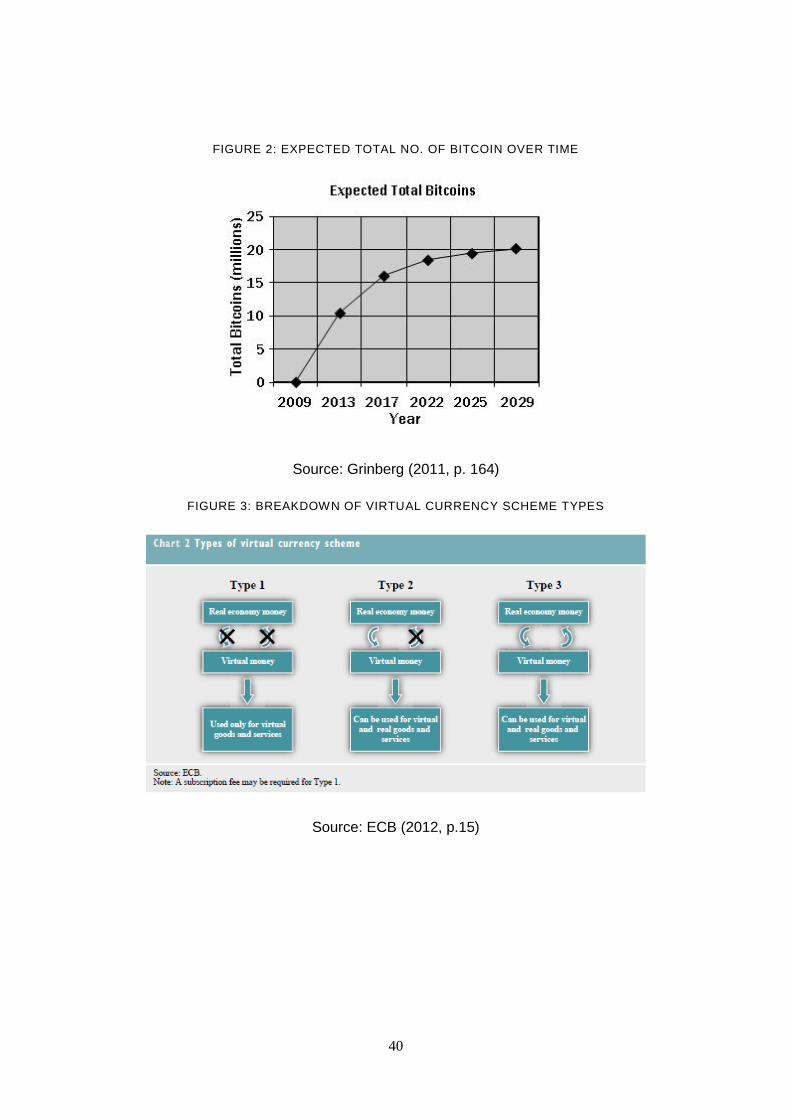
40
FIGURE 2: EXPECTED TOTAL NO. OF BITCOIN OVER TIME
Source: Grinberg (2011, p. 164)
FIGURE 3: BREAKDOWN OF VIRTUAL CURRENCY SCHEME TYPES
Source: ECB (2012, p.15)

41
FIGURE 4: ILLUSTRATION OF BITCOIN TRANSACTIONS
Source: ECB (2012, p. 23)
FIGURE 5: PLOT OF BITCOIN PRICE (LINEAR SCALE)
Source: www.bitcoincharts.com
0
40
80
120
160
200
240
III IV I II III IV I II III IV I II
2010 2011 2012 2013
Bitcoin
42
FIGURE 6: PLOT OF BITCOIN PRICE (LOGARITHMIC SCALE)
Source: www.bitcoincharts.com
FIGURE 7: PLOT OF S&P 500 INDEX LEVEL
400.00
40.00
4.00
0.40
0.04
III IV I II III IV I II III IV I II
2010 2011 2012 2013
Bitcoin
1,000
1,100
1,200
1,300
1,400
1,500
1,600
1,700
III IV I II III IV I II III IV I II
2010 2011 2012 2013
S&P 500
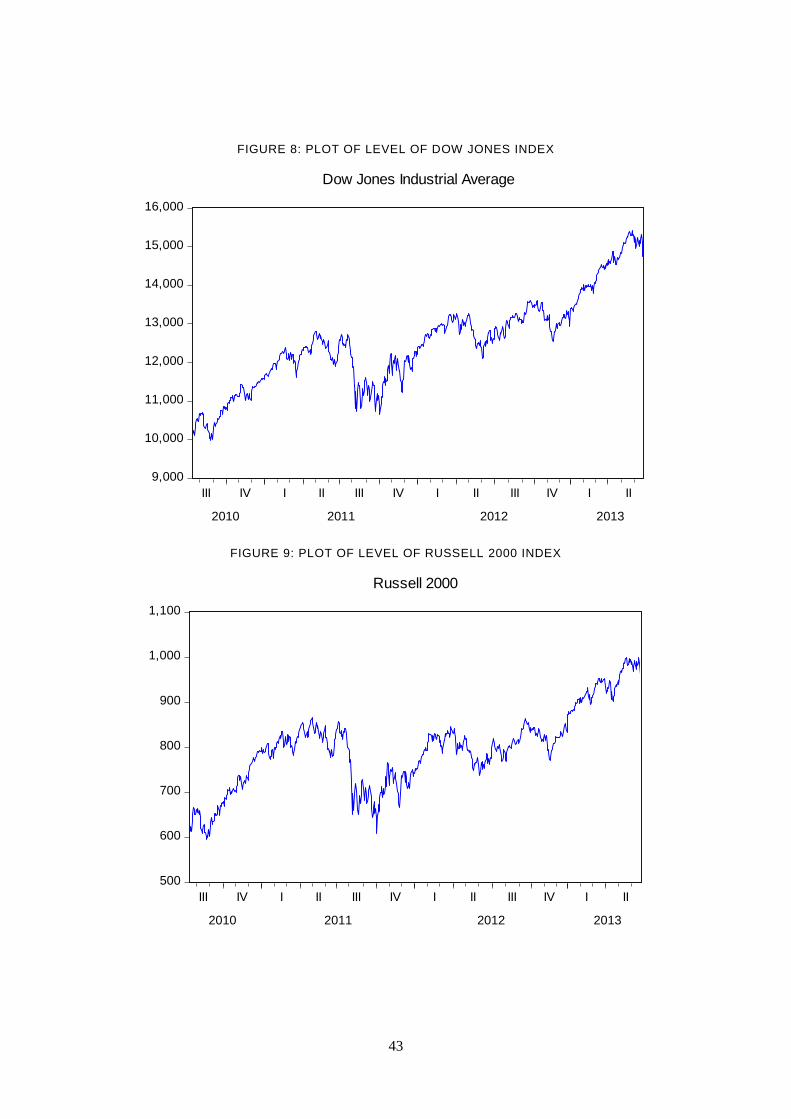
43
FIGURE 8: PLOT OF LEVEL OF DOW JONES INDEX
FIGURE 9: PLOT OF LEVEL OF RUSSELL 2000 INDEX
9,000
10,000
11,000
12,000
13,000
14,000
15,000
16,000
III IV I II III IV I II III IV I II
2010 2011 2012 2013
Dow Jones Industrial Average
500
600
700
800
900
1,000
1,100
III IV I II III IV I II III IV I II
2010 2011 2012 2013
Russell 2000

44
FIGURE 10: PLOT OF US GOVERNMENT TEN YEAR BOND YIELD
FIGURE 11: PLOT OF US 10 YEAR YIELD (LEFT AXIS) AND S&P 500 (RIGHT
AXIS)
1.0
1.5
2.0
2.5
3.0
3.5
4.0
III IV I II III IV I II III IV I II
2010 2011 2012 2013
US Government Ten Year Bond Yield
1.0
1.5
2.0
2.5
3.0
3.5
4.0
1,000
1,200
1,400
1,600
1,800
III IV I II III IV I II III IV I II
2010 2011 2012 2013
US Government Ten Year Bond Yield
S&P 500
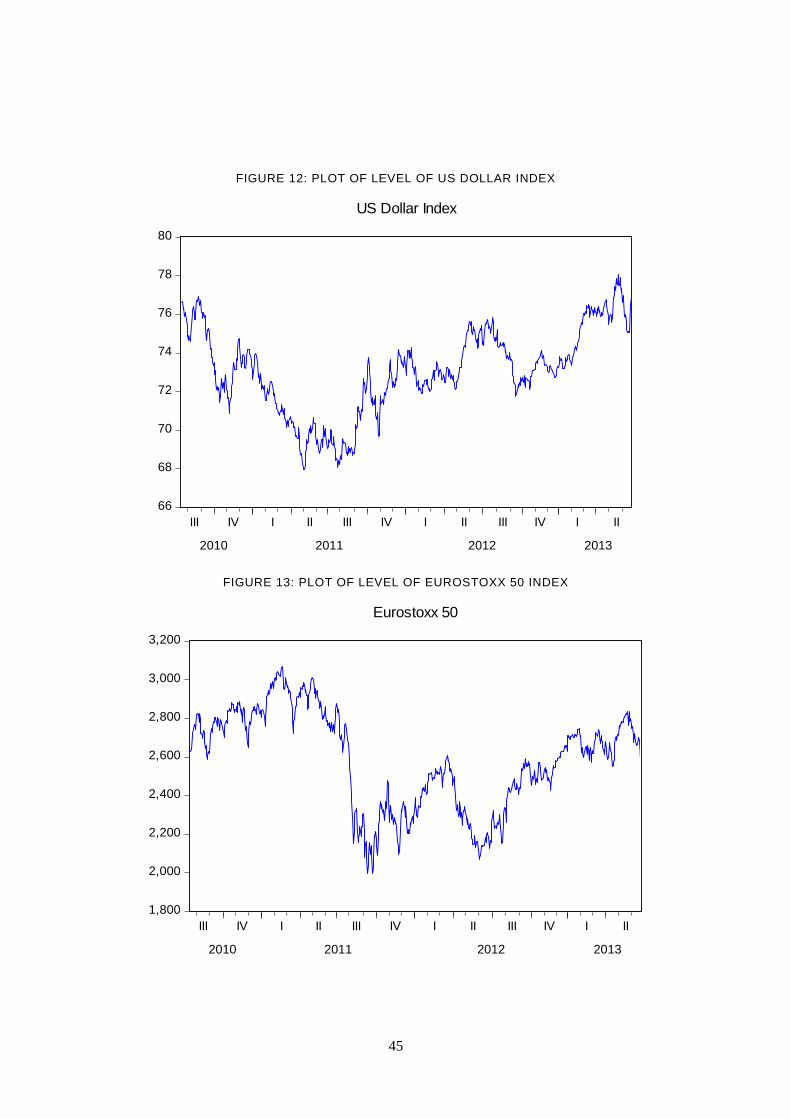
45
FIGURE 12: PLOT OF LEVEL OF US DOLLAR INDEX
FIGURE 13: PLOT OF LEVEL OF EUROSTOXX 50 INDEX
66
68
70
72
74
76
78
80
III IV I II III IV I II III IV I II
2010 2011 2012 2013
US Dollar Index
1,800
2,000
2,200
2,400
2,600
2,800
3,000
3,200
III IV I II III IV I II III IV I II
2010 2011 2012 2013
Eurostoxx 50

46
FIGURE 14: PLOT OF LEVEL OF GERMAN DAX INDEX
FIGURE 15: PLOT OF GERMAN GOVERNMENT TEN YEAR BOND YIELD
5,000
5,500
6,000
6,500
7,000
7,500
8,000
8,500
9,000
III IV I II III IV I II III IV I II
2010 2011 2012 2013
Dax
1.0
1.5
2.0
2.5
3.0
3.5
4.0
III IV I II III IV I II III IV I II
2010 2011 2012 2013
German Government Ten Year Bond Yield

47
FIGURE 16: PLOT OF LEVEL OF EURO CURRENCY INDEX
TABLE 6: DESCRIPTIVE STATISTICS FOR US MARKET DATA
S&P 500 DJIA Russell USTY USDX
Mean 0.0006 0.0005 0.0006 -0.0002 0.0000
Median 0.0007 0.0007 0.0014 -0.0019 0.0000
Maximum 0.0463 0.0415 0.0671 0.1053 0.0214
Minimum -0.0690 -0.0571 -0.0933 -0.0988 -0.0176
Std. Dev. 0.0111 0.0100 0.0156 0.0273 0.0045
Skewness -0.4728 -0.4669 -0.2907 0.0978 0.2847
Kurtosis 7.6499 7.1520 6.9031 3.8764 4.7916
Jarque-Bera 672.66 541.07 465.21 24.08 105.58
Probability 0.0000 0.0000 0.0000 0.0000 0.0000
Sum 0.3964 0.3767 0.4523 -0.1544 0.0036
Sum Sq. Dev. 0.0875 0.0715 0.1734 0.5336 0.0144
Observations 717 717 717 717 717
90
92
94
96
98
100
102
104
III IV I II III IV I II III IV I II
2010 2011 2012 2013
Euro Currency Index
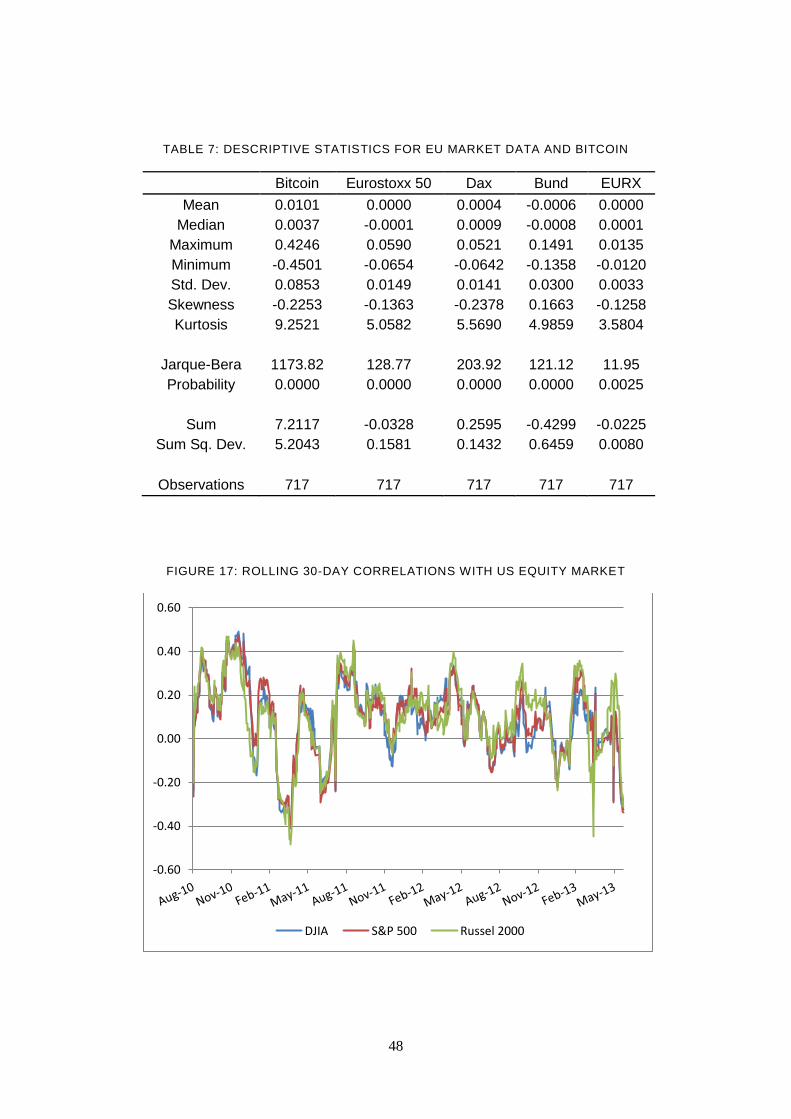
48
TABLE 7: DESCRIPTIVE STATISTICS FOR EU MARKET DATA AND BITCOIN
Bitcoin Eurostoxx 50 Dax Bund EURX
Mean 0.0101 0.0000 0.0004 -0.0006 0.0000
Median 0.0037 -0.0001 0.0009 -0.0008 0.0001
Maximum 0.4246 0.0590 0.0521 0.1491 0.0135
Minimum -0.4501 -0.0654 -0.0642 -0.1358 -0.0120
Std. Dev. 0.0853 0.0149 0.0141 0.0300 0.0033
Skewness -0.2253 -0.1363 -0.2378 0.1663 -0.1258
Kurtosis 9.2521 5.0582 5.5690 4.9859 3.5804
Jarque-Bera 1173.82 128.77 203.92 121.12 11.95
Probability 0.0000 0.0000 0.0000 0.0000 0.0025
Sum 7.2117 -0.0328 0.2595 -0.4299 -0.0225
Sum Sq. Dev. 5.2043 0.1581 0.1432 0.6459 0.0080
Observations 717 717 717 717 717
FIGURE 17: ROLLING 30-DAY CORRELATIONS WITH US EQUITY MARKET
-0.60
-0.40
-0.20
0.00
0.20
0.40
0.60
DJIA S&P 500 Russel 2000

49
FIGURE 18: ROLLING 30-DAY CORRELATIONS WITH EU EQUITY MARKET
FIGURE 19: ROLLING 30-DAY CORRELATIONS WITH BOND YIELDS
-0.60
-0.40
-0.20
0.00
0.20
0.40
0.60
Eurostoxx 50 Dax
-0.60
-0.40
-0.20
0.00
0.20
0.40
0.60
USTY GTY

50
FIGURE 20: ROLLING 30-DAY CORRELATIONS WITH CURRENCY MARKETS
TABLE 8: SUMMARY STATISTICS FOR ROLLING 30-DAY CORRELATIONS
Obsv. Mean Std. Dev. Maximum Minimum
S&P 500 688 0.0933 0.1691 0.4685 -0.4060
DJIA 688 0.0862 0.1678 0.4890 -0.4109
Russell 688 0.1022 0.1750 0.4677 -0.4844
USTY 688 0.0679 0.1706 0.4990 -0.4467
USDX 688 -0.0541 0.1804 0.3431 -0.5379
Eurostoxx 50 688 0.0687 0.1697 0.5378 -0.3803
Dax 688 0.0680 0.1953 0.5427 -0.3369
Bund 688 0.0759 0.1540 0.3708 -0.4452
EURX 688 0.0535 0.1901 0.5013 -0.5442
-0.6000
-0.4000
-0.2000
0.0000
0.2000
0.4000
0.6000
USDX EURX

51
TABLE 9: RESULT OF GARCH, T-GARCH AND IGARCH ESTIMATION FOR MODEL 1.1 US MARKET (S&P 500)
S&P 500
Bitcoin Coeff. est. Std. err. t -stat P -value Coeff. est. Std. err. t -stat P -value Coeff. est. Std. err. t -stat P -value
0.0022 0.0007 3.3202 0.0009 0.0021 0.0006 3.4680 0.0005 0.0020 0.0006 3.1407 0.0017
0.0771 0.0823 0.9367 0.3489 0.1317 0.0764 1.7234 0.0848 0.1341 0.0898 1.4936 0.1353
* 0.0481 0.0286 1.6831 0.0924 0.0334 0.0313 1.0677 0.2857 0.0309 0.0298 1.0383 0.2991
0.2979 0.2133 1.3970 0.1624 0.4158 0.1999 2.0807 0.0375 0.4426 0.1439 3.0766 0.0021
Variance Equation
0.0001 0.0000 2.0588 0.0395 0.0001 0.0000 1.7691 0.0769 - - - -
0.3232 0.0724 4.4668 0.0000 0.3354 0.0797 4.2068 0.0000 0.1475 0.0138 10.7088 0.0000
0.7559 0.0339 22.2653 0.0000 0.7942 0.0291 27.2872 0.0000 0.8525 0.0138 61.9093 0.0000
- - - - -0.1528 0.0840 -1.8185 0.0690 - - - -
GED Par. 0.7542 0.0462 16.3317 0.0000 0.7526 0.0452 16.6615 0.0000 0.7938 0.0411 19.3246 0.0000
Information Criterion
Akaike -2.8812 -2.8842 -2.8536
Schw artz -2.8302 -2.8268 -2.8153
Log-Likelihood 1040.92 1043.00 1029.02
Durbin-Watson 1.760203 1.75896 1.7584
GARCH (1, 1) T-GARCH IGARCH

52
TABLE 10: RESULT OF GARCH, T-GARCH AND IGARCH ESTIMATION FOR MODEL 1.2 US MARKET (DOW JONES)
Dow Jones
Bitcoin Coeff. est. Std. err. t -stat P -value Coeff. est. Std. err. t -stat P -value Coeff. est. Std. err. t -stat P -value
0.0021 0.0006 3.5240 0.0004 0.0021 0.0006 3.2873 0.0010 0.0021 0.0006 3.4894 0.0005
0.1228 0.0861 1.4262 0.1538 0.1383 0.0480 2.8824 0.0039 0.1193 0.0790 1.5104 0.1309
* 0.0367 0.0276 1.3322 0.1828 0.0343 0.0217 1.5841 0.1132 0.0357 0.0278 1.2855 0.1986
0.3768 0.1964 1.9186 0.0550 0.4042 0.2049 1.9728 0.0485 0.3669 0.1611 2.2779 0.0227
Variance Equation
0.0001 0.0000 1.9751 0.0483 0.0001 0.0000 1.7568 0.0789 - - - -
0.3164 0.0710 4.4558 0.0000 0.3453 0.0825 4.1848 0.0000 0.1467 0.0136 10.7773 0.0000
0.7630 0.0331 23.0262 0.0000 0.7917 0.0294 26.9513 0.0000 0.8533 0.0136 62.7094 0.0000
- - - - -0.1598 0.0863 -1.8528 0.0639 - - - -
GED Par. 0.7447 0.0457 16.3057 0.0000 0.7535 0.0460 16.3869 0.0000 0.8015 0.0415 19.3264 0.0000
Information Criterion
Akaike -2.8820 -2.8847 -2.8536
Schw artz -2.8310 -2.8273 -2.8154
Log-Likelihood 1041.21 1043.16 1029.03
Durbin-Watson 1.7596 1.7595 1.7597
GARCH (1, 1) T-GARCH IGARCH

53
TABLE 11: RESULT OF GARCH, T-GARCH AND IGARCH ESTIMATION FOR MODEL 1.3 US MARKET (RUSSELL 2000)
Russell 2000
Bitcoin Coeff. est. Std. err. t -stat P -value Coeff. est. Std. err. t -stat P -value Coeff. est. Std. err. t -stat P -value
0.0026 0.0007 3.5947 0.0003 0.0020 0.0007 3.0691 0.0021 0.0021 0.0006 3.4847 0.0005
0.0749 0.0733 1.0221 0.3067 0.0791 0.0700 1.1304 0.2583 0.0750 0.0670 1.1198 0.2628
* 0.0228 0.0319 0.7124 0.4762 0.0342 0.0321 1.0649 0.2869 0.0526 0.0273 1.9225 0.0545
0.2961 0.2079 1.4241 0.1544 0.3271 0.2058 1.5892 0.1120 0.4314 0.1814 2.3784 0.0174
Variance Equation
0.0001 0.0000 2.0065 0.0448 0.0001 0.0000 1.7640 0.0777 - - - -
0.3158 0.0692 4.5613 0.0000 0.3509 0.0841 4.1746 0.0000 0.1464 0.0137 10.6842 0.0000
0.7599 0.0328 23.1889 0.0000 0.7896 0.0296 26.7201 0.0000 0.8536 0.0137 62.3084 0.0000
- - - - -0.1667 0.0877 -1.9014 0.0573 - - - -
GED Par. 0.7584 0.0461 16.4644 0.0000 0.7512 0.0457 16.4531 0.0000 0.7963 0.0415 19.2012 0.0000
Information Criterion
Akaike -2.8792 -2.8825 -2.8522
Schw artz -2.8282 -2.8250 -2.8139
Log-Likelihood 1040.21 1042.36 1028.51
Durbin-Watson 1.7605 1.7583 1.7581
GARCH (1, 1) T-GARCH IGARCH

54
TABLE 12: RESULT OF GARCH, T-GARCH AND IGARCH ESTIMATION FOR MODEL 1.1 EU MARKET (EUROSTOXX 50)
Eurostoxx
50
Bitcoin Coeff. est. Std. err. t -stat P -value Coeff. est. Std. err. t -stat P -value Coeff. est. Std. err. t -stat P -value
0.0035 0.0007 4.9032 0.0000 0.0035 0.0008 4.6944 0.0000 0.0033 0.0006 5.4809 0.0000
-0.0660 0.0414 -1.5940 0.1109 -0.0546 0.0712 -0.7674 0.4429 -0.0529 0.0537 -0.9842 0.3250
* 0.1645 0.0292 5.6366 0.0000 0.1166 0.0311 3.7514 0.0002 0.1391 0.0241 5.7788 0.0000
-0.2184 0.2318 -0.9422 0.3461 0.2184 0.2590 0.8431 0.3992 -0.4251 0.2021 -2.1033 0.0354
Variance
Equation
0.0001 0.0000 2.1058 0.0352 0.0001 0.0000 1.9475 0.0515 - - - -
0.3034 0.0701 4.3309 0.0000 0.3371 0.0800 4.2127 0.0000 0.1460 0.0139 10.4917 0.0000
0.7651 0.0341 22.4195 0.0000 0.7907 0.0295 26.8389 0.0000 0.8540 0.0139 61.3557 0.0000
- - - - -0.1553 0.0826 -1.8802 0.0601 - - - -
GED Par. 0.7494 0.0461 16.2675 0.0000 0.7745 0.0465 16.6697 0.0000 0.7963 0.0410 19.4034 0.0000
Information
Criterion
Akaike -2.8846 -2.8861 -2.8554
Schw artz -2.8336 -2.8287 -2.8171
Log-
Likelihood 1042.14 1043.66 1029.66
Durbin-
Watson 1.7661 1.7666 1.7655
GARCH (1, 1) T-GARCH IGARCH

55
TABLE 13: RESULT OF GARCH, T-GARCH AND IGARCH ESTIMATION FOR MODEL 1.2 EU MARKET (DAX)
Dax
Bitcoin Coeff. est. Std. err. t -stat P -value Coeff. est. Std. err. t -stat P -value Coeff. est. Std. err. t -stat P -value
0.0033 0.0007 4.4617 0.0000 0.0031 0.0008 4.0244 0.0001 0.0035 0.0006 5.4355 0.0000
0.0539 0.0792 0.6804 0.4962 0.0998 0.0751 1.3287 0.1840 -0.0231 0.0443 -0.5212 0.6022
* 0.0693 0.0277 2.5031 0.0123 0.0759 0.0328 2.3139 0.0207 0.1315 0.0236 5.5799 0.0000
0.2027 0.2434 0.8328 0.4050 0.1335 0.2180 0.6124 0.5403 -0.4000 0.2072 -1.9306 0.0535
Variance
Equation
0.0001 0.0000 2.1375 0.0326 0.0001 0.0000 2.0051 0.0450 - - - -
0.3136 0.0706 4.4398 0.0000 0.3355 0.0796 4.2152 0.0000 0.1472 0.0139 10.5917 0.0000
0.7583 0.0342 22.1958 0.0000 0.7878 0.0298 26.4346 0.0000 0.8528 0.0139 61.3431 0.0000
- - - - -0.1499 0.0829 -1.8087 0.0705 - - - -
GED Par. 0.7612 0.0469 16.2182 0.0000 0.7784 0.0469 16.5974 0.0000 0.8019 0.0416 19.2707 0.0000
Information
Criterion
Akaike -2.8829 -2.8848 -2.8543
Schw artz -2.8319 -2.8274 -2.8161
Log-
Likelihood 1041.52 1043.21 1029.28
Durbin-
Watson 1.7658 1.7649 1.7662
GARCH (1, 1) T-GARCH IGARCH
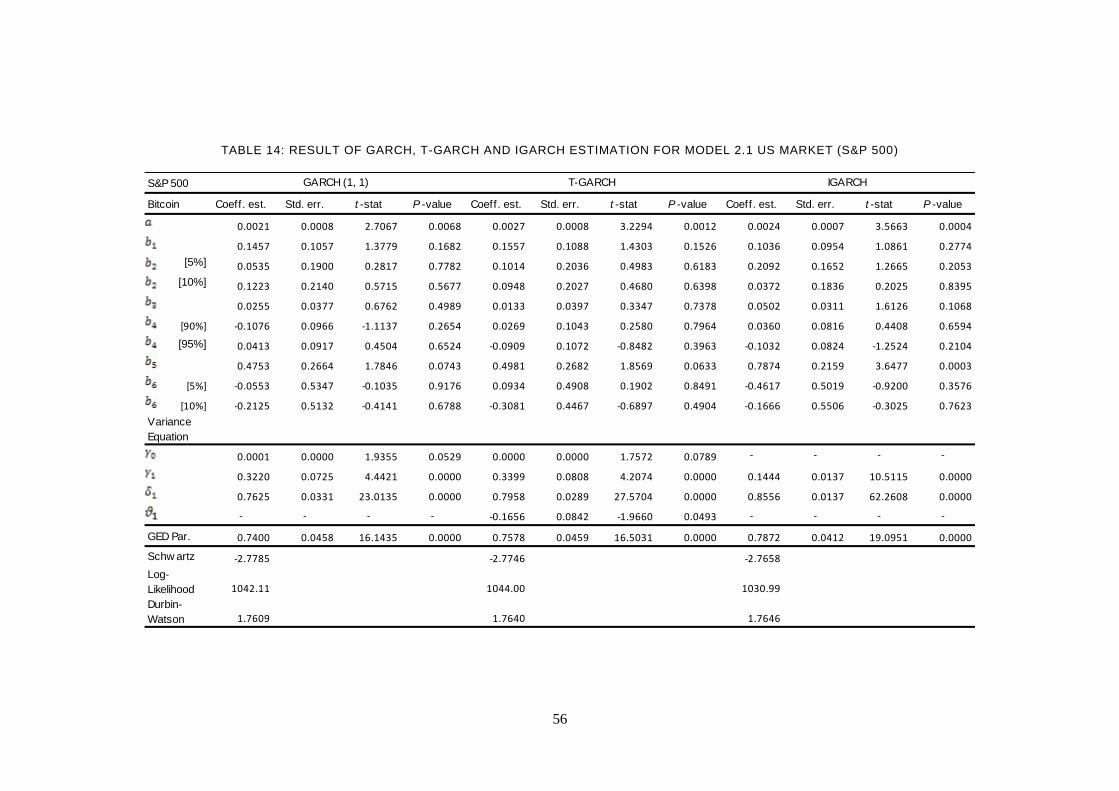
56
TABLE 14: RESULT OF GARCH, T-GARCH AND IGARCH ESTIMATION FOR MODEL 2.1 US MARKET (S&P 500)
S&P 500
Bitcoin Coeff. est. Std. err. t -stat P -value Coeff. est. Std. err. t -stat P -value Coeff. est. Std. err. t -stat P -value
0.0021 0.0008 2.7067 0.0068 0.0027 0.0008 3.2294 0.0012 0.0024 0.0007 3.5663 0.0004
0.1457 0.1057 1.3779 0.1682 0.1557 0.1088 1.4303 0.1526 0.1036 0.0954 1.0861 0.2774
[5%] 0.0535 0.1900 0.2817 0.7782 0.1014 0.2036 0.4983 0.6183 0.2092 0.1652 1.2665 0.2053
[10%] 0.1223 0.2140 0.5715 0.5677 0.0948 0.2027 0.4680 0.6398 0.0372 0.1836 0.2025 0.8395
0.0255 0.0377 0.6762 0.4989 0.0133 0.0397 0.3347 0.7378 0.0502 0.0311 1.6126 0.1068
[90%] -0.1076 0.0966 -1.1137 0.2654 0.0269 0.1043 0.2580 0.7964 0.0360 0.0816 0.4408 0.6594
[95%] 0.0413 0.0917 0.4504 0.6524 -0.0909 0.1072 -0.8482 0.3963 -0.1032 0.0824 -1.2524 0.2104
0.4753 0.2664 1.7846 0.0743 0.4981 0.2682 1.8569 0.0633 0.7874 0.2159 3.6477 0.0003
[5%] -0.0553 0.5347 -0.1035 0.9176 0.0934 0.4908 0.1902 0.8491 -0.4617 0.5019 -0.9200 0.3576
[10%] -0.2125 0.5132 -0.4141 0.6788 -0.3081 0.4467 -0.6897 0.4904 -0.1666 0.5506 -0.3025 0.7623
Variance
Equation
0.0001 0.0000 1.9355 0.0529 0.0000 0.0000 1.7572 0.0789 - - - -
0.3220 0.0725 4.4421 0.0000 0.3399 0.0808 4.2074 0.0000 0.1444 0.0137 10.5115 0.0000
0.7625 0.0331 23.0135 0.0000 0.7958 0.0289 27.5704 0.0000 0.8556 0.0137 62.2608 0.0000
- - - - -0.1656 0.0842 -1.9660 0.0493 - - - -
GED Par. 0.7400 0.0458 16.1435 0.0000 0.7578 0.0459 16.5031 0.0000 0.7872 0.0412 19.0951 0.0000
Schw artz -2.7785 -2.7746 -2.7658
Log-
Likelihood 1042.11 1044.00 1030.99
Durbin-
Watson 1.7609 1.7640 1.7646
GARCH (1, 1) T-GARCH IGARCH

57
TABLE 15: RESULT OF GARCH, T-GARCH AND IGARCH ESTIMATION FOR MODEL 2.2 US MARKET (DOW JONES)
Dow Jones
Bitcoin Coeff. est. Std. err. t -stat P -value Coeff. est. Std. err. t -stat P -value Coeff. est. Std. err. t -stat P -value
0.0039 0.0009 4.4855 0.0000 0.0042 0.0010 4.0582 0.0000 0.0036 0.0009 3.9985 0.0001
0.0189 0.0821 0.2307 0.8176 -0.0296 0.1355 -0.2187 0.8269 -0.0102 0.1259 -0.0814 0.9351
[5%] 0.1099 0.1631 0.6738 0.5004 0.0792 0.2438 0.3249 0.7452 0.1384 0.2256 0.6136 0.5395
[10%] 0.3289 0.1670 1.9697 0.0489 0.3365 0.2810 1.1974 0.2311 0.3237 0.2588 1.2509 0.2110
0.0218 0.0318 0.6865 0.4924 0.0315 0.0431 0.7320 0.4642 0.0444 0.0302 1.4717 0.1411
[90%] -0.1134 0.0979 -1.1582 0.2468 0.0663 0.1045 0.6344 0.5258 0.0628 0.0809 0.7761 0.4377
[95%] 0.0630 0.0960 0.6563 0.5116 -0.0611 0.1099 -0.5557 0.5784 -0.1097 0.0899 -1.2207 0.2222
0.5140 0.2532 2.0302 0.0423 0.1864 0.2934 0.6353 0.5253 0.6985 0.2130 3.2792 0.0010
[5%] -0.4104 0.5420 -0.7571 0.4490 0.0562 0.3166 0.1774 0.8592 -0.6945 0.5190 -1.3382 0.1808
[10%] 0.2528 0.5395 0.4685 0.6394 0.1374 0.5777 0.2378 0.8120 0.2901 0.5839 0.4968 0.6193
Variance
Equation
0.0001 0.0000 2.0127 0.0441 0.0000 0.0000 1.8193 0.0689 - - - -
0.3119 0.0690 4.5183 0.0000 0.3229 0.0744 4.3409 0.0000 0.1438 0.0134 10.7274 0.0000
0.7652 0.0323 23.6605 0.0000 0.8024 0.0277 28.9756 0.0000 0.8562 0.0134 63.8596 0.0000
- - - - -0.1617 0.0774 -2.0881 0.0368 - - - -
GED Par. 0.7509 0.0465 16.1491 0.0000 0.7745 0.0466 16.6110 0.0000 0.7936 0.0414 19.1887 0.0000
Akaike -2.8711 -2.8719 -2.8447
Schw artz -2.7818 -2.7762 -2.7681
Log-
Likelihood 1043.29 1044.58 1031.81
Durbin-
Watson 1.7668 1.7687 1.7675
GARCH (1, 1) T-GARCH IGARCH
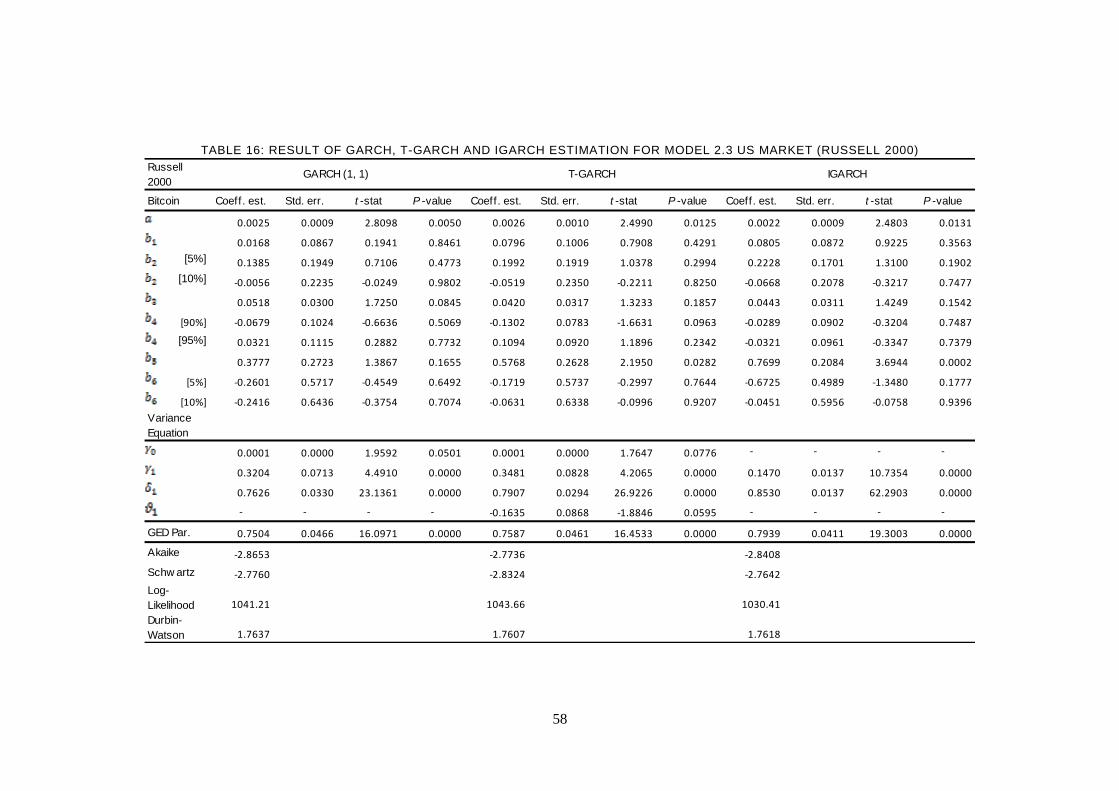
58
TABLE 16: RESULT OF GARCH, T-GARCH AND IGARCH ESTIMATION FOR MODEL 2.3 US MARKET (RUSSELL 2000)
Russell
2000
Bitcoin Coeff. est. Std. err. t -stat P -value Coeff. est. Std. err. t -stat P -value Coeff. est. Std. err. t -stat P -value
0.0025 0.0009 2.8098 0.0050 0.0026 0.0010 2.4990 0.0125 0.0022 0.0009 2.4803 0.0131
0.0168 0.0867 0.1941 0.8461 0.0796 0.1006 0.7908 0.4291 0.0805 0.0872 0.9225 0.3563
[5%] 0.1385 0.1949 0.7106 0.4773 0.1992 0.1919 1.0378 0.2994 0.2228 0.1701 1.3100 0.1902
[10%] -0.0056 0.2235 -0.0249 0.9802 -0.0519 0.2350 -0.2211 0.8250 -0.0668 0.2078 -0.3217 0.7477
0.0518 0.0300 1.7250 0.0845 0.0420 0.0317 1.3233 0.1857 0.0443 0.0311 1.4249 0.1542
[90%] -0.0679 0.1024 -0.6636 0.5069 -0.1302 0.0783 -1.6631 0.0963 -0.0289 0.0902 -0.3204 0.7487
[95%] 0.0321 0.1115 0.2882 0.7732 0.1094 0.0920 1.1896 0.2342 -0.0321 0.0961 -0.3347 0.7379
0.3777 0.2723 1.3867 0.1655 0.5768 0.2628 2.1950 0.0282 0.7699 0.2084 3.6944 0.0002
[5%] -0.2601 0.5717 -0.4549 0.6492 -0.1719 0.5737 -0.2997 0.7644 -0.6725 0.4989 -1.3480 0.1777
[10%] -0.2416 0.6436 -0.3754 0.7074 -0.0631 0.6338 -0.0996 0.9207 -0.0451 0.5956 -0.0758 0.9396
Variance
Equation
0.0001 0.0000 1.9592 0.0501 0.0001 0.0000 1.7647 0.0776 - - - -
0.3204 0.0713 4.4910 0.0000 0.3481 0.0828 4.2065 0.0000 0.1470 0.0137 10.7354 0.0000
0.7626 0.0330 23.1361 0.0000 0.7907 0.0294 26.9226 0.0000 0.8530 0.0137 62.2903 0.0000
- - - - -0.1635 0.0868 -1.8846 0.0595 - - - -
GED Par. 0.7504 0.0466 16.0971 0.0000 0.7587 0.0461 16.4533 0.0000 0.7939 0.0411 19.3003 0.0000
Akaike -2.8653 -2.7736 -2.8408
Schw artz -2.7760 -2.8324 -2.7642
Log-
Likelihood 1041.21 1043.66 1030.41
Durbin-
Watson 1.7637 1.7607 1.7618
GARCH (1, 1) T-GARCH IGARCH

59
TABLE 17: RESULT OF GARCH, T-GARCH AND IGARCH ESTIMATION FOR MODEL 2.1 EU MARKET (EUROSTOXX 50)
Eurostoxx
50
Bitcoin Coeff. est. Std. err. t -stat P -value Coeff. est. Std. err. t -stat P -value Coeff. est. Std. err. t -stat P -value
0.0036 0.0010 3.6733 0.0002 0.0034 0.0009 3.6309 0.0003 0.0032 0.0009 3.6748 0.0002
-0.0271 0.0629 -0.4300 0.6672 -0.0810 0.0858 -0.9451 0.3446 -0.0946 0.0848 -1.1162 0.2643
[5%] 0.2150 0.1379 1.5586 0.1191 0.2706 0.1247 2.1709 0.0299 0.3469 0.1353 2.5648 0.0103
[10%] 0.0022 0.1179 0.0183 0.9854 -0.1679 0.1355 -1.2392 0.2153 -0.2635 0.1164 -2.2643 0.0236
0.0501 0.0339 1.4777 0.1395 0.0369 0.0154 2.3976 0.0165 0.0098 0.0283 0.3457 0.7296
[90%] 0.0866 0.0635 1.3634 0.1728 0.1198 0.0881 1.3603 0.1737 0.1087 0.0667 1.6305 0.1030
[95%] 0.1205 0.0585 2.0594 0.0395 0.0581 0.0913 0.6370 0.5242 0.1069 0.0658 1.6251 0.1041
-0.3905 0.2419 -1.6140 0.1065 -0.0574 0.2138 -0.2683 0.7884 0.1110 0.2215 0.5011 0.6163
[5%] 0.7948 0.8037 0.9890 0.3227 -0.3490 0.7842 -0.4450 0.6563 -1.1442 0.5765 -1.9846 0.0472
[10%] 2.3765 0.9784 2.4290 0.0151 3.2482 0.9782 3.3207 0.0009 3.7800 0.7261 5.2059 0.0000
Variance
Equation
0.0001 0.0000 1.9729 0.0485 0.0000 0.0000 1.7584 0.0787 - - - -
0.3148 0.0723 4.3544 0.0000 0.3446 0.0811 4.2511 0.0000 0.1464 0.0139 10.5158 0.0000
0.7635 0.0340 22.4582 0.0000 0.7921 0.0294 26.9669 0.0000 0.8536 0.0139 61.3250 0.0000
- - - - -0.1545 0.0858 -1.8014 0.0716 - - - -
GED Par. 0.7392 0.0465 15.9050 0.0000 0.7511 0.0468 16.0525 0.0000 0.7968 0.0413 19.3047 0.0000
Akaike -2.8825 -2.8880 -2.8592
Schw artz -2.7932 -2.7923 -2.7826
Log-
Likelihood 1047.39 1050.36 1037.02
Durbin-
Watson 1.7556 1.7552 1.7548
GARCH (1, 1) T-GARCH IGARCH

60
TABLE 18: RESULT OF GARCH, T-GARCH AND IGARCH ESTIMATION FOR MODEL 2.1 EU MARKET (DAX)
Dax
Bitcoin Coeff. est. Std. err. t -stat P -value Coeff. est. Std. err. t -stat P -value Coeff. est. Std. err. t -stat P -value
0.0026 0.0009 2.9721 0.0030 0.0021 0.0008 2.5410 0.0111 0.0025 0.0008 3.2027 0.0014
-0.0012 0.0869 -0.0135 0.9892 0.0874 0.0701 1.2456 0.2129 0.0765 0.0726 1.0541 0.2918
[5%] 0.1491 0.2067 0.7215 0.4706 0.2819 0.1943 1.4507 0.1469 0.2859 0.2033 1.4061 0.1597
[10%] 0.3477 0.1440 2.4137 0.0158 0.0318 0.1402 0.2268 0.8206 -0.0003 0.1327 -0.0020 0.9984
0.0649 0.0388 1.6715 0.0946 0.0446 0.0281 1.5906 0.1117 0.0431 0.0321 1.3411 0.1799
[90%] 0.0823 0.0986 0.8342 0.4042 -0.0061 0.0650 -0.0943 0.9249 0.0620 0.0884 0.7014 0.4831
[95%] 0.0736 0.0936 0.7861 0.4318 0.1906 0.0720 2.6488 0.0081 0.1151 0.0833 1.3816 0.1671
-0.0457 0.2635 -0.1734 0.8623 -0.1969 0.2517 -0.7822 0.4341 -0.0155 0.2328 -0.0664 0.9470
[5%] -0.5668 0.7916 -0.7160 0.4740 -0.9871 0.6991 -1.4119 0.1580 -0.5845 0.7503 -0.7789 0.4360
[10%] 2.0739 0.9901 2.0947 0.0362 3.6083 0.9005 4.0069 0.0001 2.6151 0.9131 2.8640 0.0042
Variance
Equation
0.0001 0.0000 2.1536 0.0313 0.0001 0.0000 1.7326 0.0832 - - - -
0.3191 0.0725 4.4039 0.0000 0.3506 0.0836 4.1927 0.0000 0.1485 0.0139 10.6606 0.0000
0.7534 0.0353 21.3345 0.0000 0.7891 0.0302 26.1692 0.0000 0.8515 0.0139 61.1493 0.0000
- - - - -0.1561 0.0888 -1.7569 0.0789 - - - -
GED Par. 0.7580 0.0469 16.1508 0.0000 0.7448 0.0463 16.0715 0.0000 0.8030 0.0419 19.1819 0.0000
Akaike -2.8823 -2.8872 -2.8545
Schw artz -2.7930 -2.7915 -2.7779
Log-
Likelihood 1047.30 1050.05 1035.33
Durbin-
Watson 1.7592 1.7577 1.7604
GARCH (1, 1) T-GARCH IGARCH
a
School of Business
MSc in Finance: Dissertation Proposal
Student Name: Cormac Ennis
Student Number: 12321169
Mobile: +353 879022980
E-mail: [email protected]
Date of Submission: 06/05/2013
Proposed Title
Bitcoin: The
Future of
Money?
Supervisor Name: Dr. Constantin Gurdgiev
Certification of Authorship:
I hereby certify that I am the author of this document and that any assistance I received in its
preparation is fully acknowledged and disclosed in the document. I have also cited all sources
from which I obtained data, ideas or words that are copied directly or paraphrased in the
document. Sources are properly credited according to accepted standards for professional
publications. I also certify that this proposal was prepared by me for the purpose of partial
fulfilment of requirements for the MSc in Finance Programme.
Signature Date

b
1. Aims & Objectives
I. Research Aim
The objective of this dissertation is to conduct an in-depth economic analysis of the virtual currency
Bitcoin and to determine its specific asset characteristics and overall position in the universe of financial
assets.
II. Research Objectives
To conduct an extensive and exhaustive review of all the available literature and material on the
subject.
To contribute to the limited literature on the topic and attempt to answer some of the questions
arising from previous publications.
To undertake a comprehensive analysis of the fundamental economic qualities of the currency, its
origins, growth prospects and sustainability.
To perform a detailed econometric analysis of all existing data on exchange rates and volumes
traded so as to determine bitcoins asset characteristics.
To estimate bitcoin’s correlations with other financial assets so as to determine its asset
characteristics and how it fits into the universe of financial assets.
III. Possible Research Questions
What is bitcoin and how does it work? What are the economic fundamentals of bitcoin as a
currency? As an asset?
What are the general conclusions regarding bitcoin in the literature?
What scope for growth is there in bitcoins development as a currency or asset?
What conclusions can be drawn from an econometric analysis of existing data?
What is the correlation between bitcoin and other financial assets?
Bitcoin has been described as “quasi-commodity money” (Selgin, 2012). In light of this statement
what characteristics does bitcoin share with commodities such as precious metals, oil, etc.?
Is bitcoin a hedge? Is it uncorrelated or negatively correlated with other assets on average?
Is bitcoin a safe-haven? Is it “uncorrelated with [other assets] in a market crash”? (Baur et Lucey,
2010)

c
2. Rationale & Contribution
I. Description of Topic
Bitcoin is the first example of a decentralized virtual currency. It is decentralized as coins are not issued
by any one central organisation but by bitcoin “miners”. To mine for bitcoins users run a program on
their computer which uses an algorithm to solve complex mathematical problems with the help of other
computers on the network. When a puzzle is solved bitcoins are created, this process is also how
transactions are verified and forgery is avoided as each individual “coin” contains a full record of all
previous transactions. Bitcoin provides an alternative to traditional online payment systems as it does
away with the need for any third party with users able to transfer money directly between their online
“wallets”. An ECB report published in 2012 provides this working definition of a virtual currency:
“…a type of unregulated, digital money, which is issued and usually controlled by its developers, and used
and accepted among the members of a specific virtual community.”
The identity of bitcoins creator(s) remains unknown to this day as the infamous “white paper” which
outlined the concepts and design behind the currency was published under the pseudonym of Satoshi
Nakamoto. Attempts to uncover the true identity behind the creation of the currency have proved
fruitless, although an investigative report by The New Yorker (2011) determined that the most likely
candidate was a former cryptology and computer science PhD student from Trinity College, Dublin.
Bitcoin can be exchanged for all major world currencies on a number of online exchanges (with Mt.Gox
the most popular). Its exchange rate is determined by supply and demand in the market. Decentralisation
as a key feature of bitcoin’s design is seen as a way to mitigate against the risks posed by sovereign
currencies such as inflation risk and default risk. However, according to Christin and Moore (2013):
“…an extensive ecosystem of 3rd-party intermediaries now supports Bitcoin transactions: currency
exchanges, escrow services, online wallets, mining pools, investment services, etc.”
meaning that the majority of the
“…risk(s) Bitcoin holders face stems from interacting with these intermediaries, who act as de facto
central authorities.”
These exchanges are often subject to speculative cyber-attacks and to price manipulation. Christin and
Moore found that some 45% of bitcoin exchanges have closed often with the result that customers have
been unable to withdraw their money.
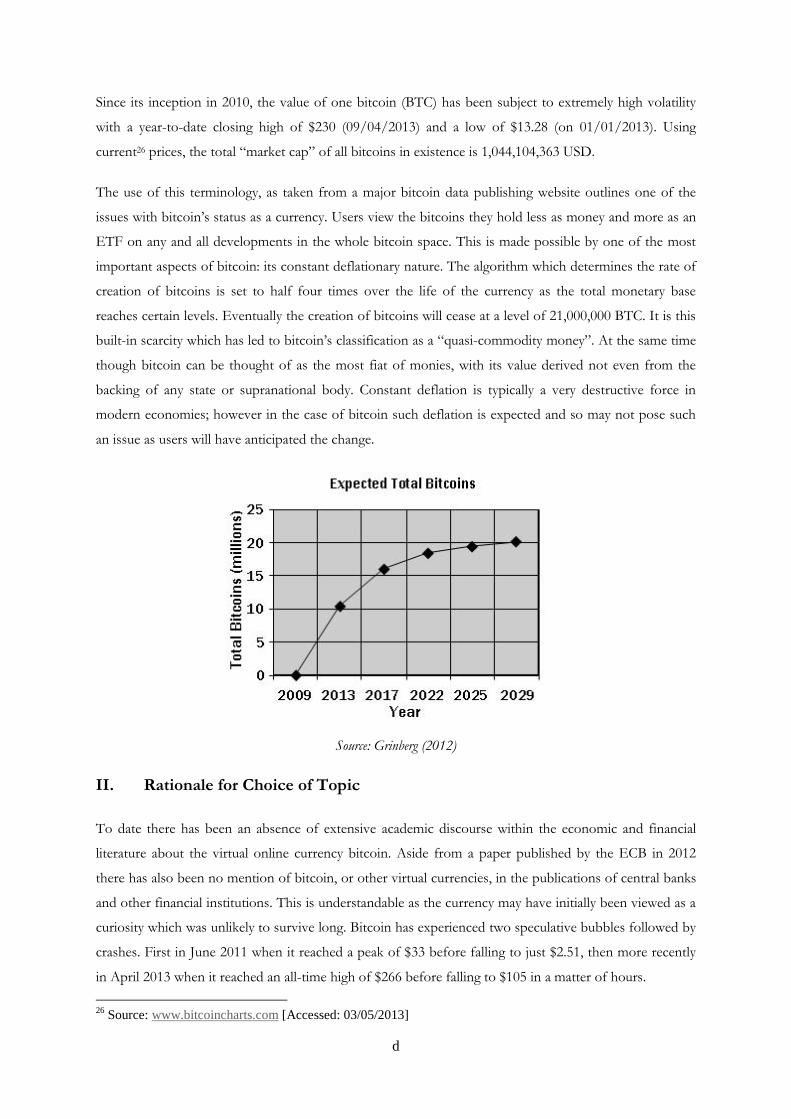
d
Since its inception in 2010, the value of one bitcoin (BTC) has been subject to extremely high volatility
with a year-to-date closing high of $230 (09/04/2013) and a low of $13.28 (on 01/01/2013). Using
current26 prices, the total “market cap” of all bitcoins in existence is 1,044,104,363 USD.
The use of this terminology, as taken from a major bitcoin data publishing website outlines one of the
issues with bitcoin’s status as a currency. Users view the bitcoins they hold less as money and more as an
ETF on any and all developments in the whole bitcoin space. This is made possible by one of the most
important aspects of bitcoin: its constant deflationary nature. The algorithm which determines the rate of
creation of bitcoins is set to half four times over the life of the currency as the total monetary base
reaches certain levels. Eventually the creation of bitcoins will cease at a level of 21,000,000 BTC. It is this
built-in scarcity which has led to bitcoin’s classification as a “quasi-commodity money”. At the same time
though bitcoin can be thought of as the most fiat of monies, with its value derived not even from the
backing of any state or supranational body. Constant deflation is typically a very destructive force in
modern economies; however in the case of bitcoin such deflation is expected and so may not pose such
an issue as users will have anticipated the change.
Source: Grinberg (2012)
II. Rationale for Choice of Topic
To date there has been an absence of extensive academic discourse within the economic and financial
literature about the virtual online currency bitcoin. Aside from a paper published by the ECB in 2012
there has also been no mention of bitcoin, or other virtual currencies, in the publications of central banks
and other financial institutions. This is understandable as the currency may have initially been viewed as a
curiosity which was unlikely to survive long. Bitcoin has experienced two speculative bubbles followed by
crashes. First in June 2011 when it reached a peak of $33 before falling to just $2.51, then more recently
in April 2013 when it reached an all-time high of $266 before falling to $105 in a matter of hours.
26
Source: www.bitcoincharts.com [Accessed: 03/05/2013]
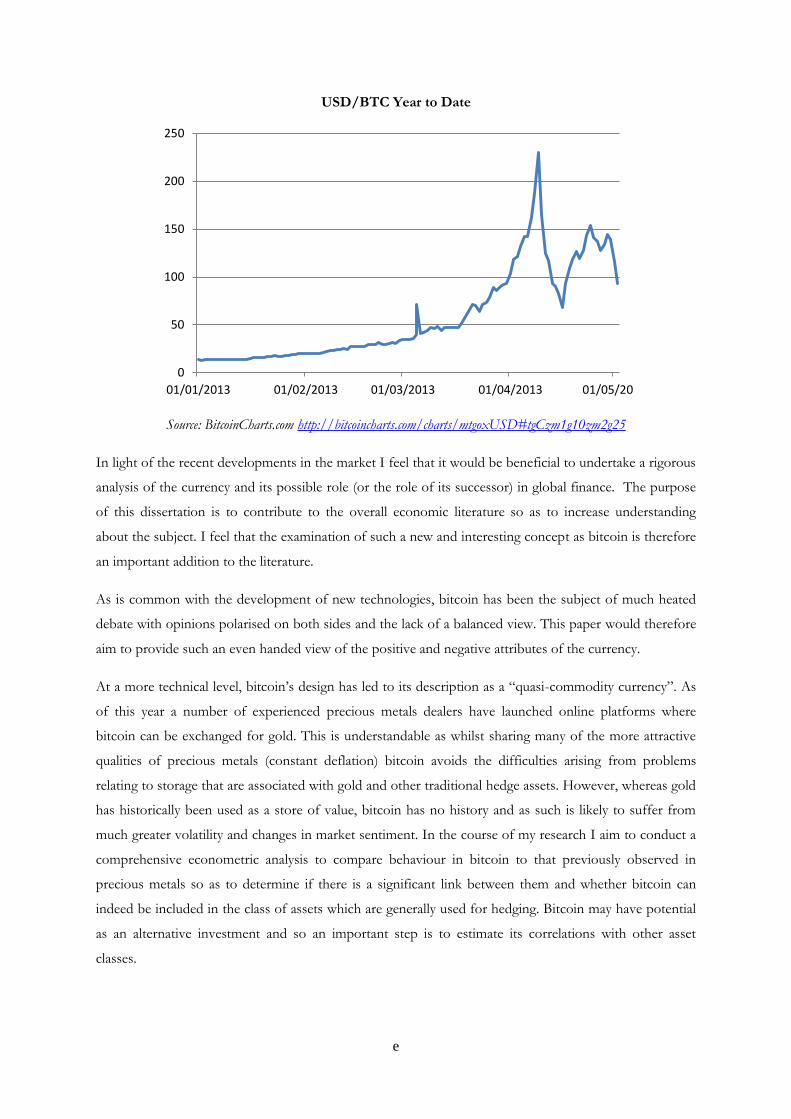
e
USD/BTC Year to Date
Source: BitcoinCharts.com http://bitcoincharts.com/charts/mtgoxUSD#tgCzm1g10zm2g25
In light of the recent developments in the market I feel that it would be beneficial to undertake a rigorous
analysis of the currency and its possible role (or the role of its successor) in global finance. The purpose
of this dissertation is to contribute to the overall economic literature so as to increase understanding
about the subject. I feel that the examination of such a new and interesting concept as bitcoin is therefore
an important addition to the literature.
As is common with the development of new technologies, bitcoin has been the subject of much heated
debate with opinions polarised on both sides and the lack of a balanced view. This paper would therefore
aim to provide such an even handed view of the positive and negative attributes of the currency.
At a more technical level, bitcoin’s design has led to its description as a “quasi-commodity currency”. As
of this year a number of experienced precious metals dealers have launched online platforms where
bitcoin can be exchanged for gold. This is understandable as whilst sharing many of the more attractive
qualities of precious metals (constant deflation) bitcoin avoids the difficulties arising from problems
relating to storage that are associated with gold and other traditional hedge assets. However, whereas gold
has historically been used as a store of value, bitcoin has no history and as such is likely to suffer from
much greater volatility and changes in market sentiment. In the course of my research I aim to conduct a
comprehensive econometric analysis to compare behaviour in bitcoin to that previously observed in
precious metals so as to determine if there is a significant link between them and whether bitcoin can
indeed be included in the class of assets which are generally used for hedging. Bitcoin may have potential
as an alternative investment and so an important step is to estimate its correlations with other asset
classes.
0
50
100
150
200
250
01/01/2013 01/02/2013 01/03/2013 01/04/2013 01/05/2013
f
I feel that the outlined reasons provide a clear outline as to why an academic analysis of the virtual
currency is a relevant topic for research.
III. Literature Review
A. Primary Sources
As previously stated as a motivation for research there are limited reputable sources available on the topic
of bitcoin and virtual currencies. The ECB published a paper titled ‘Virtual Currency Schemes’ in
October 2012 which states that the report “…is a first attempt to provide the basis for a discussion on
virtual currency schemes.” The paper provides a number of useful definitions which outline the
differences between different types of virtual currencies and there qualifying characteristics. It focuses on
the possible risks posed by virtual currencies to the global financial system and in particular to the
reputations of central banks, concluding that at the current level of usage there is no significant risk posed
and that virtual currencies do fall within central banks responsibilities. The report also states that should
usage increase significantly then the current assessment could change and that therefore all developments
should be monitored carefully.
Another primary source used will be ‘Bitcoin: A Peer-to-Peer Electronic Cash System’ published under
the name Satoshi Nakamoto in 2009. This paper outlines the mechanisms behind the bitcoin network and
will provide an essential description of how the system works.
Other primary sources include those arising from within the bitcoin community such as those presented
on www.bitcoin.org and at Bitcoin Wiki. Care must be taken in using these sources however as they are
arising directly from the strong online community surrounding bitcoin and are likely to contain a high
degree of bias.
B. Secondary Sources
There have been a handful of papers published on the topic of virtual currencies and bitcoin. ‘Quasi-
Commodity Money’, Selgin (2012) deals with the reform possibilities presented by currencies such as
Bitcoin, and Selgin argues that such currencies have the potential to “supply the foundation for monetary
regimes that does not require oversight by any monetary authority”.
Another source is the Deutschebank report ‘E-money, Niche Market that Might be Expanding” (2012)
which argues that the potential market for online currencies is huge given the ubiquitous nature of the
internet.
There have also been a number of articles featured in both the print and online blog sections of The
Economist dealing with bitcoin. Articles have also appeared in various other online news publications
such as Bloomberg, Reuters and BBC News.
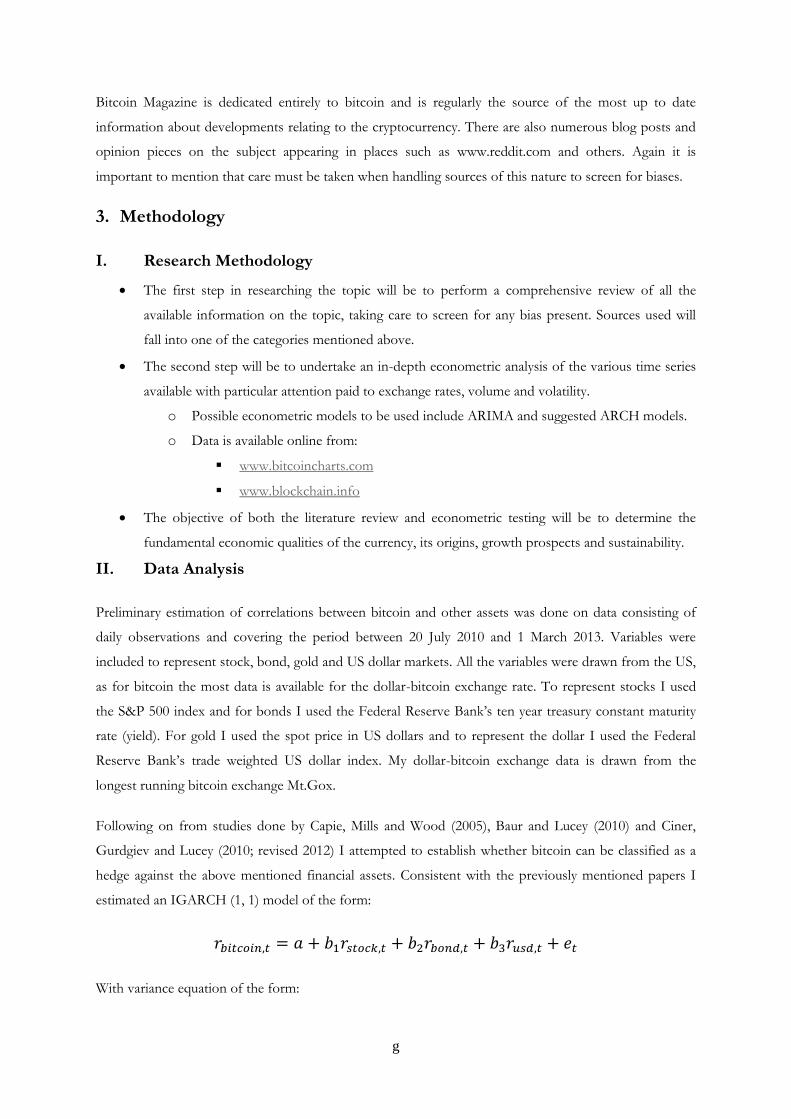
g
Bitcoin Magazine is dedicated entirely to bitcoin and is regularly the source of the most up to date
information about developments relating to the cryptocurrency. There are also numerous blog posts and
opinion pieces on the subject appearing in places such as www.reddit.com and others. Again it is
important to mention that care must be taken when handling sources of this nature to screen for biases.
3. Methodology
I. Research Methodology
The first step in researching the topic will be to perform a comprehensive review of all the
available information on the topic, taking care to screen for any bias present. Sources used will
fall into one of the categories mentioned above.
The second step will be to undertake an in-depth econometric analysis of the various time series
available with particular attention paid to exchange rates, volume and volatility.
o Possible econometric models to be used include ARIMA and suggested ARCH models.
o Data is available online from:
www.bitcoincharts.com
www.blockchain.info
The objective of both the literature review and econometric testing will be to determine the
fundamental economic qualities of the currency, its origins, growth prospects and sustainability.
II. Data Analysis
Preliminary estimation of correlations between bitcoin and other assets was done on data consisting of
daily observations and covering the period between 20 July 2010 and 1 March 2013. Variables were
included to represent stock, bond, gold and US dollar markets. All the variables were drawn from the US,
as for bitcoin the most data is available for the dollar-bitcoin exchange rate. To represent stocks I used
the S&P 500 index and for bonds I used the Federal Reserve Bank’s ten year treasury constant maturity
rate (yield). For gold I used the spot price in US dollars and to represent the dollar I used the Federal
Reserve Bank’s trade weighted US dollar index. My dollar-bitcoin exchange data is drawn from the
longest running bitcoin exchange Mt.Gox.
Following on from studies done by Capie, Mills and Wood (2005), Baur and Lucey (2010) and Ciner,
Gurdgiev and Lucey (2010; revised 2012) I attempted to establish whether bitcoin can be classified as a
hedge against the above mentioned financial assets. Consistent with the previously mentioned papers I
estimated an IGARCH (1, 1) model of the form:
With variance equation of the form:

h
The results for the model are presented in the following table.
Table 1 – Estimation Results for IGARCH (1, 1)
Bitcoin Coefficient est. Standard error t-stat P-value
0.007017 0.001661 4.225126 0.0000
0.855431 0.213234 4.011703 0.0001
-0.221590 0.067989 -3.259208 0.0011
-0.536879 0.504120 -1.064981 0.2869
Variance Equation
0.064865 0.002276 28.50330 0.0000
0.935135 0.002276 410.9250 0.0000
The model was selected using the Akaike information criterion and the log likelihood ratio test.
From the table we can see that bitcoin is positively correlated with stocks on average. We can also see that
bitcoin is negatively correlated with bond yields (i.e. positively correlated with bond prices) and negatively
correlated with the US dollar. However, the coefficient estimate for the average effect of the US dollar on
bitcoin is not statistically significant. The model has a very low r-squared of just 0.0075, implying that less
than 1% of the variation in bitcoin is as a result of the variation in the explanatory variables selected.
Lagged variables of both the dependent and explanatory variables were estimated, however none were
statistically significant.
I intend to expand my analysis to include more variables such as the Dow Jones, Russell 2000, Eurostoxx
50 and FTSE 100 for stocks and indices representing the relative value of both the euro and yen. I also
intend to follow the previously mentioned works and estimate whether bitcoin is a “safe-haven”. I will
estimate rolling 30 day correlations between bitcoin and the other assets in order to generate additional
data series.
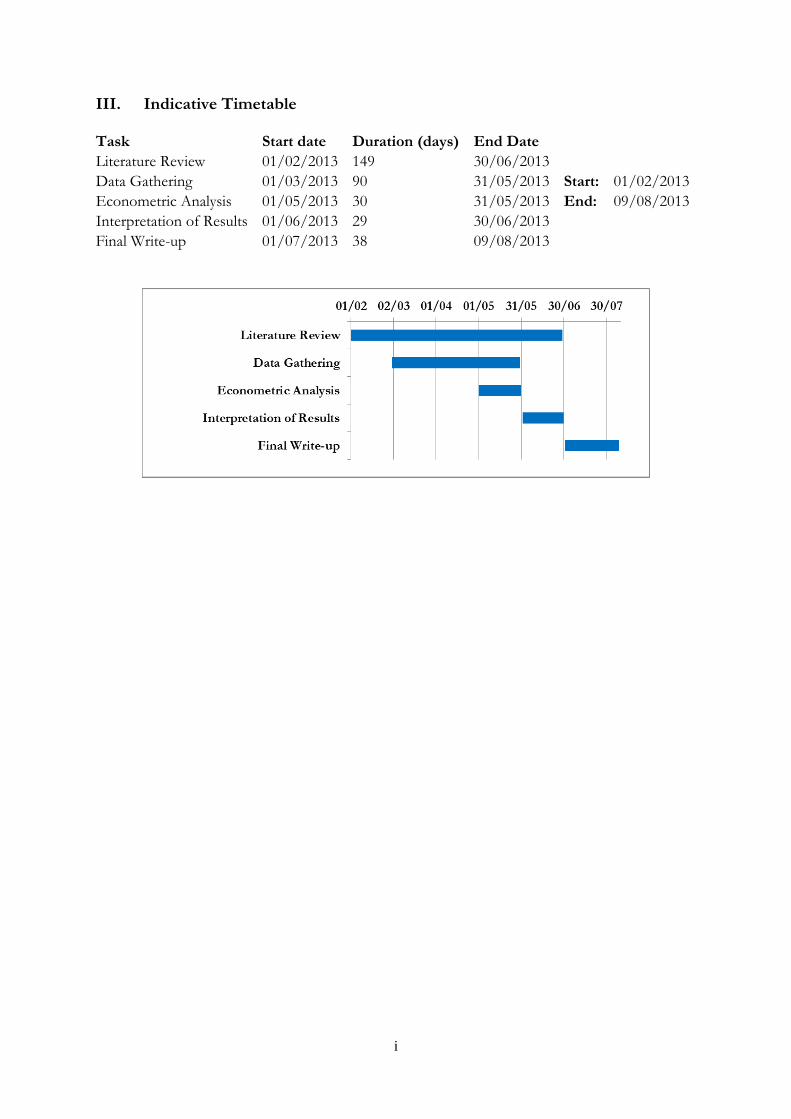
i
III. Indicative Timetable
Task Start date Duration (days) End Date
Literature Review 01/02/2013 149 30/06/2013
Data Gathering 01/03/2013 90 31/05/2013 Start: 01/02/2013
Econometric Analysis 01/05/2013 30 31/05/2013 End: 09/08/2013
Interpretation of Results 01/06/2013 29 30/06/2013
Final Write-up 01/07/2013 38 09/08/2013

j
4. References
Babbage (2011), ‘The Bursting of the Bitcoin Bubble’, The Economist. Available from:
http://www.economist.com/blogs/babbage/2011/10/virtual-currencies [Accessed: 28/02/2013]
Babbage (2011), ‘Virtual Currency: Bits and Bobs’, The Economist, Available from:
http://www.economist.com/blogs/babbage/2011/06/virtual-currency [Accessed: 21/02/2013]
Baddeley, M. (2004), ‘Using E-Cash in the New Economy: An Economic Analysis of Micropayment
Systems’, Journal of Electronic Commerce Research, Vol. 5, No. 4. Available from:
http://citeseerx.ist.psu.edu/viewdoc/download?doi=10.1.1.92.5075&rep=rep1&type=pdf [Accessed:
28/02/2013]
Baur, D., and Lucey, B. (2010), ‘Is gold a hedge or a safe haven? An analysis of stocks, bonds and gold.’
Financial Review 45.2: 217-229. Available from: http://onlinelibrary.wiley.com/doi/10.1111/j.1540-
6288.2010.00244.x/full [Accessed: 25/02/2013]
BBC News Online (2011), ‘Bitcoin ‘Will Recover’ from the Crash.’ Available from:
http://www.bbc.co.uk/news/technology-13857192 [Accessed: 30/01/2013]
BBC News Online (2012), ‘Virtual Cash Exchange Becomes Bank’, Available from:
http://www.bbc.co.uk/news/technology-20641465 [Accessed: 28/02/2013].
BBC News Online (2013), ‘Bitcoin Virtual Currency Reaches All-Time High Price’. Available from:
http://www.bbc.co.uk/news/technology-21601608 [Accessed: 28/02/2013]
BIS (2012), ‘Innovations in Retail Payments’. Available from: http://www.bis.org/publ/cpss102.htm
[Accessed: 27/02/2013]
Bitcoin Beta, ‘How do Economists View Bitcoin?’ Available from:
http://bitcoin.stackexchange.com/questions/3747/how-do-economists-view-bitcoin [Accessed:
22/02/2013]
Bitcoin Charts, Available at: http://bitcoincharts.com/ [Accessed: 28/02/2013]
Buhl, T. (2013), ‘Coinlab Bringing Bitcoin to Wall Street with MtGox Deal’, Bitcoin Magazine. Available
from: http://bitcoinmagazine.com/coinlab-bringing-bitcoin-to-wall-street-with-mtgox-deal [Accessed:
27/02/2013]
Buterin, V. (2012), ‘Where is Bitcoin? A Look at Some Analytical Data’, Bitcoin Magazine. Available from:
http://bitcoinmagazine.com/where-is-bitcoin-a-look-at-some-analytical-data/ [Accessed: 28/02/2013]

k
Buterin, V. (2013), ‘$13 to $26: Exploring the Bitcoin Rally’, Bitcoin Magazine. Available from:
http://bitcoinmagazine.com/13-to-26-exploring-the-bitcoin-rally/ [Accessed: 14/02/2013]
Button, K. (2011), ‘Virtual Currencies, Real Potential’. American Banker, Available from:
http://www.americanbanker.com/btn/24_11/virtual-currencies-real-potential-1043673-
1.html?zkPrintable=1&nopagination=1 [Accessed: 28/02/2013]
Ciner, C., Gurdgiev, C., Lucey, B. (2010; Revised 2012), ‘Hedges and Safe Havens–An Examination of
Stocks, Bonds, Oil, Gold and the Dollar.’ Bonds, Oil, Gold and the Dollar. Available from:
http://papers.ssrn.com/sol3/papers.cfm?abstract_id=1679243 [Accessed: 25/02/2013]
Cohen, B. (2001), ‘Electronic Money: New Day or False Dawn?’, Review of International Political Economy,
Vol. 8, No. 2 (Summer, 2001), pp. 197-225 Available from: http://www.jstor.org/stable/4177382
[Accessed: 29/01/2013]
Davis, J. (2011), ‘The Crypto-Currency’, The New Yorker. Available from:
http://www.newyorker.com/reporting/2011/10/10/111010fa_fact_davis [Accessed: 28/02/2013]
Dept. of Finance, Ireland (2009), ‘Electronic Money Directive’. Available from:
http://www.finance.gov.ie/documents/publications/other/2010/EMDConsultation.pdf [Accessed:
28/02/2013]
Deutsche Bank Research (2012), ‘E-money – Niche Market that Might be Expanding’, Available from:
http://www.dbresearch.com/PROD/DBR_INTERNET_EN-PROD/PROD0000000000288496/E-
money%3A+Niche+market+that+might+be+expanding.PDF [Accessed: 26/02/2013]
Digital Journal (2013), ‘Bitcoin to Precious Metals Platform has Launched.’ Available from:
http://www.digitaljournal.com/pr/1094280 [Accessed: 26/02/2013]
EC (2009), ‘Electronic Money Directive’, Directive 2009/110/EC, Available from: http://eur-
lex.europa.eu/LexUriServ/LexUriServ.do?uri=OJ:L:2009:267:0007:0017:EN:PDF [Accessed:
28/02/2013]
ECB (2012), ‘Virtual Currency Schemes’. Available from:
http://www.ecb.int/pub/pdf/other/virtualcurrencyschemes201210en.pdf [Accessed: 13/01/2013]
Gallippi, T. (2013), ‘How Owning Bitcoin is Owning an ETF on the Whole Bitcoin Space’, Pymnts.com.
Available from: http://www.pymnts.com/briefing-room/PYMNTS-International/2013/02/How-
Owning-Bitcoin-Is-Owning-An-ETF-On-The-Whole-Bitcoin-Space/?utm_campaign=how-owning-
bitcoin-is-owning-an-etf-on-the-whole-bitcoin-space [Accessed: 23/02/2013]
l
Grinberg, R. (2011), ‘Bitcoin: An Innovative Alternative Digital Currency’, Hastings Sci. & Tech. LJ 4: 159.
Available from:
http://heinonline.org/HOL/Page?handle=hein.journals/hascietlj4&div=6&g_sent=1&collection=journ
als [Accessed: 28/02/2013]
http://bitcoin.org/ [Accessed: 19/01/2013]
http://blockchain.info/ [Accessed: 28/02/2013]
Jacobs, E. (2011) "Bitcoin: A Bit Too Far." Journal of Internet Banking and Commerce, Vol 12.Available from:
http://www.arraydev.com/commerce/jibc/2011-
08/20110704%20JIBC%20Edwin%20JACOBS%20BITCOIN.pdf [Accessed: 28/02/2013]
Kaminska, I. (2013), ‘Turning Mobile Money Into M0’ FT Alphaville. Available from:
http://ftalphaville.ft.com/2013/02/18/1389822/turning-mobile-money-into-m0/ [Accessed:
28/02/2013]
Kaminska, I. (2013), ‘Why Central Banks Should Tank Charge of Their Digital Currencies’ FT Alphaville.
Available from: http://ftalphaville.ft.com/2013/02/18/1383972/why-central-banks-should-take-charge-
of-their-digital-currencies/ [Accessed: 28/02/2013]
Kaplanov, N. (2012), ‘Nerdy Money: Bitcoin, the Private Digital Currency, and the Case Against its
Regulation’, Temple University Legal Studies Research Paper, Available from:
http://papers.ssrn.com/sol3/papers.cfm?abstract_id=2115203 [Accessed: 25/02/2013]
Krugman, P. (2011), ‘Golden Cyberfetters’, The Conscience of a Liberal, New York Times Blog. Available from:
http://krugman.blogs.nytimes.com/2011/09/07/golden-cyberfetters/ [Accessed: 29/01/2013]
Lee, T. (2011), ‘The Bitcoin Crash’, Forbes. Available from:
http://www.forbes.com/sites/timothylee/2011/08/07/the-bitcoin-crash/ [Accessed: 22/02/2013]
Lee, T. (2013), ‘Why I’m Not Ready to Sell My Bitcoins’, Forbes. Available from:
http://www.forbes.com/sites/timothylee/2013/02/14/why-i-dont-think-bitcoins-big-price-rise-is-
another-bubble/ [Accessed: 14/02/2013]
Lucey, B. (2011), ‘What do academics think they know about gold.’ The Alchemist 62: 12-14. Available
from: http://www.lbma.org.uk/assets/Alch6203Lucey.pdf [Accessed: 25/02/2013]
Mt.Gox.com, Available at: https://mtgox.com/ [Accessed: 28/02/2013]
Nakamoto, S. (2008), ‘Bitcoin: A Peer-to-Peer Electronic Cash System’. Available from:
http://bitcoin.org/bitcoin.pdf [Accessed: 25/02/2013]

m
Raskin, M. (2013), ‘Bitcoin’s Gains May Fuel Central Banks Concerns’, Bloomberg.com, Available from:
http://www.bloomberg.com/news/2013-01-28/bitcoin-s-gains-may-fuel-central-bank-concerns-chart-of-
the-day.html [Accessed: 19/01/2013]
Ron, D. and Shamir, A. (2012), ‘Quantitative Analysis of the Full Bitcoin Transaction Graph.’ Available
from: http://ceclub.technion.ac.il/past.html [Accessed: 28/02/2013]
Roth, D. (2010), ‘The Future of Money: It’s Flexible, Frictionless and (Almost) Free. Wired Magazine.
Available from:
http://innovbfa.viabloga.com/files/Wired___The_Future_of_Money___march_2010.pdf [Accessed:
28/02/2013]
RT.com (2012), ‘Global Banking to be Joined by ‘Google Bank’ and ‘Apple Bank’. Available from:
http://rt.com/business/google-apple-banking-acquisition-795/ [Accessed: 28/02/2013]
Selgin, G. (2012), ‘Quasi-Commodity Money.’ Available from:
http://papers.ssrn.com/sol3/papers.cfm?abstract-id=2000118 [Accessed: 25/02/2013]
Surowiecki, J. (2011), ‘Cryptocurrency’, MIT Technology Review. Available from:
http://www.technologyreview.com/review/425142/cryptocurrency/ [Accessed: 29/01/2013]
The Economist (2012), ‘Bitcoin: Monetarists Anonymous.’ Available from:
http://www.economist.com/node/21563752 [Accessed: 21/02/2013]
Turnbull, S. (2013), ‘How Should Regulators Control E-Money?’, 2nd International Conference on
Complementary Currencies Systems, The Hague, the Netherlands. Available from:
http://papers.ssrn.com/sol3/papers.cfm?abstract_id=2202108 [Accessed: 28/02/2013]
Wallace, B. (2011), ‘The Rise and Fall of Bitcoin’, Wired Magazine. Available from:
http://www.wired.com/magazine/2011/11/mf_bitcoin/ [Accessed: 28/02/2013]
WordPress.com (2012), ‘Pay Another Way: Bitcoin’, Available from:
http://en.blog.wordpress.com/2012/11/15/pay-another-way-bitcoin/ [Accessed: 28/02/2013]
Zerohedge.com (2012), ‘Bitcoin Seen Through the Eyes of a Central Banker’. Available from:
http://www.zerohedge.com/news/2012-11-04/bitcoin-seen-through-eyes-central-banker [Accessed:
28/02/2013]