is africa’s youth leaving agriculture en mass?
TRANSCRIPT

Is Africa’s Youth Leaving Agriculture en mass?
LUC CHRISTIAENSEN, JOBS GROUP, WORLD BANK(JOINT WORK WITH AMPARO PALACIOS-LOPEZ, AND EUGENIE MAIGA)PRESENTATION AT UNU-WIDER THINK DEVELOPMENT, THINK WIDER CONFERENCE, 13-15 SEPT 2018, HELSINKI
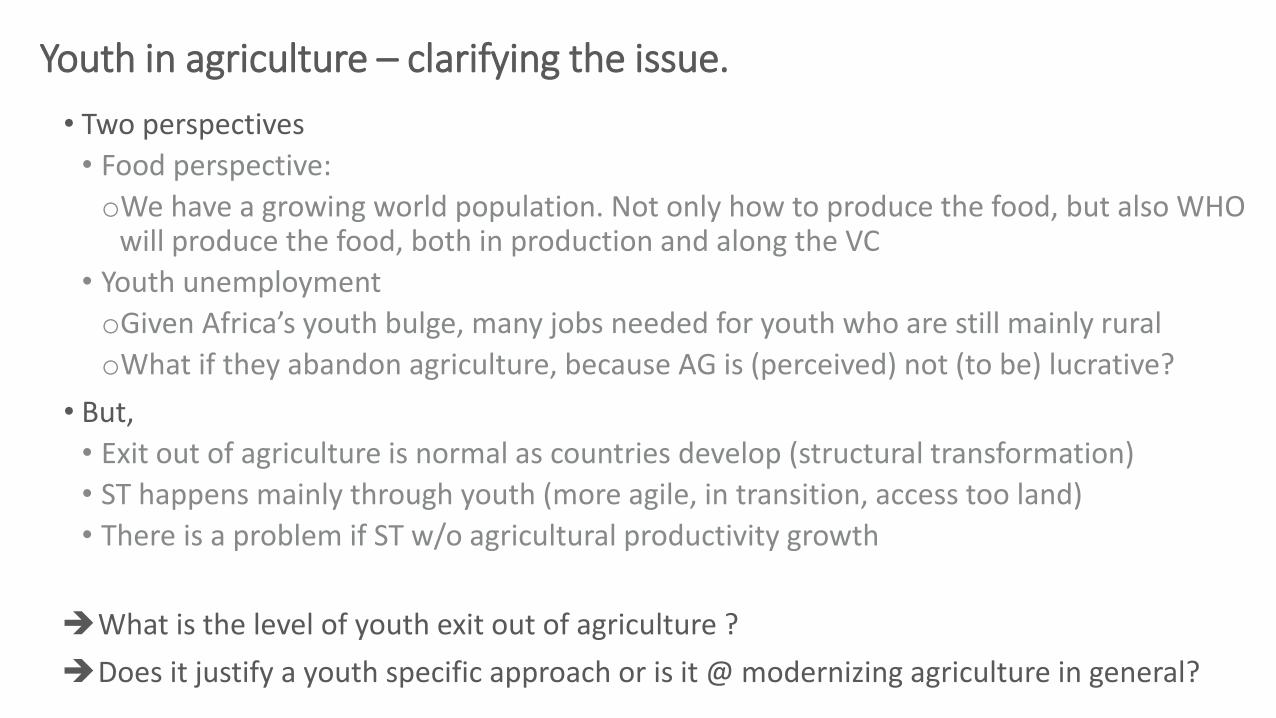
Youth in agriculture – clarifying the issue.
• Two perspectives
• Food perspective:
oWe have a growing world population. Not only how to produce the food, but also WHO will produce the food, both in production and along the VC
• Youth unemployment
oGiven Africa’s youth bulge, many jobs needed for youth who are still mainly rural
oWhat if they abandon agriculture, because AG is (perceived) not (to be) lucrative?
• But,
• Exit out of agriculture is normal as countries develop (structural transformation)
• ST happens mainly through youth (more agile, in transition, access too land)
• There is a problem if ST w/o agricultural productivity growth
➔What is the level of youth exit out of agriculture ?
➔Does it justify a youth specific approach or is it @ modernizing agriculture in general?
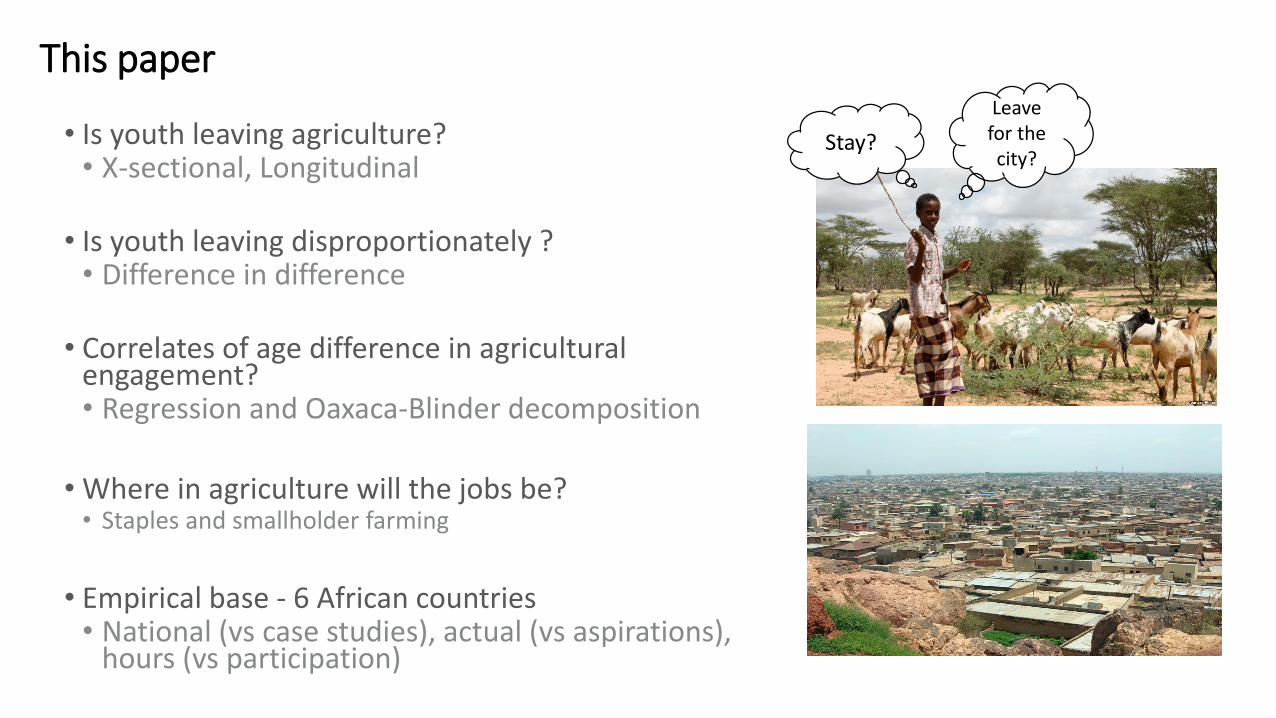
This paperLeave for the city?
Stay?• Is youth leaving agriculture?• X-sectional, Longitudinal
• Is youth leaving disproportionately ?• Difference in difference
• Correlates of age difference in agricultural engagement?• Regression and Oaxaca-Blinder decomposition
• Where in agriculture will the jobs be?• Staples and smallholder farming
• Empirical base - 6 African countries• National (vs case studies), actual (vs aspirations),
hours (vs participation)
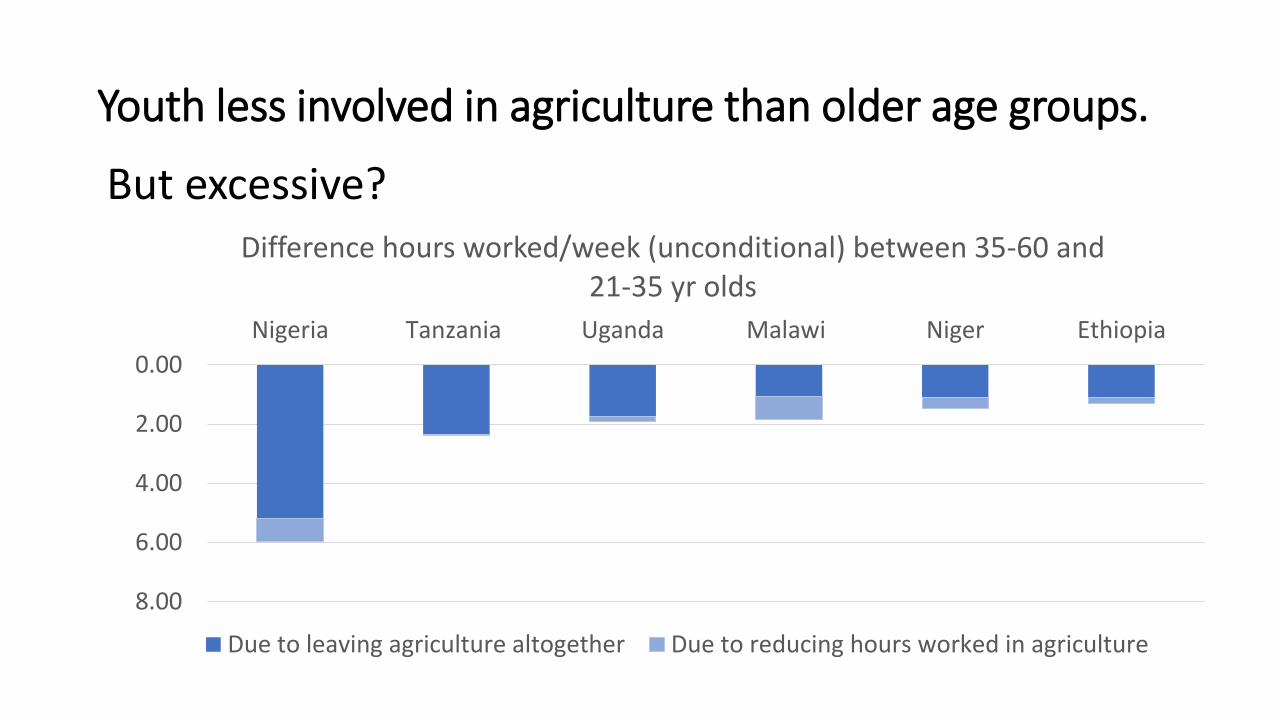
Youth less involved in agriculture than older age groups.
0.00
2.00
4.00
6.00
8.00
Nigeria Tanzania Uganda Malawi Niger Ethiopia
Difference hours worked/week (unconditional) between 35-60 and 21-35 yr olds
Due to leaving agriculture altogether Due to reducing hours worked in agriculture
But excessive?

Methodology – need to control for lifecycle effects (and common time effects)
DID framework
• Let the ag labor input of person i, from country j, from age group a, in year t be:
𝑌𝑖𝑗𝑎𝑡 = 𝜆𝑎 + 𝜌𝑗 + 𝛾𝑡 + 𝛿𝑎𝑗𝐷𝑡 + 𝑣𝑖𝑗𝑡𝑎• Where:
• 𝜆𝑎 = age/lifecycle effect that is common across time
• 𝜌𝑗 = country fixed effect (comparative advantage of ag (trade openness, land/labor ratios), institutions (nonag), cost of mobility
• 𝛾𝑡 = year specific effect (survey design, shocks such as rainfall, price shock)
• 𝐷𝑡 = dummy which is 1 for year 1, to capture the net age differentiated effect δ of time related factors affecting ag labor demand and supply, i.e. structural transformation (education, terms of trade, institutional change, relative productivity growth, income). We assume that this effect is higher on youth than on adults.
• 𝑣 = random error term
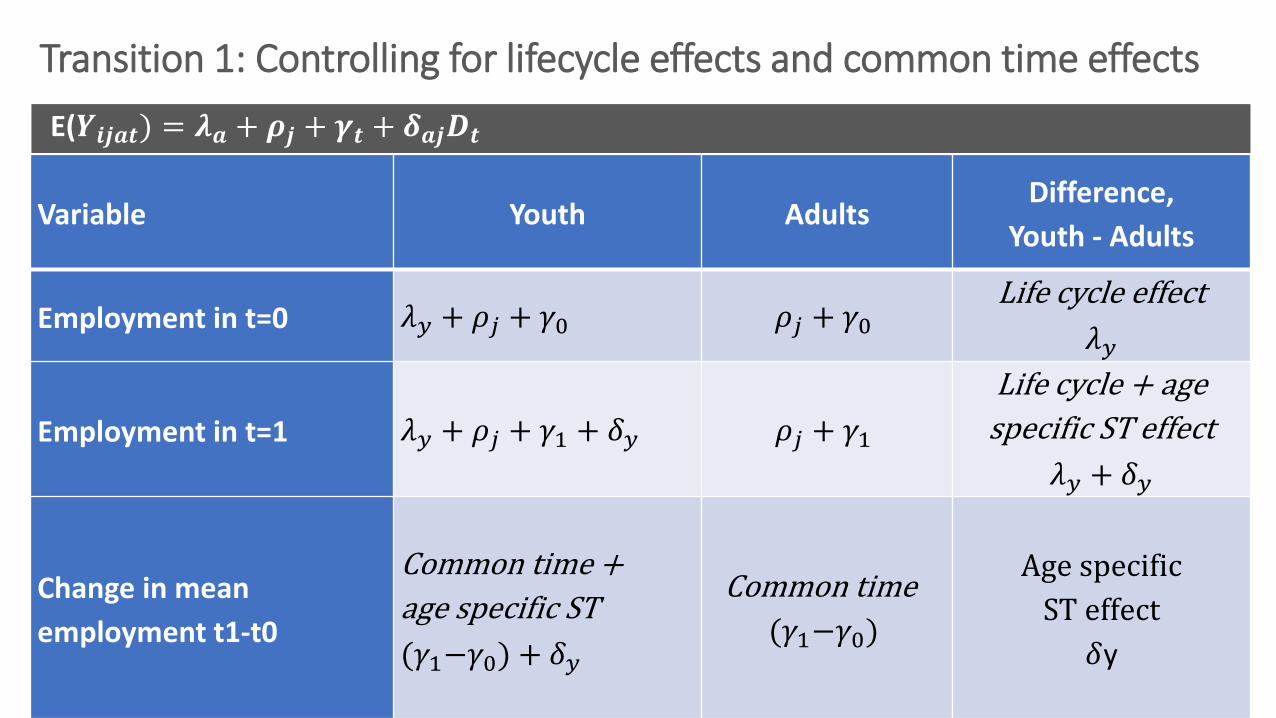
Transition 1: Controlling for lifecycle effects and common time effects
E(𝒀𝒊𝒋𝒂𝒕) = 𝝀𝒂 + 𝝆𝒋 + 𝜸𝒕 + 𝜹𝒂𝒋𝑫𝒕
Variable Youth AdultsDifference,
Youth - Adults
Employment in t=0 𝜆𝑦 + 𝜌𝑗 + 𝛾0 𝜌𝑗 + 𝛾0Life cycle effect
𝜆𝑦
Employment in t=1 𝜆𝑦 + 𝜌𝑗 + 𝛾1 + 𝛿𝑦 𝜌𝑗 + 𝛾1
Life cycle + age
specific ST effect
𝜆𝑦 + 𝛿𝑦
Change in mean
employment t1-t0
Common time +
age specific ST
(𝛾1−𝛾0) + 𝛿𝑦
Common time
(𝛾1−𝛾0)
Age specific
ST effect
𝛿y

Illustration from Vietnam
20-35 36-60
2009 0.46 0.58 -0.12
00.10.20.30.40.50.60.70.80.9
15
-19
20
-24
25
-29
30
-34
35
-39
40
-44
45
-49
50
-54
55
-59
60
-64
Share ag employment
2009
12 percent less engagement by youth in agriculture in 2009
But, life cycle effects …
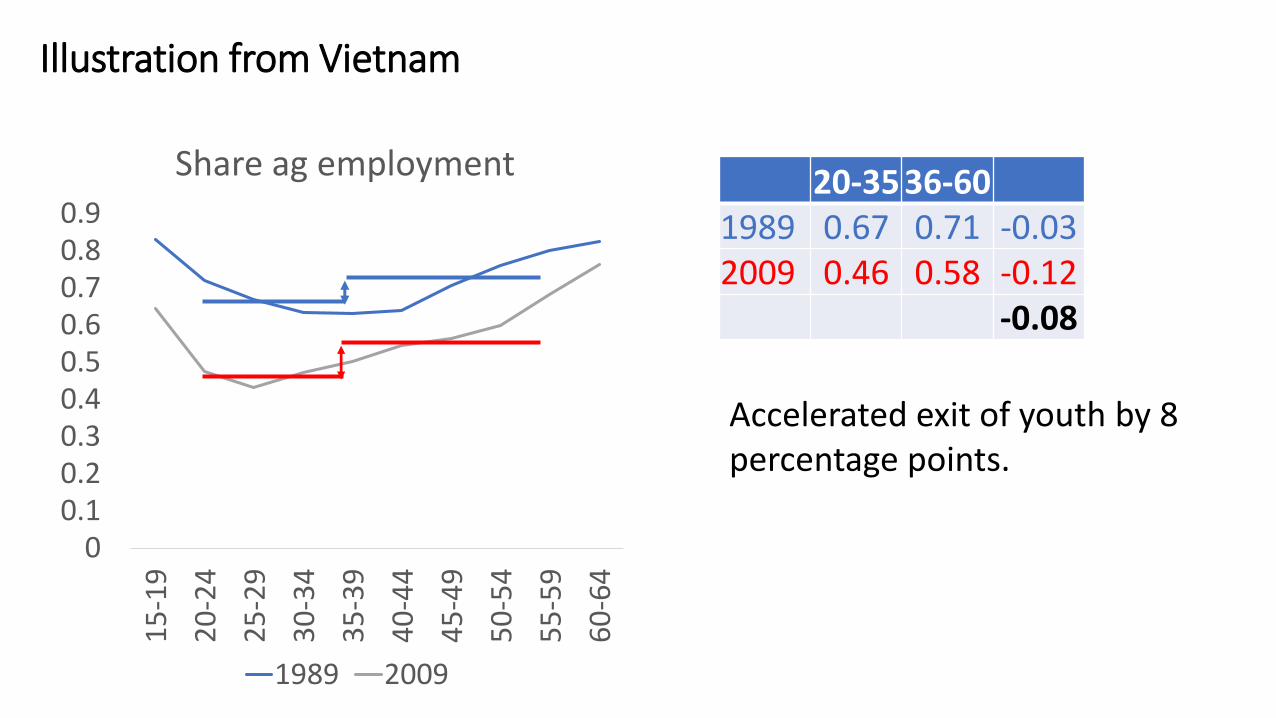
Illustration from Vietnam
20-35 36-601989 0.67 0.71 -0.032009 0.46 0.58 -0.12
-0.08
00.10.20.30.40.50.60.70.80.9
15
-19
20
-24
25
-29
30
-34
35
-39
40
-44
45
-49
50
-54
55
-59
60
-64
Share ag employment
1989 2009
Accelerated exit of youth by 8 percentage points.
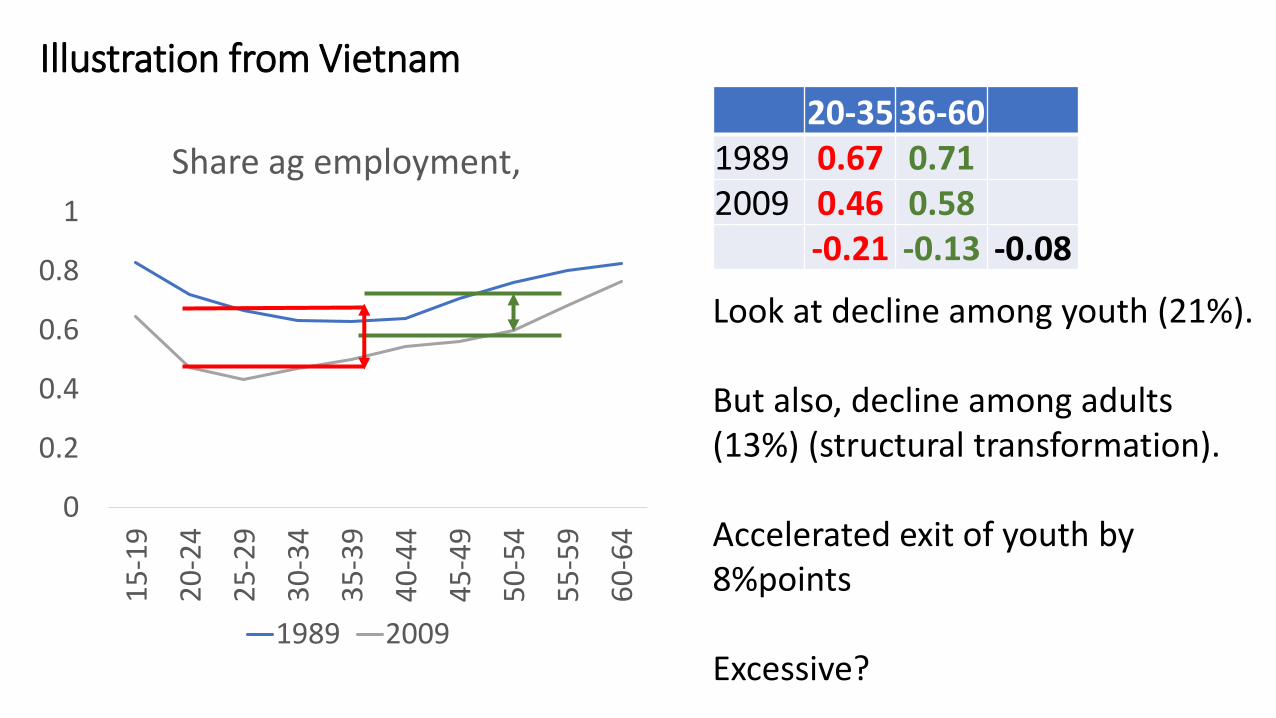
Illustration from Vietnam20-35 36-60
1989 0.67 0.712009 0.46 0.58
-0.21 -0.13 -0.08
0
0.2
0.4
0.6
0.8
1
15
-19
20
-24
25
-29
30
-34
35
-39
40
-44
45
-49
50
-54
55
-59
60
-64
Share ag employment,
1989 2009
Look at decline among youth (21%).
But also, decline among adults (13%) (structural transformation).
Accelerated exit of youth by 8%points
Excessive?
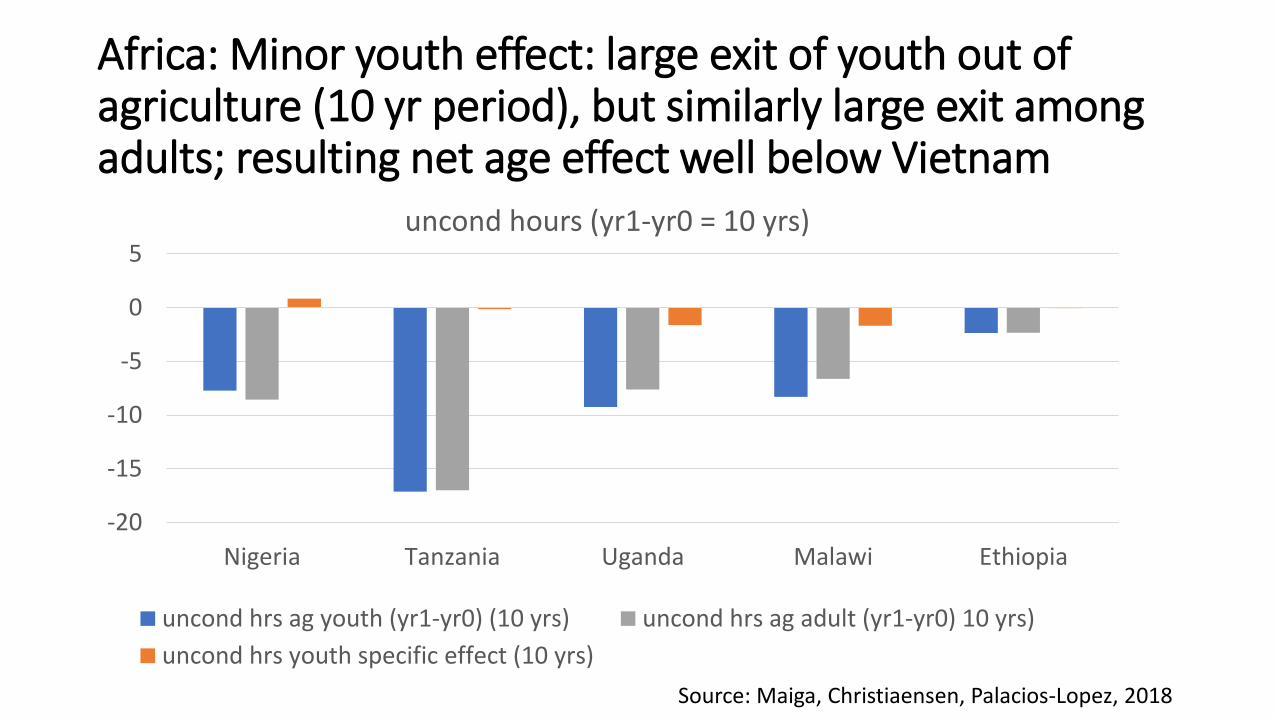
Africa: Minor youth effect: large exit of youth out of agriculture (10 yr period), but similarly large exit among adults; resulting net age effect well below Vietnam
-20
-15
-10
-5
0
5
Nigeria Tanzania Uganda Malawi Ethiopia
uncond hours (yr1-yr0 = 10 yrs)
uncond hrs ag youth (yr1-yr0) (10 yrs) uncond hrs ag adult (yr1-yr0) 10 yrs)
uncond hrs youth specific effect (10 yrs)
Source: Maiga, Christiaensen, Palacios-Lopez, 2018
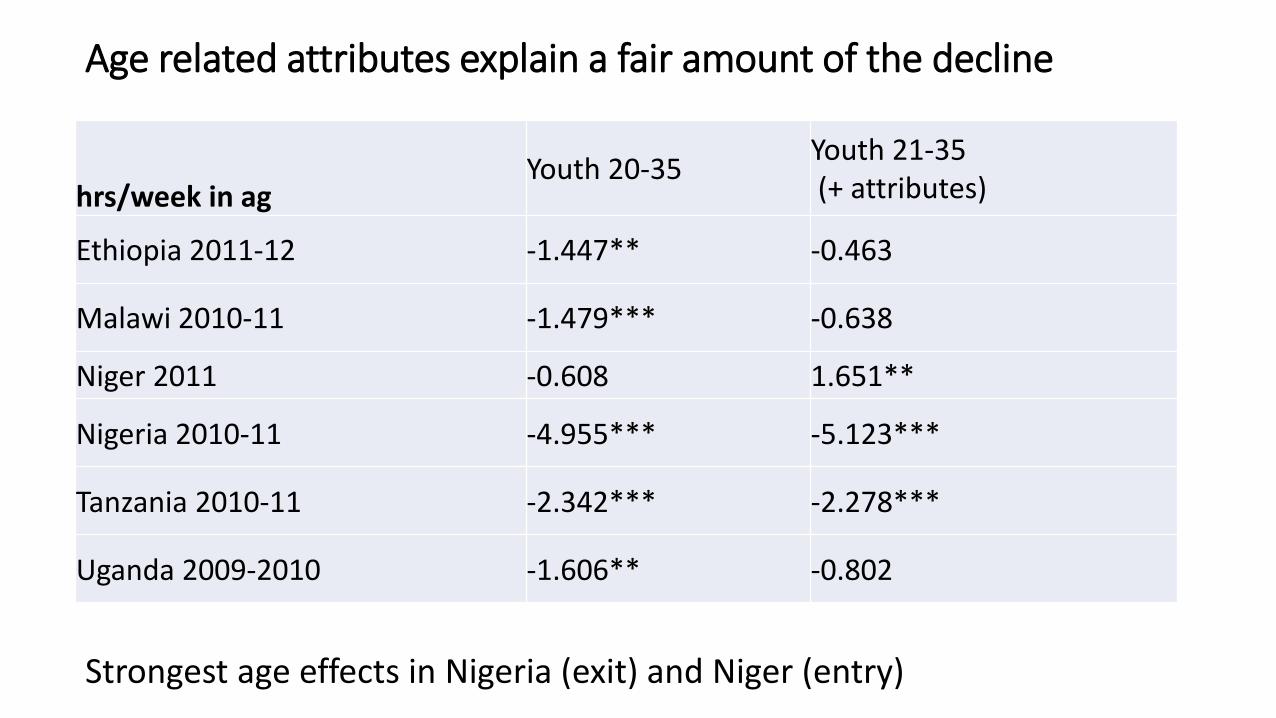
Age related attributes explain a fair amount of the decline
hrs/week in agYouth 20-35
Youth 21-35(+ attributes)
Ethiopia 2011-12 -1.447** -0.463
Malawi 2010-11 -1.479*** -0.638
Niger 2011 -0.608 1.651**
Nigeria 2010-11 -4.955*** -5.123***
Tanzania 2010-11 -2.342*** -2.278***
Uganda 2009-2010 -1.606** -0.802
Strongest age effects in Nigeria (exit) and Niger (entry)
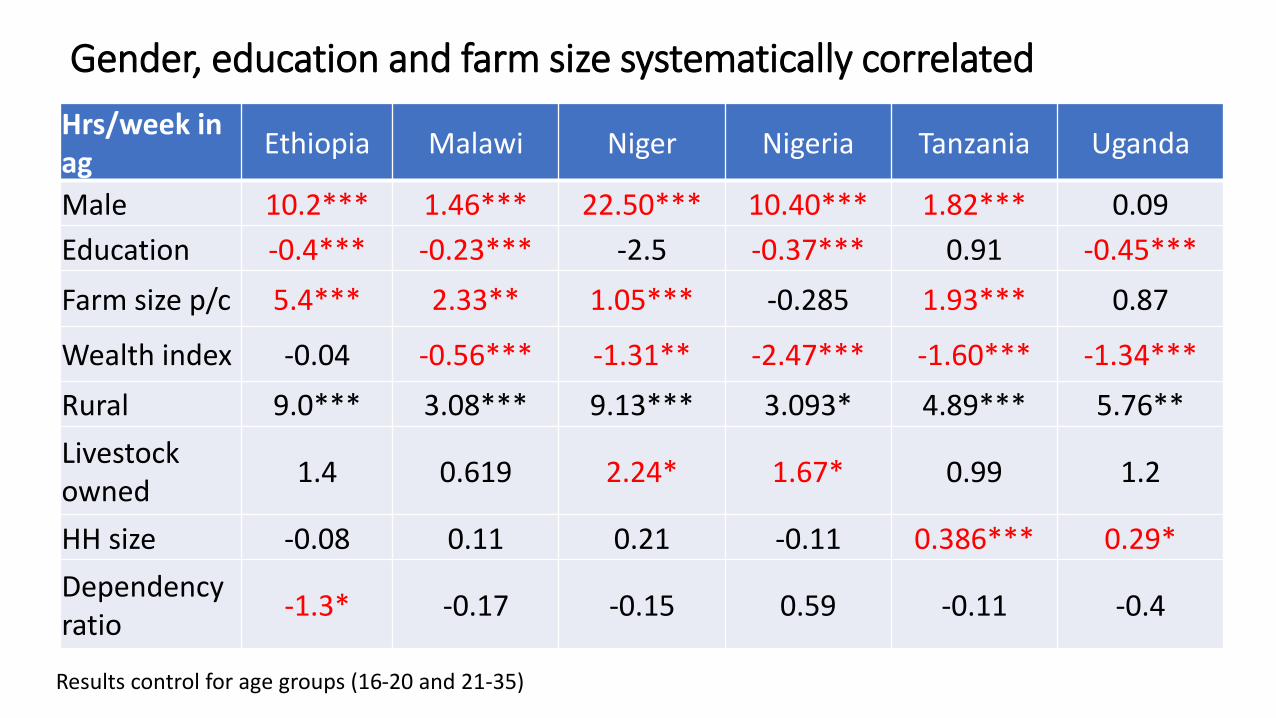
Gender, education and farm size systematically correlated
Hrs/week in ag
Ethiopia Malawi Niger Nigeria Tanzania Uganda
Male 10.2*** 1.46*** 22.50*** 10.40*** 1.82*** 0.09
Education -0.4*** -0.23*** -2.5 -0.37*** 0.91 -0.45***
Farm size p/c 5.4*** 2.33** 1.05*** -0.285 1.93*** 0.87
Wealth index -0.04 -0.56*** -1.31** -2.47*** -1.60*** -1.34***
Rural 9.0*** 3.08*** 9.13*** 3.093* 4.89*** 5.76**
Livestock owned
1.4 0.619 2.24* 1.67* 0.99 1.2
HH size -0.08 0.11 0.21 -0.11 0.386*** 0.29*
Dependency ratio
-1.3* -0.17 -0.15 0.59 -0.11 -0.4
Results control for age groups (16-20 and 21-35)
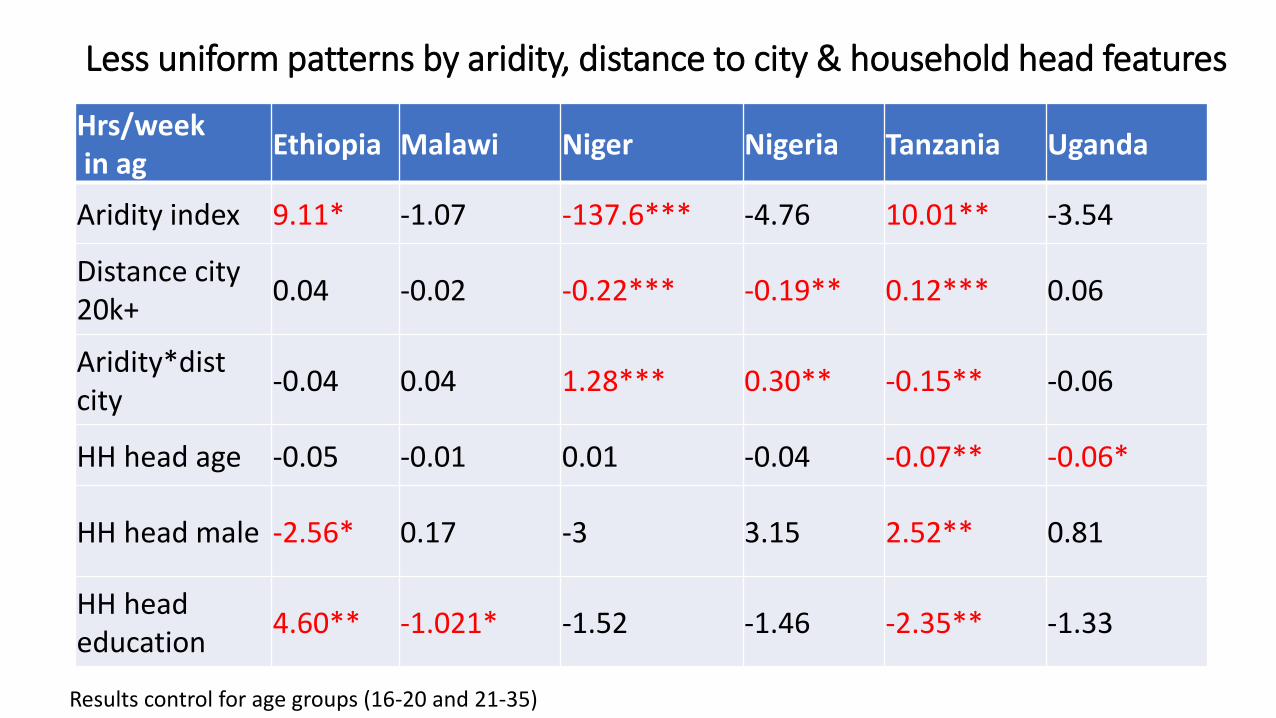
Less uniform patterns by aridity, distance to city & household head features
Hrs/weekin ag
Ethiopia Malawi Niger Nigeria Tanzania Uganda
Aridity index 9.11* -1.07 -137.6*** -4.76 10.01** -3.54
Distance city 20k+
0.04 -0.02 -0.22*** -0.19** 0.12*** 0.06
Aridity*dist city
-0.04 0.04 1.28*** 0.30** -0.15** -0.06
HH head age -0.05 -0.01 0.01 -0.04 -0.07** -0.06*
HH head male -2.56* 0.17 -3 3.15 2.52** 0.81
HH head education
4.60** -1.021* -1.52 -1.46 -2.35** -1.33
Results control for age groups (16-20 and 21-35)

Significant differences in years of education;Differences in farm size/capita small
Education (yrs) Farm size/cap (ha)
Age group 21-35 36-60 21-35 36-60
Ethiopia 2011-12 2.2 1.3 0.01 0.01
Malawi 2010-11 6.3 5.7 0.11 0.14
Niger 2011 6.2 6.9 0.43 0.41
Nigeria 2010-11 6.8 5.4 0.06 0.07
Tanzania 2010-11 1.3 0.1 0.37 0.36
Uganda 2009-10 6.6 5.2 0.14 0.15
Average 4.9 4.1 0.19 0.19

Oaxaca-Blinder decomposition of diff bw young and oldpredicted hrs/wk in ag
Ethiopia Malawi Niger Nigeria Tanzania
36-60 15.0*** 15.1*** 23.1*** 20.5*** 20.51**16-35 13.7*** 12.4*** 28.9*** 12.0*** 19.3***
Diff. 1.3* 2.7** -5.8*** 8.5*** 1.3
Expl Unexpl. Expl Unexpl. Expl Unexpl. Expl Unexpl. Expl Unexpl.
Educ 0.5** -0.3 0.08*** -1 -0.1 4.7 0.5*** -2.6*** 1.7*** -0.5*Male 0.8*** 0.9 0.2*** 0.3 1.3 -7.7*** 1.4*** 1.1* -0.4** -0.1Farm size p/c
0.06 -0.04 0.05** -0.332 0.3 3.0 0.0 -0.4 -0.009 0.2
Wealth index
0 -0.02 -0.13*** -0.006 -0.6** 0.3 -0.1 0.4 0.2 -1.0
• Education and Gender matter most (especially as attributes, though also due to age differentiated effects);
• Differences in farm size/capita or wealth across age groups (or age differences in their effect) less important in understanding the decline/increase in youth engagement in ag

Where in agriculture might youth find employment?The role of staples, small holder farming
17Source: Tschirley et al. 2018
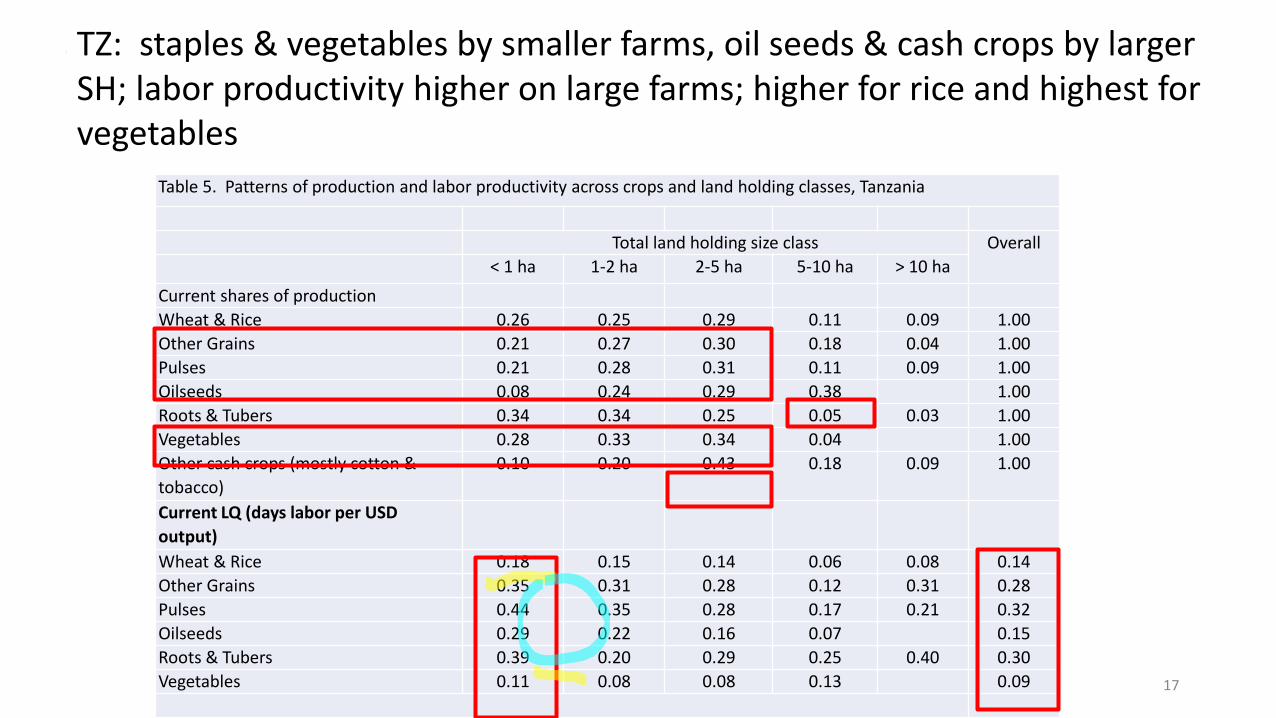
TZ: staples & vegetables by smaller farms, oil seeds & cash crops by larger SH; labor productivity higher on large farms; higher for rice and highest for vegetables
Table 5. Patterns of production and labor productivity across crops and land holding classes, Tanzania
Total land holding size class Overall
< 1 ha 1-2 ha 2-5 ha 5-10 ha > 10 ha
Current shares of production
Wheat & Rice 0.26 0.25 0.29 0.11 0.09 1.00
Other Grains 0.21 0.27 0.30 0.18 0.04 1.00
Pulses 0.21 0.28 0.31 0.11 0.09 1.00
Oilseeds 0.08 0.24 0.29 0.38 1.00
Roots & Tubers 0.34 0.34 0.25 0.05 0.03 1.00
Vegetables 0.28 0.33 0.34 0.04 1.00
Other cash crops (mostly cotton &
tobacco)
0.10 0.20 0.43 0.18 0.09 1.00
Current LQ (days labor per USD
output)
Wheat & Rice 0.18 0.15 0.14 0.06 0.08 0.14
Other Grains 0.35 0.31 0.28 0.12 0.31 0.28
Pulses 0.44 0.35 0.28 0.17 0.21 0.32
Oilseeds 0.29 0.22 0.16 0.07 0.15
Roots & Tubers 0.39 0.20 0.29 0.25 0.40 0.30
Vegetables 0.11 0.08 0.08 0.13 0.09

18Source: Tschirley et al. 2018
TZ: Simulated impact of inc growth with diet change: distribution of change in demand & associated change in demand for labor and gross returns/grower
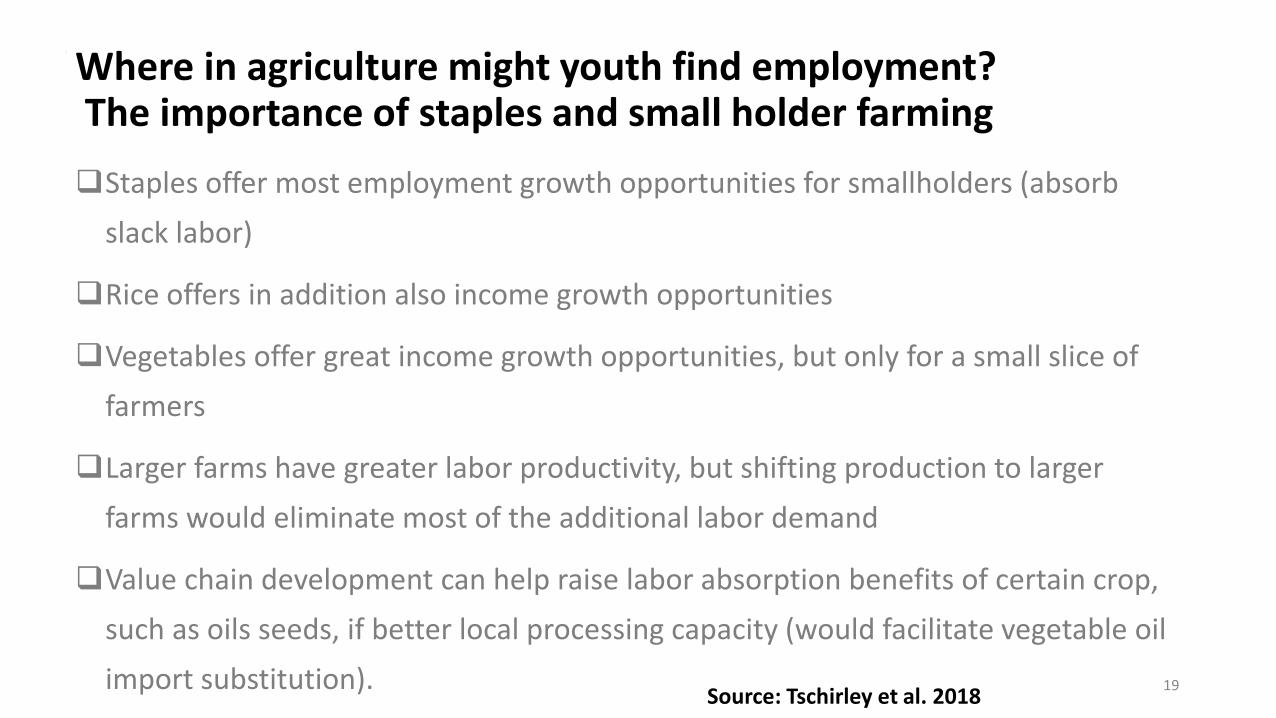
Where in agriculture might youth find employment?The importance of staples and small holder farming
19
❑Staples offer most employment growth opportunities for smallholders (absorb
slack labor)
❑Rice offers in addition also income growth opportunities
❑Vegetables offer great income growth opportunities, but only for a small slice of
farmers
❑Larger farms have greater labor productivity, but shifting production to larger
farms would eliminate most of the additional labor demand
❑Value chain development can help raise labor absorption benefits of certain crop,
such as oils seeds, if better local processing capacity (would facilitate vegetable oil
import substitution).Source: Tschirley et al. 2018
Page 20
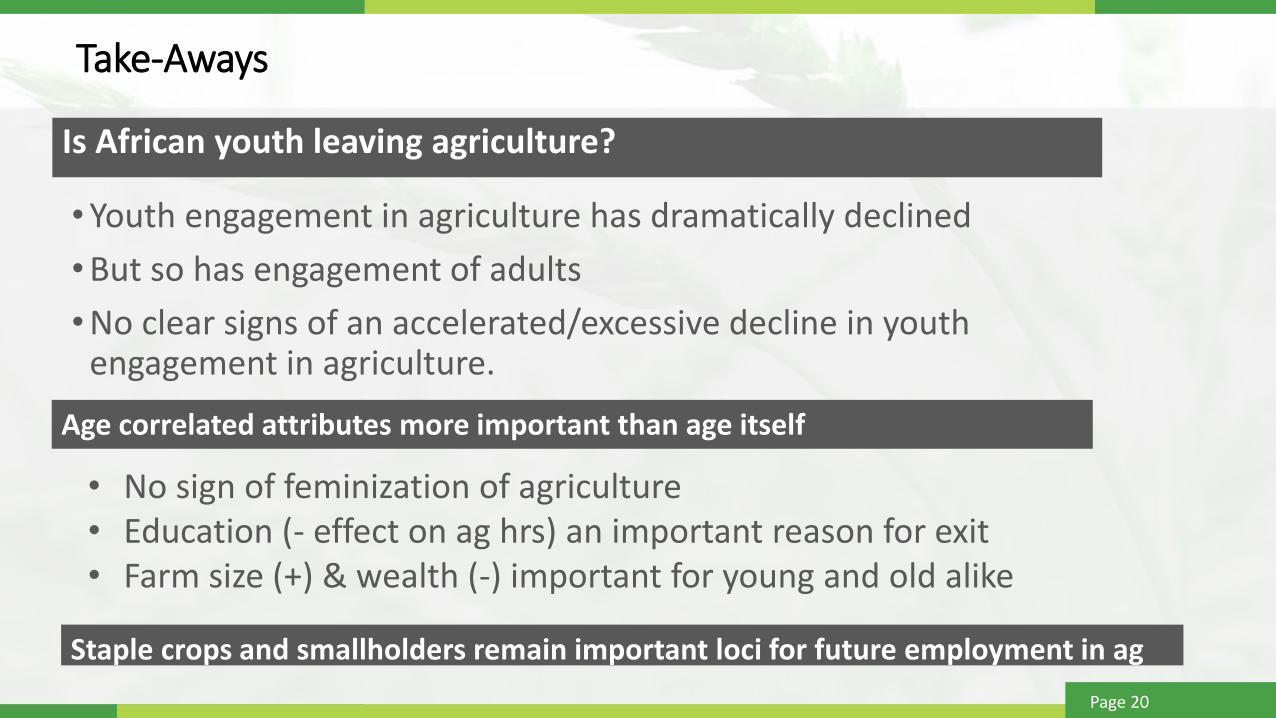
Take-Aways
Is African youth leaving agriculture?
•Youth engagement in agriculture has dramatically declined
•But so has engagement of adults
•No clear signs of an accelerated/excessive decline in youth engagement in agriculture.
Age correlated attributes more important than age itself
• No sign of feminization of agriculture• Education (- effect on ag hrs) an important reason for exit• Farm size (+) & wealth (-) important for young and old alike
Staple crops and smallholders remain important loci for future employment in ag