irrs from the ncreif database · irrs from the ncreif database jeffrey d. fisher, ph.d. ncreif...
TRANSCRIPT

IRRs from the NCREIF DatabaseJeffrey D. Fisher, Ph.D.
NCREIF ConsultantProfessor Emeritus, Indiana University
DRAFT 12/6/13

Calculating IRRs with the NCREIF Database
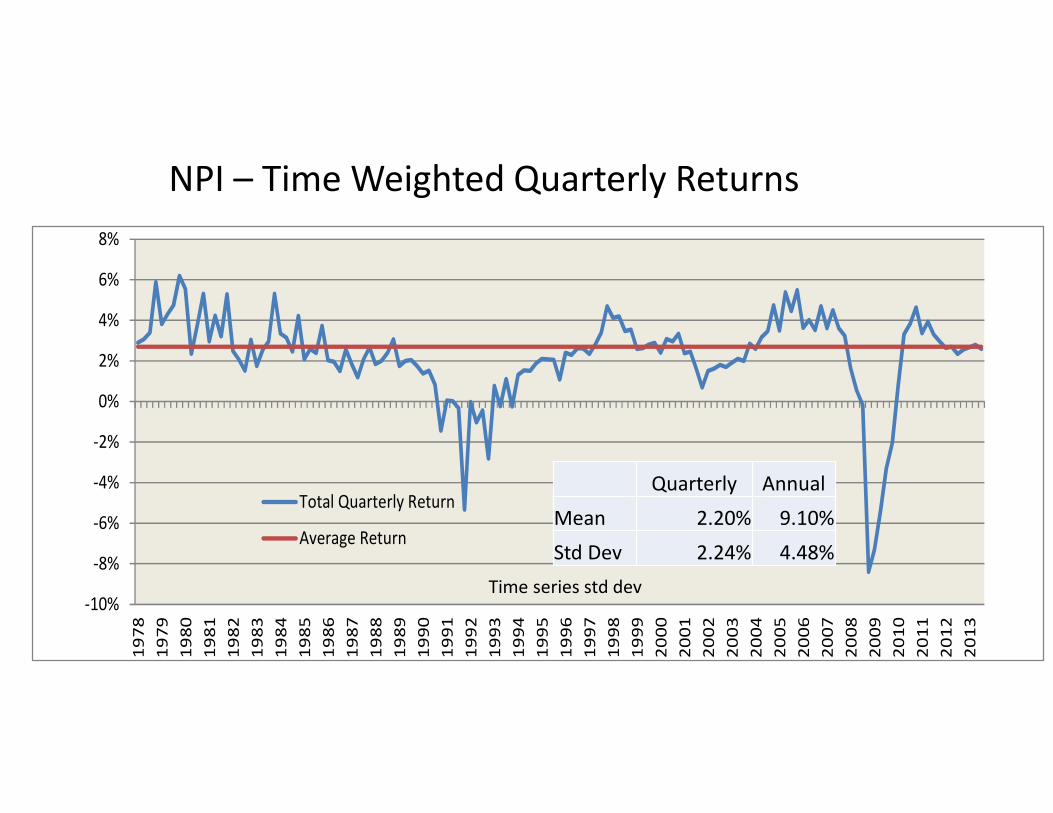
• Quick Review of IRR vs. TWR• NPI is based on Time Weighted Returns (TWR)• Each quarter a return is calculated as if the property was purchased at the
beginning of the quarter and sold at the end of the quarter.• This is like an IRR for the quarter assuming NOI is monthly and CapEx mid
quarter (hence the infamous denominator to approximate a quarterly IRR)• Relies on having a value each quarter• Quarterly returns chain linked giving equal weight to each quarterly return
(regardless of dollar amount invested).• An IRR uses a beginning investment amount, cash flows each quarter, and a
value at the end of a holding period (sale price or market value)• The amount of cash flow each quarter impacts the IRR (dollar weighted).
-10%
-8%
-6%
-4%
-2%
0%
2%
4%
6%
8%
1978
1979
1980
1981
1982
1983
1984
1985
1986
1987
1988
1989
1990
1991
1992
1993
1994
1995
1996
1997
1998
1999
2000
2001
2002
2003
2004
2005
2006
2007
2008
2009
2010
2011
2012
2013
Total Quarterly Return
Average Return
NPI – Time Weighted Quarterly Returns
Quarterly AnnualMean 2.20% 9.10%Std Dev 2.24% 4.48%
Time series std dev

0
500
1000
1500
2000
2500
3000
3500
4000
4500
-69.
9%-6
0.7%
-51.
5%-4
2.3%
-33.
0%-2
3.8%
-14.
6%-5
.3%
3.9%
13.1
%22
.3%
31.6
%40
.8%
50.0
%59
.2%
68.5
%77
.7%
86.9
%96
.2%
105.
4%11
4.6%
Return Distribution for 2013-3
Cross Sectional Std Dev.
Quarterly Annual
Mean 2.82% 11.75%
Std Dev 7.18% 14.37%
NPI 2.59%

We can calculate IRRs using the NCREIFdatabase• We know the beginning value (initial market value when a property
enters the index)• We know the cash flows each quarter (NOI, Capex, Partial Sales)• We have the sale price or an ending market value if not sold.• But still several ways of calculating

1. Pooled Cash Flows• Add all the actual cash flows for each property in the portfolio• May have different starting and ending periods for each property.• Calculate an IRR on the total cash flows.• Often used for venture capital funds• This would reflect the IRR for the entire portfolio and reflect the
dollar amount invested each quarter
Alternative ways of calculating an IRR
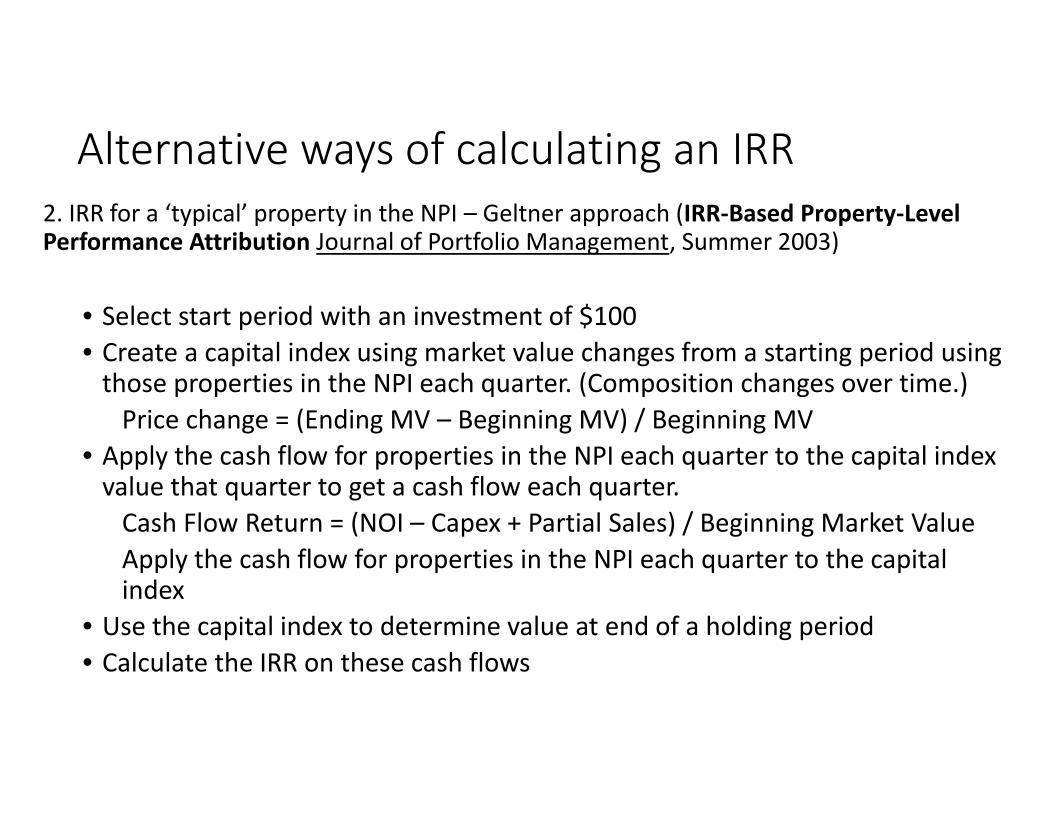
Alternative ways of calculating an IRR2. IRR for a ‘typical’ property in the NPI – Geltner approach (IRR-Based Property-LevelPerformance Attribution Journal of Portfolio Management, Summer 2003)
• Select start period with an investment of $100• Create a capital index using market value changes from a starting period using
those properties in the NPI each quarter. (Composition changes over time.)Price change = (Ending MV – Beginning MV) / Beginning MV
• Apply the cash flow for properties in the NPI each quarter to the capital indexvalue that quarter to get a cash flow each quarter.
Cash Flow Return = (NOI – Capex + Partial Sales) / Beginning Market ValueApply the cash flow for properties in the NPI each quarter to the capitalindex
• Use the capital index to determine value at end of a holding period• Calculate the IRR on these cash flows

Comments on Geltner Approach:
• Not an IRR for the NPI as if it was a portfolio considering howmuch is invested each quarter.
• Weighted more by higher value properties in the NPI for aparticular quarter and influenced more by properties in the indexlonger.
• If the index is value weighted the results are identical to thepooled cash flow approach ONLY IF there are no acquisitions ordispositions during the selected time period.
• Acquisitions and dispositions during the selected analysis periodimpact the IRR only through their impact on the average cash flowreturn and average price appreciation for the index

IRR Tool Replicating Geltner Methodology

3. Calculate IRR on each individual property
• Use actual cash flows from each individual property.• Initial value can be when it first enters database or a value at a later
point in time.• Ending value can be sale price or market value at the end of a holding
period if not sold yet.• Calculate the IRR on the above cash flows.• Can then calculate the average, standard deviation and other
distributional characteristics of these IRRs. Good for risk analysis.• The rest of this presentation deals with this approach

0
50
100
150
200
250
300
Frequency of Quarterly IRR
Quarterly Annual
Mean 2.32% 9.62%
Std Dev 3.41% 6.82%
Sold Properties from NPI

Property Type Return Standard Deviation
Apartment 9.70% 5.50%
Industrial 7.49% 7.24%
Office 6.66% 10.07%
Retail 8.06% 7.20%

0.00%
2.00%
4.00%
6.00%
8.00%
10.00%
12.00%
Apartment Industrial Office Retail
Return
Standard Deviation

Requested exercise from the RiskManagement Officer of a NCREIF Member• Assume all properties in the NPI as of the first quarter of 1990 are
purchased on that date• Properties that enter the NPI after that come in at initial market value• Sold properties leave when sold• Any properties unsold as of the 2nd quarter of 2013 are sold at their
market value• Exclude properties held less than a year (flips)• Calculate the IRR on these properties• Provide distributions for the IRR

0
100
200
300
400
500
600
700
-18%
-17%
-16%
-15%
-13%
-12%
-11%
-10% -8
%-7
%-6
%-5
%-4
%-2
%-1
% 0% 1% 3% 4% 5% 6% 8% 9% 10%
11%
12%
14%
15%
16%
IRR Frequency(Quarterly IRRs)
Apartments
Sample size 3,328
Quarterly AnnualMean 2.20% 9.09%Std Dev 2.09% 4.18%1st percentile -3.09% -11.78%3rd percentile -1.39% -5.44%5th percentile -0.71% -2.81%25th percentile 1.25% 5.08%50th percentile 2.08% 8.58%75th percentile 3.07% 12.85%95tth percentile 5.31% 23.02%
Note: Standard Deviation is a mixture of differentproperty holding periods and different uniqueproperties.

0100200300400500600700800900
1000
IRR Frequency(Quarterly IRRs) Sample size 6,069
Quarterly AnnualMean 1.79% 7.37%Std Dev 2.65% 5.30%1st percentile -6.51% -23.60%3rd percentile -3.32% -12.62%5th percentile -2.32% -8.95%25th percentile 0.60% 2.43%50th percentile 1.85% 7.61%75th percentile 2.96% 12.38%95tth percentile 5.55% 24.13%
Industrial
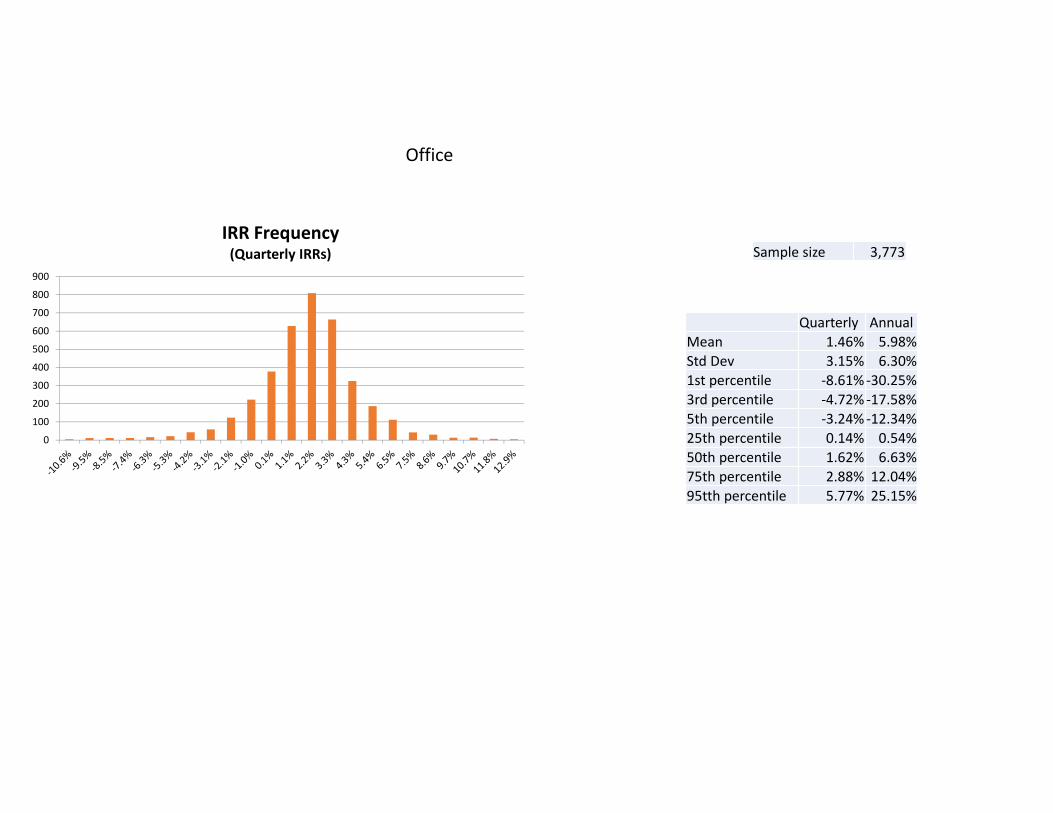
Office
0100200300400500600700800900
IRR Frequency(Quarterly IRRs) Sample size 3,773
Quarterly AnnualMean 1.46% 5.98%Std Dev 3.15% 6.30%1st percentile -8.61% -30.25%3rd percentile -4.72% -17.58%5th percentile -3.24% -12.34%25th percentile 0.14% 0.54%50th percentile 1.62% 6.63%75th percentile 2.88% 12.04%95tth percentile 5.77% 25.15%

Retail
0
100
200
300
400
500
600
700
IRR Frequency(Quarterly IRRs) Sample size 2,646
Quarterly AnnualMean 1.86% 7.66%Std Dev 2.61% 5.22%1st percentile -6.37% -23.14%3rd percentile -3.23% -12.32%5th percentile -2.19% -8.48%25th percentile 0.77% 3.12%50th percentile 1.99% 8.20%75th percentile 2.91% 12.17%95tth percentile 5.56% 24.15%

Higher Risk, Lower Return?!

Variation – extend sample of holding periods
• Still assume purchase in 1990• Assume sale after one year, after two years, after three years, etc.
until actually sold or sell at market value 2nd quarter of 2013• This generates 77,832 IRRs• Better dispersion of holding periods in the sample

0
2000
4000
6000
8000
10000
12000
14000
-58%
-53%
-48%
-43%
-38%
-32%
-27%
-22%
-17%
-12% -6
%-1
% 4% 9% 14%
19%
25%
30%
35%
40%
45%
50%
56%
61%
66%
71%
76%
82%
87%
92%
97%
IRR Frequency(Quarterly IRRs)
0
2000
4000
6000
8000
10000
12000
14000
-11% -9% -8% -7% -6% -5% -4% -2% -1% 0% 1% 2% 3% 4% 6% 7% 8% 9% 10%
IRR Frequency(Quarterly IRRs)
Same IRRs – justomitted the extremes
Probably reporting anomalies
Probablyreportinganomalies
Quarterly AnnualMean 1.67% 6.86%Std Dev 3.21% 6.43%5th percentile -2.94% -11.23%10th percentile -1.30% -5.09%25th percentile 0.60% 2.42%50th percentile 1.93% 7.95%75th percentile 2.94% 12.31%95tth percentile 5.27% 22.82%
Possible Next Steps
• For each property, allow purchase and sale in any combination ofstart and end dates
• Calculate IRRs for cohorts, e.g., start in 1995 and end in 2000• Again break down by property type and also region etc.• Use TBI to adjust when appraised value used for terminal value rather
than actual sale price?