irrigation development in alberta
TRANSCRIPT

Irrigation Development in Alberta Water Use and Impact on Regional Development St. Mary River and “Southern Tributaries” Watersheds
Alberta Agriculture, Food and Rural Development Intenational Joint Commission Submission
August 2004
Alberta Agriculture, Food and Rural Development International Joint Commission Submission
Irrigation Development in Alberta Water Use and Impact on Regional Development St. Mary River and “Southern Tributaries” Watersheds
Summary Points
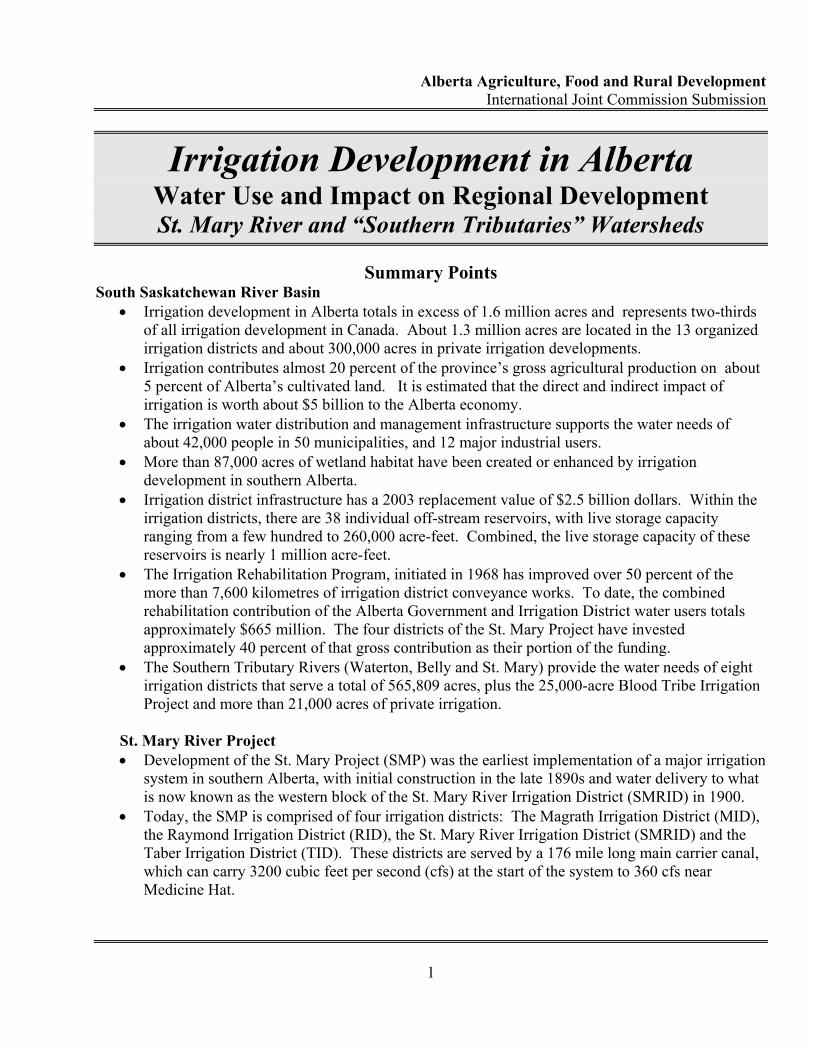
South Saskatchewan River Basin • Irrigation development in Alberta totals in excess of 1.6 million acres and represents two-thirds
of all irrigation development in Canada. About 1.3 million acres are located in the 13 organized irrigation districts and about 300,000 acres in private irrigation developments.
• Irrigation contributes almost 20 percent of the province’s gross agricultural production on about 5 percent of Alberta’s cultivated land. It is estimated that the direct and indirect impact of irrigation is worth about $5 billion to the Alberta economy.
• The irrigation water distribution and management infrastructure supports the water needs of about 42,000 people in 50 municipalities, and 12 major industrial users.
• More than 87,000 acres of wetland habitat have been created or enhanced by irrigation development in southern Alberta.
• Irrigation district infrastructure has a 2003 replacement value of $2.5 billion dollars. Within the irrigation districts, there are 38 individual off-stream reservoirs, with live storage capacity ranging from a few hundred to 260,000 acre-feet. Combined, the live storage capacity of these reservoirs is nearly 1 million acre-feet.
• The Irrigation Rehabilitation Program, initiated in 1968 has improved over 50 percent of the more than 7,600 kilometres of irrigation district conveyance works. To date, the combined rehabilitation contribution of the Alberta Government and Irrigation District water users totals approximately $665 million. The four districts of the St. Mary Project have invested approximately 40 percent of that gross contribution as their portion of the funding.
• The Southern Tributary Rivers (Waterton, Belly and St. Mary) provide the water needs of eight irrigation districts that serve a total of 565,809 acres, plus the 25,000-acre Blood Tribe Irrigation Project and more than 21,000 acres of private irrigation.
St. Mary River Project • Development of the St. Mary Project (SMP) was the earliest implementation of a major irrigation
system in southern Alberta, with initial construction in the late 1890s and water delivery to what is now known as the western block of the St. Mary River Irrigation District (SMRID) in 1900.
• Today, the SMP is comprised of four irrigation districts: The Magrath Irrigation District (MID), the Raymond Irrigation District (RID), the St. Mary River Irrigation District (SMRID) and the Taber Irrigation District (TID). These districts are served by a 176 mile long main carrier canal, which can carry 3200 cubic feet per second (cfs) at the start of the system to 360 cfs near Medicine Hat.
1

Alberta Agriculture, Food and Rural Development International Joint Commission Submission
• Two hydro power plants are currently located on this canal, with a total generating capacity of
about 30 megawatts of electric power. A third nine-megawatt hydro power plant was recently commissioned on this main carrier canal near the town of Raymond.
• Approximately 1500 miles of canals and pipelines, plus 18 off-stream reservoirs convey water to more than 2,000 irrigation water users irrigating about 524,000 acres of land, 15-20 recreational areas, several rural municipalities, industry and various other uses. The total replacement cost for the SMP infrastructure is estimated to be about $923 million.
• Irrigation growth has been accompanied by the transition by irrigation producers to highly efficient lower energy low-pressure centre pivot sprinkler systems.
• Currently, SMP district irrigation producers are applying sufficient irrigation water to satisfy 75 -100 percent of optimum crop requirements, with an average application of about 84 percent. This average is expected to increase to about 90 percent over the next 10-15 years.
• It has been estimated that, within the SMP districts and private irrigation areas off the St. Mary River, there has been an investment in irrigation equipment alone, over the last 15 years, of approximately $250 million. This does not include land or water right acquisition costs, or the additional capital investment costs associated with other cultural aspects of specialized irrigation farming.
• In addition to irrigation of crops, water is delivered to more than 15 rural communities with an estimated total population of close to 20,000 individuals. In addition to the municipal users and the estimated 12,000 individuals attached to irrigation water user agreements, many rural residents, estimated at an additional 5,000 persons, are directly impacted for their water supplies through access to household use or water cooperative agreements with the districts.
Economic Impact of Irrigation in Southern Alberta • Irrigation brings stability to agricultural production and increases land productivity by 300
percent or more compared to dryland production. • It is estimated that, without irrigation development, the regional population would be reduced by
65-75 percent. • It is estimated that the total agricultural benefits resulting from irrigation are in excess of $5
billion and more than 13,000 full time jobs. • It is estimated that 13 percent or more of the regional gross domestic product, 19 percent of
regional production and 30 percent of regional employment opportunities in southern Alberta are directly or indirectly associated with irrigated agriculture.
• Almost 35 percent of the of the province’s gross domestic product in processing industries is directly tied to irrigated production. The ratio between the value of agro-processing shipments and farm receipts shows a multiplier of 2.66 in the irrigation areas of southern Alberta, compared to only 1.05 for dryland regions of Alberta. In addition, at least 40 industries, employing more than 4,000 people, use water from southern Alberta’s irrigation districts.
2

Alberta Agriculture, Food and Rural Development International Joint Commission Submission
Impact of Water Supply Shortfall in the SMP • If Montana were to hold back an additional 50,000 acre-feet of water, this would translate into
the loss of approximately 40,000 acres of diversified irrigation development in the St. Mary Project.
• This would have major economic implications not only for irrigators, but also for those industries, stock water, domestic, municipalities, recreation users and wildlife habitat systems that depend on the water supplies from the St. Mary River.
3

Alberta Agriculture, Food and Rural Development International Joint Commission Submission
Introduction Irrigation development in Alberta totals in excess of 1.6 million acres and represents two-thirds of all irrigation development in Canada. Almost 98 percent of Alberta’s irrigation development occurs within the South Saskatchewan River Basin (SSRB) and the Milk River Basin watersheds. The development of the irrigation industry in southern Alberta has significantly improved the economic stability in this semi-arid region of the province, and contributes almost 20 percent of the province’s gross agricultural production on about 5 percent of Alberta’s cultivated land. It is estimated that the direct and indirect impact of irrigation is worth about $5 billion to the Alberta economy. In addition, the water distribution and management infrastructure supports the water needs of about 42,000 people in 50 municipalities, and 12 major industrial users. Eighty-nine irrigation supported water bodies provide recreational activities in southern Alberta, that include boating, fishing, swimming and water skiing. There are seven provincial parks, 26 municipal parks and 13 day-use recreational areas on or near irrigation reservoirs. It is estimated that total user-days are about 400,000 each year. It is estimated that tourists spend about $2 million each year on water-based recreation in southern Alberta. The monetary impact of recreational activities on the regional economy has been estimated at about $29 million each year. In addition, more than 20 irrigation reservoirs provide an estimated 250,000 angler-days of recreational fishing, and yield more than 300 tons of commercial fish annually, valued at about $500,000. More than 87,000 acres of wetland habitat has been created or enhanced by irrigation development in southern Alberta. It has been estimated that without irrigation development in this region, the population base and available services in the region would be approximately one-third of what they are today. This is largely due to the diversified agricultural industry that has evolved and become strongly entrenched within local communities because of the assurety of water and the value-adding agri-food industries that grow out of the diversified irrigation production. Irrigation water use is authorized in Alberta under two different legislative tools: the Water Act and the Irrigation Districts Act. The Water Act, defines the licensing requirements and allocations to all users, whether they be individuals or large organizational developments such as irigation districts. Secondly, the Irrigation Districts Act defines the water management responsibilities and authorities of such organizations, given the distributed authority provided to them through their licences issued under the Water Act. Irrigation is authorized to take place either through individual private user projects, as is the case along the Milk River, for example, or through a limited number of licenses issued to the 13 organized irrigation districts representing several thousand water users.
History of Development The development and management of irrigation districts in Alberta evolved during the past 100 years. Alberta's major irrigation systems were initially developed by corporate enterprises with the expectation 4

Alberta Agriculture, Food and Rural Development International Joint Commission Submission
they would increase productivity and land values enough to pay construction and annual operation and maintenance costs, as well as a return on the investment. The Canadian Department of the Interior authorized construction of works for delivery of water to a number of corporate irrigation projects and committed large quantities of water for irrigation. Five large corporate irrigation projects accounted for over 97 percent of this water commitment. By 1919 almost 90,000 acres were being irrigated within areas of what are currently known as the Western, Eastern, St. Mary River, Magrath and Raymond Irrigation Districts. By 1950, 11 of the current 13 irrigation districts were established and operating. About 450,000 acres were being irrigated within the areas of the current irrigation districts by that year. The creation of the Prairie Farm Rehabilitation Administration (PFRA) in 1935 increased federal government involvement in the development of water delivery systems for irrigation. In 1950 PFRA initiated the construction and operation of the main water storage and delivery works associated with the St. Mary Project. These works included the St. Mary, Milk River Ridge and Waterton Reservoirs, the Belly River diversion, and the connecting canals. On the same project, the province committed to undertake major rehabilitation and expansion work between the Milk River Ridge Reservoir and the city of Medicine Hat. By 1970, both the province and the federal government were involved in rehabilitation and expansion of water delivery works within almost all of the 13 districts. The area assessed for irrigation within the districts had grown to almost 692,000 acres. Major changes in the irrigation industry have taken place since 1970. Direct, hands-on involvement in irrigation development and management was transferred from the federal government to the province and the irrigation water users. Major improvements in infrastructure and technological advances have led to unprecedented rapid irrigation development and water use efficiency. In 1969, funding was announced to assist the irrigation districts to rehabilitate and expand aging water distribution works within the districts. Under this cost-share program, the districts paid 14 percent of the construction costs and the province (AAFRD) paid 86 percent. The distribution of costs approximately reflected the distribution of benefits to the irrigation producer and to the region, province and country. This cost-share program was reaffirmed and extended for five years in 1975, and has been extended several times since 1980. The cost-sharing ratio was changed from 86/14 to 80/20 in 1994, and to 75/25 in 1995. Work is continuing under the 1995 cost-sharing formula. The irrigation districts experienced unprecedented growth during the decade from 1970 to 1980. The area on the assessment rolls increased from 691,591 acres in 1970 to 1,037,173 acres in 1980 – an increase of 50 percent. This was due, in large part, to the growing popularity of sprinkler irrigation, which facilitated the irrigation of lands previously unserviceable. Irrigation development continues to increase to this day, with the current irrigation area within districts at 1,325,438 acres. This expansion is facilitated by an irrigation infrastructure that is modernized and in good condition. The irrigation districts are well established and provide dependable water supplies to the irrigation farmers and to communities, industries, livestock, domestic users, recreation users and wildlife conservation projects within their areas. Crop diversity and value-added commercial enterprises are encouraged and are increasing within the districts, contributing to the regional economic well-being. 5

Alberta Agriculture, Food and Rural Development International Joint Commission Submission
The total volume of water licensed to the 13 districts is currently 2,783,910 acre-feet. In addition, as of 2003, there were more than 230,000 acres of private irrigation licensed within the SSRB and more than 19,000 acres licensed within the Milk River Basin. The total allocation for both irrigation district and private irrigation in the SSRB and Milk Rivers is almost 3.1 million acre-feet. Irrigation district owned, maintained and operated infrastructure in the SSRB has a 2003 replacement value of $2.5 billion (Cdn) dollars. This infrastructure includes various facilities that contibute to the network of diversion, storage, conveyance and drainage works. Within the irrigation districts, there are 38 individual off-stream reservoirs, ranging in live storage capacity from a few hundred to 260,000 acre-feet. Combined, the live storage full capacity of these reservoirs is nearly one million acre-feet. Based on several studies, some going as far back as the 1960s, the Alberta Government recognized the significant value that irigation development plays in the Alberta economy. This is not just based on the added primary production capacity that irrigation brings to the semi-arid region off the province, but also in adding value to that production and in sustaining an effective water management system for a variety of users. As a result, the Government implemented an irrigation works rehabilitation program in 1968. The infrastructure rehabilitation was also designed to achieve better water conveyance efficiency and also to facilitate irrigation expansion in the future. Through this program, over 50 percent of the more than 7,600 kilometres of irrigation district conveyance works have been rehabilitated. The Alberta Government annually allocates $19 million to the 13 irrigation districts to be divided up proportionally according to their resepctive irrigation areas and replacement values of their works. These funds are to be matched on a 75:25 cost-sharing basis, which means that the irrigation districts themselves are required to contribute approximately $6.33 million annually to this rehabilitation undertaking. Some districts carry out even more infrastructure replacement and rehabilitation using their own funds. To date, the combined rehabilitation contribution of Government and irrigation district water users totals approximately $665 million. The four districts of the SMP have invested approximately 40 percent of that gross contribution as their portion of the funding.
The St. Mary River Irrigation Project Irrigation water supplies from southern tributary rivers (Waterton, Belly and St. Mary) of the Oldman River, are derived through an integrated and extensive water management system that links all three rivers (Figure 1). These three rivers provide the water needs of eight irrigation districts that serve a total of 565,809 acres, plus the 25,000-acre Blood Tribe Irrigation Project and more than 21,000 acres of private irrigation. The St. Mary Reservoir, an on-stream reservoir located on the St. Mary River, is the largest irrigation supply reservoir in Alberta, with almost 300,000 acre-feet of live storage. The value of the St. Mary River system in supporting overall downstream water demands is highly significant.
6
Alberta Agriculture, Food and Rural Development International Joint Commission Submission
FORTY MILECOULEE
FORTY MILERES
SAUDERRES
OLDMANRIVER
SOUTHSASKATCHEWAN RIVER
HORSEFLY RES
TABERRES
FINCASTLERES
SHERBURNERES
ST.MARYRESERVOIR
WATERTONRESERVOIR
WATERTON RIVER
MILK RIVER
VERDIGRISLAKE
MILK RIVERRIDGE
RES
ETZIKOM COULEE
ST.M ARY RIVER
WATERTONLAKES
JENSENRES
PAYNELAKE
MURRAYRES
BOW RIVER
BELLY RIVER
CHINRES
MAIN CANAL
MOKOWANRES
PAKOWKILAKE
CARDSTON
BOWISLAND
TABER
MAGRATH
LETHBRIDGE
MEDICINEHAT
UID
LIDAID
MVID
BTAP
MID
RID
SMRID TID
SMRID
SMRID
ALBERTAMONTANA
FORTY MILECOULEE
FORTY MILERES
SAUDERRES
OLDMANRIVER
SOUTHSASKATCHEWAN RIVER
HORSEFLY RES
TABERRES
FINCASTLERES
SHERBURNERES
ST.MARYRESERVOIR
WATERTONRESERVOIR
WATERTON RIVER
MILK RIVER
VERDIGRISLAKE
MILK RIVERRIDGE
RES
ETZIKOM COULEE
ST.M ARY RIVER
WATERTONLAKES
JENSENRES
PAYNELAKE
MURRAYRES
BOW RIVER
BELLY RIVER
CHINRES
MAIN CANAL
MOKOWANRES
PAKOWKILAKE
CARDSTON
BOWISLAND
TABER
MAGRATH
LETHBRIDGE
MEDICINEHAT
UID
LIDAID
MVID
BTAP
MID
RID
SMRID TID
SMRID
SMRID
ALBERTAMONTANA
7
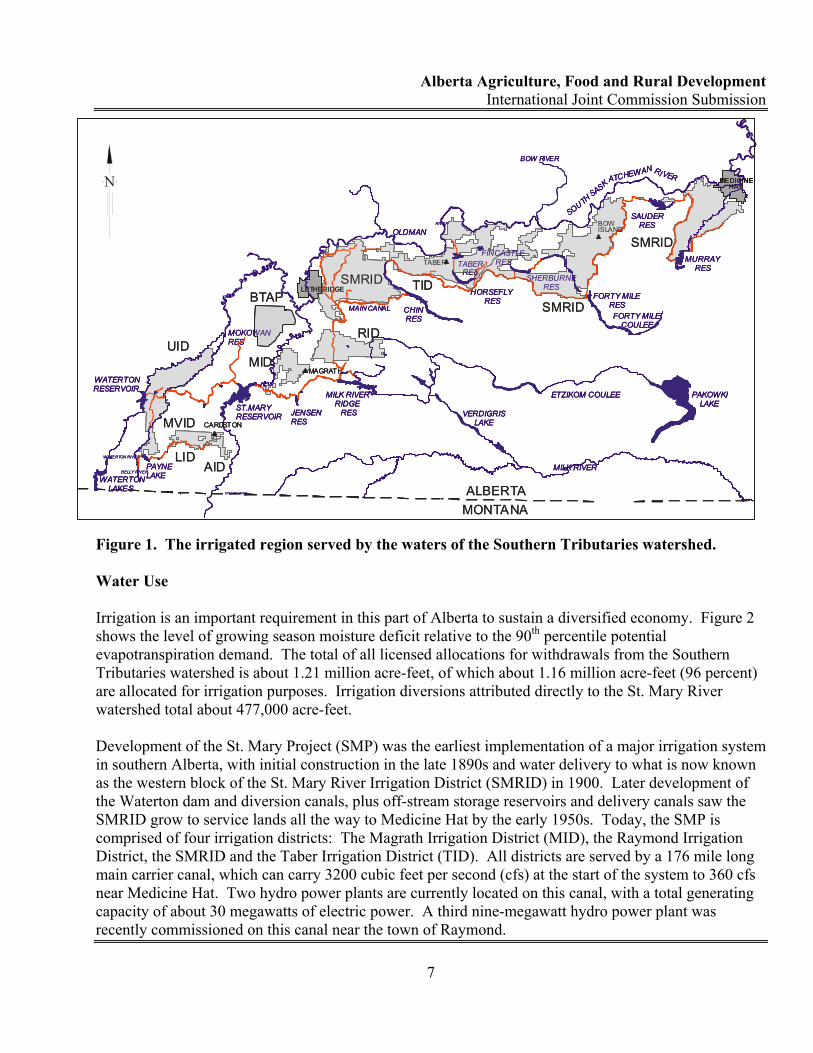
N Figure 1. The irrigated region served by the waters of the Southern Tributaries watershed.
Water Use Irrigation is an important requirement in this part of Alberta to sustain a diversified economy. Figure 2 shows the level of growing season moisture deficit relative to the 90th percentile potential evapotranspiration demand. The total of all licensed allocations for withdrawals from the Southern Tributaries watershed is about 1.21 million acre-feet, of which about 1.16 million acre-feet (96 percent) are allocated for irrigation purposes. Irrigation diversions attributed directly to the St. Mary River watershed total about 477,000 acre-feet. Development of the St. Mary Project (SMP) was the earliest implementation of a major irrigation system in southern Alberta, with initial construction in the late 1890s and water delivery to what is now known as the western block of the St. Mary River Irrigation District (SMRID) in 1900. Later development of the Waterton dam and diversion canals, plus off-stream storage reservoirs and delivery canals saw the SMRID grow to service lands all the way to Medicine Hat by the early 1950s. Today, the SMP is comprised of four irrigation districts: The Magrath Irrigation District (MID), the Raymond Irrigation District, the SMRID and the Taber Irrigation District (TID). All districts are served by a 176 mile long main carrier canal, which can carry 3200 cubic feet per second (cfs) at the start of the system to 360 cfs near Medicine Hat. Two hydro power plants are currently located on this canal, with a total generating capacity of about 30 megawatts of electric power. A third nine-megawatt hydro power plant was recently commissioned on this canal near the town of Raymond.

Alberta Agriculture, Food and Rural Development International Joint Commission Submission
Approximately 1500 miles of canals and pipelines, plus 18 off-stream reservoirs convey water to more than 2,000 irrigation water users irrigating about 524,000 acres of land, 15-20 recreational areas, several rural municipalities, industry and various other uses. Table 1 summarizes the water commitments to these four districts, specifically as they relate to irrigation use, as well as for the private irrigation users deriving their water from the St. Mary River watershed. Table 1. Irrigation water allocations within the SMP and private projects.
Irrigation District
Total Licensed Volume
(acre-feet)
Licensed Volume from St. Mary River
(acre-feet)
No. of Water Users
Irrigation Area (acres)
Magrath 34,000 14,8331 138 18,320 Raymond 81,000 33,4171 299 46,304
St. Mary River 722,000 352,7821 1,947 372,114 Taber 158,000 70,1671 481 82,562
Private 5,793 5,7932 63 4,604 TOTALS 1,000,793 476,992 2,865 523,904
1 Volumes are those pertaining specifically to licensed withdrawals from the St. Mary River, or as one-
third of those volumes licensed jointly from the three Southern Tributary Rivers. 2 Volume represents the total allocations, according to Alberta Environment files, specifically for
irrigation purposes outside of any irrigation district and for which the diversions are specific to the St. Mary River.
700
720
740760
660 68
0
500
520
540
560
580
600
620
6 40
700
BOW RIVER
SOUTH
SASK
ATC
HE
WA
N
RIVER
LITTLE
BOWRIVER
MILK RIVER
OLDMAN
RIVER OLDMANRIVER
LETHBRIDGE
MEDICINEHAT
AlbertaMontana
Figure 2. Net growing season moisture deficit in the southern region of the SSRB.
8

Alberta Agriculture, Food and Rural Development International Joint Commission Submission
Crop Production A large portion of the SMP region, particularly to the east of the Lethbridge area, is some of the most productive and diversified irrigation farming in the province. Table 2 identifies the main crop groups grown within the SMP. Of particular interest are the special crops, which include potatoes, sugar beets, sweet corn, dry beans, mint, and fresh vegetables. Much of the forage and cereal production support the extensive livestock feeding industry located in and adjacent to southern Alberta’s irrigated areas. Table 2. Crop mix in the SMP.
Irrigation District
Forages Cereals Oilseeds Special Crops
Magrath 55.3% 35.5% 7.0% 1.8% Raymond 55.7% 37.4% 5.1% 1.8% St. Mary 35.3% 34.9% 10.9% 17.6%
Taber 35.2% 26.7% 2.3% 32.6% Weighted Avg. for All Districts 38.4% 34.3% 9.0% 18.3%
On-farm water application in southern Alberta has changed considerably over the last 20 to 30 years. Figure 3 shows the growth of irrigation within Alberta over the last 40 years and changes in on-farm irrigation application technologies. A continued shift to the use of highly efficient, low-pressure drop-tube pivot irrigation systems is now taking place.
0200400600800
1,0001,2001,4001,6001,800
1965 1970 1975 1980 1985 1990 1995 2000 2003
64.3%
22.5%
13.2%
ACRES (Thousands)
Pivot
Wheel-move, etc.
Surface
Figure 3. Alberta irrigation growth and on-farm system development trends. Figure 4 shows the irrigation acreage growth that has occurred within the SMP districts through the last 30 years.
9

Alberta Agriculture, Food and Rural Development International Joint Commission Submission
0
100
200
300
400
500
600
1970
1972
1974
1976
1978
1980
1982
1984
1986
1988
1990
1992
1994
1996
1998
2000
2002
Year
Irrig
atio
n A
rea
(Acr
es x
Tho
usan
d)
Figure 4. Growth in irrigation development within the four SMP districts.
The irrigation growth has been accompanied by the transition by irrigation producers to more efficient lower energy low-pressure centre pivot sprinkler systems. Table 3 lists the proportional distribution of on-farm irrigation system types, by irrigation district within the SMP, as well as the overall weighted average distribution of systems for all four districts. Table 3. On-farm irrigation systems mix distribution with the SMP irrigation districts.
Irrigation District
Centre Pivot
Wheel-Move Side-Roll
Surface Irrigation Other
Magrath 38.7% 39.7% 20.4% 1.2% Raymond 39.7% 48.8% 9.5% 1.9% St. Mary 74.0% 21.3% 4.1% 0.6%
Taber 66.9% 28.8% 4.1% 0.2% Weighted Avg. for All Districts 68.7% 25.6% 5.2% 0.5%
Irrigation producers are striving to apply the needed water to meet crop moisture requirements in order to optimize production. Table 4 provides a comparative assessment of water requirement for various sample crop types , categorized by crop category and whether or not they have a low (Lo) or high (Hi) consumptive use (CU) of water.
10

Alberta Agriculture, Food and Rural Development International Joint Commission Submission
Table 4. Irrigated crop water requirements (90th percentile) within the SMP districts.
Crop Category
Typical Crop Type
Max. Daily Water Use
(mm)
Total Seasonal Consumptive
Water Use
Growing Season (Days)
Cereal – LoCU Malt Barley 7.2 390 85 Cereal – HiCU Soft Wheat 7.4 480 115 Forage – LoCU Barley Silage 7.2 370 70 Forage – HiCU Alfalfa 7.6 680 140
Oilseed Canola 7.7 450 110 Specialty – LoCU Field Beans 5.7 380 105 Specialty – HiCu Sugar Beets 6.0 560 135
With the adoption of newer technology on-farm systems, irrigation producers are able to irrigate crops when needed, and are applying irrigation water nearer to optimum. Currently, SMP district irrigation producers are irrigating at 75-100 percent of optimum, with an average of about 84 percent. This average is expected to increase to about 90 percent over the next 10-15 years.
Water Supply, Conveyance and Application Infrastructure
The ability to divert, store and convey water to the irrigation water users, particularly those within the irrigation districts, requires an extensive and sophisticated infrastructure system. These works can be divided up into three components: the Headworks; the Irrigation District Works; and the On-Farm Application Systems. The headworks include all of those major structures and facilities that divert, store and convey water to downstream users and that are owned and operated by the Government of Alberta’s Department of Environment (AENV). These works include on-stream dams and reservoirs such as the Waterton and St. Mary, the Belly River diversion, the Milk River Ridge Reservoir and all the inter-connecting canals and structures that supply water to the start of the Irrigation Districts. The RID, SMRID and TID all receive their water from the Milk River Ridge Reservoir through the common carrier main canal that serves all three districts, which is owned and operated by the SMRID under agreement with the RID and TID. The MID diverts its water directly from several different turnout locations along the St. Mary Headworks Canal between the St. Mary Reservoir and Milk River Ridge Reservoir. Table 5 provides a summary of the associated works for each district in the SMP. The drainage works quantified refer only to those works that are specifically constructed as open channel or buried pipeline drains. This does not account for the more than 700 kilometres of natural drainage courses that the districts utilize and maintain to manage irrigation return water. Major structures refer to significant individually-identified works such as reservoir dams and outlet headgates, major drop and control structures along main canals, and the like. Through a locally developed infrastructure management system, the extent of works has not only been inventoried but the type of construction and
11

Alberta Agriculture, Food and Rural Development International Joint Commission Submission
current replacement value derived. The total replacement cost for the SMP infrastructure is estimated to be about $923 Million (Table 6). Table 5. Summary of irrigation district works owned and operated by the SMP districts.
Irrigation District Type of Works MID RID SMRID TID
TOTALS
Conveyance (km) 101 241 1,786 331 2,459 Drainage (km) 12 18 26 9 65
Major Structures (units) - - 48 12 60 TOTALS
(Accrues lengths only) 113 259 1,812 343 2,524
Table 6. Summary of SMP district infrastructure replacement costs.
Irrigation District Type of Works MID RID SMRID TID
TOTALS
Conveyance $19,523,684 $47,145,093 $524,228,412 $84,797,788 $675,694,977 Drainage $474,250 $719,020 $1,264,115 $362,866 $2,820,251
Major Structures - - $234,654,000 $9,906,000 $244,560,000
TOTALS
$19,997,934 $47,864,113 $760,146,527 $95,066,654 $923,075,228
As a result of the Alberta Government/Irrigation Districts rehabilitation program, almost 75 percent of the SMP districts’ works have been developed with some of the latest technologies that provide them with more efficient water management capabilities and greatly reduced water losses (Table 7). Table 7. Summary of SMP district conveyance infrastructure by proportion of
construction type. Irrigation District
Type of Works MID RID SMRID TID
Weighted Average for All SMP
Districts Earth Canals 49.4% 24.2% 27.1% 7.6% 25.1% Lined Canals 1.6% 37.7% 35.1% 44.4% 35.2%
Buried Pipeline 49.1% 38.1% 37.8% 48.0% 39.7%
Of the 38 off-stream reservoirs within the works of the 13 irrigation districts, three of the four districts within the SMP own, operate and maintain 17 of them. The combined live storage of these amounts to approximately 330,000 acre-feet, or about 35 percent of all irrigation district-owned storage.
The third and final component of the irrigation water management system is the on-farm water application methods that are accountable for applying more than 75 percent of the water that is actually diverted for irrigation district use. It has been estimated that, within the SMP districts and private
12

Alberta Agriculture, Food and Rural Development International Joint Commission Submission
irrigation areas served by the St. Mary River, there has been an investment in irrigation equipment alone, over the last 15 years, in the amount of approximately $250 million. This does not include land or water right acquisition costs, or the additional capital investment costs associated with other cultural aspects of specialized irrigation farming. Other Water Users Dependent on the St. Mary River and SMP Districts The waters diverted into the irrigation district systems provide for more than just the irrigation of crops. The municipal licenses authorize water deliveries to more than 15 rural communities with an estimated total population of close to 20,000 individuals. In addition to the municipal users and the estimated 12,000 individuals attached to irrigation water user agreements, many rural residents, estimated at an additional 5,000 persons, are directly impacted for their water supplies through access to household use or water cooperative agreements with the districts. Many of these non-irrigation water users are located a long distance from the water source and are therefore depend on the irrigation district conveyance and storage systems to supply their water (Table 8). Table 8. Summary of all “other use” license allocations from the St. Mary River.
Total of All Licences Allocations Through Irrigation District Works
Purpose of Water Use
No. of Licences Volume (ac-ft) No. of Licences Volume (ac-ft) Irrigation 75 476,992 37 473,808 Municipal 48 14,317 43 12,775
Stock Watering 226 3,248 69 2,378 Commercial 31 4,808 24 4,497 Industrial 6 1,113 6 1,113
Storage / Stabilization 10 15,263 9 15,257 TOTALS 396 515,741 188 509,828
In addition, rural and urban parks, golf courses, livestock feeding operations, wetlands, oil field exploration and development and particularly agri-food processing all depend on this supply of water. With respect to the latter, two $100 million potato processing plants were constructed in the past five years. One of these is totally dependent on water delivery through the works of the irrigation districts. Similarly, the Roger’s Sugar refinery in Taber accesses its water through the Taber Irrigation District, as do such other fresh vegetable and potato processors who receive their water through municipal licenses drawing their water “through the works of” irrigation districts. Irrigation Water Use Efficiency Improvements Many changes and adaptations to new technology have occurred in Alberta’s irrigated areas. Improved water use efficiency has resulted through conversion from surface irrigation to low pressure, drop tube pivot irrigation systems. Table 9 provides irrigation water use efficiency changes over the last 35 years. The four SMP districts have the highest water use efficiency rating of any of the 13 irrigation districts.
13

Alberta Agriculture, Food and Rural Development International Joint Commission Submission
This improvement in water use has allowed for some water savings and more water freed-up for more effective irrigation, higher productivity and the irrigation of new lands. While improvements at the farm level were occurring, the rehabilitation of irrigation district water management works was also facilitating improvements in water use efficiencies within the distribution component. Previous losses due to evaporation and seepage of up to 15 percent of the gross diversion have now been reduced to a net 5 to 6 percent. This has been accomplished through the on-going rehabilitation of irrigation works, reducing seepage losses dramatically. In addition, irrigation return flows have been reduced from 25 - 35 percent of the gross diversion to less than 20 percent. Within the four SMP districts, the weighted average return flow is presently about 16 percent. Table 9. A comparison of on-farm application efficiency trends, between SMP districts.
On-Farm Application Efficiency Irrigation District 1965 1980 1995 2000
Magrath 31% 50% 58% 72% Raymond 32% 52% 66% 72%
St. Mary River 35% 64% 71% 75% Taber 38% 65% 69% 74%
Weighted Average for All Districts 36% 63% 69% 74%
Overall, through the past 35 to 40 years, the combined effect of all irrigation works and systems improvements as resulted in approximately a 38 percent improvement in beneficial water use, from a net 13 percent efficiency in 1965 to a net 51 percent efficiency in 2000.
Economic Impact of Irrigation Development Several studies have demonstrated the significant economic importance of irrigation to southern Alberta and to Alberta as a whole. Irrigation brings stability to agricultural production and increases land productivity by 300 percent or more compared to dryland. It is estimated that without irrigation development, the regional population would be reduced by 65-75 percent, which would in turn reduce the tax base and support for rural and urban amenities such as roads, schools and hospitals. It is estimated that 13 percent or more of the regional gross domestic product, 19 percent of regional production and 30 percent of regional employment opportunities in southern Alberta are directly or indirectly associated with irrigated agriculture. Almost 35 percent of the of the province’s gross domestic product in processing industries is directly tied to irrigated production. The ratio between the value of agri-processing shipments and farm receipts shows a multiplier of 2.66 in the irrigation areas of southern Alberta, compared to only 1.05 for dryland regions of Alberta. In addition, at least 40 industries, employing more than 4,000 people, use water from southern Alberta’s irrigation districts. The irrigation water management systems also supply municipalities and industries with water, and many recreational and wild life enhancement opportunities are created. For example, it has been estimated that through day use and camping activities, wildlife observation, as well as hunting and
14

Alberta Agriculture, Food and Rural Development International Joint Commission Submission
fishing activities based on or around the irrigation infrastructure, more than $28 million is injected into the local economy. The agricultural value arising from irrigation can be measured in three economic generator components:
a) The primary production value of crops and livestock; b) The backward linkages; and c) The forward linkages.
The primary production value is the gross dollar output for the raw commodities leaving the farm gate. In the economic analysis, backward linkages refer to the value of all the economic generators that are required as inputs to support the primary production sector. This includes equipment suppliers, fertilizer and seed suppliers, fuel distributors, etc. The forward linkages include all those services and product supplies that contribute to post-production value adding and distribution (e.g. beef processing plants, potato processing, shipping and transportation). In 2000 an economic study was completed as part of a comprehensive assessment of irrigation expansion opportunities. The above three components of economic value were quantified (in 1999 dollars) with respect to the economic output that is generated from expanding the irrigation area. Tables 10, 11, 12 and 13 summarize the value of the three economic generator components for southern Alberta’s irrigated region, up-dated to reflect those values in 2003 dollars. Within those same tables, a comparison is made to the value that would be accrued if that same irrigated land base were farmed under dryland conditions. Table 10. Increase in primary production of crops and livestock resulting from irrigation.
Primary Benefit Economic Indicator Irrigation Dryland
Incremental Irrigation Benefits
Crops 329 65 264 Livestock 620 86 534 Gross Sales
($ Million) Sub-Total 949 151 798
Crops 180 34 146 Livestock 105 18 87 Value-Added
($ Million) Sub-Total 285 52 233
Crops 3,142 881 2,261 Livestock 1,821 464 1,357
Employment (Full-Time
Equivalents) Sub-Total 4,963 1,345 3,618 Table 11. Increase in backward linkage values resulting from irrigation.
Backward Linkages Economic Indicator Irrigation Dryland
Incremental Irrigation Benefits
Gross Sales ($ Million) 949 151 798 Value-Added ($ Million) 237 38 199
Employment (Full-Time Equivalents) 2,150 343 1,807
15

Alberta Agriculture, Food and Rural Development International Joint Commission Submission
Table 12. Increase in forward linkage values resulting from irrigation.
Forward Linkages Economic Indicator Irrigation Dryland
Incremental Irrigation Benefits
Gross Sales ($ Million) 2,501 159 2,342 Value-Added ($ Million) 634 42 592
Employment (Full-Time Equivalents) 5,971 308 5,663 Table 13. Increase in total agricultural benefits resulting from irrigation.
All Components Economic Indicator Irrigation Dryland
Incremental Irrigation Benefits
Gross Sales ($ Million) 4,399 461 3,938 Value-Added ($ Million) 1,150 132 1,018
Employment (Full-Time Equivalents) 13,084 1,996 11,088 Impact of Water Supply Shortfall Irrigation district water allocations (licensed) were originally developed and up-graded in 1991 with the expectation that the licensed allocations would be sufficient to meet the optimum farm gate demand in 90 percent of the years. In other words, there would be an expectation of a supply shortfall approximately one year in ten. Despite the water use efficiency improvements achieved, and the significant water supply /storage infrastructure that supports the SMP districts, recent leading-edge irrigation demand and supply modelling indicates there is still be a higher level of risk of water supply shortfalls than the theoretical licensing has considered. Figure 5 illustrates a sample output bar chart for the SMP districts, delineating the weighted modeled variable demand as well the modelled supply deficits through the 1928 to 1995 time-frame. This analysis utilizes the historical climate database for that period as well as the naturalized stream flows of the Southern Tributary Rivers (including only that portion that is eligible for Canadian apportionment through the 1921 agreement), based on an irrigated area that is only 10 percent larger than present (approximately 50,000 acres). The accumulated license allocations are not the limiting factor to expansion; it is the natural hydrology and existing infrastructure of the Southern Tributary watersheds than cannot always meet the licensed allocations. If Montana were to hold back an additional 50,000 acre-feet of water, this would translate into approximately a 25 mm or 1 inch deficit across the SMP irrigation area. For every 50,000 acre-feet of water supply withdrawn or not available to the SMP area, approximately 40,000 acres of irrigation development could not be achieved, based on projected mean water use requirements. This would have major economic implications not only for irrigators, but also for those industries, municipalities, recreation users and wildlife habitat systems that depend on the water supplies from the St. Mary River. Table 14 summarizes the projected annual economic impact if water was not available to sustain the high value diversified irrigation on an additional intensified 40,000 acres within the SMP districts area.
16

Alberta Agriculture, Food and Rural Development International Joint Commission Submission
700
600
500
400
300
200
100
0
1928
1933
1938
1943
1948
1953
1958
1963
1968
1973
1978
1983
1988
1993
Irrig
atio
n D
eman
d an
d D
efic
it (m
m)
Weighted-average demand for all yearsLicence allocation per unit area
Deficit Demand
Figure 5. Projected water supply shortfalls in the SMP districts based on a 10 percent area growth. Table 14. Simulated incremental impacts of potentially lost irrigation output in the SMP. *
Economic Indicator Economic Generator Gross Sales Value-Added Employment (FTEs) Direct (on-farm) $28 million $8 million 118
Backward (suppliers) $28 million $7 million 62 Forward (agri-processing) $86 million $22 million 200
TOTAL (direct and indirect) $142 million $37 million 380
* Based on a 40,000-acre cutback.
17