irrigation and water management
TRANSCRIPT
GOVERNMENT OF KERALA
STATE PLANNING BOARD
THIRTEENTH FIVE-YEAR PLAN
2017-2022
WORKING GROUP ON
IRRIGATION AND WATER
MANAGEMENT
REPORT
AGRICULTURE DIVISION
THIRUVANANTHAPURAM

MARCH 2017 PREFACE
In Kerala, the process of a Five-Year Plan is an exercise in people’s participation. At the end of
September 2016, the Kerala State Planning Board began an effort to conduct the widest possible
consultations before formulating the Plan. The Planning Board formed 43 Working Groups, with a total
of more than 700 members – scholars, administrators, social and political activists and other experts.
Although the Reports do not represent the official position of the Government of Kerala, their content
will help in the formulation of the Thirteenth Five-Year Plan document.
This document is the report of the Working Group on Irrigation and Water Management. The
Chairpersons of the Working Group were Smt. Tinku Biswal IAS and Dr Srikumar Chattopadhyay. The
Member of the Planning Board who coordinated the activities of the Working Group was Professor R.
Ramakumar. The concerned Chief of Division was Dr P. Rajasekharan.
Member Secretary

ACKNOWLEDGEMENT
This report has been prepared at the behest of State Planning Board, Government of Kerala. We thank
Dr V Ramachandran, Vice Chairman, State Planning Board for initiating the discussion and providing a
framework for working out this report. We also thank all the members and invitees participated in the sub
group meetings and spend their valuable times to provide inputs. The following persons have helped
compile this report:
1. Sri K.B.Basant Executive Engineer (NC), Office of the Chief Engineer, Project-1, Kozhikode
2. Dr. E J Joseph, Senior Principal Scientist & Executive Director i/c, CWRDM
3. Sri. V. Kunhambu, Regional Director, CGWB, Govt.of India
4. Dr. K. Madhava Chandran, Senior Principal Scientist, Water Management
(Agriculture)Division, CWRDM
5. Shri. Thomas Mathew, Joint Director, IDRB
6. Shri. Maju Balakrishnan, Executive Engineer, I&A
7. Ms. Preetha Sugathan, Water Management Specialist, Command Area Development
Authority, Thrissur
8. Sri C T Rajesh,Superintending Engineer General, Ground Water Department
9. Prof (Dr) K K Sathian, Department of land and Water Resource Conservation Engineering,
Kerala Agricultural University
10. Dr. E Shaji, Department of Geology, University of Kerala
11. Dr. U. Surendran, Scientist, Water Management (Agriculture) Division, CWRDM
We thank all of them. We also take this opportunity to acknowledge all necessary support extended by
DrP.Rajasekharan, Chief(Agriculture), State Planning Board and Convenor of this group and Smt.
Dhanya.S. Nair, Assistant Director, State Planning Board and Co –Convenor of this group to bring out
this report.
Ms. Tinku Biswal Srikumar Chattopadhyay
Co-Chairperson Co-Chairperson

CONTENTS
Chapter 1 Introduction ............................................................................................................................................... 1
Chapter 2 Bio- Physical Set Up ................................................................................................................................. 3
Relief and Geology ................................................................................................................................................. 3
Rainfall ...................................................................................................................................................................... 4
Decrease in Rainfall ................................................................................................................................................ 4
Temperature ............................................................................................................................................................. 5
Landform and Soil .................................................................................................................................................. 5
Soil ............................................................................................................................................................................. 6
Spatial Distribution of Soils: Soil Scapes and Mapping Units ......................................................................... 7
Problem Soil Zones ................................................................................................................................................ 8
Human Intervention in Soilscape ......................................................................................................................... 8
Land Use .................................................................................................................................................................. 8
Forest and Wild Life ............................................................................................................................................... 9
Wild Life and Sanctuaries .................................................................................................................................... 10
Bio-Climate ............................................................................................................................................................ 10
Chapter 3 Population ................................................................................................................................................ 12
Population Distribution and Altitudinal Zones ............................................................................................... 13
Chapter 4 Water Resources Availability/Supply ................................................................................................... 15
Surface Water Resources ..................................................................................................................................... 15
Ground Water Resources .................................................................................................................................... 15
Storage of Water ................................................................................................................................................... 16
Chapter 5 Water Demand......................................................................................................................................... 19
Current Utilisation ................................................................................................................................................ 19
Future Demand. .................................................................................................................................................... 20
Water Demand Management .............................................................................................................................. 20
Consumptive Use of water .................................................................................................................................. 21
Chapter 6 Evaluation of Water Resource Projects ............................................................................................... 24
Activities of Irrigation Department ................................................................................................................... 24
Major and Medium Projects ................................................................................................................................ 24
Irrigation Investment during XI and XII Plan Periods .................................................................................. 24
Long Pending Irrigation Projects (Major and Medium) ................................................................................. 26
Kuttanad Package ................................................................................................................................................. 32
Post Facto Evaluation Study of Completed Irrigation Projects in Kerala ................................................... 34
Chapter 7 Challenges of Water Resource Management In Kerala .................................................................... 36
Challenges of Water Conservation in the State of Kerala .............................................................................. 36
Challenges of Water Use Management.............................................................................................................. 38
Challenges of Water Pollution ............................................................................................................................ 39
Action Plans to Solve Water Conservation, Water Use and Water Quality Related Issues ...................... 39
Chapter 8 Challenges For Water Governance ...................................................................................................... 42
National Water Policy .......................................................................................................................................... 42
State Water Policy ................................................................................................................................................. 43
Surface Water Governance .................................................................................................................................. 44
Role of Water User’s Association in Water Governance ............................................................................... 44
Ground Water Governance ................................................................................................................................ 45
River Basin Governance ...................................................................................................................................... 46
Integrated Watershed Management Programme ............................................................................................. 48

Kerala Rural Water Supply and Environmental Sanitation Agency (Jalanidhi) .......................................... 48
New Governance Structure ................................................................................................................................. 49
Chapter 9 Strategy and Action Plan ........................................................................................................................ 51
Supply Sector ......................................................................................................................................................... 51
Demand Sector ...................................................................................................................................................... 53
Water Governance ................................................................................................................................................ 56
Capacity Building .................................................................................................................................................. 56
Disaster Management ........................................................................................................................................... 57
Conclusions ............................................................................................................................................................ 57
References ................................................................................................................................................................... 58
Annexure 1 .................................................................................................................................................................. 60
Annexure 2 .................................................................................................................................................................. 63
Annexure 3 .................................................................................................................................................................. 64
Annexure 4 .................................................................................................................................................................. 72

1
CHAPTER 1
INTRODUCTION
1. The State of Kerala is well endowed with water resources available through green and blue water. It
experiences a humid tropical climate, characterized by heavy rainfall, high relative humidity,
abundant sunshine and high ambient temperature. Rivers, streams, ponds, lakes, springs and
wetlands are water structures distributed across the state and provide easy access to the people.
Perhaps it is the only State in India where hydro-electric power meets 80% of the electrical energy
requirements and surface water provides bulk of its fresh water demand. However, like in all other
places, Kerala is facing problems in water sector. Even though the mean annual rainfall in the State
is 3000mm, its spatio-temporal distribution is highly uneven, resulting in a water scarcity for about 5
to 6 months and the severity of this scarcity is gradually increasing due to climate change in one hand
and growth demand on the other hand. In spite of the fact that Kerala has a copious supply of
rainwater, many parts of the state are currently facing water scarcity problems both in terms of
quantity and quality of water. There is indiscriminate use and deteriorating water quality, as a result,
availability of good quality water is gradually reducing. Rainfall is the only source of fresh water in
Kerala. While there is virtually little or no control on incoming rain, once rainwater reaches surface
of the earth and start flowing either as surface runoff or infiltrates to recharge ground water the
entire process is subject to management. Water resource management is therefore an interventionist
approach and can be best practice through ‘Learning the Nature’s Law and Apply Them Correctly’.
2. The World Water Development Report (WWDR), 2016 explains how the various global crises –
climate change, energy, food security, economic recession and financial turbulence – are related to
each other and impacts on water. The Reports underscores that water plays vital roles in all sectors
of the economy and ecology, and it is essential in achieving sustainable development and reaching
the Sustainable Development Goals (SDGs).Water is needed to create and maintain jobs across all
sectors of the economy. Half of the global workforce is employed in eight water and natural
resource-dependent industries: agriculture, forestry, fisheries, energy, resource-intensive
manufacturing, recycling, building and transport (UNESCO, 2015 & 2016).Considering importance
of water the International Human Dimensions Programme on Global Environmental Change
(IHDP) cosponsored by ISSC, ICSU and UNU initiated GWS project as one of its core research
areas. It is observed that humans are changing the global water system in a globally significant way
without adequate knowledge of the system and thus its response to change (GWSP, 2005). The
Global Water System (GWS) Project raised three thematic questions in dealing with water
management. These are: (i) the magnitude of anthropogenic and environmental changes in global
water system and the key mechanism by which they were induced, (ii) the main linkages and feed
backs within the earth system arising out of changing GWS and (iii) resilience and adaptability of
GWS to the change and strategy for sustainable development (Vorosmarty et al., 2004). Since
inception GWS project stressed on studying the complex global water system with its interactions on
environmental and social components as a continuum and coupled system (Bhaduri et al, 2014).
Studies of linkages, including the nonlinearities and feedbacks that resonate through the
environmental and social dimensions of the water system represent a new challenge both at the level
of science and policy integration (Vorosmatry, et al.,2013) and for close coupling of intelligent
techniques and water resources models to understand anthropogenic impact on water resources
(Barbaros et al., 2007).
3. Water is an important component for the development of the State. Proper management of this vital
resource is necessary to sustain and further Kerala mode of development. The State Planning Board,
Government of Kerala constituted the Working Group on Irrigation and Water Resources

2
Management for preparation of the 13th five year plan for the State with a clear set of terms and
references (Annexure-1). The main aim is to outline a set of activities that can be taken up during
13th Plan period.

3
CHAPTER 2
BIO-PHYSICAL SET UP
4. Kerala located in the south-western part of the Indian Peninsula covers an area of 38,860 km2 or
1.2% of total geographical of India and accommodates little over 33 million people or 3% of India’s
population according to the 2011 Census data. Sandwiched between the Lakshadweep Sea in the
west and the Western Ghats in the east, the State appears like a narrow strip of land with a
maximum width of around 100 km in the Ernakulam-Idukki stretch. This geographical location has
provided the State with unique geo-environmental set up that has profound impact on
environmental resource base of the state.
Relief and Geology
5. Relief distribution in terms of area-altitude ratio is asymmetric with as much as 62% of the total
geographical area lying below 100 m (Chattopadhyay and Mahamaya, 1995).The coastal plain is wide
in the central part around the Vembanadlake coinciding with sedimentary basin and it tapers both
towards north and south. From the coastal plain, elevation increases in stepped manner justifying the
nomenclature of Ghats. Average rise of land is 27 m for every Kilometre from the coastline towards
east and relief amplitude increases with the rise in altitude. Seventy per cent of landmass in Kerala
fall in the slope category of >15%. The Western Ghats crest line reaches the maximum altitude of
2695 m at the Anamudi- the highest point in south India. The monolithic Western Ghats is broken
by 30 km wide Palghat Gap at the altitudinal level of 100 to 200 m. This Gap connects Kerala plain
with the Tamil Nadu plain and has pronounced influence on climate, culture and economy of the
State. The Western Ghats and the Eastern Ghats merge at the Nilgiri hills in Tamil Nadu, an
extension of which is the Kunda hill ranges in the State. Twenty three per cent of the land lying
above 600 m altitude is the provenance of all rivers in the State and is the primary source zone of
sediment and water. Abrupt rise of the Western Ghats from 100 m upward with precipitous slope is
a characteristic feature of Kerala’s topography that controls hydrology, climate, land use,
infrastructural development and settlement distribution.
6. Geologically Kerala is a part of the south Indian shield. The rock types are dominated by crystalline
formations. Four major formations found in Kerala are: (i) Crystalline rocks of Precambrian, (ii)
Sedimentary rocks of Tertiary (iii) Laterite capping the crystalline and the sedimentary formations
and (iv) Recent and sub-recent sediments forming the low lying areas, coastal area and river valleys
(Geological Survey of India, 2005). Bulk of the rocks of Kerala, especially the granulites and
associated gneisses belong to the Precambrian. The on land sedimentary formations are confined to
Neogene period only. They include pebble beds, sandstone, grit, clay with shells, marl and lime
stones. All the rock types (crystalline and sedimentary rocks) are lateritised to variable depths.
Duricrust formations are marked in places. Recent and sub-recent sediments cover the low lying
areas, coastal plain and river valleys. Rock types, their composition and degree of weathering
influence landform development. Rugged terrains are mostly on hard rocks and radial drainages
usually characterize areas affected by granite intrusions. Structural control is well evident in drainage
development. Fractured hard rocks are conducive for ground water recharge. Laterites are also good
aquifers.

4
Rainfall
7. Rainfall is the main source of fresh water in the State. The average Rainfall in Kerala is
3075mm/year. However, there are wide variations in year to year rainfall. Kerala received the highest
average annual rainfall of 415 cm in the year 1962 and the lowest rainfall (151cm) occurred in 1982
(KSLUB, 1995). Precipitation shows increasing trend from the coast to inland and the maximum is
recorded along the foothills around Neriyamangalam (451 cm) in the south and Kuttiyadi (417 cm)
in the north. It decreases further east and the lowest rainfall (<100cm) is recorded in the rain shadow
region along the leeward eastern slopes of the Anamudi around Chinnar and North Marayur.
Although the zone of highest rainfall is located in Idukki-Ernakulam border, in general the Malabar
area receives higher rainfall than the Travancore region. The Palghat Gap, lying almost in the central
part of the Western Ghats of Kerala, disrupts the rainfall trend due to its sudden reduction in relief,
resulting in considerably low rainfall. Kerala receives rainfall almost in every month. This year-round
rainfall and high precipitation in the foothills has contributed to the perennial water supply in the
rivers. Orographic influence on rainfall is pronounced.
8. The rain fall occurs mainly during the South-West Monsoon from June to September and North-
East Monsoon from October to December. Short duration storms are fairly common during the
relatively dry-months of January to May. About 70% of this rainfall is received during the southwest
monsoon, 15% during the northeast monsoon, and the remaining 15% during winter and summer
(January-May).Total rainfall received during S-W monsoon increases steadily from Trivandrum in
south to Kasaragod in north along the coast and the contribution of south west monsoon rain to
total annual rainfall also increases in the same direction (Sampath and Vinayak, 1989). The
contribution of the North-East monsoon is high in the southern part and it is considerably less in
the northern part. The northern stations are characterized by single peak during June-July, whereas
the southern stations (south of Palghat) record two peaks: June-July and October. The winter
months are characterized by minimum clouding and rainfall. It may be noted here that Kerala does
not experience winter season like other parts of the country.
9. How dependable is Kerala rainfall? The Maximum Assured Rainfall (MAR) during the South-West
monsoon period was expected to be realized during the last week of July while during the North-
East monsoon the MAR occurred during the third week of October. General variability of rainfall
for the state is between 20 and 40 percent above or below the expected values. Trends of variability
change according to season. The northern part, especially the Kasargod-Kannur area records
variability around 50% from year to year. It is generally observed that if rainfall is low in the South-
West monsoon, it is partly compensated for during the North-East period. Monsoon failure for both
the periods is very rare. The state therefore enjoys a certain amount of assured rainfall each year.
There was a 50 percent chance for observing a dry week during the months of May and November.
Decrease in Rainfall
10. Decrease in rainfall is one of the issues debated under climate change programme. Kerala is one of
the few States in India where rainfall data are available for more than 100 years. Soman et al (1988)
used the data set from 1901 to 1980 for 75 stations. Comparing the amount of rainfall received
during 1901-1940 with that of 1941-1980m the changing trend has been worked out. The maximum
decrease of rainfall of >20% is noticed in the foothill region stretching over the boundary between
Idukki and Ernakulam districts. The 15% to 20% reduction zone spreads over southern foothill
zone. Incidentally it may be noted that the major reservoirs are located in this zone of high rainfall
reduction. Reduced rainfall can impact the hydro power and drinking water situation. The entire

5
Western Ghat section recorded reduction in rainfall. However the Malabar part experiences relatively
less change. Decrease in annual rainfall is also the minimum all along the coastal tract.
Disaggregating the rainfall data for the seasons it is found that rainfall reduction is high during south
west monsoon and it is not so appreciable during the north east monsoon period.
Temperature
11. The period from March to May is the hottest when temperature reaches a maximum (>320C). From
June, it gradually comes down due to heavy monsoon rain. Again, an increasing trend is noticed in
October and November, followed by lower temperatures (<270C) in the months of December and
January (CESS, 1984).The average minimum temperature in the winter months does not fall below
20oC in most part of the State. The highly elevated Western Ghat areas covering parts of Idukki and
Wayanad districts record low temperatures during winter months.
12. The seasonal and diurnal variations of temperature are not uniform throughout the state. The
stations located near the coast are influenced by land and sea breezes and here the seasonal and
diurnal variations of temperature are almost of the same range (50C to 70C). At Palghat, the mean
seasonal variation is less than the diurnal variation, but in the high ranges, which are typically sub-
tropical, the diurnal variation is very high (>150C in some months). This is a typical example of a
par-humid area where the tropical climate has been remarkably modified by the higher altitude.
13. So far as the mean annual temperature is concerned the zone with the highest temperature (>27.5o
C) falls in the midland region. High summer temperatures are recorded in Palghat and Punalur due
to their location along the Palghat gap and Shencotta pass respectively. Along the coast, the
temperature is moderate whereas to the east, it is low. This type of temperature variation due to the
presence of sea in the west and high relief in the east has endowed the state with a unique agro
climatic condition favourable for cultivation of a wide variety of crops. The highland region (>500
m) with colder climate favours plantation crops like cardamom, tea and coffee, but the lowland and
midlands with warm humid climate sustain a variety of tropical crops including rubber.
Landform and Soil
14. Landform zones running parallel to the coastline in NW-SE direction follow the longitudinal trend
of topographic grain of the State. Three well identifiable landform zones with distinct geomorphic
processes are: the Western Ghats, the Coastal Plain and the Undulating Lateritic Terrain (ULT)
connecting these two units. There are two high level surfaces above the Western Ghats scarps
marked in six patches and three low level surfaces marked between the coast and 300 m altitude
(Chattopadhyay, 2004). The Western Ghats occupying the eastern part of the State form southern
segment of the Sahyadri or the Great Indian Escarpment. It represents the edge of an up-raised and
disrupted continental block with date of formation during the early Miocene (Radhakrishna, 2001).
The Palghat gap at an altitudinal range of 100 to 300 m drained by the Bharathapuzha is a major
break within the Western Ghats ranges.
15. Two prominent tectonic blocks of Wayanad and Anamalai are located in the northern and southern
segments of Palghat gap respectively. The north-easterly tilted Wayanad plateau drained by Kabini
River is well developed at an altitudinal range of 700 to 900 m and characterized by subdued relief
and wide valleys. The high altitudinal zone extends further south to Kunda hills, Silent valley and
Attapadi valley adjoining Nilgiris, where the Eastern Ghats merges with the Western Ghats to the
northeast of the Palghat gap. The part of the Western Ghats extending from south of the Palghat
6
gap to Trivandrum-Nagercoil is considered as Southern Ghat or southern Sahyadri. Width of the
Western Ghats narrows down in the Khondalite belt to the south of Achankovil-Kallada shear zone.
The Agasthamalai (1809m) is the highest point in this part and the crest line slopes towards north.
Western Ghats, as the catchment area of all the rivers of Kerala, plays a very important ecologic,
economic and cultural role.
16. Undulated Laterite Terrain (ULT) connecting the Western Ghats and the Coastal Plain is primarily a
subdued terrain evolved through pedimentation, lateritisation and parallel slope retreat, valley
formation and expansion of aggradational plain. Laterite has developed as a cap on all types of rocks
including recent sediments. Laterite usually forms during the final stage of land surface reduction
and provides a cap rock protecting the old surface. Landform in Kerala is linked to laterite profile
development. Hard crust formations facilitate parallel slope retreat or pediplanation in tropical areas;
however, in the absence of a crust, landform usually develops due to peneplanation. Lateritic mesas
at different altitudinal levels below 300 m are conspicuous landform features in Kerala. Narrow
alluvial valleys indented into laterite landscapes give rise to undulated landform. The ridges and
slopes are lateritic and the lowlands are alluvial.
17. The steep sloping lands, predominance of lateritisation, narrow width and structural control on
drainage pattern and topography all together have imposed certain restrictions in development of
fluvial landscape. Valleys and floodplains in most cases are narrow with possible exception of the
Bharathapuzha, the Periyar River and the Pamba. The Kuttanad area lies 1 to 2 metre below mean
sea level and continues to be a wet land. Alluvial fans have developed to the east of the Vembanad
Lake.
18. Characteristics of sea waves, tidal range and direction of littoral current are the main factors
influencing the coastal processes. In addition to these, the rivers directly debouching into the sea
have pronounced influence on coastal geomorphology, sediment distribution and beach character.
Formation of offshore bar and subsequent development of lagoon due to sea level change is a
unique feature of Kerala coast. The coastal zone in Kerala is not uniform; it exhibits distinct spatial
differences in material composition, morphology and surface features from north to south. The
central part of the coast from Ponnani mouth to north of Asthamudi composed of recent sediments
is considered as a permeable coast. Existence of an internal basin covering this area since Tertiary has
been reported (Chattopadhyay, 2002). The northern and southern parts are characterized by laterites,
sedimentary deposits and crystalline hard rocks. With an area of 205 km2, the Vembanad is the
largest lagoon in the west coast fed by seven major rivers. Bordering the Vembanad Lake there are
three sets of beach ridges signifying transgression and regression. The southern part of the coast is
characterized by Varkala cliff on sedimentary rocks, Kovalam headland on crystalline and Teri sand
deposits further south. Pocket beaches are well developed. Palaeo sand ridges are found in patches in
different parts of the coastal plain. Around 250 km of Kerala coast are affected by severe erosion.
Soil
19. Soil is the top most part of the land surface, which is used for all activities and bulk of human food
supply depends on the qualities of the top 15 to 30cms of soil. Lying over the bed rock at different
depths this complex mixture of animal, vegetal, and mineral matter is one of the four prime
requisites of life. Soil is primarily influenced by parent material (underlying rock), climate, relief,
slope, drainage, vegetation cover, animal activities (from earth worms and insects to people and their
domestic animals), and perhaps time. Time to develop balance among all these parameters is critical
to soils.
7
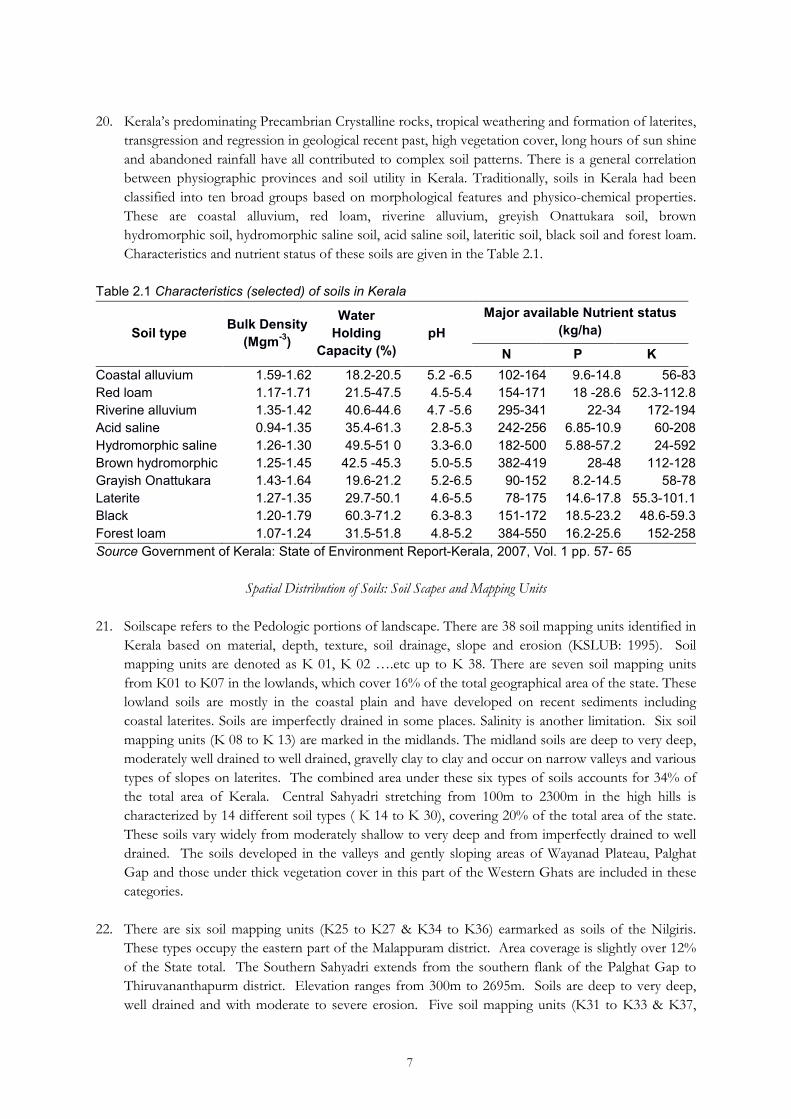
20. Kerala’s predominating Precambrian Crystalline rocks, tropical weathering and formation of laterites,
transgression and regression in geological recent past, high vegetation cover, long hours of sun shine
and abandoned rainfall have all contributed to complex soil patterns. There is a general correlation
between physiographic provinces and soil utility in Kerala. Traditionally, soils in Kerala had been
classified into ten broad groups based on morphological features and physico-chemical properties.
These are coastal alluvium, red loam, riverine alluvium, greyish Onattukara soil, brown
hydromorphic soil, hydromorphic saline soil, acid saline soil, lateritic soil, black soil and forest loam.
Characteristics and nutrient status of these soils are given in the Table 2.1.
Table 2.1 Characteristics (selected) of soils in Kerala
Soil type Bulk Density
(Mgm-3
)
Water
Holding
Capacity (%)
pH
Major available Nutrient status
(kg/ha)
N P K
Coastal alluvium 1.59-1.62 18.2-20.5 5.2 -6.5 102-164 9.6-14.8 56-83
Red loam 1.17-1.71 21.5-47.5 4.5-5.4 154-171 18 -28.6 52.3-112.8
Riverine alluvium 1.35-1.42 40.6-44.6 4.7 -5.6 295-341 22-34 172-194
Acid saline 0.94-1.35 35.4-61.3 2.8-5.3 242-256 6.85-10.9 60-208
Hydromorphic saline 1.26-1.30 49.5-51 0 3.3-6.0 182-500 5.88-57.2 24-592
Brown hydromorphic 1.25-1.45 42.5 -45.3 5.0-5.5 382-419 28-48 112-128
Grayish Onattukara 1.43-1.64 19.6-21.2 5.2-6.5 90-152 8.2-14.5 58-78
Laterite 1.27-1.35 29.7-50.1 4.6-5.5 78-175 14.6-17.8 55.3-101.1
Black 1.20-1.79 60.3-71.2 6.3-8.3 151-172 18.5-23.2 48.6-59.3
Forest loam 1.07-1.24 31.5-51.8 4.8-5.2 384-550 16.2-25.6 152-258
Source Government of Kerala: State of Environment Report-Kerala, 2007, Vol. 1 pp. 57- 65
Spatial Distribution of Soils: Soil Scapes and Mapping Units
21. Soilscape refers to the Pedologic portions of landscape. There are 38 soil mapping units identified in
Kerala based on material, depth, texture, soil drainage, slope and erosion (KSLUB: 1995). Soil
mapping units are denoted as K 01, K 02 ….etc up to K 38. There are seven soil mapping units
from K01 to K07 in the lowlands, which cover 16% of the total geographical area of the state. These
lowland soils are mostly in the coastal plain and have developed on recent sediments including
coastal laterites. Soils are imperfectly drained in some places. Salinity is another limitation. Six soil
mapping units (K 08 to K 13) are marked in the midlands. The midland soils are deep to very deep,
moderately well drained to well drained, gravelly clay to clay and occur on narrow valleys and various
types of slopes on laterites. The combined area under these six types of soils accounts for 34% of
the total area of Kerala. Central Sahyadri stretching from 100m to 2300m in the high hills is
characterized by 14 different soil types ( K 14 to K 30), covering 20% of the total area of the state.
These soils vary widely from moderately shallow to very deep and from imperfectly drained to well
drained. The soils developed in the valleys and gently sloping areas of Wayanad Plateau, Palghat
Gap and those under thick vegetation cover in this part of the Western Ghats are included in these
categories.
22. There are six soil mapping units (K25 to K27 & K34 to K36) earmarked as soils of the Nilgiris.
These types occupy the eastern part of the Malappuram district. Area coverage is slightly over 12%
of the State total. The Southern Sahyadri extends from the southern flank of the Palghat Gap to
Thiruvananthapurm district. Elevation ranges from 300m to 2695m. Soils are deep to very deep,
well drained and with moderate to severe erosion. Five soil mapping units (K31 to K33 & K37,

8
K38) have been recognized. Total coverage of these types is around 18% of the total area of the
State.
23. Erosion and runoff, stoniness, and wetness/drainage are the major limitations of Kerala soils for
agriculture. It has been assessed that only about 37% of Kerala’s area is suitable for irrigation with
some limitations. The three major factors influencing irrigation potential are soil type, soil drainage
and topography. Soil drainage primarily depends upon its textural composition. Irrigation potential
of an ill drained soil (soils with high proportion of clay) and excessively drained soil (soils with high
proportion of coarse sand) are generally low.
24. Soils are generally deep in Kerala. As much as 64% of the area has soil depth more than 150cm.
Loamy texture covers 59% of the total area. Only 4% of the area falls under the severely eroded
category and 69% of the area falls under the moderately eroded category. Capacity of soils to hold
water in reserve expressed as AWC (available water capacity) is an important soil characteristics for
agricultural purposes and it is measured in mm of water in 100 cm of soil or in the entire soil column
if the soil is shallower. 35% of the soils in the state have high AWC value (150-200mm) (KSLUB:
1995:115). Kerala’s soils are productive and have a capacity to generate high biomass.
Problem Soil Zones
25. Soils of Onattukara, Kuttanad, Pokkali and Kole lands are identified as problem soil. Onattukara,
Kuttanad and Pokkali extend from north of Asthamudi lake in Kollam district to lowlands around
Parur in Ernakulam district and Kole land spreads over low and water logged lands in Trissur and
Malapuram districts. Total area falling under the problem zone is around 4783 km2 distributed in 16
blocks of six districts (KSLUB: 1995 pp 131-132). Besides there are some patches of problem soils
marked in Kannur district. Soil textures are mainly sand, sandy loam and clay. Ten soil mapping units
covering the problem zones are K01, K02, K03, K04, K05, K06, K07, K08, K09, and K11.
Human Intervention in Soilscape
26. Like any other densely populated area soils in Kerala is witnessing change in composition and have
been impacted by high intensity human activity. Usual activities like cultivation, draining of
wetlands, and fertilization of soils in the lowlands and in the slopes modify the natural soil qualities.
Filling up of lowlands by laterite soils, brought down from the hillocks, change the soil character
both in the place of excavation and also in the area of dumping. This alteration of soil is most
intense around urban centres.
Land Use
27. Land in Kerala is intensely utilised. Hardly there is any vacant or unused land in the State. Land use
pattern of Kerala is quite different from that of the rest of India. Net sown area constitutes 54.1% of
the total geographical area of the State against an all India average of 42.86%. Multi-tier cropping
system and dominance of tree crops and plantations are unique features in Kerala. Relation between
land use and landform is quite explicit here. Nature of land use varies with altitude. The coastal plain
and the adjoining low lands are dominated by coconut and rice. It is densely populated. All major
urban centres are located in the coastal plain. The main transport lines, railways and roadways have
developed in the coastal plain. The undulated lateritic terrain hosts crops like coconut, varieties of
fruit tree crops, rubber, cashew, tapioca, pepper etc. Coconut dominates in the land up to 100 m
altitude. Rubber plantation is an important component of land use up to 500 m altitude. It has

9
replaced tapioca, cashew, coconut, tree crops, and degraded forest lands. Settlements are amidst
mixed tree crops. Further up there are tea and coffee plantations in the Western Ghats. Cardamom
is raised above 1000 m altitude. Forests are found over the rugged scarp slopes and high hills.
28. Kerala has experienced considerable land use change. Forest cover came down from 44% in 1905 to
17% in 1973 (Chattopadhyay, 1985). Other changes are from multi- tier to mono cropping, diversion
of lowlands, and land shaping and occupancy of floodplain. Analysis of crop statistics indicated that,
between 1961-62 and 2006-07, area under rice cultivation reduced by 73%. Land use change has
serious implications on water quality (Chattopadhyay et. al.; 2005) and over all hydrological
conditions.
Forest and Wild Life
29. According to the Forest Department, Government of Kerala (2004), the total forest area in 2003 was
11,266 sq. km. of which 64% were in the dense forest category, 19% were under plantation and the
remaining 17% were given to various agencies, such as the Kerala State Electricity Board (KSEB)
and Public Works Department (PWD) for the river valley projects, the Forest Development
Corporation, the Kerala Livestock Development Corporation, and other agencies. Forest
department reported actual forest area to be 9400 km2 including forest plantations and area under
dense forest is 7357 km2. There are disputes about the figures for the dense forest cover. Through
field observation and satellite image analysis it has been found that there is considerable thinning of
vegetation in many areas. Vegetation cover with intact forest ecosystem will be around 10% of total
area of the state (Chattopadhyay, 1985). Per capita availability of forest in the State will be 0.035ha.
Natural virgin forests in Kerala today are confined to rugged slopes and high altitude areas. The state
witnessed sizable deforestation in the present century.
30. Forest type. Kerala is well known for tropical rainforest. The climatic variability and physiographic
diversity are well manifested in the vegetation types. Tropical moist deciduous forest dominates the
natural vegetation, covering the largest area of 44% of total area under forest. Dry deciduous sub-
tropical montane type of vegetation can be marked in patches having low temperatures and meagre
rainfall. Forest Department classified main vegetation types into the categories of wet evergreen and
semi-evergreen (3299 km2), moist deciduous (4100 km2), dry deciduous (100 km2), sub-tropical
montane and temperate shola forests (70 km2) and grasslands (17 km2).
31. The evergreen and semi-ever green types are characterized by tall trees in the upper storey followed
by dense second storey and undergrowth of numerous ferns and tall herbs. In tropical moist
deciduous forests, the vegetation is less dense, but trees are commercially valuable. Deciduous trees
remain leaf less during the period from December to June. Woody climbers are associated with
deciduous forests. The evergreen, semi-evergreen and moist deciduous forest types are located in
the rainfall zone of 250 cm to 350 cm and above and at a temperature of more than 20oc. They are
mostly located above 300m altitude. In the north-western flank of the Wayanad Plateau in north
Kerala, these forests are found at lower levels. The dry deciduous type is located in the Pambar
valley to the northeast of the Anamalai mountain complex. Santalum album (sandalwood) is the
most important species in this forest. Montane sub-tropical and temperate sholas cover less than
one per cent of the effective forest area and are found along streams in the valleys within high ranges
usually above 1,000 m altitude. Between the water courses dry, savanna areas predominate.
Grasslands are found in isolated patches throughout the state. They mostly occupy the ridges. Some
of the grasslands are due to climatic climax and some others are due to human intervention.

10
Grasslands along the Western Ghats crest developed in stretches of forest clearance where roads
were laid for the purpose of plantation development in the nineteenth century.
32. Mangrove vegetation is confined to some of the big river mouths. Two sites with dense mangrove
vegetation are found in the mudflats around Vallapatnam river mouth in Kannur district and recently
accreted land in Puduvipin to the north of Cochin mouth in Ernakulam district. One of the reasons
contributing to destruction of mangrove vegetation is that majority of mangrove areas are privately
owned. Transformation of mangrove sites into prawn farms are recorded in many parts of the State,
particularly along the coastal stretch of Cochin- Cherthala.
Wild Life and Sanctuaries
33. Kerala provides home to a variety of wild animals: elephants, various types of deer, wild bears,
tigers, panthers, nilgiritaur, nilgirilangur and lion tailed macaques. To protect wildlife, and to
promote forest conservation, 2315 sq. km of area (or 21% of the forest area) had been earmarked as
wildlife sanctuaries or national parks. The six wildlife divisions managing the wildlife protected forest
areas are Thiruvananthapuram (Thiruvananthapuram district), Thekkady (Pathanamthitta and Idukki
districts), Eravikulam (Idukki district), Parambikulam (Palakkad district), Silent Valley (Palakkad
district) and Wayanad (Wayanad district). This distribution throughout the state is significant for
decentralized management, and also to promote habitat-specific development.
34. There are 11 wildlife sanctuaries, five national parks, two bird sanctuaries and one tiger reserve in
Kerala. The Silent Valley National Park is nationally and internationally known. The environmental
movement in Kerala centered on the Silent Valley during the 1970s. This 89 sq. km virgin tropical
rainforest is still pristine. There was a proposal to construct a hydel power project in this area. The
movement mobilized against this proposal. The site is now protected as a national park and falls
under Nilgiri biosphere reserve. The wildlife sanctuaries and national parks attract tourists from
various parts of the country and abroad. Periyar Wildlife Sanctuary (tiger reserve) is a well-known
site globally with a four-star hotel and a steady stream of visitors eager to view the wildlife. Kerala
has two biosphere reserves: (i) Nilgiri (parts- Wayanad, Nilambur and Silent valley) and (ii)
Agasthamalai (parts- Thiruvananthapuram, Kollam and Pathanamthitta). Providing drinking water
for the wild lives particularly during summer months is an emerging challenge. Many of the man –
animal conflicts arose due to non-availability of adequate food and drinking water in the areas
frequented by the wild lives.
Bio-Climate
35. Bio-climatic study has gained in importance since it has been realized that vegetation types reflect
climate. Recorded data on rainfall and temperature, the two most important components of climate
study, are not available for most of the remote areas. It is felt, therefore, that the incorporation of
vegetation data will improve our understanding of climate. In the 1980s the French Institute in
Pondicherry prepared bio-climatic maps of India. Kerala was shown in the tropical monsoon and
tropical savanna zones in this map. A detailed analysis of bio-climate characteristics was attempted,
taking into consideration rainfall, precipitation effectiveness index (an index to assess amount of
monthly effective rainfall), temperature, temperature effectiveness index (an index to assess degree
of effective temperature in every month), evaporation loss and vegetation (CESS, 1984;
Shravankumar et al.: 1988). This analysis established certain spatial relationships between altitude,
rainfall, temperature and vegetation.

11
36. Considering the amounts and patterns of rainfall, temperature and vegetation, it is found that there
are 12 bio-climatic zones in Kerala. Combination of rainfall categories of <2500mm, 2500-3500mm
and >3500mm and annual temperature of <20oC and >20oC provided the outline of six basic zones.
These zones were further classified using (i) rainfall patterns exhibited by single peak rainfall during
south west monsoon, two peaks with the higher peak during south west monsoon, and two peaks
with the higher one during north east monsoon, and (ii) three vegetation zones namely, moist
tropical, tropical attenuated and tropical montane. There are some repetition of these zones to the
north and south of the Palghat gap indicating orographic control on climate and vegetation. Human
modifications of natural systems including vegetation cover, intentional or unintentional are
omnipresent in the State.
12
CHAPTER 3
POPULATION
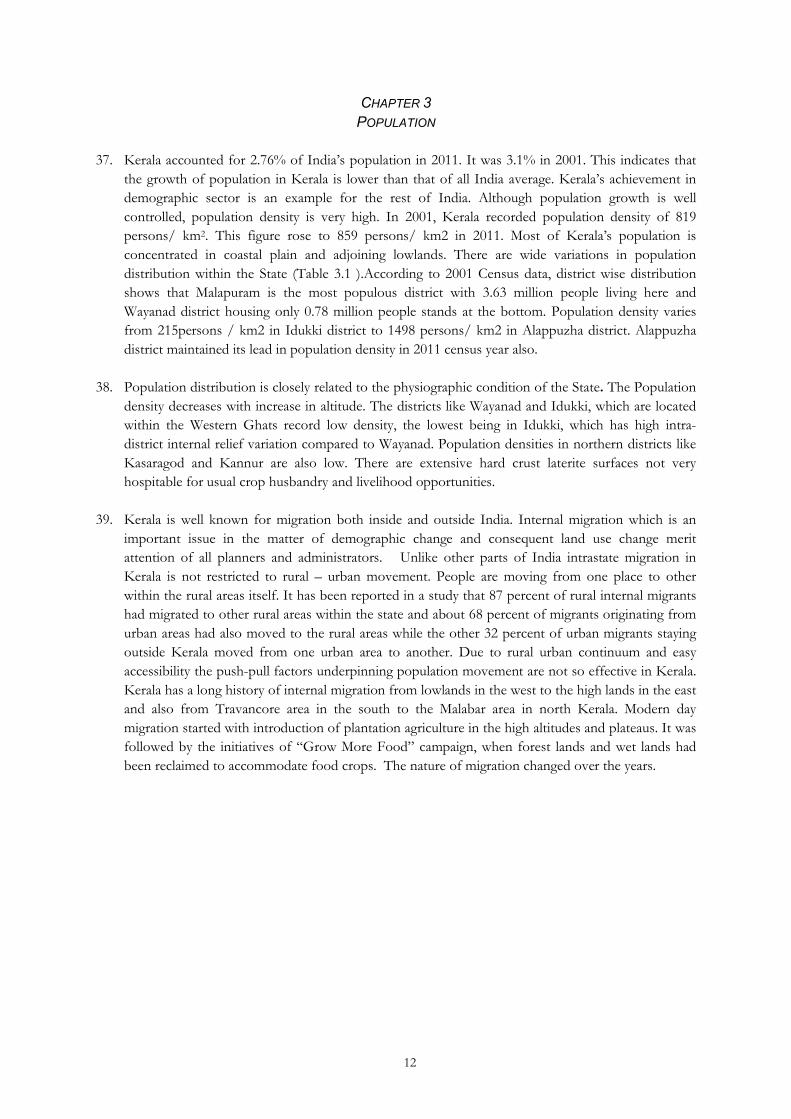
37. Kerala accounted for 2.76% of India’s population in 2011. It was 3.1% in 2001. This indicates that
the growth of population in Kerala is lower than that of all India average. Kerala’s achievement in
demographic sector is an example for the rest of India. Although population growth is well
controlled, population density is very high. In 2001, Kerala recorded population density of 819
persons/ km2. This figure rose to 859 persons/ km2 in 2011. Most of Kerala’s population is
concentrated in coastal plain and adjoining lowlands. There are wide variations in population
distribution within the State (Table 3.1 ).According to 2001 Census data, district wise distribution
shows that Malapuram is the most populous district with 3.63 million people living here and
Wayanad district housing only 0.78 million people stands at the bottom. Population density varies
from 215persons / km2 in Idukki district to 1498 persons/ km2 in Alappuzha district. Alappuzha
district maintained its lead in population density in 2011 census year also.
38. Population distribution is closely related to the physiographic condition of the State. The Population
density decreases with increase in altitude. The districts like Wayanad and Idukki, which are located
within the Western Ghats record low density, the lowest being in Idukki, which has high intra-
district internal relief variation compared to Wayanad. Population densities in northern districts like
Kasaragod and Kannur are also low. There are extensive hard crust laterite surfaces not very
hospitable for usual crop husbandry and livelihood opportunities.
39. Kerala is well known for migration both inside and outside India. Internal migration which is an
important issue in the matter of demographic change and consequent land use change merit
attention of all planners and administrators. Unlike other parts of India intrastate migration in
Kerala is not restricted to rural – urban movement. People are moving from one place to other
within the rural areas itself. It has been reported in a study that 87 percent of rural internal migrants
had migrated to other rural areas within the state and about 68 percent of migrants originating from
urban areas had also moved to the rural areas while the other 32 percent of urban migrants staying
outside Kerala moved from one urban area to another. Due to rural urban continuum and easy
accessibility the push-pull factors underpinning population movement are not so effective in Kerala.
Kerala has a long history of internal migration from lowlands in the west to the high lands in the east
and also from Travancore area in the south to the Malabar area in north Kerala. Modern day
migration started with introduction of plantation agriculture in the high altitudes and plateaus. It was
followed by the initiatives of “Grow More Food” campaign, when forest lands and wet lands had
been reclaimed to accommodate food crops. The nature of migration changed over the years.

13
Table 3.1 District wise Distribution of Population Density and Growth
Districts
Total
population
(in 000)
2011
Density of Population (persons
per Sq. Km)
Decade Growth (in per
cent)
1981 1991 2001 2011 1981-
1991
1991-
2001
2001-
2011
Kasaragod 1307 438 538 604 654 22.8 12.3 8.28
Kannur 2523 651 757 813 852 16.6 7.4
Wayanad 817 260 315 369 383 21.3 17.1 3.79
Kozhikode 3086 958 1118 1228 1318 16.7 9.8 7.33
Malappuram 4113 677 872 1022 1158 28.9 17.1 13.31
Palakkad 2810 456 532 584 627 16.5 9.8 7.36
Thrissur 3121 805 903 981 1026 12.2 8.6 4.59
Ernakulam 3282 1053 1170 1050 1069 11.1 -10.3 1.81
Idukki 1109 193 215 252 254 11.2 1.72 0.79
Kottayam 1975 771 830 884 896 7.71 6.5 1.36
Alappuzha 2128 1319 1415 1489 1501 7.28 5.2 0.81
Pathanamthitta 1197 426 450 467 453 15.6 3.8 -2.99
Kollam 2635 873 967 1037 1056 10.7 7.2 1.83
Thiruvananthapuram 3301 1184 1344 1476 1509 13.5 9.8 2.24
State total &
averages 33406 655 749 819 860 14.3 9.35 4.91
40. According to 2011 census urban content of total population in Kerala rose to 47.72% against an all
India average of 31.16%. Urban content of the World average is 50.6%. The neighbouring State
Tamil Nadu recorded an urban content of 48.5% in 2011 census. In 1951, urban population in
Kerala accounted for 13.48% of total population. It steadily grew over the years, although in slow
pace. The first phase of high growth was recorded between 1981 and 1991 and the next phase of
high growth was between 2001 and 2011. Till 2001, Kerala’s urban content was less than all India
average and only in 2011 it was well above Indian average. Between 2001 and 2011, urban
population in Kerala grew by 84%. This sudden high growth is partly attributable to change in
definition of industrial workers for the census of 2011. It is significant to note that urban area in the
State has increased by 184% in the period from 1961 to 2001 while urban population has increased
by 89% during the same period. Increase in urban population density was only 15% in this period.
This signifies that physical space is getting urbanized. Increased urbanization is not accompanied by
high concentration of population. This spread over is possible due to well developed transport
network and other environmental facilities supporting human habitation in the peripheral areas.
Demand on water resources is directly proportional to population growth and urbanization.
Population Distribution and Altitudinal Zones
41. Population concentration decreases from coast towards east with increase in altitude. As most of the
districts (nine districts) extend from coast to the Western Ghats, there are high density as well as low
density zones in each of them. Alappuzha district, which falls entirely in the lowland zone was the
densest district till 2001. It now records the second highest population density in the State.
Incidentally it may be noted that in development grade Alappuzha district’s position is below state
average. The districts like Wayanad and Idukki, which are located within the Western Ghats record
low density, the lowest being in Idukki, which has high intra-district internal relief variation
compared to Wayanad. Population density in northern districts like Kasaragod and Kannur is also
low. There are extensive hard crust laterite surfaces not very hospitable for usual crop husbandry.

14
42. The coastal plain and adjoining lowland under the altitudinal category of Lowland has the highest
population density. All panchayats and urban centres falling in this zone have population density of
> 1500persons/ km2. Most of Kerala’s population is concentrated in this zone of coastal plain and
adjoining lowlands. The local bodies in the Midland zone have population density between 1000
persons/ km2 to 1500 persons / km2. The highland region is characterized by the panchayats with
population density of <500 persons/km2. It is important to internalize these variations in the matter
of water management.

15
CHAPTER 4
WATER RESOURCES AVAILABILITY/SUPPLY
43. The State of Kerala is blessed with an abundance of rainfall and has 44 monsoon-fed rivers longer
than 15 km. But due to unique topographic and geomorphic settings, scarcity of water is experienced
in many parts of the state during the summer months. For proper planning of the future control and
utilization of the available water resources, the quantity, the quality and the temporal reliability of the
resource shall be assessed. The appraisal of surface water resources generally includes estimation of
(i) annual run-off and its monthly distribution, (ii) aerial distribution of water resources within the
basin, and (iii) suspended sediment load. (iv) Export/Import of water through inter-basin transfer if
any. The rivers and the ground water are directly dependson the rainfall over the state and accurate
measurement of Hydrological and Meteorological parameters are essential for the estimation of the
supply of water.
44. Hydrological and Meteorological data collection management of Surface water is carried out by Field
Studies Circle, Thrissur, under Kerala State Irrigation department. It operates 85 river gauge stations,
158 rain gauge stations, 14 tidal gauge stations, 14 climatic stations, and 10 Nos. Level I Water
Quality labs. The Central Water Commission also operates 21 stage/discharge stations in Kerala with
sediment load measured at 16 sites, Water quality monitoring at 19 sites. The India Meteorological
Department, Revenue Department, Agriculture department and forest Department maintain
networks of rainfall and climatic stations in Kerala.
Surface Water Resources
45. Most of the state is drained westwards to the Arabian Sea by 41 relatively small river systems which
originate on the upper most slopes of Western Ghats. Three rivers in the state flow eastwards to
Cauvery River Basin. Only a few of these rivers are perennial, as input of water for the rivers is only
the rainfall from the two monsoon seasons. Total average annual yield of all 44 rivers within Kerala
has been estimated as 70323Mm3 (Government of Kerala, 1974) and the utilisable yield stands at
36,300 Mm3.Even though these values indicate sufficient quantity of water for the state, during the
summer many parts of Kerala experiences scarcity of water as the available storages cannot cater to
the summer water demand.
Ground Water Resources
46. The Groundwater Estimation of the State are being done jointly by State Groundwater department
and Central Groundwater Board, set up to assess the groundwater resources of the state has
calculated based on the groundwater levels of the area. The blocks in the State were considered as
assessment units based on the availability of groundwater for future use, stage of development and
long term groundwater level trends. As per the GEC report March 2011, out of 152 assessed units in
the State, Chittur block in Palakkad district has been categorized as over-exploited (stage of
groundwater development >100%). Malampuzha block of Palakkad District and Kasaragod block
of Kasaragod district have been categorized as Critical (stage of groundwater development >90%
and <=100%) and 23 block are semi critical (Stage of groundwater development >70% and <=90%)
and the remaining 126 blocks are safe (Stage of groundwater development<=70%).
47. The net groundwater availability of the entire State was calculated as 6.07 billion cubic meters (BCM)
by deducting unaccounted losses and natural discharge during the non monsoon season from the

16
Total Annual Recharge available. The annual groundwater draft and net groundwater availability for
future irrigation development of the State was calculated as 2.84 BCM and 3.07BCM respectively.
Storage of Water
48. There are 54 dams in the state which includes 14 dams and 6 barrages maintained by Irrigation
Department and 42 by Kerala State Electricity Board and 2 dams are maintained by Kerala Water
Authority. The live storage of all irrigation reservoirs in the State is estimated as 1431 Mm3. Apart
from rivers, there are several traditional sources of water in Kerala. CWRDM has identified 236
perennial springs in the State, of which about 20% are being utilized. The Irrigation department has
carried out a census of the ponds and has tabulated 45000 ponds by giving unique identification
number. There are also several lakes in the State from which the demand is met.
49. Special management strategies are to be evolved for the state in the 13th Five Year Plan for
increasing the availability of water during the summer season. The existing storage capacities of the
dams are only 7.75% of the available water. Conservation of water might have to be taken up by the
stake holders including the Government departments of Irrigation, Agriculture, Forest, Soil
conservation and similar other departments involved in water resources management with support
from the Research and Academic organizations. Sustainable water resource management would
require community participation in the planning, implementation and management of Water
resource development programs. Following measures are suggested for priority intervention in the
next 5 years for improved water availability in the state.
50. The Quantitative measures are:
1. Providing head tanks in the initial reaches of the stream, which will act as a percolation tank
for the surrounding areas and downstream reaches.
2. The concept of Mazhakkuzhi may be done away with and the concept of Recharge pit shall be
propagated. The Recharge pits are one which is about 5 to 6 m deep near to existing well
which will be recharged with rain water from the roof top or compound.
3. The rain water harvesting can be effectively carried out by the collection and storage of water
in tanks and reservoirs for direct use or by storage of rain water in subsurface strata as ground
water through artificial ground water recharge.
4. Rain water harvesting using large ponds with plastic lining when rain water has to be collected
from large catchments.
5. Renovation of existing ponds and tanks; the irrigation components associated with it can be
repaired and the water distribution system can be effectively sustained.
6. Promote tree crops in the sloping area that are debris mantled
7. Restrict cultivation with tilling activity to the relatively level area
8. Avoid water conservation structures of any type in the sloping segments
9. Promote free flowing water ways on steep slopes.
10. Contour terracing or bunding to be limited to the gentler slopes <35%. The terraces and
bunds should not be very lengthy and should not block the existing drainage channels
11. Avoid cutting and levelling of land in slopes >35%
12. Promote check dams in the narrow sections of streams with level bed. Restrict the height to
less than a metre. Allow accumulation of sediment.
13. Provide vegetative covering to bare land, if any
14. Gully erosion to be controlled by vegetative cover and grassed water ways.
15. In areas with settlement provide embankments to the streams for checking flow and directing
spill way.

17
16. Recharge pits- suitable in the ridge and elevated portions of watershed adjacent to wells. The
area should have deep weathering and well developed lateritic profile.
17. Check dams – in streams - third order or lower - at narrow sections exposing hard strata
18. Contour bunds –to arrest surface runoff and to check the soil erosion
19. Gully control measures both vegetative and structural
20. Percolation tanks in wide flat bottom valleys
21. Sub surface dykes in narrow sections of wide flat bottom valleys where the depth to hard
strata is less than 5 m
22. Provide embankment to major streams and river segments where active bank erosion is
reported.
23. The ideal height of the check dam shall be l m to 2m. The check dams increase the bed level
of the river or stream which was scoured away. The water level increased will have an effect
on the water table of the area. The effective increase in water table after the construction of
Check dam shall be studied.
24. Many of the irrigation tanks (Thalakkulams) at the head portion of a Padasekharam, are in
dilapidated state and has to be renovated.
25. Increasing the storage through construction of dams, check dams, regulators, ponds, tanks etc
for regulated release during summer season. Steps are to be taken for increasing the storage
capacity to 10% using suitable storage structures.
26. Replication of success stories:- Successful Attempts in the State like that was done in the Film
Video Park, KINFRA at Kazhakuttamand Chadayamangalm Block under Hariyali project etc.
shall be studied and replicated with the help of experts to improve the Water conservation
programs in the state.
27. Awareness creation on the importance of water conservation and management should be
conducted on a massive scale among the general public and farming community through
various outreach programmes and mass awareness campaigns in all the Panchayaths /local
bodies
28. Siltation is a major concern in the reservoirs. It can be periodically desilted for enhancement
of the storage.
29. Several irrigation projects are not functioning to its designed objectives. The reason can be
attributed to lack of water, damaged condition of the systems, encroachment and conversion
of the crop lands for other purposes. Rejuvenation programs can make it functional.
51. The Qualitative measures are:
1. Waste management infrastructures. There is an increasing trend among people to dispose the
Septic tank waste and Slaughter house waste into the water course. Modern waste digestion
tanks are to be built at the Block level to decrease the obnoxious pollution of water and
improve the availability of water.
2. Alternative to sand mining. The construction industry needs river sand and if it is not available,
it will start degrading environment by quarrying the rock for manufacturing sand. Supplying
construction sand without major degradation of environment is the responsibility of the
Government and it time now to look at feasibility of mining sand from the sea. The mined
sand from sea can be deposited in the river mouth with sheet pile walls to exclude salinity.
The salinity of the sand will be removed after a rainy season.
3. Integrated water resource management. IWRM plans shall be made at basin level by involving
different Government department and other stake holders to promote the coordinated
development and the management of water, land and related resources.
4. Waste management and pollution control. Throwing of solid waste in water bodies is a major threat
demanding stringent action. It is a punishable offence and punitive action should be taken
18
against the offenders. Necessary provisions may be introduced in the Environmental Act for
enforcement of the same.
5. Afforestation is a necessity for preventing soil erosion and for maintaining an ecological
balance. It is advisable to leave at least a 50m wide strip of tree belt where there is a distinct
break in slope between upper and lower slope. This belt is to contain and protect the lower
slope from rock fall and small debris flows that are initiated from the upper slope region. It
also helps in stabilizing the area by retarding the overland flow and by providing humus.
6. Recycling of waste water. To cope with the increased demand of water, it is necessary to recycle
waste water which can be used for purposes of washing, gardening etc. Recycling
mechanisms should be made mandatory for establishments having greater water usages. The
bathroom water and washing water can be again pumped back for flushing the toilets.
7. Controlling sand mining. Even though sand mining is prohibited at certain locations,
unauthorized mining is continuing. This should be strictly looked into.
8. Prevention of Contamination of water bodies. A campaign shall be initiated to prevent the citizens
from dumping waste into the water course and alternate waste handling system shall be
provided. Quality of the water shall be monitored and suitable action shall be taken to
control the pollution with the help of people participation.
9. Demarcation of boundaries of rivers, lakes, wetland. Necessary rules have to be framed for
regulation of the constructions near to the water bodies. The boundaries should be clearly
demarcated. The local bodies should also keep a vigil while granting sanction for such
constructions. Imposition of fine against the law breakers is to be strictly observed.
10. River bank protection measures. It is an utmost necessity that the river banks should be protected.
Otherwise, the banks will collapse thereby reducing the width of the river and obstructing
the natural flow of the stream.

19
CHAPTER 5
WATER DEMAND
52. Agriculture is the single largest consumer of water. Agriculture accounts for more than 70% of the
total water demand globally and its share is as high as 90% in developing countries like India. In this
context, even a marginal saving in irrigation water use can release substantial amounts of water for
agricultural expansion as well as for meeting the needs of other sectors like domestic water demand.
The irrigation water is one of the most ill-managed resources, which creates a severe scarcity of
water, both for drinking and irrigation in some region and environmental problem such as water
logging in some region. It is now widely recognised that a paradigm shift from the traditional supply
orientated mind set towards the concept of water conservation and demand management is essential
for the sustainability of water resources and the environment, as well as economic efficiency and
social development.
53. The Geographical area of the state is 38, 86,287 Ha. The net area under cultivation during 2014-15
was 20,42,881 ha, which occupies 52.57% of the total geographical area in the State. The gross
cropped area was 26,24,624 ha (DES, 2016).
Current Utilisation
54. Irrigation. The utilisation of surface water for irrigation in the state is not directly assessable.
However, an indirect assessment can be done based on the users in the State. As with any region
where irrigation is practiced, the major user of water in the State is irrigation sector. The irrigation
efficiency in the studies carried by CWRDM has been found to be as low as 40%. The net irrigation
water utilisation in the State is estimated as 3532 Mm3 and the gross irrigation water utilisation in the
State is estimated to be 8830 Mm3. This is supplied from both the surface and groundwater sources.
The groundwater usage for agriculture is estimated as 1300 Mm3 (CGWB)and the remaining 7530
Mm3 is the quantity utilised from surface water sources which includes major, medium and minor
irrigation structures.
55. Domestic. The 54th round of NSS survey report on drinking water and sanitation shows that the
population covered by piped water supply is merely 11.5% and about 85% households in the State
depend on the traditional open wells for their household water needs. Groundwater has been the
mainstay for meeting the domestic needs of more than 80% of rural and 50% of the urban
population. The current drinking water utilisation in the State is estimated to be 2100 Mm3 out of
which 1500 Mm3 is from groundwater.
56. Industrial. Industrial demand in the State is relatively less compared to other neighbouring States as
the number of industries is less except in Ernakulum district. No data on the total water utilisation
for the industry in the State is available. According to FICCI the current water utilisation for the
industries in the country is 8.5% of the total lwater abstraction, and out of which almost 45% is
from surface sources, 35% from groundwater and 25% from municipal sources. This ratio can be
assumed for Kerala also even though it may be slightly on the higher side. Thus the current industrial
water demand for the State is estimated to be 1015 Mm3. Thus the total water utilisation in the state
in estimated as 11345 Mm3.
20
Future Demand
57. The calculation of future demand of water requires the analysis of data from various agencies. The
main users of water are Irrigation, Domestic, Industrial and Hydro Power. There shall be a provision
for the inclusion of demand for the Salinity control and Inland water navigation. As per the recent
development studies, the ecology should also be considered as awater user for taking up the
environmental flow to protect the ecosystems that underpin our water resources. Here, we briefly
discuss water demand for some of the major sectors. Fund requirements for 13th Plan period have
to be worked out subsequently.
58. Irrigation. Predicting the future demand in irrigation sector is becoming a challenging task especially
in the context of the climate change. This may increase the irrigation demand if rainfall is less;
however, for the present calculation this aspect is neglected. It is expected to increase the area under
irrigation by 25% by the end of the next five year plan. This will increase the irrigation demand by
the same margin and thus the net irrigation demand by 2022 will be 4415 Mm3 and the gross
demand with the same efficiency will be 11038 Mm3. Even though theoretically this can be met from
the current unutilised balance of both surface and groundwater, there will be several practical
limitations in achieving the same by developing and utilising these resources. Hence emphasis should
be given in adopting modern techniques and scientific water management practices to improve the
efficiency during this period. It is expected to improve the irrigation efficiency by 20% during this
period, there by bringing the irrigation demand down to 8830 Mm3. On food security consideration,
it is expected that the Irrigation demand may rise up to 22000 Mm3 in 2050 AD.
59. Domestic. The population of Kerala is projected to be around 36 million by the year 2022 and the
expected domestic water demand will be around 2200 Mm3 on an annual basis.
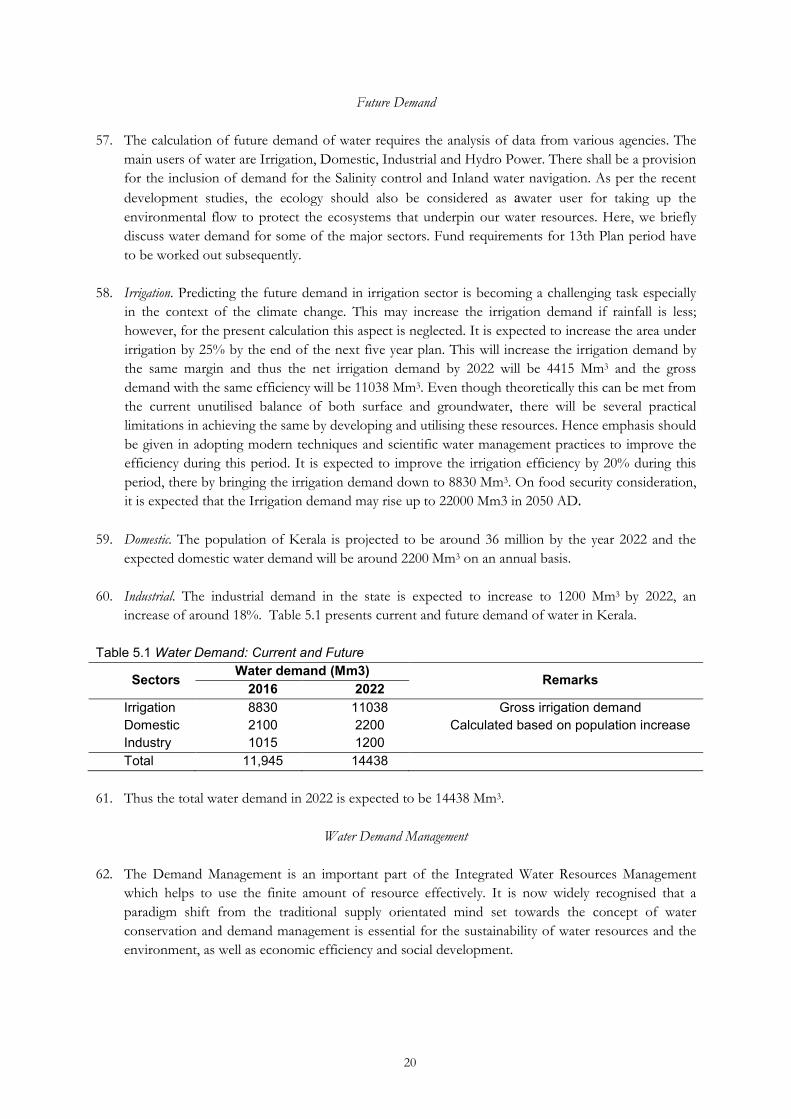
60. Industrial. The industrial demand in the state is expected to increase to 1200 Mm3 by 2022, an
increase of around 18%. Table 5.1 presents current and future demand of water in Kerala.
Table 5.1 Water Demand: Current and Future
Sectors Water demand (Mm3)
Remarks 2016 2022
Irrigation 8830 11038 Gross irrigation demand
Domestic 2100 2200 Calculated based on population increase
Industry 1015 1200
Total 11,945 14438
61. Thus the total water demand in 2022 is expected to be 14438 Mm3.
Water Demand Management
62. The Demand Management is an important part of the Integrated Water Resources Management
which helps to use the finite amount of resource effectively. It is now widely recognised that a
paradigm shift from the traditional supply orientated mind set towards the concept of water
conservation and demand management is essential for the sustainability of water resources and the
environment, as well as economic efficiency and social development.

21
63. One of the notable definitions of Water Demand Management is: ‘The management of the total quantity of
water abstracted from a source of supply using measures to control waste and undue consumption.’ An efficient
Water demand management system reduces the infrastructure cost by increasing the area of supply.
Consumptive Use of water
64. Consumptive use by irrigated agriculture has two main components: water which transpires from the
plant’s leaves; and water which evaporates directly from the soil surface. The largest savings can be
made by reducing the latter through such mechanisms as closer row spacing, mulching, correct
timing of irrigation at different stages of a crop’s life cycle, and well-designed sub-surface drip
irrigation that does not wet the soil surface. Transpiration cannot easily be reduced without affecting
crop yield. However, some crop types benefit from correctly timed periods of water stress that
actually serve to increase crop productivity and quality.
65. There is a difference between the water which does not return to the water resources system - and
that which is diverted but from which a proportion is returned to the system in a short period of
time. It has been said that this is the difference between water that is used, and that which is used up.
This is of particular importance for the agricultural sector, which is often cited as “using” vast
amounts of the available water resource. However, a large proportion of the water abstracted in
irrigation systems will return to the system. The quality and the timing of the return flows is
important regarding the usefulness of the water for the downstream users.
66. Irrigation systems, and more notoriously industrial users, often return polluted water to the system,
effectively meaning that the water is not available for further use. In this case, an improvement in
irrigation efficiency, whereby a smaller volume of water is abstracted and an even smaller volume
returned - will mean a better quality of water is available for the next downstream user. If these
systems are adopted the pesticide pollution in the downstream water bodies can be controlled to the
minimum in Kerala. The use of harmful pesticides by the farmers will also reduce and they will
adopt suitable water conservation measures. Other important measures to improve the water usage
efficiencies are:
1. The agricultural water demand can be reduced by proper planning viz., early sowing of variety,
uniform way of planting in group approach, laser land leveling, mulching etc.
2. Reducing the agricultural water demand by proper planning viz., early sowing of variety,
uniform way of planting in group approach, laser land leveling, mulching etc.
3. Irrigating the high value horticultural crops such as pepper, cardamom and banana to attain
maximum productivity
4. Participatory Irrigation management for enhancing the physical access of water to each and
individual plot and by which more cultivable area may be brought under assured irrigation
5. Enhancing the adoption of precision-irrigation, poly house farming, hydroponics and other
advanced micro irrigation and water saving technologies to achieve more crop per drop of
water.
6. Improvement drainage facilities in farm area.
7. Promotion of extension activities relating to water harvesting, water management and crop
alignment for farmers and grass root level field functionaries.
8. Ensure the integrated development of un irrigated areas using the watershed approach
towards soil and water conservation, recharging the groundwater, minimizing the runoff
losses, providing livelihood options and other natural resource management activities.
22
67. Computer models. There are various softwares available in the market to optimise the water use
efficiency. The water allocation models like MIKE Basin can analyse the temporal and spacial
requirement of the different water users in the basin and can be used to allocate the available water
efficiently. The operation of a storage structure can be simulated in the program and different
scenarios can be analysed for optimum usage. Decision Support Systems (DSS) shall be developed
for water stressed basins for efficient management.
68. Conjunctive use of water. In the present scenario, the canal tail end users of an irrigation projects rarely
gets sufficient quantity of water to sustain their crops. The canal head users demand more water of
the canal there by denying sufficient water to the downstream users. The ground water in the head
region will be less utilised as farmers tend to use free canal water and recharging of the ground water
occurs from leakages of the canal and due to the application of the surface water. Restriction on the
use of canal water by head users are to be introduced and head users have to be encouraged to use
ground water for most of their uses by giving incentives. This will generate more water in the system
for downstream users.
69. Misuse of the water. The farmers in the ayacut of a project area often misuse the water from canal.
They obviously take more water than they require and often has the tendency to go for flooding type
of irrigation. With the availability of the free electricity in some areas, the farmers are extracting more
water than required from the ground water reserves.
70. Pricing of water. The pricing water has been used as a Demand Management instrument in the
developed countries. The feasibility of pricing on cost basis may not be a good option in Kerala in
the context of agrarian crisis and high labour cost. The idea of pricing will encourage the farmers to
avoid wastages and to adopt new technologies for agriculture.
71. Performance indicators. There are various methods to assess the efficiency of water resources system.
Post facto evaluation of Irrigation projects, Baseline study for the Water use efficiency, Bench
marking of project are some of the periodical studies proposed by the Central Water Commission.
They have proposed 70 performance indicators to assess the state performance in the water sector.
Constant monitoring of these parameters will give the Government valuable data to take appropriate
action. Suitable fund and manpower shall be allocated for this work.
72. Change in agricultural practices. Water use performance can be optimised by changing crop types to
those of higher value. Major savings can also be made through the use of more efficient irrigation
techniques, such as drip and sprinkler irrigation, rather than inefficient methods such as furrow
irrigation. Furthermore, savings can be made through the use of water efficient irrigation equipment.
To be most effective, the water management system should motivate people to save water.
73. Micro irrigation. Micro Irrigation is an ideal method to reduce the water demand in agriculture. Timely
and adequate government subsidy for micro irrigation can be made available to farmers. Adequate
technical backup/after sales service to farmers on installation/maintenance of the micro irrigation
system can be ensured by the Dept/ dealers. The Department can promote group farming, especially
in the command areas of community irrigation projects for remunerative crops like vegetables,
banana etc. along with provision of higher level of subsidy for micro irrigation systems like drip
fertigation to the group of farmers. The existing constraint of small sized holdings in adoption can
be overcomed to some extent by this group approach. Further, this approach can help to inculcate a
better sense of collective farming among the farmers. Alternately, in place of subsidy for the Micro
23
Irrigation, it can be installed by the Government in at least one branch canal of every project. This
will conserve the use of water.
74. Recycling of waste water. To cope with the increased demand of water, waste water can be recycled and
used for purposes such as washing, gardening etc. The waste water from the washing of cloths and
bathroom shall be pumped back for the toilet flushing purpose. Recycling mechanisms should be
made mandatory for establishments having greater water usages.
75. Training institute. In order to increase the water application and use efficiency in irrigation, there is a
need to change from the conventional irrigation practices to micro irrigation and other advanced
irrigation practices. For upland perennial and seasonal crops micro irrigation is highly desirable from
the point of view of prevention of loss of water. In the case of low land crops such as paddy a
paradigm shift in the conventional open channel conveyance and distribution system is required in
order to prevent water losses and also water logging at head end regions. Short term courses of 1 to
2years duration are to be offered to the existing professional in the related disciplines to mould field
level irrigation water management experts at different hierarchical levels.
76. Development WRIS. Various agencies have been collecting the Water resources data in the state. The
data includes temporal data like rainfall and river gauging and spacial data like canal alignment, river
mapping, structures, ponds etc. The data shall be collected and shall be used to develop a web site as
Water Resource Information System for the use of the stakeholders. This will make the management
of resources easier and will be able to develop a Decision Support system for an efficient decision
making. The Grant from National Hydrology Project can be used for the purpose.
77. Coordinating with ISRO. The Indian Space Research Organisation has many valuable data for the
management of the Water Resources Sector and the benefits of the space technology shall be
introduced to the water sector. They can supply high resolution Digital Elevation Models, ssatellite
images for canal mapping, Bhuvan website for WRIS hosting etc.
78. Repairs and maintenance of MI Structures. There are about 3783 Nos of MI structures and many of them
are not functioning well. Periodic maintenance of these schemes are essential to achieve the desired
output.
79. e- Governance activities. In this era of fast technological advancement, e-Governance facilities will
enable to render services of the Department in a more efficient way.
80. Coastal protection. The state has a shore line of 560 Kmand state is spending enormous amount of
money to protect it. New technology has to be developed to protect the shores effectively and
economically. The Green Climate Fund shall be used to engage foreign consultants to have study of
the Kerala Coast and for the remedial measures.

24
CHAPTER 6
EVALUATION OF WATER RESOURCE PROJECTS
81. Irrigation plays an important role in the growth of agriculture and contributes to State’s income.
Planned development of Irrigation was initiated since the first five year plan. Irrigation development
in the State was mostly centered on development of surface water resources. In the initial stages, like
rest of India Kerala also relied on the development of major and medium irrigation schemes. There
are 41 West Flowing rivers and three East flowing rivers. All these rivers together have an utilizable
water resource of around 36,300Mm3 inside the State.
82. In spite of the huge investments made over the plan periods, there exists wide gap in the creation
and utilisation of irrigation potential across various types of irrigation systems. Plan wise
infrastructure investment on water sector includes expenditure on a) Major and medium irrigation
systems b) Minor irrigation comprising ground water and surface water c) Command Area
Development and d) Flood control and coastal zone management.
Activities of Irrigation Department
83. Irrigation department is involved in water distribution from the existing completed projects and
several minor irrigation schemes including lift irrigation schemes across the State. Irrigation
reservoirs and canals are widely used for drinking water supply now.
Major and Medium Projects
84. Irrigation projects are classified according to the ayacut served by the schemes. The irrigation
schemes that have ayacut area > 10,000 hectares (ha) are classified as major irrigation schemes; the
medium irrigation scheme is expected to serve ayacut area spreading between 2000 ha to 10,000ha;
and the irrigation schemes that will have ayacut area below 2000 ha are categorised as minor
irrigation schemes. Till date the State has 19 completed projects and 4 projects under different
stages of execution. The gross Ayacut area of completed projects is 517,532 ha and net area of
completed projects is 277,492 ha. It is expected to achieve additional ayacut area of 78,979 ha after
completion of 4 ongoing projects. List of completed and ongoing projects are attached as Annexure.
Irrigation Investment during XI and XII Plan Periods
Eleventh Five Year Plan
85. The Eleventh Plan strategy recognized water as a scarce economic resource as well as common
property. It envisaged prudent use of water resource for irrigation and other purposes. Plan outlay,
budget and expenditure during 11th Plan are given in the Table 6.1.
Table 6.1 Sub-sector wise outlay for Irrigation and Flood control during 11th Plan period in rupees lakh
Sub Sector Plan Outlay
(2007-12)
Budget Per cent Share of
each sector
Outlay Expenditure
Major & Medium Irrigation 142201.0 94084 64332.37 53.65
Minor Irrigation 52083.00 35628 20364.61 17.00
Command Area Development 8500.00 3134 1334.11 1.10
Flood Management & Coastal Zone 23075.00 37897 33878.33 28.25

25
Total 225859.00 170743 119909.42 100.0
86. During Eleventh Plan an amount of Rs. 2258.59 crore was proposed for the development of the
Irrigation sector, which was 143% higher compared to the Tenth Plan. Thirteenth Finance
Commission award, AIBP and RIDF were also included in the Eleventh Plan. Minor irrigation was
given considerable thrust during the Eleventh plan period. About 24% of the plan outlay was
provided for the development of the minor irrigation.
Twelfth Five Year Plan
87. During 12th plan outlay for Irrigation & Flood Control was 3327 crore, an increase of 47%
compared to the 11th plan outlay (Table 6.2).
88. Approach, strategy and thrust areas for 12th plan period. 1. Focus on minor irrigation and development of minor irrigation structures in critical agro
ecological zones for the development of agriculture.
2. Preparation of master plan for the development of local water resource.
3. Importance for water management and methods to enhance water use efficiency.
4. Winding up long pending infrastructure projects with appropriate mechanism for optimum
use of investment.
5. Development of tanks and ponds in a phased manner.
6. Modernisation of CADA canals
7. Monitoring mechanism for Kuttanad project.
Table 6.2 Plan outlay and expenditure under sub sectors during 12th plan in rupees lakh
Name of Scheme Proposed
Outlay
Budgeted Outlay
( 2012-17)
Expenditure (ason 31.03.2016)
Relative Share (%)
Major & Medium 222700.00 177743.00 30591.82 69.43 Minor Irrigation 71100.00 50261.00 37664.2 19.63 CADA 2900.00 2800.00 2159.08 1.10 Flood & Coastal zone management
36000.00 25202.00 33385.84 9.84
TOTAL 332700.00 256006.00 103801 100
88. Major and medium irrigation accounted for the major share of irrigation outlay during this period
(69%). Relative importance of this subsector has increased. The trend is similar in the minor
irrigation sector also. In case of Flood Control and Coastal Zone Management expenditure exceeded
budgeted outlay by 32.5%. Relative share of CADA continued to be the same in 12th plan period
also.
Key Achievements
89. Conservation of groundwater and artificial recharge to enhance groundwater quantity of the area. Completed 75
recharge structures including open well recharge structure and check dams. One subsurface dyke at
Muncifchalla at Palakkad district completed. Works in other 5 check dams are in progress.
1. Completion of NHP phase II. The second phase of World Bank assisted National Hydrology
Project was completed during this plan period.
2. RRR of tanks and ponds. Under the scheme, ‘Repair, Renovation and Restoration’ of tanks and
ponds, administrative sections (AS) were received for the renovation works of 134 ponds for
Rs. 29.00 crore. Out of 134 ponds, works have been completed in 60 ponds. Another 209
ponds were covered under the scheme, “Renovation of one pond in each Panchayat”.

26
3. Implementation of check dams and other lift irrigation schemes. During 2013-14, sanction was given for
constructing 190 check dams spending Rs. 110.36 crore. Three check dams were completed
and the remaining are in different stages of implementation.
4. CADA canal. Part of modernization of CADA canals in Periyar Valley, Chitturpuzha,,
Malampuzha, Walayar and Mangalam projects has been completed.
5. RCB at Madambath in Kannur district completed.
Long Pending Irrigation Projects (Major and Medium)
90. There are four long pending irrigation projects which began in 1970s. All four projects are briefly
discussed here.
Karapuzha Irrigation Project
91. Karapuzha Irrigation Project, the first project taken up for execution during the Fifth Five Year
Plan, envisaged construction of an earth dam across Karapuzha river to create a reservoir of 76.50
Mm3 storage capacity and to irrigate an ayacut of 5221 hectares(net) spreading over three Taluks of
Wayanad district. The project aims to provide irrigation facility during the second crop of paddy.
The Karappuzha Irrigation Project was included in the Accelerated Irrigation Benefit Programme
under Prime Minister’s Relief Package during 2006-07. The project was approved by Planning
Commission in 1978 with an estimate cost of Rs 7.60 cr envisaging irrigation to CCA of 5600 ha and
an ultimate irrigation potential of 8721 ha. Now, as per 2010 schedule of rates, the revised estimate is
Rs 441.50 crore. Cumulative expenditure incurred up to 31.08.2016 is Rs 313.75 crore.
92. Present Status - Head works.
1. Earthen dam and saddle dam – Fully completed.
2. Spillway, radial shutter, service gate, emergency gate, diversion chamber - Fully completed
3. Canal System- Status of canal system is given in the table 6.3.
Table 6.3 Status of canal system
Sl No Description Length Length of
completed canal Remarks
a Main Canal 25.545 km 25.545 km Completed
b Branches (5 branch canal) 43.24 km 20.50 47.26 % completed c Distributories 60.145 km 2.12 3.50% completed Total length of canal 128.93 km 48.10
93. Critical gap in implementation. The project has been partially commissioned on 20.6.2010 with an
ayacut (CCA) of 390 ha and an irrigation potential of 608 ha was created out of 7355 ha envisaged.
As on March 2016, on completion of repairs of canal, additional CCA of 211 ha was created.
Thus, as on 31.03.2016, total CCA created was 601 ha. Main bottlenecks of the project are delay in
land acquisition and lack of technical staff as detailed in Table 6.4.
Table 6.4 Issue of land acquisition
Description Length of canal Ayacut area proposed to be irrigated
Remarks
Land not acquired for canal
61.91 km 3678 ha
Land acquisition proposals are to be submitted only after joint verification of the present ayacut with the people representative and agricultural

27
department. 94. At present, in the project, water is stored only up to 39.4513 m3. This is because, there is still 7.1
ha land to be acquired for raising the reservoir water level upto +763 MSL (FRL storage 76.50
Mm3) which is the designed full capacity level.
95. Lack of technical staff. There are only 11 nos of technical staff against the 41 nos of sanctioned post.
96. The project has to be completed after considering the following:
1. Prioritise the critical gap areas where bottle necks are reported and where there is irrigation
demand and arrange works only in those areas
2. Thin spreading of resources should be avoided
3. Avoid land acquisition where there is no irrigation demand
4. Necessary technical staff to be posted
5. Terminate the project after completing the bottlenecks and critical gaps at a convenient stage.
Muvattupuzha Valley Irrigation Project (MVIP)
97. The Muvattupuzha Valley Irrigation Project, one of the major projects in Kerala envisaged
utilization of the tailrace discharge from the Moolamattom Power House of the Idukki Hydro-
Electric Project and the dependable runoff from the catchments of Thodupuzha River. MVIP was
started in 1974 with an estimated cost of Rs 20.86 crore and the revised estimate amount is Rs.
945.00 crore (2012 SOR). Considering several problems besetting this project a technical
committee was appointed to evaluate this project. Recommendations of the committee is given in
the Box1.
Box 1 Recommendations of the Technical Committee on MVIP
Recommendations of Technical Committee on MVIP vide G.O No. 20/2008/ WRD dated 10.04.2008
A comprehensive study was undertaken by Kerala State Planning Board to evaluate the progress of
works under MVIP during the period 2007-08 and it was found that due to improper and mismanaged
implementation process, cost of the project was enhanced to 3179 percent. On analysing the action
plan prepared for the project, State Planning Board has opined that further land acquisition is not
necessary for the smooth implementation and permitted to continue the works that are under
progress. But, State Planning Board did not recommend the works that have not yet started and those
which require acquisition of land.
In order to assess the drawbacks occurred in implementation and to consider the necessity of
undertaking new works and their funding, a technical committee was constituted on
15.10.2007.Based on the recommendations of the technical committee, Government vide order No.
20/2008/ WRD dated 10.04.20018 has accorded sanction for the following works subject to certain
conditions.
1. Design of works not commenced require approval of IDRB.
2. Works of Madakkathanam distributory can be undertaken subject to the condition that
concrete lining should be limited to certain areas.
3. Works of Devamathakunnu Ambalakunnu ( length of the distributory to be reduced,
suitable change in design for cost reduction)
4. Works of Edayar distributory ( redesign subject to the available ayacut)
5. Karikode distributory subject to reworking on the alignment and design for cost reduction.
6. Undertake the construction of Uppukandam, Anicad east M.D with the lowest possible

28
cost.
7. Include MVIP in Eleventh Plan and complete all the works by 2010 and declare the project
as completed by 2011.
98. Present Status of MVIP. Details of the project and its present status are given in the table 6.5
Table 6.5 Status of the canals and Ayacut under MVIP
Sl. No
Name of canal
Total length in Km
Completed
length in Km
Progress
length in km
To be arranged in km
% of work
completed
Total Ayacut in Ha.
Ayacut
created in Ha.
Ayacut to be
created in Ha.
% of Ayac
ut creat
ed
1 Main canal
65.437 65.437 - - 100 7,637 7,637 0 100
2 Branches 57.154 54.645 2.509
96 4520 4518 2 99.90
3 Distributories
213.00 190.95
9 14.245 7.796 90
23462
20395 3067 86.90
Grand Total
335.591
311.041 16.754 7.796 93
35619 32550 3069 95.60
99. The expenditure of the project as on June 2016 is Rs 918 Cr. including establishment cost. AIBP
Central Loan Assistance of Rs 154.96Cr. was released during 2000-2009. No CLA has been released
since 2009. The ultimate irrigation potential of the project is 35619 ha, out of which, an ayacut of
32550 ha has been created. Balance work to be done for the completion of the project for achieving
the rest of 3069 ha. of Ayacut is given in the Table 6.6.
Table 6.6 Details of the Work, probable date of completion and amount required
100. Key Issues in Implementation.
1. Delay in land acquisition
Sl.
No. Name of work
PAC in
Lakhs
Probable date
of completion
Balance amount
required in (amount
in Lakhs
1 Piravom Branch Canal from Ch:
4150m to 6604m. 140.51 12/2016 140.51
2 Ezhuthonippadom aqueduct over
railway crossing 207.79 5/2017 207.79
3 Madakkathanamdistributory 828.62 06/2017 492.45
4 Anicad East M.D. 500.00 03/2018 500.00
5 Koothattukulam Lift – Erection of
motor and pump set. 140.00 12/2017 140.00
6 Onakkoordistributory 835.82 12/2106 117.96
7 Edayardistributory 2055.75 12/2106 2055.75
8 Elanjidistributory 610.00 03/2018 610.00
9 Karikodedistributory 4790.00 03/2018 2613.03
10 Manjoordistributory pipe line crossing 56.34 12/2106 56.34
11 Kurumulloordistributory tail end
portion 660.00 03/2018 660.00
12 Kurumulloordistributory protection
work 205.00 03/2018 205.00
Balance amount required for the proper completion of Project 7798.83

29
2. Issues related to railway crossing – At Ezhuthonippadam and Manjoor, MVIP canal cross the
railway line. There was delay in obtaining sanction from railway authorities.
3. Complex geological condition necessitated change in design and associated works.
4. Public protest against blasting, alignment etc during execution.

30
101. Suggestion/ Recommendation for Project Completion.
1. MVIP has to be closed after completing the identified works in the GO issued in 2008.
2. No additional work need to be approved other than what is included in the order.
Idamalayar Irrigation Project
102. Idamalayar Irrigation Project is a diversion scheme for diverting water of Periyarriver for irrigating
14394 ha. of cultivable lands in Periyar and Chalakudy basins. The project also envisages the
improvement and augmentation of Chalakudy river diversion scheme by linking with the canal of
Idamalayar irrigation project.
103. The project was commenced in 1981 with an estimated cost of Rs. 17.85 crore and was revised to
Rs. 750.00 crore as per 2012 SOR.Up to 31st March 2016, the total expenditure incurred is Rs.
418.29 crore of which 345.10 crore was spent for works and the rest Rs. 73.19 crore was for
establishment. The present status of the work is given in the table 6.7.
Table 6.7 Details of Idamalayar Irrigation Project
Name of Canal
Total Length
(km)
Length completed
(km)
Length in progress
(km)
Work to be
arranged (km)
Works completed
(%) Remarks
Main Canal 32.28 32.28 0 0 100 Full length completed
Low level canal
27.25 12.85 0.500 13.90 47.17
Canal fully completed
upto ch.7.3 km and made
water through
Link Canal 7.58 2.79 0.040 40.75 36.85 Land
acquisition is in progress
New branches of LLC
26.00 0 0 0 0 Under
investigation
New branches of CRBC & CLBC
59 0 0 0 0 Under
Investigation
104. Ayacut achieved. So far 2391.66 ha of Ayacut has been covered. Of which 999 ha was served by the
Main Canal, 222.66 ha by low level canal (direct), 1042ha by low level canal (through sluice) and
128ha in Manppattuchira.
105. Balance works to be done.
1. Low level canal ( Total length 27.25 km) - Following works in LLC are to be arranged
1. MC road crossing at ch. 1040 m to 1059 m.
2. N.H.crossing portion at 14784.5 m
2. Link Canal ( Total length 7.575 km)
106. Key issues.
1. Land for main canal passing through forest area was obtained from the Forest Department
after 22 years of starting the project.
31
2. The initial reaches of main canal from ch. 300 m to 1350 m passes through high cutting forest
area. Hence during the formation of canal, frequent earth sliding occurred due to heavy
seepage of water as Bhoothathankettu barrage is in the immediate vicinity. Therefore, much
time was consumed to complete the initial reaches of main canal.
3. Delay in obtaining AS for railway crossing work, no tender response, public protest etc.
4. Sanction for N.H crossing portion at ch 14784.5 m of LLC is pending.
5. Land acquisition of link canal for the portion beyond ch 2000 m upto 7575 m are in various
stages of progress.
107. The project has to be completed after considering the following:
1. Prioritise the critical gap areas where bottle necks are reported and where there is irrigation
demand and arrange works only in those areas
2. Thin spreading of resources should be avoided
3. Avoid land acquisition where there is no irrigation demand
4. Terminate the project after completing the bottlenecks and critical gaps at a convenient stage.
5. All the difficult areas for execution like NH cutting etc to be avoided
6. Arrange works first where contiguous areas could be completed instead of arranging
simultaneously in a scattered manner
Banasurasagar Irrigation Project
108. The project was commenced in 1979 with an estimated cost of Rs 8.00 crore to irrigate an area of
2800 ha.(net) agricultural land to raise the second and third crops in two Taluks of Wayanad district.
The revised estimate of the project as per 2010 SOR is Rs.185.5 crores. Cumulative expenditure of
the project up to 31.08.2016 is Rs 52.78 crore (including 85 lakh paid to KSEB as share cost).
109. Present status. All the works of main canal except for the two aqueducts have been completed. The
works of both branch canals – Padinjarathara branch canal and Venniyode branch canal are in
progress. Total land required for branch canals and distributaries is 105.21 ha, out of which 18.14 ha
land has already been acquired and the balance 87.07 ha of land are to be acquired.
110. Key issues.
1. Land acquisition for branches and distributaries – Delay in handing over the land required for
canal construction. Eighty three per cent of land has to be acquired.
2. Shortage of technical staff- There are only 10 nos of technical staff against the 25 nos of
sanctioned posts.
111. The project has to be completed after considering the following:
1. Prioritise the critical gap areas where bottle necks are reported and where there is irrigation
demand and arrange works only in those areas
2. Thin spreading of resources should be avoided
3. Avoid land acquisition where there is no irrigation demand
4. Necessary technical staff to be posted
5. Terminate the project after completing the bottlenecks and critical gaps at a convenient stage.
112. As suggested in the foregoing discussion that there are challenging issues to complete the projects
achieving the objectives envisaged in the original proposal. Therefore it is important to revisit the
functioning of these projects and take necessary action. Considering the time lag, change in land use
pattern, difficulties to acquire land and similar other problems and evaluation conducted for the
32
Muvattupuzha project Government may take a final decision about phased closure these projects
and consolidate the achievements.
Kuttanad Package
113. To mitigate agrarian distress, MSSRF recommended a variety of interventions to be implemented as
a package with a total outlay of Rs 1840 crore (2007 price level) which was approved by the Union
Government on July 2008. In order to carry out the recommendations suggested in the report,
Government vide order No. 169/08/Agri dated 15.10.20008 had constitute three committees,
namely, Kuttanad Prosperity Council, Co-ordination committee and Task Implementation
Committee. The Prosperity Council is headed by Chief Minister. Key Ministers, Chief Secretary,
Secretaries of major departments, MLAs, and District Panchayat Presidents are members of the
Council. Agriculture Department is the nodal department.
Project/Schemes under Kuttanad Package
114. Schemes related to flood control, salinity management and drainage are undertaken by Irrigation
Department for an amount of Rs. 1517.90 cr. Seven schemes/ projects have been taken up for
execution under Kuttanad Package so far, in addition to the works taken up under 13th Finance
Commission. Out of these 7 schemes, 4 schemes have been approved by Government of India for
Central assistance under FMP. For other 3 schemes, DPRs have been submitted for approval and
central assistance under FMP.
115. Schemes approved by Government of India.
1. KEL-I – Mitigation of floods (14 Padasekharams)
2. KEL II - Mitigation of floods (4 Padasekharams in Kayal area and 5 Padasekharams in
Group 9)
3. KEL III - Mitigation of floods (231 Padasekharams)
4. KEL IV- Mitigation of floods in 12 watersheds
116. Schemes submitted for Central assistance.
1. Mitigation of floods in 397 padasekharams of Kuttanad Taluk and in 14 padasekharams of
Veyyapuram Panchayat of Kuttanad constituency (Estimate amount: 1212.45 cr)
2. Modernisation of Thannermukkom bund (TMB) - (Estimate amount: 255.35cr)
3. Modernisation of Thottappally spill way (TSW) - (Estimate amount: 47.00cr)
117. Details of these projects are given in the table 6.8.

33
Table 6.8 Details of the schemes related to Kuttanad Package
Sl No
Scheme Estimate Cost(cr)
Cost approved under FMP- XIth plan ( cr)
Central share received ( cr)
Total exp as on
31.10.16 ( cr)
1 KEL I 24.7 24.7 9.906 18.1 2 KEL II 118.913 118.913 65.864 119.69 3 KEL III 379.05 106.13 31.875 74.6 4 KEL IV 248.39 70 11.25 31.87
5 Works in KuttanadTaluk
1212.45 Original AS 758.39 cr. Revised DPR for 1212.45
crore submitted for central assistance 76.52
6 TMB 255.335 DPR submitted to GOI-IMC approval to be obtained 134.2
7 TSW 47 Original AS 13.49 cr. Revised DPR for 47 cr
submitted for central assistance 7.77
8 13th Finance 41.1935 39.08
TOTAL 2327.032 501.87
118. An amount of Rs 200.00 core was budgeted during the first four years of 12th plan as State share
and another Rs 600.00 crore was provided as Central share. Out of Rs 800 crore budgeted, total
utilization stood at Rs 356.81 crore comprising of Rs 206.68 crore under State share and Rs 150.13
crore under Central share. During the year 2016-17, an amount of Rs 100 crore was budgeted as
Central and State share and the expenditure as on 4.11.2016 was Rs 103.61 crore. There was no
release of funds from Government of India during 2012-13 and 2013-14. In 2014-15 an amount of
Rs 55.22 crore was released. Status of ongoing schemes is given in the Table 6.9.
Table 6.9 Status of ongoing schemes
Name of
scheme
Estimate Cost (in crores)
Total no. of works taken up
for execution/ arranged
No. of works
completed
Expenditure as on
31.10.16 ( cr)
Total ayacut served (in ha)
Remarks
KEL-I 24.70 14 14 18.1 574.83 Completed as on
31.3.16
KEL-II 118.913 3 3 119.63 3265.91
ha Completed as on
30.9.16
KEL-III 379.05 57 38 74.6 3265.91
ha
All arranged works will be completed by
31.12.16
KEL- IV 248.39 21 7 31.87 All arranged works
will be completed by 31.12.16
Kuttanad Taluk
1212.45 57 28 76.52
Revised DPR based on DSR 2014 is
submitted for central assistance.
TMB 255.33 134.24 69 % of the work is
completed.
TSW 47 7.77
State TAC has approved DPR and
this has been submitted to Central Water Commission
for approval and onward transmission to MOWR for central
assistance under FMP.

34
Recommendations
1. Complete the ongoing works alone
2. No new works to be taken considering the cost overrun and lack of funding support from
Government of India.
3. An evaluation to be done from an agriculture and ecological perspective of the package
4. Steps to be taken to get the share of funds from GOI
Post Facto Evaluation Study of Completed Irrigation Projects in Kerala
119. Post Facto Evaluation Study on all completed medium and major irrigation projects in Kerala is
aimed at the evaluation of the performance of irrigation Projects in providing sufficiency of water
for agriculture. It also covers social and economic status of the people residing in the ayacut area.
The study is based on primary data collected from the farmers inhabiting the ayacut area of the
project. The data covers key factors related to the merits and demerits of the irrigation facilities
received by the farmers, such as, present cropping pattern and the development in the ayacut area,
analysis of population, literacy rate, occupation, income from agricultural, allied agricultural and non-
agricultural activities, land use pattern, animal husbandry, source of drinking water, types of
irrigation, methods of farming, problems faced by farmers, data on mechanization in farming,
marketing problem, area production and productivity of various crops. In addition, Bench marking
of irrigation projects are also attempted.
Methodology/Instruction Manual for the Collection of Data in Each Sector
120. In post facto evaluation study of an irrigation projects, a detailed survey is conducted in the selected
ayacut area. Random selection method was followed to interview farmers and data, which was
compiled and reports were prepared.
121. The methodology followed for this study includes the following exercises:
1. To examine the extent of the Irrigation potential created and utilized.
2. To ascertain whether the farmers had adopted the recommended cropping pattern as
envisaged in the project report. If not, the reason for non–adoption.
3. To examine the change in the production and productivity of agricultural sector, income and
employment and the social and economic conditions of the people in the command area.
4. To study the effect of structural changes/operational inefficiencies if any in the schedule of
irrigation followed.
5. To examine the social attitude towards the irrigation project and its effect on theactive
participation in the project implementation.
6. To review the various inhabiting factors in the execution of irrigation projects.
7. Bench marking has been attempted using indicators such as a) system performance, b)
agricultural productivity, c) financial aspects and d) environmental issues. These indicators are
calculated by using various basic parameters collected from primary as well as secondary
sources. Some of the indicators collected for the preparation of bench marking are:(i) Water
Delivery Capacity index, (ii) Field application efficiency, (iii) Annual relative Irrigation supply
Index, (iv) Output per unit crop water demand, (v) Maintenance cost to revenue ratio, (vi)
Average depth to water table (m) (vii) Water quality: pH/ Salinity/ Alkalinity Index and (viii)
Land damage Index

35
122. In the study, the socio economic background of the beneficiaries mainly farmers prior and posterior
to the commissioning of the irrigation projects has been analysed. The study report also contains
various difficulties/problems faced by the beneficiaries and practical remedial measures to overcome
them.
123. Post facto evaluation study has been conducted has been completed for eight irrigation during 2012-
2016 period. These are: (i) Kuttiyadi Irrigation Projects, (ii) Chittoorpuzha Irrigation Projects, (iii)
Pothundy Irrigation Projects, (iv) Kallada Irrigation Projects (v) Chalakkudy Irrigation Projects (vi)
Vazhani Irrigation Projects (vii) Chimoni Irrigation Projects and (viii) Mangalam Irrigation Projects
Out of these studies report of Pothundy Irrigation Project has been published and the findings of
the same is detailed below.
Pothundy Irrigation Project
124. The Pothundy Project on Ayalur river (Bharathapuzha basin) was commissioned during 1967.It
comprises of an Earth Dam with an estimated live storage of 43.90 Mm3 of water across the
tributaries of Ayalur River, namely, Meenchadypuzha and Padipuzha about 400 m above the
confluences. Dam site of Pothundy at a distance of 8km from Nemmara is located in Nenmara and
Pothundy villages of Chittur Taluk in Palakkad district.
125. Agricultural performance, evaluated in terms of Gross Value of Production, was found to be higher
than that of the State averages. Analysis of water-use performance showed that water distribution is
not tightly related to crop water demand. Economic performance indicators showed that the scheme
had a serious problem about financial self-sufficiency. Physical performance, evaluated in terms of
irrigation ratio and sustainability of irrigated land, were not commendable. Under environmental
performance it was noted that there were no damages such as water logging and salinity as usually
detected in the irrigated area consequent to excessive water use. Generally, the project has provided
immediate opportunities for employment for the people in the area. The project promised a better
and richer life for the farmers and brought a new enthusiasm and confidence.
36
CHAPTER 7
CHALLENGES OF WATER RESOURCE MANAGEMENT IN KERALA
126. Challenges of water resources management have been discussed considering three perspectives viz.
water conservation management, water use management and water pollution control. Appropriate
water conservation measures, judicious use of water and pollution abetment programmes form the
key activities to address water related issues in Kerala. However, there are a number of challenges in
this context. This chapter intends to discuss these issues and suggest actions to overcome the
problems.
Challenges of Water Conservation in the State of Kerala
Sloping and Undulating Topography
127. Topographic grain of Kerala is longitudinal. The State has been divided into three physiographic
zones based on elevation as low land (0 to 7.5 m), mid land (7.5 to 75 m) and high land (> 75m).
Water scarcity is mainly experienced in the mid lands and high lands. These two units cover 40 %
(15,400 km2) and 48% (18,480km2) of the total geographical area of the State respectively. The
average slope of mid land and high land can be approximated as 6% and 14% respectively. In such
sloping terrains, natural water conservation alone is not sufficient to meet the various water needs.
Had this area been fully covered by deep rooted trees, natural conservation would have been
sufficient. Therefore, artificial percolation augmenting measures are required to improve the
groundwater storage.
128. When rain falls on a sloping ground, part of this get absorbed by the soil (infiltration) and the
balance will flow on the earth surface as surface runoff. Surface runoff quickly reaches the small
streams, then main river and eventually discharges into the sea. The major portion of the infiltrated
water (absorbed by soil surface) will also be lost from the top soil layer through the process of lateral
flow. The hydrologic component required for groundwater recharge is percolation and this
percolation component will be very less in places of considerable sloping land. Here comes the
importance of artificial recharge measures.
High Horizontal Hydraulic Conductivity and Less Vertical Conductivity
129. In Kerala, most parts of the uplands are characterised by layered shallow soils due to prevalence of
lateritisation processes. In layered soils, vertical hydraulic conductivity will be considerably lower
than horizontal conductivity. Therefore, most of the infiltrated water takes lateral course to form
lateral flow. Consequently, the deep percolation component contributing to groundwater storage
decreases.
Construction of Buildings, Land Filling, and Conversion of Water Bodies
130. The area occupied by a building is lost from absorbing rain water and will result in decreased
groundwater recharge. Building roofs and other pavements will cause concentrated runoff to flow on
the ground and this will further aggravate the phenomenon of decrease in groundwater recharge.
Land filling on paddy fields and other low lying areas will result in lost opportunity for water to get
ponded up and assist in groundwater recharge. In Kerala, even in rural areas, a considerable portion
of the land area has been covered by buildings. Building construction should be accompanied by

37
appropriate measures for groundwater recharge. Land filling has to be discouraged and banned to
the extent possible to protect the landscape ecology.
Sand Mining and the Resultant Deep River and Stream Channels
131. Sand mining in streams and rivers in Kerala continued unabated since 1970s and till the beginning of
2010. This social evil could not be checked in time, probably not realising its adverse hydrological
consequences by the administration, and has led to irrecoverable damage to rivers and streams.
Recently, controls to sand mining has been brought in, but, it was too late. Because, many rivers
have already lost all sand deposits and thereby fluvial functions are jeopardised. When the river
bottom is considerably lower than of the adjoining land area, it will lead to faster groundwater
depletion. Raising the river bed to their earlier position of, say, 40 years back is not a viable
proposition. However, it is possible to raise the river beds slowly by constructing a series of height-
extendable check dams in the river channels. This will restore river ecology.
High Population Density, Urbanisation, and Small Land Holdings
132. High population density has led to de-vegetation (removal of natural vegetation) for construction of
buildings, roads, courtyards and other built ups for habitation and commercial purposes. A small
land holding will generally be occupied with proportionately more unfriendly measures from the
point of view of water conservation. In a small holding, the proportion of unfriendly measures will
be many times higher than of large holdings.
Construction of Roads across Paddy Fields and Other Low Lying Areas
133. It has become a very common practice in Kerala to construct roads across paddy fields as land
acquisition is relatively easy when the alignment is taken through paddy fields. Roads will block the
natural flow of water. In some cases, culverts are provided, but not adequate. It should be noted that
roads constructed across the paddy fields will disturb the hydrology of that area and has seen causing
water logging on the upstream side and water deficit on the downstream side.
Lack of Awareness on Water Conservation and Judicious Water Use
134. Though the state is ahead in basic literacy, the general public is not so proficient in water literacy.
Basic awareness about water conservation has to be created during childhood by introducing water
conservation and water use management at school level. As water conservation has to be practiced in
a spatially distributed manner, the willful participation of people in this regard is a must. Similarly,
water is used by every individual. It is therefore necessary to apprise everyone about the preciousness
of the water resources and the necessity of avoiding its wasteful use. Same is the case with water
pollution.
Devegetation/Deforestation
135. Any kind of vegetation, especially deep rooted, will help improve groundwater recharge. All
measures of deforestation and devegetation have to be discouraged by law and awareness creation.
All effort s have to be taken to vegetate and afforest vacant lands.

38
Lack of Ethics and Social Values
136. Government servants and general public have often seen forgoing all values and ethics for short
term financial gains. Indiscriminate land filling, sand mining, quarrying, filling of drainage channels
etc can be cited as typical examples in this context.
Presence of Subsurface Impervious Granite Layer
137. Below the water table aquifer or weathered rock, impervious granite rock is present in most part of
Kerala. This prevents the flow of water to deep aquifer and reduces the potential of deep
groundwater.
Rolling Topography and High Drainage Density
138. In a rolling topography with high rainfall and low percolation, drainage density will be more. Same is
the case with Kerala. Because of high drainage density, water received on the earth surface will be
lost quickly to river systems and eventually be lost to sea. High drainage density also makes the
groundwater discharge faster and depletion of groundwater resources.
Water Logging and Flooding
139. Proper drainage channels are a basic necessity for Kerala as quantum of water coming down through
two monsoons are considerable. During rainy days rain water gets accumulated in lower areas and
drainage channels need to function in these cases. It has been found that no adequate open place
available for rain water to get ponded up as that of paddy fields. Unscientific filling of paddy fields
has caused islands of low lying areas. All these human activities have led to untold miseries of water
logging.
Challenges of Water Use Management
Over Use/Wastage in Domestic Sector
140. Kerala is water rich. Therefore, people, in general, has a tendency to use water without much
restriction. This is reflected in normal domestic work and individual water use habit.
Wastage of Water in Household Irrigation
141. Over irrigation is a common practice among the people of Kerala, whatever be the crop. Surplus
irrigation not only lead to loss of water but result in creating undesirable growth environment for
plants and loss of precious nutrients.
Wastage of Irrigation Water at the Canals and Distributaries of Irrigation Projects
142. Performance of most major, medium and minor irrigation projects is not up to the desirable level.
Good majority of the canals do not have proper bed slope nor hydraulic slope due to faulty
execution of the work. Hence, carrying capacity of canals are very low, in some cases, no water flows
in forward direction. Same is the case with minor distributary channels. The root causes of the poor
performance of the canals have to be investigated for effecting corrective measures.

39
Wastage of Water at Farmers Field of Irrigation Projects
143. Similar to the wastage of water in canals and distributaries, lot of water get wasted at farmers’ field
due to absence /improper construction of field channels. In addition, farmers will also play their roll
in wasting water by over irrigation at the expense of neighbour's entitled water. Proper field channels
should be constructed and rotational water distribution system may be introduced. Also, at farmers’
fields, pipe distribution network can be introduced to minimise the wastages.
Wastage of Irrigation Water at Farmer Owned Irrigation Project
144. There are millions of small irrigation facilities created by individual farmers drawing water from open
wells, ponds etc. Indiscriminate pumping from these wells has led to faster depletion of groundwater
and aggravated domestic and all other water scarcity.
Inadequate Adoption of Water Efficient Irrigation Methods
145. The adoption level of Water Application Efficient Irrigation System (WAEIS) has not yet taken
place in Kerala in any significant way.
Challenges of Water Pollution
Pollution of Streams and Rivers
146. It is a major issue due to point source pollution of wastages of municipalities, corporations,
individual enterprises, industries, and households. When river flow is less, the proportion of waste
water will be very high and the resultant pollution level. In addition, there are also non point source
pollution from agricultural fields due to use of pesticides and fertilizers. Open common lands in
urban and rural areas also contribute.
Improper Domestic Sanitary Engineering
147. Pollution of groundwater water bodies by unscientifically constructed septic tanks and other sewage
disposal system is of great concern, but, often the issue gets side-lined. For many households and
commercial establishments, septic tanks and other waste disposal systems are made without adhering
to any sanitary engineering principle causing groundwater pollution, mosquito breeding etc. It is high
time to review the engineering design and performance of all sanitary engineering works of all
households and commercial establishments.
Action Plans to Solve Water Conservation, Water Use and Water Quality Related Issues
Watershed Based Water Resources Management
148. Watershed should form the basic matrix for all water resources management issues. Each river basin
can be considered as an independent hydrologic unit. Catchment scale/ river basin scale approach is
required to understand all aspects of water conservation, use and quality problems and to plan
remedies. Subsequently, detailed planning can be made at sub watershed scale and micro watershed
scale. The whole to part approach be adhered to in this case too. The present IWMP / IWDP
department may be restructured to incorporate more Agricultural Engineers, Hydrologists,

40
Environmental Engineers, Earth scientists and also Social scientists. Use of geospatial technologies
should be an important component of this initiative.
Action Plan / Interventions to Augment Water Conservation
149. Issues related to water conservation have been described in earlier sections. The action plans
required to mitigate the issues of water conservation have been described here.
Water Conservation for Land Areas
150. Roof water harvesting and recharge into percolation pits or wells. Kerala has enormous rooftop rainwater
potential, roughly to the tune of 2.5 lakh litres per 100 m2 of roof. In places where there is severe
water scarcity, a portion of this can be stored (10000 - 20000) and the balance will be allowed to
recharge the groundwater through percolation pits or by open wells directly after necessary
purification. Appropriate purification system needs to be developed as the present sand and gravel
media filter is very prone to clogging and its washing is a difficult task.
151. Conservation of water in individual plots. Each land owner should be asked to conserve all the rain falling
in that plot. The present practice of letting water to flow out onto roads and neighbouring plots
should be curtailed.
152. Percolation pits. Surface runoff generated from land areas should be allowed to flow into percolation
pits of about 1.5 to 2 m deep and be allowed to recharge groundwater.
153. Basin for perennial crops. Perennial crops in slopes be provided with basins suitable to check surface
runoff and through fall.
154. Contour bunds / graded bunds / stone pitched buds. In places up to 10% land slope, bunds may be
practiced as measures of soil moisture conservation and groundwater recharge.
155. Contour trenches / terraces. For land with slopes more than 10% contour bunding and terracing may be
adopted.
Water Harvesting for Drainage Channels
156. Gully plugging / loose bolder check dams for small streams. All small streams (1st and 2nd order) originating
from uplands should be provided with a series of gully plugging measures. These measure can
contribute a lot towards groundwater recharge.
157. Masonry / concrete check dams. Streams of third order and above can be provided with masonry or
concrete check dams
158. Earthen dams. Small to major streams can be provided with earth dams. Cost of construction of earth
dams will be relatively less and will be more environment friendly.
159. Artificial pond near all major rivers. A huge artificial pond shall be constructed near all major rivers of
the state in the midland portion and the flood waters may be diverted to this pond during rainy
season. A suitable check dam may also be constructed across the river for diverting the water
through canals to the pond. This will help to reduce the sudden/swift flow of surface water flow to
41
the sea during rainy season. This water can be used effectively after the rains. The bottom and sides
of the tanks may be sealed with eco-friendly materials.
160. Identification and use of paleo channels. Paleo channels could be ideal structures for water storage.
Identification of paleo channels in the midlands and lowlands may be taken up using satellite imagery
and they can be developed to store water. This will also help maintain base flow of rivers as there
features are connected with the main rivers through sub-surface horizons.
161. VCB. Streams originating from paddy fields can be provided with VCBs for providing controlled
drainage and water conservation. During monsoon season, all water from paddy fields should not be
drained out, but, only the surplus water. This will reduce water scarcity during summer months.
Measures to Improve Irrigation Water Use Efficiency
162. Hydraulic inefficiencies and structural defects of canal networks of all irrigation schemes may be
reviewed and the problems be identified for corrective measures. Canal capacity may be worked out
based on water requirement of crops. Other professionals may be inducted to irrigation department
and measures may be taken for better coordination between irrigation and agriculture departments.
163. Minor irrigation (MI) schemes sourcing river water have lot of potential in increasing irrigated
agriculture area. Their investment per unit area irrigated will also be considerably lower. However,
MI schemes are grossly dysfunctional due to several technical short comings. In this department too
Agricultural Engineers and Agricultural Science professionals be posted to improve its functioning.
Instead of open canals, provision of using underground pipeline irrigation may be explored for MI
projects to reduce loss of irrigation water. Adoption of micro irrigation schemes may be popularised.
Measures to Control Water Quality
164. In no case, sewage water be allowed go free to river water whether it is the collective waste of
municipality or waste of individual establishments like hospital, hotel etc. Sewage should be treated
and the purified water alone be allowed to join with the streams or rivers. Suitable regulation in this
regard may be framed out and be enforced. Proper design for septic tank and other sanitary work
may be developed and implemented. In the case of existing defective ones, corrective measures may
be incorporated.

42
CHAPTER 8
CHALLENGES FOR WATER GOVERNANCE
165. It is now globally recognised that problem of water is more of a governance than resource
availability. During the past decade, water governance has globally experienced a major shift, from
technology-oriented, centralised approaches towards multi-level, decentralized and user-centred
approaches. In both developing and developed countries, inclusion of different levels of governance,
decentralisation, public participation, promotion of Integrated Water Resource Management
(IWRM) and the emergence of the river basin as an important scale of planning and intervention are
significant trends of changing governance (Moss and Newig, 2010; Tropp, 2007). India also has
witnessed several paradigmatic shifts in management and governance of water resources. Structural
changes are currently underway in India on how water is governed and managed in order to deal
more effectively with challenges of increasing water stress. Causal factors include growing demand,
mismanagement of water resources, water pollution and issues of inter-state /intra-state rivers.
Global transitions in water governance, including promotion of Integrated Water Resources
Management (IWRM), river basin approaches and inclusion of participation are also reflected in the
India government's policy (UNICEF, 2013). In general terms, there is a clear policy shift from a
supply-driven to a demand-driven approach, characterised by decentralisation and user participation.
The country's comprehensive National Water Policy (NWP) addresses water as a state subject which
is a finite and vulnerable resource and focuses on the importance of a river basin governance
approach involving various stakeholders.
National Water Policy
166. The concept and history of watershed management in India started way back in 1880 with the
Famine Commission and then with the Royal Commission of Agriculture in 1928 (Joshi et.al, 2004).
After 1960s there were several policies and programmes initiated by different ministries including
Ministry of Water Resources, Ministry of Agriculture, Ministry of Rural Development (MoRD), and
Ministry of Environment and Forest (MoEF) at watershed levels. By 1980’s it is realised that water is
a precious national asset and planning and governing of water resources need to be steered by
national perspectives. Moreover, the severe drought of mid 1980’s forced the Government of India
to frame newer policies and to restructure the existing programmes. Thus the First National Water
Policy (NWP) was adopted in 1987. Over the years Indian Water Policy has evolved to take
cognizance of climatic vagaries and emergence of increasing demand for water as a consequence of
development and economic growth. The national water policy has been later revised in 2002 and
again in 2012.
167. The 1987 NWP was a significant milestone in watershed development programmes as it clearly
stated “resource planning in the case of water has to be done for a hydrological unit such as a
drainage basin as a whole, or for a sub-basin”. The policy assigned the responsibility for the design
of watershed projects to the state governments. It also emphasised that appropriate organisations
should be established for the development and management of a river basin as a whole and that
there should be an integrated and multi-disciplinary approach to the planning and implementation of
watershed projects, which should include, among others, the creation of master plans for flood
control, construction of check dams, soil conservation, and forest preservation and expansion (GoI,
1987). The policy identifies water allocation priorities as drinking water, irrigation, hydro-power,
navigation and industrial and other uses.

43
168. The revision of the NWP in 2002 further strengthened river basins and sub-basins as units of natural
resource management, proposing the creation of river basin organisations (GoI 2002). The
document added “With a view to give effect to the planning, development and management of the
water resources on a hydrological unit basis, along with a multi-sectoral, multi-disciplinary and
participatory approach as well as integrating quality, quantity and the environmental aspects, the
existing institutions at various levels under the water resources sector will have to be appropriately
reoriented/ reorganised and even created, wherever necessary (ibid.). The 2002 water policy adopted
slight changes in water allocation priorities as; drinking water, irrigation, hydro-power, ecology, agro-
industries and non-agricultural industries and navigation and other uses.
169. In 2012, the Ministry of Water Resources issued a revised NWP. The new policy, among others,
raises concerns regarding the effects of land use and land cover changes on water availability and
quality. The policy also stated the need for comprehensive legislation for optimum development of
inter-State rivers and river valleys to facilitate the inter-State coordination ensuring scientific
planning of land and water resources taking basin/sub-basin as unit with unified perspectives of
water in all its forms (including precipitation, soil moisture, ground and surface water) and ensuring
holistic and balanced development of both the catchment and the command areas (GoI 2012). The
NWP 2012 also envisaged:
1. Setting up Water Regulatory Authority to fix water tariffs with provision of differential pricing
for the pre-emptive and high priority uses of water
2. Institutionalisation and strengthening of community based water Management practices
3. Vesting statutory powers to Water Users Associations to collect and retain a portion of water
charges, manage the volumetric quantum of water allotted to them and maintain the
distribution system in their jurisdiction
170. Though all these policies stressed for integrated approaches at whole river basin level, it could not
make any significant changes at ground level, in specific there were no integrated plans executed for
the whole river basin in anywhere in the country.
State Water Policy
171. The present policy for Kerala’s development comprises decentralised administration and resource
based participatory planning combining productive and environmental objectives. Due to good
amount of rainfall and surplus water resources, water resource management and governance was not
given adequate attention in the State, so far. Since 1990’s Kerala began to pay more attention on
water governance and watershed based natural resource management, which was, to an extent,
influenced by national level policies and developments. Water resources development being a state-
governed subject, all the states in India is required to formulate their own state water policies within
the ambit of the NWP and subsequently set up a blueprint for water resources development.
172. The Government of Kerala has adopted a comprehensive State Water Policy (SWP) in 1992, in line
with the National Water Policy, 1987, the first of its kind by any state in the country. The 1992 SWP
advocated a river basin/watershed-based planning for integrated development of land and water
resources of various regions, pointed to an acute drinking water scarcity experienced for about half
the year in various parts of the state and emphasised the need to conserve as much rainwater as
possible (GoI, 2008). By 2008, Government of Kerala has revised the water policy. The 2008 SWP
addressed water as a common heritage having economic value and the responsibility for its regulated
use and conservations vested with every citizen and community. It presents progressive goals to
have a State Level River Authority, under which there shall be River basin and Sub basin

44
organisations. It also emphasised on considering the micro watershed as a basic unit and river basin
as an integrated unit of micro watersheds to facilitate resource-based approach, user participation
and equitable water resource management (GoK, 2008). The 2008 SWP is relevant as it has further
consolidated the role of Grama panchayats in water resource management.
Surface Water Governance
173. Surface water bodies consist of flowing and non-flowing water bodies. There are several stake
holders enjoying rights to use and manage these resources. In the case of flowing water in a river,
stream or irrigation project canal there are various stakeholders whose needs are diverse and
sometimes conflicting. At least there are five institutions, apart from Irrigation department, that use
reservoir water (Table 8.1).
Table 8.1 Use of Reservoirs Sl.No User of Reservoir water Remarks
1 KWA Use water throughout the year with condition to maintain a
particular water level in the reservoir
2 KSEB Insist on highest water level to get maximum head for
production of electricity
3 Fisheries Dept For fish cultivation in the reservoir. Insist on a minimum
water level in the reservoir
4 Tourism Using space and water in the reservoir, tourism facilities
are made. They need a specified quantity of water for maintaining the garden and greenery
5 Disaster Management In times of drought, water has to be let out through the
canal system to recharge the ground water in the ayacut.
174. Traditionally, Irrigation Department, KWA and KSEB were the main users of reservoir water.
Fisheries department, Tourism department and Disaster management department started using
reservoirs in recent year. Under these circumstances of multi stake holders it is often not possible for
the irrigation department to arrive at an equitable and judicious allocation of resources. Traditionally,
the irrigation department is geared to the technical aspects of water storage and distribution for
irrigation. With increasing demand for drinking water and expansion of urbanisation all most all the
reservoirs have made the provision for drinking water supply. Environmental flow and also flow of
water for dispensation of wastes in the rivers are additional requirements. There is thus a need to
induct true management capabilities into the system and evolve an appropriate governance system.
175. This can be attempted through proper restructuring the water management sector and empowering
the concerned departments in conflict resolution and management and by bestowing legal powers on
them. Further, for implementing these legal powers, they need to be empowered with appropriate
resources also. In this connection it can further be stated that for an effective governance of water
resources, the users must feel that their legitimate and timely needs are being met by the water
managers. However, for the managers to ensure that timely and equitable supply is provided for all
legitimate users, the conveyance system is kept always in an efficient condition. Therefore there is a
need for skill up-gradation of the human resources and also infrastructure development.
Involvement of LSGD is a necessary requirement given the decentralised nature of the problem.
Role of Water User’s Association in Water Governance
176. In the year 1987, Government of India/Ministry of Water Resources have issued guidelines for
involving farmers in Water Management of Irrigation System. In National Water Policy also stress is

45
laid on creating WUA for involving farmers in Water Management. But this system is yet to be
implemented in our State. This should be given high priority. It is a common experience that Water
User’s Association can handle irrigation water management at reduced cost than any other agency,
since they are getting firsthand knowledge of any reduction in conveyance capacity or damage to
structures which can be remedied quickly. Unauthorized or abuse of water can be arrested as now
water belongs to the association than government. Wastage of water can also be minimized thereby
improving water distribution
Ground Water Governance
177. While surface water sector is bestowed with appropriate legal frame work for adjudication, ground
water which cater to significant share of irrigation and domestic water requirement, remain
untouched as it enjoyed the privilege of appendage with land ownership as per Indian easement act
1882.The necessity for regulation of ground water withdrawal was felt only in 1970s when due to
green revolution and industrialization rapid ground water exploitation has started depleting the
aquifer. The Union Government have circulated a Model Bill in 1970 to all States and Union
Territories to enable them to (a) enact suitable legislation for regulation and control of ground water
development and (b) to constitute State Ground Water Authority for discharging various functions
under the legislation. No concrete action was initiated by almost all states. Thereafter, the issue
remained more or less dormant for 20 years after which the Central Government revived the bill in
tune with its National water Policy (1987) and made some revisions. The revised bill was circulated
by the Ministry of Water Resources to States for adoption with modification in the year 1992 and
again in 1996.
178. In view of problems of over exploitation of ground water and Supreme Court’s direction Central
Ground Water Board has been constituted as an Authority under Section 3(3) of the Environment
(Protection) Act, 1986 on 14th January, 1997 for the purpose of regulation and control of Ground
Water Management and Development. In 2005, Ministry of Water Resources, Government of India
circulated revised Model Bill, 2005 to "Regulate and Control the Development and Management of
Ground Water" and mandated CGWB to act.
179. At present the rules existing in the water sector are: Constitutional entries in the Union/State lists,
Inter State Water Dispute Act, State Water Acts, WUA Acts, Easement Act, etc. To set the rules and
to enact there are the institutions like Government, Parliament/ Assembly and Court at the Central
and State level. Besides there are institutions operating exclusively in the water sector like the Water
Disputes Tribunals, Water User Associations (WUA), and Water Resource Regulators in some of the
States.
Challenges in Ground Water Regulation in Kerala
180. State Ground Water Department is functioning in Kerala since late 1970. The Kerala state legislative
assembly had passed the Kerala state ground water (control and regulation) act 2002 for the
regulation and control of extraction of ground water in the state. As per the rules framed, Kerala
groundwater Authority has been formulated as per SRO.No.59/2003/WRD dated 16/01/2004.
181. Functioning of the State Ground Water Authority is beset with a number of problems. All mandates
of CGWB are not internalised in the state rules. There are loop holes in permitting water pumping
limits, thereby defeating the purpose of legislation. The stake holders are not properly apprised about
the need of regulation. There is problem of registration fee structures for the private rig operators.

46
Lack of man power and institutional gap affects implementation of rules and regulations. Due to
appendage with Indian Easement Act 1882, ground water is still a private property and withdrawal
cannot be totally prohibited. However it can be reduced to reasonable level. Owing to the vast
number of abstraction structure spread over a vast terrain, control and regulation is a difficult task.
Hence as envisaged in the National Water frame work Bill2016 and Model Water Conservation Bill
2016, the institutional level of enforcement should be broadened and Local Self Government should
have significant role in water governance. Other acts which has to be reviewed for improving
efficiency are: 1)The Kerala Irrigation and Water Conservation Act, 2003 (As amended in 2006),
2)Kerala municipality building rules1999as amended 2004 regarding mandatory provision for water
conservation structure while constructing house and 3) Kerala River Basin Authority.
182. In the present scenario of ground water over exploitation and deterioration of ground water quality,
the provisions of the act are not sufficient for the proper regulation and control of groundwater
extraction. Hence certain amendments are required in the act. A proposal for the amendment of the
act has been forwarded to government in 2010 and awaiting approval.
River Basin Governance
183. Watershed programmes were in operation in Kerala since the early 1970s. Government of Kerala
took an important policy decision on advise of State Planning Board during the Ninth Plan (1997-
2002) period that the development plans of the Local Self Government (LSGD) institutions should
be on watershed basis (GoK, 2010). As part of this decision, there was a state wide campaign of
preparing Watershed based Development Master Plan at the Block Panchayat Level, as a tool for
institutionalizing decentralized planning based on geohydrological unit. Various committees were
constituted at different levels, and the initial works on the preparation of watershed based master
plans were also undertaken. Agricultural scientists have divided Kerala’s 44 river basin into 151 sub-
watersheds (10,000 to 50,000 ha) and 960 milli watersheds of 1,000 to 10,000 hectares. Below this
there are several thousand micro watersheds with areas of 100 to 1,000 hectares (Kerala State
Landuse Borad, 1998, Chattopadhyay & Franke, 2006). Micro watersheds of approximately 500 ha
size were delineated and resource inventories had also been prepared at the Block level (GoK,
2010a). On the basis of the decision of the Government of Kerala to continue the watershed based
approach during the Tenth Plan period (2002-2007) also, directions were issued to take up further
activities for the preparation of the watershed master plans and in the case of agriculture and allied
sectors it was made compulsory that the development plans should be watershed based (GoK,
2010b). Since then, there were several initiatives taken place to increase the relevance of watershed
approach in planning process and to adopt river basin and micro-watershed as a planning unit at
state level.
184. The Pamba Development Authority was constituted to address problems of the Pamba river,
however, it has not really taken off. Some fragmented work is being attempted in case of the
Karamana river. However, here also a comprehensive management plan is yet to be developed with
proper institutional set up.
Local Self Governments and River Basin Governance
185. Decentralized planning that followed the 73rd and 74th constitutional amendments and enabling
enactments in the State in 1994 started off as the People’s Plan Campaign and progressed with
institutionalization at different levels, in Kerala. Establishment of panchyati raj became a
constitutional obligation and at the same time a step towards local area planning, use of local

47
resources, and decision making at the level of actual resource users. This opened a significant
opportunity both for the people and planners to act together at village level. The Kerala People’s
Campaign for Democratic Decentralisation constitutes a remarkable radical experiment in
democracy. Initially called the People’s Campaign for the ninth five year plan (1997-2002) it
substantially decentralised the functions of the government bureaucracy and also decentralised the
planning process (Chattopadhyay & Franke, 2006). Through the People’s Campaign, Kerala
developed the potential to become the first state of India to have an overall, integrated set of
watershed master plans (Isaac & Franke, 2002).
186. Experience of decentralization in Kerala showed that it is easier to sensitize Local Governments to
the subtle links that exist between natural resources within a natural boundary called watershed
(GoK, 2010b). Before 1990’s most of the watershed projects and programmes were implemented by
the Soil Survey Department. After 1990’s decentralisation and peoples’ participation has aggregated
the role of panchayats in watershed projects and programmes in Kerala. All the national level
guidelines (GoI, 2002, Hariyali, 2003, Neeranchal, 2006 and revised guidelines in 2008) and water
policies (NWP 2002 and 2013) which emphasised on the role of panchayats and inclusion of public
participation in water resource management were clearly fitted with Kerala context. Apart from these
the state water policies also emphasised the necessity of people’s participation in water sector within
the framework of decentralised democratic institutions which ensured the role of panchayats.
Local Level/Micro Level Initiatives
187. The first successful and complete watershed master plan was prepared by Perambra Block Panchayat
in Calicut District, Kerala in association with Kerala Sasthra Sahitya Parishad (KSSP), a People’s
Science Movement led by local volunteers. According to Chattopadhyay & Franke, (2006), the
preparation of watershed plan followed through various steps including preparation of maps for
micro watersheds, training of local persons from each micro watershed, forming Watershed
Committees at village level, holding a Watershed Mahasabha (major assembly) in each micro
watershed, and finalisation of watershed master plans. In 2004, a model watershed master plan for
Thirurangadi Block Panchayat in Malappuram District of Kerala has been prepared by the Centre for
Earth Science Studies.
188. A micro watershed atlas of Thiruvananthapuram district released by the Agriculture and Soil Survey
Department in 2006, has identified a total of 423 micro watersheds, a physiographic area with a
common drainage outlet in the district. The Kalliassery Block panchayat in Kannur district has
prepared a master plan to address acute drinking water shortage. The master plan proposed projects
for the protection of 33 watershed systems in the block panchayat. Government of Kerala in the
Eleventh Plan (2007-2012) proposed that the Local Self Government Department institutions
should follow river basin approach. Several similar initiatives have accelerated the significance of
water governance and river basin governance in Kerala. Panchayat level Water Policy by Perumanna
Grama Panchayat, 2015 and Kochi Municipal Corporation Water Policy and Water Auditing, 2015
are some of the local level initiatives from which lessons can be learnt.
Ongoing Programmes
189. Attempts by Local Governments to integrate natural resource management with micro watersheds
began in Kerala during the Ninth Plan with the initiative for Block level Watershed Master Plan
preparation (Environmental Assessment Report, 2010). Apart from the Government of Kerala
initiatives, few centrally sponsored (Government of India) watershed development programmes also

48
implemented by the State include the Integrated Watershed Development Project (IWDP),
Command Area Development Programmes, Hariyali, Western Ghats Development Programme
(WGDP), and National Watershed Development Programme for Rain fed Areas (NWDPRA). The
Mahatma Gandhi National Rural Employment Guarantee Act (MNREGA) scheme gives top
priority for watershed development. It is important to note that Kerala adopts micro watersheds as
the implementation unit for all these projects, which are mostly implemented under the
responsibility of panchayats. However, the achievements under these programmes are variable.
Integrated Watershed Management Programme
190. The Integrated Watershed Management Programmes calls for multi-level administrative set up to
achieve a river basin based development with scientific priorities. Grama Panchayats are entrusted
with preparing watershed master plans by involving people. These master plans are expected to be
integrated at the District level and also at the State level (GoK, 2010b). In 2012, Panchayat
Development Commissionarate, Kerala issued a circular to set up watershed committees in all the
watersheds under Integrated Watershed Management Project (IWMP). The circular emphasised on
creating these watershed committees at panchyat level and to work in consonance with the Grama
Sabhas. If the watershed spreads over more than one panchayat then there shall be an integrated
committee responsible for the whole watershed as well as sub committees for the segments in each
panchayat. The Panchyat President will be responsible as head of the watershed committee.
191. Formation of watershed level committees was originally envisaged in the report of the Hanumantha
Rao Committee (1994) which was set up by Government of India to assess the programmes of
Draught Prone Area Development Programme (DPAP), and Desert Development Programme
(DDP), and suggest improvements. The committee recommended and formulated a single guideline
for watershed based development covering DPAP, DDP and IWDP (Integrated Wasteland
Development Programme). Governmnet of India’s acceptance of this report and gearing up to
implement the recommendations through Rural Development Department triggered a major shift in
watershed management programme from structural techno-centric mode to participatory ecosystem
oriented programme (Nair and Chattopadhyay, 2001). Setting up of watershed level committee was
contested by the States where Panchayats were democratically well entrenched, however, the idea
was well appreciated by those States, where people showed little faith on Panchayats. Nevertheless
Government of India directives emphasised formulation of watershed level committees at different
hierarchic levels. The Kerala initiatives can be construed as a step to integrate watershed committees
with panchayat, where a separate watershed management unit (watershed committee) will be in place
with more power but will be mentored by the Grama panchayat.
Kerala Rural Water Supply and Environmental Sanitation Agency (Jalanidhi)
192. This World Bank aided Kerala Rural Water Supply and Sanitation project aims at improving the
quality of rural water supply and environmental sanitation services in the State. Government of
Kerala launched rural water reforms as per Government of India guidelines by carrying out the
World Bank-financed Jalanidhi-I project between 2000 and 2008. Jalanidhi-I covered 112 (11
percent) of the state’s Gram Panchayats spanned across 13 districts and implemented 3705 water
supply schemes (mostly groundwater based) and 16 large surface water based schemes (Government
of Kerala, 2011). The project followed a demand responsive approach encompassing beneficiary
participation, capital cost contributions from beneficiaries and the Panchayats, universal household
connection provision, full operation and maintenance cost recovery from user fees, and an integrated
strategy in water, sanitation, environment and health sectors. On competition of Jalanidhi -I,

49
Government of Kerala has decided to implement Jalanidhi-2, with World Bank support and
contribution from Local Self Governments and the beneficiaries in 2012.
193. The main components of Jalanidhi-2 includes community based water supply schemes, rehabilitation
of single GP KWA schemes, sanitation, ground water recharge, rain water harvesting and special
emphasis on water supply to quality affected habitations. Jalandihi-2 project has three main
components including institution building, technical assistance to implementing agencies and
infrastructure development. The first component will (i) support capacity building of sector
institutions and support organizations, (ii) assist Government of Kerala (GOK) in implementing a
state-wide sector development programme, and (iii) support project management costs. The second
component will provide technical assistance to implementing agencies such that the infrastructure
investments under component three are properly implemented and the resultant services efficiently
provided. The third component of the project will fund the implementation of infrastructure
investments for: (i) new and rehabilitated intra- Gram Panchayat rural water supply schemes; (ii)
pilot rehabilitation and modernization of multi-Gram Panchayat water supply schemes and transfer
of internal distribution to Panchayats; and (iii) sanitation schemes, mainly covering community-
centric solid and liquid waste management and household sanitation solutions in difficult terrain.
The rural water supply schemes are now gradually separated from the urban water supply schemes,
which are administered through KWA. While it promotes decentralization and increases efficiency,
the questions of source sustainability and long term viability remain.
New Governance Structure
194. As elucidated in the foregoing discussion there are various departments including forest and revenue
departments and agencies involved in water resources management in the State sometimes with
overlapping and conflicting interests. An Important limitation of the governance mechanism is the
inability to coordinate across departments and along scales. Adoption of river basin/ watershed
based approach is an important first step to reduce such coordination of actors and integration of
their actions. But, the problem of departmentalism does not disappear so first. It requires more
concerted effort. Water management is also an area that witnessed introduction of new
organizational experiments such as Water Authority and Jalanidhi, which were essentially special
purpose vehicles, started with a view to achieve higher levels of efficiency vis-à-vis government
departments. But, they do not appear to have served the purpose. They have not been able to
improve governance in any notable fashion. But at the same time the SPVs often are often subject to
conventional public scrutiny and social auditing. Another important dimension of water governance
in the state is that of property rights. Who holds property rights over land and water resources is
crucial to sustainable management. For instance encroachment of flood plains is a common threat
faced by almost all rivers in the state. Apart from encroachment there exists genuine private
problems right in many such sensitive areas. Added to this is the absence of collective control over
land use. Kerala is one area in the world where land owners enjoy absolute freedom over choice of
land use pattern. Needless to say individual action does not always contribute to the idea of
sustainable land and water resources management.
195. To communicate clearly about the important aspects of water governance and their
interrelationships a three layer model of governance consisting of Content, Institutional and
Relational aspects has been proposed (Hofstra, 2014). It serves as a checklist (Table 8.2) and can be
used to assess the prevailing condition as has been done for the Water Governance in the
Netherlands (OECD, 2014) to make ‘clear what relevant elements of water governance can be
distinguished and how they are interrelated’ (Hofstra, 2014).
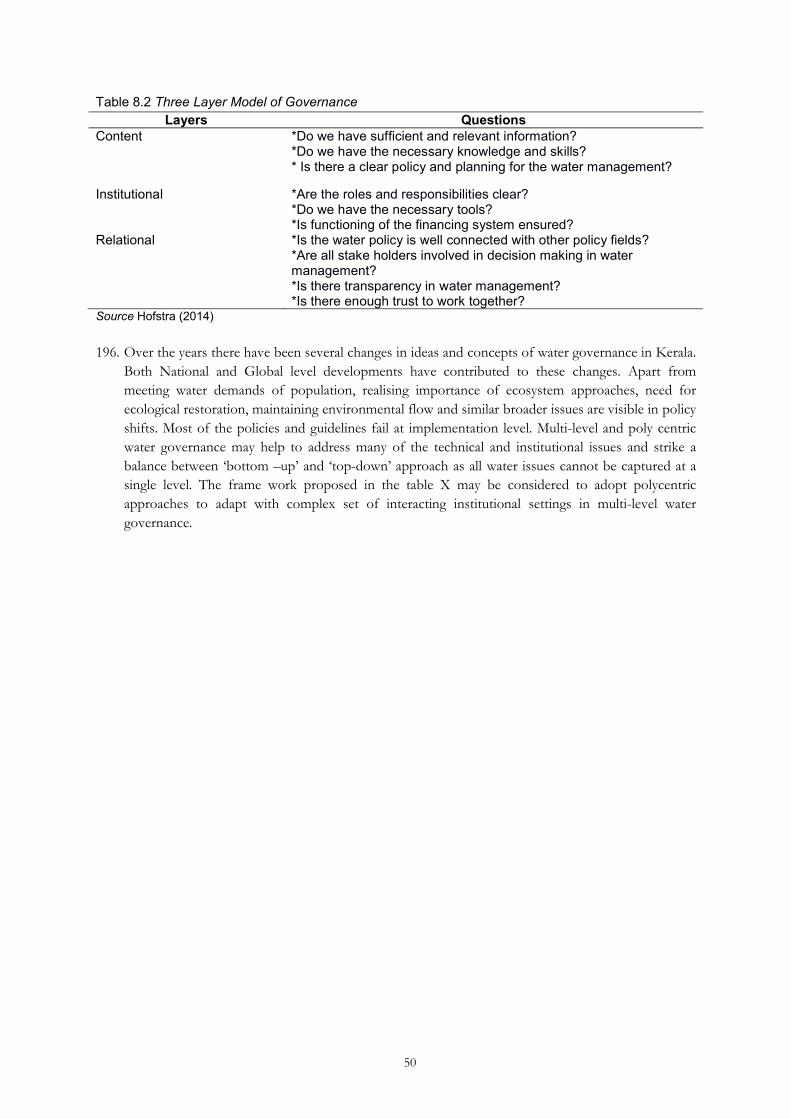
50
Table 8.2 Three Layer Model of Governance
Layers Questions Content *Do we have sufficient and relevant information?
*Do we have the necessary knowledge and skills? * Is there a clear policy and planning for the water management?
Institutional *Are the roles and responsibilities clear? *Do we have the necessary tools? *Is functioning of the financing system ensured?
Relational *Is the water policy is well connected with other policy fields? *Are all stake holders involved in decision making in water management? *Is there transparency in water management? *Is there enough trust to work together?
Source Hofstra (2014)
196. Over the years there have been several changes in ideas and concepts of water governance in Kerala.
Both National and Global level developments have contributed to these changes. Apart from
meeting water demands of population, realising importance of ecosystem approaches, need for
ecological restoration, maintaining environmental flow and similar broader issues are visible in policy
shifts. Most of the policies and guidelines fail at implementation level. Multi-level and poly centric
water governance may help to address many of the technical and institutional issues and strike a
balance between ‘bottom –up’ and ‘top-down’ approach as all water issues cannot be captured at a
single level. The frame work proposed in the table X may be considered to adopt polycentric
approaches to adapt with complex set of interacting institutional settings in multi-level water
governance.

51
CHAPTER 9
STRATEGY AND ACTION PLAN
197. In this chapter, the existing and forecasted issues of water resources development and management
in Kerala are addressed with proper strategies and action plan for achieving water security. The
broad topics discussed are
1. Supply Sector
2. Demand Sector
3. Water Governance and Policy
4. Capacity building
5. Disaster Management viz., droughts, floods, landslides etc.
Supply Sector
198. The prime objectives under supply sector are given as five points from A to E.
A. Suitable and Equitable Water Allocation for all Water Use Sectors and Fulfilment of Basic Water Requirements
199. Strategies for Achieving this
1. Assessment of water resources of the State (updating the 1974 PWD report on water
resources)
2. Prioritization of water use for various sectors, i.e., agriculture, domestic, industry,
conservation of ecosystem etc. and setting up of water-use criteria/proportions for the
various sectors from Panchyath / basin level toState level.
3. Promotion of conjunctive use of surface and groundwater (especially shallow groundwater).
200. Activities/ Action Plan.
1. Preparation of inventory of water resources (both surface water and groundwater) in all the
river basins
2. Updating and strengthening the information on water requirements of various sectors and
forecasting of future needs and trends.
3. Development of water resource potential and management plan for Block Panchayats, setting
up guidelines for water allocation to various sectors.
4. Allocation of water for the various sectors under the framework of river basin management
plan, including ecosystem services.
5. Supplementation of groundwater based irrigation in surface water irrigated areas during the
lean season.
B. Improving the Water Use/ Management Efficiency
201. Strategies for Achieving this
1. Renovation of existing water resources infrastructures.
2. Protection of water recharging ecosystems and natural resources
3. Replication of success stories of supply /water management to other feasible areas
4. Precision water management (covered under section II. B. Irrigation)
202. Activities/Action Plan

52
1. Survey and preparation of plan for rehabilitation of water sources and waterways, including
development and conservation plans.
2. Repair and improvement of distribution systems and control structures in order to reduce
water losses and ensure desired water delivery.
3. Periodic de-silting of reservoirs for increasing the water storage capacity.
4. Renovation of the dilapidated irrigation ponds/tanks (Thalakkulams) at the head portion of
Padasekharams
5. Renovation of VCBs, barrages, check dams, surangams and other water storage/ diversion/
distribution structures.
6. Empowerment of community organizations in taking care (planning, implementation and
monitoring) of common property resources.
7. Prevention of encroachments and protection of riverbanks by eco-friendly measures
8. Protection of water recharging ecosystems like forests, wetlands, paddy fields, mangroves,
sacred groves etc.
9. Prevention of uncontrolled mining of sand, granite, clay, soil etc.
10. Replication of successful models in the State, like that was done in the Film Video Park,
KINFRA at Kazhakuttam, Chadayamangalm Block under Hariyali project etc. to gear up the
water conservation programs in the State.
C. Linkage of master plans of various departments with river basin plan for holistic Integrated Water Resources
Management (IWRM)
203. Strategies for Achieving this
1. Preparation of the integrated river basin management plan for all the 44 river basins in Kerala
204. Activities/ Action Plan
1. Formation of required institutions
2. Integration of the individual plans available in line departments with river basin plans by
ensuring stakeholders’ participation.
D. Creation of New Water Conservation / Storage Structures
205. Strategies for Achieving this
1. Promotion of water conservation
2. Exploration of the possibility for new structures on a priority basis
206. Activities/ Action Plan
1. Taking of rainwater harvesting and recharge pits and percolation tanks in suitable areas on a
watershed basis
2. Implementation of open well recharge treatments in all households
3. Adoption of suitable erosion control measures like contour bunds, terracing etc. for soil and
water conservation
4. Promotion of rooftop rainwater harvesting at household and institutional levels
5. Construction of check dams, barrages, dykes, VCBs etc. in rivers/ streams,wherever it is
feasible
6. Construction of ponds / tanks etc. in ideal locations
7. Development of abandoned quarries as water harvesting and storage structures

53
E. Management of Water Quality Problems for Improving the Water Supply
207. Strategies for Achieving this
1. Improvement and sustenance of water quality
208. Activities/ Action Plan
1. Monitoring of water quality problems with special reference to each basin and preparation of
a protection plan to arrest water pollution
2. Development of cost-effective materials for water purification, especially using
nanotechnology
3. Surveillance and monitoring of water quality through public participation using sensor-based
devices for water quality testing
4. Development of proper sanitation plans and sewage treatment plants
5. Control of non-point source pollution
Demand Sector
209. User sectors are grouped into 5 categories.
1. Domestic including drinking water
2. Irrigation
3. Industry
4. Hydropower
5. Ecosystem services including wildlife needs
210. Each category-wise objectives, strategies and action plans are presented below.
Domestic Including Drinking Water
211. The prime objective is providing 100% safe drinking water to all.
212. Strategies for Achieving this
1. Identification and prioritization of problematic areas
2. Reduction of water losses in distribution
3. Development of water resources for augmenting the distribution of potable water
213. Activities/ Action Plan
1. Preparation of plan and implementation of domestic water supply schemes in problematic
areas on a priority basis. 2. Setting up of more community and village water supply systems by using both surface and
groundwater
3. Setting up of more water treatment plants for ensuring safe drinking water
4. Development of GIS based distribution network along with sensors for improving the
efficiency
Irrigation
214. The prime objective is to increase the gross irrigated area in the State from the current level of 17.9%
of the gross cultivated area to achieve a target of 31% for improving crop production.

54
215. Strategies for Achieving this
1. Preparation of block level and panchayat level irrigation plan by considering all the existing
schemes and possible new schemes
2. Improvement of the water use efficiency for maximizing the water productivity i.e., More
crop per drop of water used
3. Reorientation of irrigation management through decentralization
216. Activities/ Action Plan
1. Preparation of framework for district level strategies for increasing the irrigated area
(Annexure)
2. Assessment of the irrigation water availability and demand based on the cropping pattern of
the panchayat. (Crop water requirements and irrigation recommendation for the crops in
different agro-ecological units of the Kerala State available with CWRDM may be utilized for
assessing the exact requirement).
3. Completion of all major/ medium / minor irrigation structures on a war-footing
4. Promotion of minor irrigation projects/ schemes
5. Creation of new storage structures such as ponds, VCBs, barrages, check dams, etc. in all
feasible areas. Highland areas, existing overexploited and critical areas of groundwater usage,
etc. may be given top priority.
6. Creation of more water diversion structures and development of springs in highland and
midland areas, and more lift irrigation schemes in lowland areas.
7. Irrigation of high value horticultural crops such as pepper, cardamom, vegetables, banana, etc.
to attain maximum productivity
8. Increased involvement of Water User Associations (WUA’s) through Participatory Irrigation
Management (PIM) for enhancing the physical access of each individual plot to water by
which more cultivable area may be brought under assured irrigation
9. Promotion of extension activities relating to water harvesting, water management and crop
alignment for farmers and grass root level field functionaries.
10. Improvement of drainage facilities in farm area
11. Increase of irrigation water availability through watershed approach aiming at soil and water
conservation, recharging the groundwater, minimizing the runoff losses, providing livelihood
options and other natural resource management activities
12. Enhancement of water utilization capacity of irrigation projects, improving the system
performance by repair and maintenance, introducing the piped water supply upto the field on
a pilot basis in selected projects in critically water scares areas. This is essential to bring more
area under actual irrigation in the command.
13. Enhancement of the adoption of advanced micro irrigation and water saving technologies,
precision farming, poly house farming and hydroponics to achieve more crop per drop of
water. Exploration of the possibility of setting up an implementing agency like that of Andhra
Pradesh Micro Irrigation Project (APMIP) and Gujarat Green Revolution Company Limited
(GGRCL).
14. Reduction ofirrigation water demand by proper planning viz., early sowing of variety, uniform
way of planting in group approach, laser land leveling, mulchingetc on a watershed basis.
Industry
217. The prime objective is to meet the industrial demand of 1200 Mm3 by 2022 (an increase of around
18% over the current requirement).

55
218. Strategies for achieving this
1. Defining the rights and responsibilities of the industries on water usage
2. Adoption of the principle of 3 R’s (Reduce, Recycle and Reuse ) in water use
3. Prevention of the pollutant load in the effluents for environmental protection
4. Locational analysis for new industries with respect to water resources
219. Activities/ Action Plan
1. Preparation of guidelines defining water rights and responsibilities of various industrial sectors
2. Appropriate pricing of water for industrial use to improve the efficiency
3. Recycling of used water for industrial purposes
4. Installation of advanced effluent treatment plants (ETP) in all the industries and their periodic
monitoring of the same by Pollution Control Board
5. Evaluation of water availability before starting new industries and concurrent monitoring of
water use, water availability and water quality
Hydropower
220. The prime objective is meeting the energy demand of the State.
221. Strategies for Achieving this
1. Creation of new micro hydel schemes
2. Storage of enough water for generation of power considering the increasing energy demand
under changing climate scenario.
222. Activities/ Action Plan
1. Investigation and construction of new micro hydel schemes in all possible locations
2. Periodical de-silting for enhancement of the storage since siltation is a major problem in the
reservoirs.
3. Improvement in the use efficiency of existing hydropower systems with advanced
technologies
Ecosystem Services
223. The prime objectives are maintenance of ecosystem balance, provisioning of water for wild life,
biodiversity conservation and ensuring sustainability of water resources
224. Strategies for achieving this
1. Protection and conservation of ecosystem services such as forests, wetlands, mangroves etc.
2. Improvement of water availability in wild habitats
3. Sustenance of environmental flow in rivers
4. Limitation of overexploitation of groundwater
225. Activities/ Action Plan
1. Protection / Forestation of various forest ecosystems
2. Identification of water sources within wild habitats and creation of necessary storage
structures within forest areas for meeting the water needs of wild life.
3. Inclusion of more wetlands under the purview of Ramsar sites and implementation of
Management Action Plan (MAP) of wetlands/ Ramsar sites.
4. Promotion of livelihood support system for wetland conservation, including inventorying,
evaluation of the ecosystem services etc.

56
5. Determination of required environmental flow in the rivers of Kerala.
6. Enforcement of legislative measures to check overexploitation of groundwater.
Water Governance
226. The prime objective is to frame/ modify the statutory mechanisms for effective management of
water resources in the State in transition to polycentric water governance.
227. Strategies for achieving this
1. Defining the rights and responsibilities of various water use sectors
2. Involvement of various stakeholders at different levels of governance
228. Activities/ Action Plan
1. Implementation of decentralized water governance spelling out rights and responsibilities of
various stakeholders.
2. Framing / modification of rules/ acts based on the emerging situations, especially with regard
to punishments for water/ environment pollution, water misuse, etc.
3. Creation of awareness about emerging scenarios/ trends in water crisis/management to the
institutions/ agencies, the executives, elected representatives and judiciary.
4. Evaluate viability of three layer governance system
Capacity Building
229. The prime objective is to empower human resource in water management sector.
230. Strategies for achieving this
1. Human resources development for scientific water management
2. Reorganization of institutional mechanisms wherever necessary
3. Establishment of river basin authorities for each of the major river basins in the State
4. Strengthening of Research and Development activities
5. Awareness and skill development
231. Activities/ Action Plan
1. Development of human resources for scientific water management through capacity building
programs
2. Involving women’s group in water management-micro irrigation and drinking water projects
3. Establishment of river basin authorities for each of the major river basins by including all line
departments
4. Inclusion of water related topics at all levels of educational curriculum.
5. Involvement of students for awareness campaign and community action for water
conservation.
6. Organization of public campaigns and community forums at the district and locallevels for a
clear understanding of water resources potential and problems.
7. Promotion of participation of public and private organizations in the water resources
management process.
8. Strengthening the capacity of local organizations and stakeholders to take care of the activities
entrusted to them
9. Development of Water Resource Information System (WRIS) for the State similar to the one
developed for the country by ISRO

57
10. Strengthening the existing R&D institutes related to water in Kerala viz., CWRDM, KERI,
KAU, etc.
Disaster Management
232. The prime objective is to ensure effective preparedness as well as mitigation from water related
disasters
233. Strategies for achieving this
1. To introduce an efficient flood, drought and land slide protection system in the context of
changing climate scenarios
234. Activities/ Action Plan
1. Formulation of flood, drought, landslide protection and rehabilitation master plans,
employing both structural and non-structural measures; real time forecast for disasters by
preparing drought and flood frequency forecasting risk maps
2. Development of a preparatory process for protection and rehabilitation operations prior,
during and after disasters
3. Organization of training programmes to all the stakeholders for protection and rehabilitation.
Conclusions
235. Sustainable management and equitable distribution of fresh water resources is a major challenge in
Kerala having high population density and high standard of living. Water related problems in the
State will be compounded in some regions by water availability and water supply issues linked with
climate change. There are also problems of diverse and often conflicting interests that co-exist in the
management of water resources. Hence, a coordinated mission and action programmes are required
to address this challenge.
236. The strategies and action plans discussed in this chapter will pave a way for developing policy plans
for the coming years, especially during the 13th Five Year Plan period. Implementation of these
strategies and action plans require a holistic approach, significant investment in partnerships /
collaboration of different stakeholders and leveraging the available resources. The coordinated
efforts from Government Departments, Research institutions, NGOs, Environmental activists,
private institutions and all stakeholders in implementing these strategies and action plans will help to
achieve the goal of water security in the State through sustainable water resources management.

58
REFERENCE
Barbaros F., Cetinkaya C P., and Harmancioglu N (2007): Effects of human activities on water quality: A
case study- Mogan and Eymir basin. International Congress on River Basin management. Pp 438-452.
Bhaduri A., Bogardi J., Leentvaar J and Marx S (Eds) (2014): The Global Water System in the
Anthropocene- Challenges for Science and Governance. Springer, Heidelberg.
Centre for Earth Science Studies (1984): Resources Atlas of Kerala . Thiruvananthapuram.
Chattopadhyay, S.(1985): Deforestation in parts of Western Ghat region of Kerala, India. International
Journal of Environmental Management, V. 20, pp. 219-230.
Chattopadhyay, S.,(2002): Emergence of central Kerala coastal plain: A geomorphic analysis. In: Recent
Advances in Geomorphology, Quaternary geology and Environmental Geosciences: Indian Case Studies,
eds. S K Tandon and B Thakur. Manisha Publications, New Delhi, pp. 287 –298.
Chattopadhyay, S (2004): Landforms of Kerala: An overview. In Silver Jubilee Compendium Earth
Science and Natural Resources Management, eds. G R Ravindrakumar and N Subhas. Centre for Earth
Science Studies, Thiruvananthapuram. pp. 211-230
Chattopadhyay, S (2004): Landforms of Kerala: An overview. In Silver Jubilee Compendium Earth
Science and Natural Resources Management, eds. G R Ravindrakumar and N Subhas. Centre for Earth
Science Studies, Thiruvananthapuram. pp. 211-230
Chattopadhyay, S and Mahamaya Chattopadhyay (1995) Terrain Analysis of Kerala: Concept, Method
and Application. Technical Monograph No.1/95.STEC, Govt. of Kerala, Thiruvananthapuram.
Chattopadhyay S., Asa Rani L. and Sangeetha, P. V. (2005): Water quality variations as linked to land use
pattern: A case study in Chalakudy river basin, Kerala. Current Science V. 89, pp. 2163-2169.
Chattopadhyay S and Franke Richard W, (2006): Striving for Sustainability- Environmental Stress and
Democratic Initiatives in Kerala. New Delhi: Concept Publishing Co.
Department of Economic and Statistics (DES) (2005 to 2016). Agricultural Statistics 2004-05 to 2014-15.
Department of Economics and Statistics, Government of Kerala, Trivandrum
Geological Survey of India (2005): Geology and Mineral Resources of Kerala. GSI, Thiruvananthapuram.
GPWS (2005): Global Water System Project: Science Framework and Implementation Activities. Earth
System Science Partnership.www.gwsp.org
Government of Kerala, (1974): Water Resources of Kerala, Public Works Department,
Thiruvananthapuram.
Government of Kerala, (2008): State Water Policy, 2008, Water Resources Department,
Thiruvananthapuram
Government of Kerala (2010a): Environmental Assessment Report, Kerala State, Local Self Government
Department, Thiruvananthapuram
Government of Kerala, (2010b): Integrated Watershed Management Programme, State Perspective and
Strategic Plan (SPSP) Kerala State, Local Self Government Department, Thiruvananthapuram.
Government of Kerala, (2011): Environmental Assessment and Environmental Management Framework
for Jalanidhi-2, ABC Environ Solutions Pvt. Ltd., Chennai, 377p. Jalanidhi, Thiruvananthapuram.
Government of Kerala (2015): Post Facto Evaluation Study Report on Pothundy Irrigation project 2015
Office of the Chief Engineer, Investigation and Design, IDRB, Trivandrum
Government of India, (1987): National Water Policy-1987, New Delhi.
Government of India, (2002): National Water policy-2002, Ministry of Water Resources, New Delhi
Government of India (2003): Hariyali: Guidelines for Watershed Development, Ministry of Rural
Development, New Delhi
Government of India (2006): From Hariyali to Neeranchal, Report of the Technical Committee on
Watershed Programmes in India, Ministry of Rural development, New Delhi

59
Government of India (2008): Report of the task group on problems of hilly habitations in areas covered
by the Hill Areas Development Programme (HADP)/Western Ghats Development Programme
(WGDP), Planning Board, Thiruvananthapuram
Government of India, (2013): National Water Policy-2012, Ministry of Water Resources, New Delhi
Hofstra M, (2014): Water Resource Management and Governance-The Dutch Experience. Water
Governance Centre, Dutch Water Authorities, Ministry of Infrastructure and the Environment.
Isaac Thomas T M and Franke Richard W, (2000): Local Democracy and Development: People’s
Campaign for Decentralised Planning in Kerala. New Delhi Leftword.
Joshi, P. K., Pangare. V., Shiferaw. B., Wani, S. P., Bouma, J., and Scott, C.(2004): Watershed
development in India: Synthesis of past experiences and need for future research, Indian Journal of
Agriculture Economics, V.59, pp.303-320
Kerala State Landuse Board (KSLUB) (1995): Land Resources of Kerala State, Thiruvananthapuram.
Ministry of Agriculture (2015): Agricultural statistics at a glance – 2014. Ministry of Agriculture,
Government of India, New Delhi. .
Moss T and Newig J., (2010): Multi-level water governance and problems of scale: Setting the stage for
broader debate. Environmental Management, 46 (1) 1-6. DOI 10.1007/s00267-010-9531-1.
www.springerlink.com
Nair K N and Chattopadhyay S, (2005): Water Resources of Kerala: Issues and Case Studies. Centre for
Development Studies, Thiruvananthapuram.
Organisation for Economic Co-operation and Development (OECD), (2014): Water Governance in the
Netherlands- Fit for the future? OECD studies on water www.oecd.org/gov/water.
Radhakrishna, B.P., (2001): The Western Ghats of the Indian Peninsula. In Sahyadri: The Great
Escarpment of the Indian sub-continent. eds. Y, Gunnell and B.P, Radhakrishna Memoir 47 (1),
Geological Society of India, Bangalore, pp. 133-144.
Sampath S and Vinayak P V S S K.(1989): Rainfall in Kerala. Project report, Centre for Earth Science
Studies, Thiruvananthapuram
Shravankumar V (2000): Studies on natural hazards of flash floods in the vicinity of Trivandrum, Centre
for Earth Science Studies, Unpublished report. Thiruvananthapuram.
Soman, M.K., Krishnakumar, K, Singh, N. (1988): Decreasing and trend in the rainfall of Kerala. Current
Science, V. 57, pp. 7-12.
UNESCO (2015). Water for a Sustainable World. World Water Development Report-2015, United
Nations Educational, Scientific and Cultural Organization, Paris, France.
UNESCO (2016). Water and Jobs. World Water Development Report-2016, United Nations Educational,
Scientific and Cultural Organization, Paris, France.
UNICEF (2013): Water in India Situation and Prospects, New Delhi
Vorosmarty, C.J,. D. Lettenmaier, C. Leveque, M. Meybeck, C. Pahl-wostl, J. Alcamo, W. Cosgrove, H.
Grassi, H. Hoff, R. Kambat, F. Lansigan, R. Lawford, and R. Naiman (2004): Humans transforming the
global water system. EOS, Transactions, American Geophysical Union, v. 85 pp 509, 513-514.
Vorosmarty C J., Pahl-Wostl C and Bhaduri A (2013): Water in the anthropocene: New perspectives for
global sustainability, Editorial overview. Current Opinion in Environmental Sustainability (COSUST).
Vol. 5 pp 1-4.
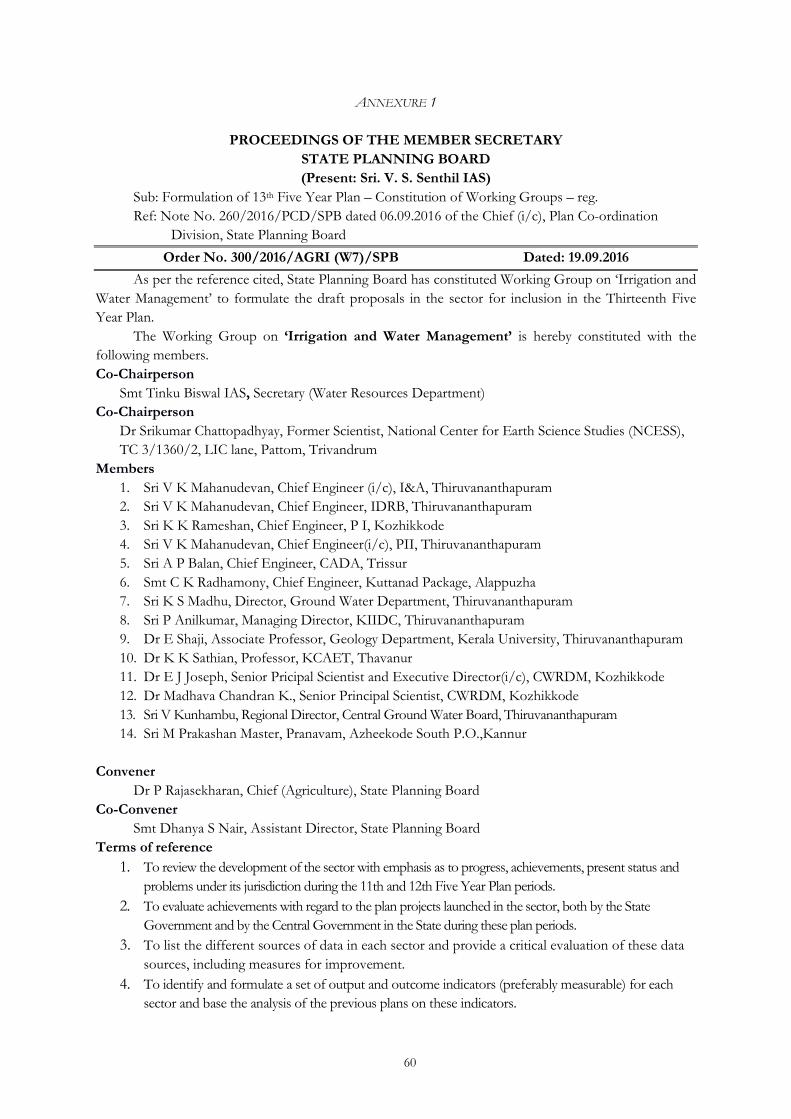
60
ANNEXURE 1
PROCEEDINGS OF THE MEMBER SECRETARY
STATE PLANNING BOARD
(Present: Sri. V. S. Senthil IAS)
Sub: Formulation of 13th Five Year Plan – Constitution of Working Groups – reg.
Ref: Note No. 260/2016/PCD/SPB dated 06.09.2016 of the Chief (i/c), Plan Co-ordination
Division, State Planning Board
Order No. 300/2016/AGRI (W7)/SPB Dated: 19.09.2016
As per the reference cited, State Planning Board has constituted Working Group on ‘Irrigation and
Water Management’ to formulate the draft proposals in the sector for inclusion in the Thirteenth Five
Year Plan.
The Working Group on ‘Irrigation and Water Management’ is hereby constituted with the
following members.
Co-Chairperson
Smt Tinku Biswal IAS, Secretary (Water Resources Department)
Co-Chairperson
Dr Srikumar Chattopadhyay, Former Scientist, National Center for Earth Science Studies (NCESS),
TC 3/1360/2, LIC lane, Pattom, Trivandrum
Members
1. Sri V K Mahanudevan, Chief Engineer (i/c), I&A, Thiruvananthapuram
2. Sri V K Mahanudevan, Chief Engineer, IDRB, Thiruvananthapuram
3. Sri K K Rameshan, Chief Engineer, P I, Kozhikkode
4. Sri V K Mahanudevan, Chief Engineer(i/c), PII, Thiruvananthapuram
5. Sri A P Balan, Chief Engineer, CADA, Trissur
6. Smt C K Radhamony, Chief Engineer, Kuttanad Package, Alappuzha
7. Sri K S Madhu, Director, Ground Water Department, Thiruvananthapuram
8. Sri P Anilkumar, Managing Director, KIIDC, Thiruvananthapuram
9. Dr E Shaji, Associate Professor, Geology Department, Kerala University, Thiruvananthapuram
10. Dr K K Sathian, Professor, KCAET, Thavanur
11. Dr E J Joseph, Senior Pricipal Scientist and Executive Director(i/c), CWRDM, Kozhikkode
12. Dr Madhava Chandran K., Senior Principal Scientist, CWRDM, Kozhikkode
13. Sri V Kunhambu, Regional Director, Central Ground Water Board, Thiruvananthapuram
14. Sri M Prakashan Master, Pranavam, Azheekode South P.O.,Kannur
Convener
Dr P Rajasekharan, Chief (Agriculture), State Planning Board
Co-Convener
Smt Dhanya S Nair, Assistant Director, State Planning Board
Terms of reference
1. To review the development of the sector with emphasis as to progress, achievements, present status and
problems under its jurisdiction during the 11th and 12th Five Year Plan periods.
2. To evaluate achievements with regard to the plan projects launched in the sector, both by the State
Government and by the Central Government in the State during these plan periods.
3. To list the different sources of data in each sector and provide a critical evaluation of these data
sources, including measures for improvement.
4. To identify and formulate a set of output and outcome indicators (preferably measurable) for each
sector and base the analysis of the previous plans on these indicators.

61
5. To outline problems pertaining to the status of implementation of water resources development
programmes, lift irrigation schemes and the strategies for strengthening the water resource
development programmes
6. To suggest, in particular, a set of projects that can be undertaken during the 13th Plan period in
the sector.
7. The Co-Chairperson is authorised to modify terms of reference with approval of State Planning
Board. The Co-Chairperson is authorised to invite, on behalf of the Working Group, experts to
advise the Group on its subject matter. The non-official members of the Working Group will be
entitled to travelling allowances as are applicable to class I officers of the Govt. of Kerala. The
class I officers of GoI will be entitled to travelling allowances as per rules if reimbursement is not
allowed from Departments.
8. The working group will submit its draft report by 1st December2016 to the State Planning Board.
Sd/- Member Secretary
To
The Person concerned
The Sub treasury Officer, Vellayambalam
Copy to:-
The Accountant General, Kerala (A&E) with C/L
All Divisions, State Planning Board
PS to VC
PA to Member Secretary, Stock file
Forwarded by order
Sd/-
Chief (Agriculture)

62
Sub Group Members
1. Supply Demand analysis of water
a) Dr C M Susanth, CWRDM --- Convenor
b) Shri Thomas Mathew, Joint Director, IDRB
c) Shri Maju Balakrishnan, Executive Engineer (Planning), O/o (I&A)
d) Shri C T Rajesh, Superintending Engineer General, Ground Water Department
2. Irrigation assessment
a) Dr EJ Joseph, Senior Principal Scientist, CWRDM
b) Dr U Surendran, Scientist, CWRDM
c) Shri Thomas Mathew, Joint Director, IDRB
d) Dr VP Dineshan, Senior Principal Scientist, CWRDM
3. Rivers and Water Quality
a) Dr PS Harikumar, Head, Water Quality Division, CWRDM
4. Water Conservation
a) Shri VK Mahanudevan, CE(i/c), I&A
b) Dr Madhava Chandran K, Senior Principal Scientist, CWRDM
c) Dr Babu Mathew,Senior Principal Scientist, CWRDM
d) Dr KK Sathian, Professor, KCAET
e) Dr Shaji, Associate Professor, Department of Geology, University of Kerala
f) Dr PK Thampi, Scientist ( Rtd), NCESS
g) Shri John Mathai, Scientist ( Rtd), NCESS
h) Shri V Kunhambu, Regional Director, Central Ground Water Board
i) Smt Preetha Sugathan, Water Management Specialist, CADA
5. Flood Control
a) Shri VK Mahanudevan, CE(i/c), I&A
6. Review of Schemes
a) Dr Srikumar Chattopadhyay
b) Shri M Prakashan
c) Shri Maju Balakrishnan, Executive Engineer (Planning), O/o (I&A)
d) Smt. Jaya P Nair, SE, MVIP
e) Shri K B Basant Executive Engineer (NC), Project I
f) Shri Jose James, Superintending Hydrogeologist General, Ground Water Department
7. Data analysis
a) Shri VK Mahanudevan, CE(i/c), I&A
b) Shri V Kunhambu, Regional Director, Central Ground Water Board
c) Shri Sabu K.Damodar, Superintending Hydrogeologist (HP), Ground Water Department

63
ANNEXURE 2
Completed Irrigation Projects in Kerala
Sl. No.
Name of projects Districts Year
of Start
Year of completion
Ayacutnet Ayacut (in ha)Gross
1 Neyyar Thiruvananthapuram 1951 1973 15380 23480 2 Pampa Pathanamthitta 1961 1992 21135 49456 3 Periyar Vally Ernakulam 1956 1994 32800 65600 4 Chalakkudy Thrissur 1949 1966 19690 39380 5 Vazhani Thrissur 1951 1962 4226 4647 6 Cheerakuzhy Thrissur 1957 1973 1620 3240
7 Malampuzha Palakkad 1949 1966 20553 41106
8 Peechi Thrissur 1947 1959 18759 28080 9 Mangalam Palakkad 1953 1966 3440 6616 10 Walayar Palakkad 1953 1964 3997 6872
11 Meenkara (Gayathri Stage I)
Palakkad 1956 1964 3035 6070
12 Chulliyar (Gayathri Stage II)
Palakkad 1961 1970 2430 4860
13 Pothundy Palakkad 1958 1971 4685 9370 14 Chitturpuzha Palakkad 1963 1992 15700 29202 15 Kuttiady Kozhikode 1962 1993 14570 35850 16 Chimoni Thrissur 1976 1996 13000 26000 17 Kallada Kollam 1961 2004 61630 92800 18 Kanjirapuzha Palakkad 1961 1995 9713 21853 19 Pazhassi Kannur 1961 1992 11525 23050
Ongoing Irrigation Projects
Sl. No Name of Projects Districts Year of
commencements Expected Net (in ha)
Ayacut Gross (in
has)
1 Muvattupuzha valley
Ernakulam, Idukki 1974 31,266 37,737
2 Idamalayar Ernakulam 1981 14,394 27,513
3 Karapuzha Wayanad 1978 5,221 8,929 4 Banasura Sagar Wayanad 1981 2,800 4,800

64
ANNEXURE 3
Strategies for Improving Irrigation Scenario of Kerala
The net and gross irrigated areas in the State from all sources are 4.14 lakh ha and 4.69 lakh ha,
respectively during 2014-15 (Tables 1a & 1b). This constitutes 20.3% and 17.9 % of the net cropped area
and gross cropped area, respectively (DoES, 2016). Compared to the irrigated area of 46.9% at the
national level, the State’s achievement in the irrigation sector is far behind (MoA, 2015). District-wise net
and gross irrigated areas for the past 10 years are shown in Tables 1a and 1b.
The percentage coverage under gross irrigation is high in the districts of Thrissur (46.1% of the gross
cropped area in the district), followed by Kasaragod (43.3%), Alapuzha (41.7%) and Palakkad (36.6%),
whereas it is very low in Pathanamthitta (6.6%), Thiruvananthapuram (6%), Kozhikode (3%) and Kollam
(2.5%) districts. The extent of gross irrigated area is maximum in Palakkad district (23.4% of the State
total GIA), followed by Thrissur (17.1%), Kasaragod (14.0%) and Alappuzha (9.3%), respectively (Figures
1 to 3).
Limitations for improving the irrigated area in Kerala
The expansion of irrigated area in the State is limited by following factors:
1. Undulating terrain conditions,
2. Non-availability of perennial sources of water in many of the plantation tracts situated on
slopes, especially during summer season
3. High capital cost for development of irrigation facilities, especially in undulating terrains
4. Irrigation as necessity is not felt by a good majority of the farmers
5. High cost of labour and shortage of farm labourers,
6. Lack of awareness on water management,
7. Lack of proper drainage facilities in farm area
8. Fragmentation of landholdings,
9. Market fluctuations for crop produces, Low returns & declining interest of farmers,
10. Low irrigation efficiency, both at project/ scheme level and also at the field level, etc.
Substantial dependence on rainfall makes cultivation in remaining areas a high risk and less
productive/remunerative profession. Research and empirical evidences suggest that assured/protective
irrigation and in situ soil moisture conservation encourages farmers to invest more in farming technology
and inputs leading to productivity enhancement and increased farm income. Hence, it has been proposed
to increase the gross irrigated area to 31% during the 13th Five Year Plan from the current level. Seeing
the importance of irrigation, recently Government of India has announced Pradhan Mantri Krishi
Sinchayee Yojana (PMKSY) by converging all the existing schemes related to irrigation by several
departments.
Strategies for Improving Irrigation Scenario of Kerala -- District Wise Plan
As mentioned, it has been proposed to increase the gross irrigated area to 31% during the 13th Five Year
Plan from the current level. All the activities need to be done at Panchayath level, however for the policy
makers to understand and also the ways and means by which the targeted irrigated area can be achieved; a
district level plan has been arrived and presented below.

65
Based on the analysis of the irrigated area on source-wise and crop-wise, the districts were broadly
classified into three groups. The targets that need to be achieved in the five year plan period, along with
the past 10-year data, has been shown in Fig. 1 to 3. The point-wise strategies are shown in Table 2.
1. Irrigation stagnant districts – Kozhikode, Kollam, Idukki and Pathanmthitta
2. Districts showing decreasing/fluctuating trend in Irrigation - Thrissur, Ernakulam, Kannur,
Thiruvananthapuram, Kottayam and Wayanad
3. Districts showing increasing trend in Irrigation- Palakkad, Kasaragod, Malappuram and Alappuzha
Figure 1 Target for the 13th Five Year Plan in the districts showing stagnant trend in irrigation during
past 10 Years
Note Percent of gross irrigated area to gross cropped area and red colour line indicates the future target.
Figure 2 Target for the 13th Five Year Plan in the districts showing decreasing trend in irrigation
during past 10 years
Note Percent of gross irrigated area to gross cropped area and red colour line indicates the future target.
0.05.010.015.020.025.0
% of irrigated
area
Kollam Pathanamthitta Idukki Kozhikode
0.0
10.0
20.0
30.0
40.0
50.0
60.0
% of irrigated area
Thrissur EranakulamKannur Thiruvananthapuram

66
Figure 3 Target for the 13th Five Year Plan in the districts showing increasing trend in irrigation during
past 10 years
Note Percent of gross irrigated area to gross cropped area and red colour line indicates the future target.
Table 1a District Wise Net Irrigated Area for the Last 10 Years
District
2004-
2005
2005-
2006
2006-
2007
2007-
2008
2008-
2009
2009-
2010
2010-
2011
2012
-
2013
2013-
2014
2014-
2015
Thiruvanant
hapuram 3487 4072 4702 8058 8201 6558 7703 7133 7658 7689
Kollam 2179 2620 3000 4477 4882 4023 3890 4212 3911 4491
Pathanamth
itta 5281 6119 5882 5525 6310 6212 5825 3911 4987 5309
Alappuzha 42998 43657 39637
3470
9
3682
7
3398
2 42252
4013
0 38063 40024
Kottayam 14778 14647
1457
2
1608
7
1462
4
1542
5 14134
1290
4 12395 12956
Idukki 16059 17094
1591
0
1643
9
1806
0
2929
2 28748
3959
3 37441 42095
Eranakulam 44712 43637
4066
0
2805
6
3028
5 26825 33147
2318
4 24752 23133
Thrissur 88462 87762
8229
2
6855
0
6857
7 67036 68648
6302
3 63580 62633
Palakkad 70458 76998
7934
4
8867
8
9302
6 89635 82691
8502
9 90021 90927
Malappura
m 24443 23724
2431
4
2466
3
2688
4 25520 27874
3092
7 30621 32757
Kozhikode 5269 5443 5317 7258 6056 5447 5564 5234 4931 4913
Wayanad 9719 10335
1096
6
1223
0
1218
9 13908 15225
1347
2 13256 15204
Kannur 19981 19515
2054
0
2331
2
2428
8 22269 24662
1959
1 15980 14944
Kasaragod 45530
4582
7
4467
5 49503 49044 40130 54650
4752
5 49580 57207
KERALA
39335
6
4014
50
39181
1 387545
39925
3
38626
2
41501
3
39586
8
39717
6
41428
2
0.0
10.0
20.0
30.0
40.0
50.0
60.0% of gross irrigated area
Palakkad KasaragodAlappuzha Malappuram

67
Source: DoES ( 2005 to 2016)

68
Table 1b. District Wise Gross Irrigated Area for the Last 10 Years
DISTRICT
S
2004-
2005
2005-
2006
2006-
2007
2007-
2008
2008-
2009
2009-
2010
2010-
2011
2011-
2012
2012-
2013
2013-
2014
2014-
2015
Thiruvanant
hapuram 6793 7017
1290
3
1020
7
1369
3
1315
0
2326
9
1638
7
1011
1 9394 9997
Kollam 4866 5953 5411 5207 5149 9168 8401 7327 6051 3889 3837
Pathanamth
itta 7838 7627
1002
4 7904 8005 7163 6894 6564 5511 6675 6853
Alappuzha
4649
5
4130
0
4543
1
4621
7
4662
9
4360
1
4803
0
4689
9
4637
5
4613
9
4310
6
Kottayam
1776
2
1883
8
1967
3
1473
2
1508
1
1874
5
1890
6
2151
1
2127
8
1971
6
2149
8
Idukki 7414 8545
1168
7 6413 7246 7756 4631 5333
1023
9
1062
5
1118
6
Eranakulam
5304
9
5259
2
5033
1
3971
6
3965
8
3631
4
3510
1
3632
0
3200
9
3219
1
3032
3
Thrissur
9218
2
8622
1
8444
5
8159
1
7738
8
7816
7
7731
2
8789
6
8235
7
8411
0
8058
3
Palakkad
9235
3
9115
8
1071
17
1031
40
1085
22
1073
80
9888
7
1045
11
9536
5
1079
06
1101
08
Malappura
m
3488
5
3925
7
3772
2
3418
6
3580
8
3561
3
3689
1
4220
3
4064
1
3940
0
4122
1
Kozhikode 7546 8963 9955 9160 8268 6433 7411 7021 7491 6046 6414
Wayanad
1569
3
2315
5
1693
3
1727
8
1708
3
1775
8
1884
7
1921
2
1956
0
1882
4
1799
7
Kannur
2394
4
2461
7
3032
0
2577
7
2649
0
2431
1
2532
0
2778
3
2271
5
1974
8
2050
8
Kasaragod
4457
1
4482
3
4807
9
5378
7
4921
8
4922
4
5613
8
6161
8
5819
3
6365
7
6601
6
KERALA
45539
1
4600
66
4900
31
4553
15
4582
38
4547
83
4660
38
4905
85
4578
96
4683
20
4696
47
Source: DoES (2005 to 2016)

69
Table 2District Wise Strategy for Improving the Irrigation
Districts Surface water-based
schemes
Groundwater-
based schemes
Crops need to be
focussed
Irrigation stagnant districts
Kozhikode, Kollam,
Idukki and
Pathanamthitta
A. More focus on
creation of new
diversion/ lift
irrigation schemes/
VCBs/ check dams,
barrages, etc
B. Bringing new minor
irrigation schemes
C. Improvement in
existing irrigation
projects including
minor irrigation
schemes
D. Rejuvenation of
tanks, ponds and
springs
E. Source to field – Use
efficiency needs to
be improved by
using the advanced
techniques
A. Stage of
groundwater
development is low
to medium in
Pathanamthitta
(37%), Kollam
(38%), Idukki (43%)
and Kozhikode
(56%). Hence, the
possibility for
development of
GW-based schemes
needs to be given
prime focus,
especially in all the
safe blocks.
A. Focus needs to be
given to Coconut
especially in
Kozhikode which
is having larger
area (1.23 Lakh ha)
and hence
productivity may
be improved to a
larger extent
B. Vegetables and
Banana showed an
increasing trend in
the area irrigated in
these districts,
which confirms the
interest by the
farmers and hence
more attention
may be given to
these crops.
C. Paddy cultivation
needs to be
promoted and
even aerobic
cultivation of
paddy using
irrigation may be
thought off.
Districts showing decreasing trend in Irrigation
Thrissur, Ernakulam,
Kannur,
Thiruvananthapuram,
Kottayam and
Wayanad
A. Plan for utilizing the
Kabani Water in
Wayanad district
F. More focus on
creation of new
diversion/ lift
irrigation schemes/
VCBs/ check dams,
barrages, etc
B. Creation of new
minor irrigation
projects
C. Improvement in
existing irrigation
A. Stage of ground
water
development is
low to medium in
Wayanad (18%),
Kottayam (29%)
and Ernakulam
(42%), Thrissur
(53%). Hence,
the possibility for
development of
GW-based
schemes needs to
be given prime
A. Irrigated area under
Nutmeg showed an
increasing trend in
Thrissur,
Ernakulam and
Kottayam and
hence more area
can be brought
under irrigation.
B. Vegetables and
Banana showed an
increasing trend in
the area irrigated in
some of these

70
projects including
minor irrigation
schemes in all the
districts with more
focus on Thrissur
D. Rejuvenation of
tanks, ponds and
springs.
E. Source to field – Use
efficiency needs to
be improved by
using the advanced
techniques
focus, especially
in all the safe
blocks.
districts, which
confirms the
interest by the
farmers and hence
more attention may
be given to these
crops.
C. Coconut and Paddy
area is getting
reduced in Thrissur,
Ernakulam and
Kottayam, which
needs to be
addressed
Districts showing increasing trend in Irrigation
Palakkad, Kasaragod,
Malappuram and
Alappuzha
A. Plan for utilizing
Bhavani water in
Attappady
(Palakkad)
B. Improvement in
existing irrigation
projects including
minor irrigation
schemes in all the
districts with more
focus on Palakkad
G. More focus on
creation of new
diversion/ lift
irrigation schemes/
VCBs/ check dams,
barrages, etc
C. Source to field – Use
efficiency needs to
be improved by
using the advanced
techniques.
D. Creation of new
schemes particularly
minor irrigation
projects
E. Rejuvenation of
tanks, ponds and
springs.
A. Stage of ground
water development
is very high in
Kasaragod (71%)
and Palakkad
(62%) districts and
low to medium in
Alapuzha (29%)
and Malappuram
(57%). More focus
on ground water
recharging schemes
needs to be given
and further
abstractions may be
with held in over-
exploited and
critical blocks.
B. Safe blocks may be
considered for any
new GW based
schemes. In Semi
critical blocks such
as Pattambi,
Thrithala,
Kanhangad
Manjeswar,
Karadka
GW further
development may
be done with
caution.
C. Stage of ground
A. Water saving
techniques needs to
be practiced for all
the crops in these
districts especially in
Palakkad,
Kasaragod and
Malappuram
districts where drip
irrigation is already
being practiced for
improving the water
use efficiency and
also to bring more
area under irrigation
B. Coconut showed an
increasing trend
under irrigated area
in Kasaragod,
Malappuram and
Palakkad . Hence
more focus needs to
be given for
bringing more area
under irrigation
C. Proper drainage
measures needs to
be arranged for
Paddy in Alappuzha
, so that area can be
increased.

71
water development
being very low in
Alappuzha (29%),
the possibility for
development of
GW- based
schemes need to be
explored.
References
DoES (2005 to 2016). Agricultural Statistics 2004-05 to 2014-15. Department of Economics and
Statistics, Government of Kerala.
MoA (2015). Agricultural statistics at a glance – 2014. Ministry of Agriculture, Government of India.
72
ANNEXURE 4
NOTE ON DEVELOPMENT OF MICRO IRRIGATION IN KERALA
Introduction
Despite Agriculture being the lifeline of India, it is beset with water scarcity, making it hardly
remunerative and uncertain. The present government has therefore emphasised heavily on the correlation
of water management with farm productivity, as indicated in Hon’ble Prime Minister’s slogan ‘Per Drop
More Crop’ and his launching a flagship Scheme ‘Pradhan Mantri Krishi Sinchai Yojna’ (PMKSY) with
the stated intent of ‘Har Khet Ko Pani’.
Water is considered as the most critical resource for sustainable agricultural development. However, the
increasing population, and more erratic rainfall, is likely to reduce the water supply for agriculture.
Therefore, time has come when Indian agriculture should appreciate the fact that water is a precious and
limited resource and should be conserved and handled carefully in the most efficient manner, to minimize
the dependence of agriculture on monsoon.
The solution lies in examining the innovative models for their contribution to higher efficiency of water
usage. Micro irrigation is proved to be a one such efficient method which enables better control and
monitoring of existing water which can be translated into higher water usage efficiency. However, in spite
of the sustained efforts made by central and state governments, the extent of success in adoption of
Micro irrigation by farmers needs a review.
Hence, with the looming water scarcity crisis, there is a prudent and paramount need for efficient use of
the available water resources. Given its higher efficiency (on an average overall saving of irrigation water
is 20-48%, fertiliser by 28.5% and energy by 30.5%) and ease of implementation within months (while the
other irrigation infrastructure takes years to implement), micro irrigation systems can go a long way in
addressing the issues faced by the country and the agricultural sector. Hence, micro irrigation remains the
only efficient solution and a low hanging fruit for the government, industry and farmers to overcome the
challenges faced by the agriculture sector.
Recognising the importance of micro irrigation, the government has taken various initiatives since 1992.
The first real thrust however came in 2006, when the government launched a Centrally Sponsored
Scheme (CSS) for micro irrigation. This was later upgraded to the National Mission on Micro Irrigation
(NMMI) and was implemented through the year 2013-14. For the year 2014-15, NMMI was subsumed
under the National Mission for Sustainable Agriculture (NMSA) and was implemented under the On
Farm Water Management (OFWM) component of the scheme.
Pradhan Mantri Krishi Sinchayee Yojna (PMKSY) was launched in 2015, integrating micro irrigation in
the flagship scheme as an integral component. The scheme focusses on providing an end-to-end solution
to the irrigation supply chain. One key differentiator for micro irrigation is that when compared to other
components of this scheme, which include creating infrastructure to bring water to farms and watershed
development, micro irrigation presents a quick-win opportunity for all the stakeholders where the
implementation can be seen on ground within a short period. Developing infrastructure for irrigation
using normal traditional practices takes years, while bringing an area under micro irrigation is a task that
only requires a very short period.
73
It is a fact that more area can be irrigated adopting Micro Irrigation including Drip Irrigation using less
amount of water in comparison to area that can be irrigated adopting flow irrigation. Studies conducted
on the aspect have revealed that
(i) irrigated area has increase from same source of water by 8.41% on an average with the use of
Micro Irrigation Systems and
(ii) the water use efficiency in conventional irrigation ranges from 30% to 50% whereas it is 80% to
95% in the case of Micro irrigation including Drip Irrigation.
Crop experiments have shown that use of water soluble fertilizers through drip irrigation can result in
savings in water (15-40%) and fertilizer (20-50%).
The development of micro irrigation in this State is very negligible. The Status of Centrally Sponsored
Scheme on Micro Irrigation under PMKSY during 2015-16 in respect of Kerala as reproduced below is
self-explanatory:
As regarding the state wise allocation for PMKSY(Per Drop More Crop) for 2016-17, the projected
allocation for micro irrigation for Kerala is only Rs. 7 crores out of the total allocation Rs. 1500 crores
for all the states as detailed below:
The image part with relationship ID rId15 was not found in the file.

74
Table 1 State-wise allocation of PMKSY in rupees crore
Sl. No. State
Allocation
Micro Irrigation OtherInterventions Total
1 Andhra Pradesh 220.00 43.0 263.00
2 Bihar 25.00 36.0 61.00
3 Chattisgarh 20.00 28.0 48.00
4 Goa 0.50 1.0 1.50
5 Gujarat 220.00 40.0 260.00
6 Haryana 40.00 5.0 45.00
7 Himachal Pradesh 2.25 16.0 18.25
8 Jharkhand 20.00 31.0 51.00
9 Jammu &Kashmir 7.00 9.0 16.00
10 Karnataka 130.00 60.0 190.00
11 Kerala 7.00 23.0 30.00
12 Madhya Pradesh 140.00 62.0 202.00
13 Maharashtra 250.00 97.0 347.00
14 Odisha 18.00 29.0 47.00
15 Punjab 10.00 4.0 14.00
16 Rajasthan 120.00 95.0 215.00
17 Tamil Nadu 95.00 47.0 142.00
18 Telangana 115.00 24.0 139.00
19 Uttrakhand 10.00 13.0 23.00
20 Uttar Pradesh 20.00 49.0 69.00
21 West Bengal 6.50 32.0 38.50
22 Arunachal Pr. 0.75 4.0 4.75
23 Assam 1.50 43.0 44.50
24 Manipur 3.75 6.0 9.75
25 Meghalaya 0.75 6.0 6.75
26 Mizoram 6.50 4.0 10.50
27 Nagaland 0.50 9.0 9.50
28 Sikkim 6.50 3.0 9.50
29 Tripura 2.50 8.0 10.50
30 A&N Islands 0.00 1.0 1.00
31 Pudicherry 0.00 1.0 1.00
NCPAH (TSG)/HQ 1.00 11.0 12.00
Grand Total 1500.00 840 2340.00
In the above table, it can be noted that Andhra Pradesh &Gujarat lead the table with allocations in micro
irrigation of Rs. 220 crores and Rs. 220 crores respectively. It can be seen that the implementation of
micro irrigation in these two States are through special purpose vehicles. Over the period a variety of

75
organizational structures have come to be evolved by the different state governments in response to the
perceived importance of micro irrigation in sustainable agriculture development in their states. Amongst
the different modes of implementing agencies, the Andhra Pradesh and Gujarat models are unique and
stand apart so far as the implementing capacity and quality is concerned. The micro irrigation programme
in Andhra Pradesh is implemented by means of a special purpose vehicle in the name of Andhra Pradesh
Micro Irrigation Project (APMIP) and in Gujarat State by Gujarat Green Revolution Company Limited
(GGRCL). This type of implimentation is clearly reflected in the performance of these States in the field
of Micro Irrigation.
Hence it is high time that the State should start thinking in lines for designating anagency for taking up
and implementing the micro irrigation schemes in the State of Kerala.