iron diagram
TRANSCRIPT

8/6/2019 Iron Diagram
http://slidepdf.com/reader/full/iron-diagram 1/14
http://corrosion.kaist.ac.kr
Graphical representations of thermodynamic and electrochemical equilibria
between metal and water, indicating thermodynamically stable phases as afunction of electrode potential and pH ;
- predicts the spontaneous direction of reactions.
- estimates the composition of corrosion products.- predicts environmental changes that will prevent or reduce corrosion attack.
3.1 M/H2O system
For metal M immersed in the pure water (25°C) in which the metal M is divalent
and forms solvated M2+
ions and the simple oxide is MO.
M2+ +2e- = M
EM2+ /M = E°M2+ /M + 0.059/2 log aM2+
= E°M2+ /M +0.0295 log10-6 (1)
MO + 2H++ 2e- = M + H2O
EMO/M = E°MO/M + 0.059 log aH+
= E°MO/M - 0.059pH (2)
3. Potential. Potential - pH (Pourbaix) DiagramsH (Pourbaix) Diagrams
M
MO
M+2
H+
H+
H2O
OH-
8/6/2019 Iron Diagram
http://slidepdf.com/reader/full/iron-diagram 2/14
http://corrosion.kaist.ac.kr
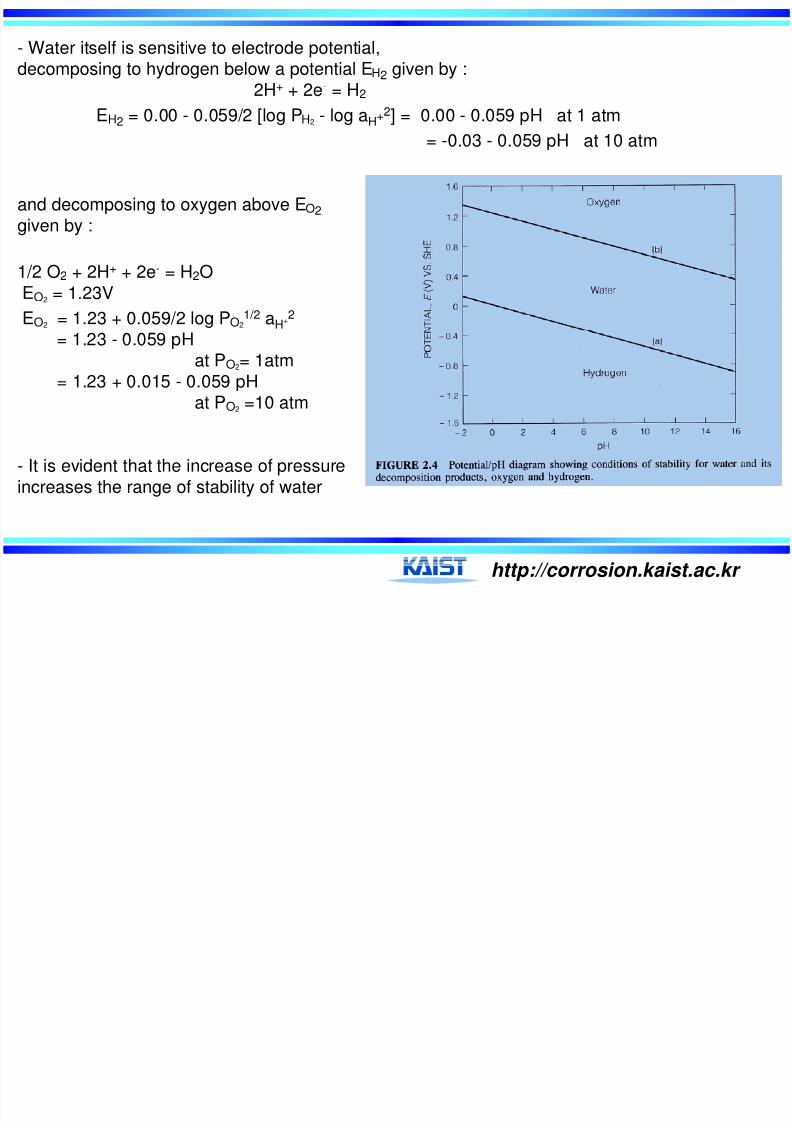
- Water itself is sensitive to electrode potential,decomposing to hydrogen below a potential EH2 given by :
2H+ + 2e- = H2
EH2 = 0.00 - 0.059/2 [log PH2 - log aH+2] = 0.00 - 0.059 pH at 1 atm
= -0.03 - 0.059 pH at 10 atm
and decomposing to oxygen above EO2
given by :
1/2 O2 + 2H+ + 2e- = H2O
EO2 = 1.23V
EO2 = 1.23 + 0.059/2 log PO21/2 aH+2
= 1.23 - 0.059 pHat PO2= 1atm
= 1.23 + 0.015 - 0.059 pHat PO2 =10 atm
- It is evident that the increase of pressure
increases the range of stability of water
8/6/2019 Iron Diagram
http://slidepdf.com/reader/full/iron-diagram 3/14
http://corrosion.kaist.ac.kr
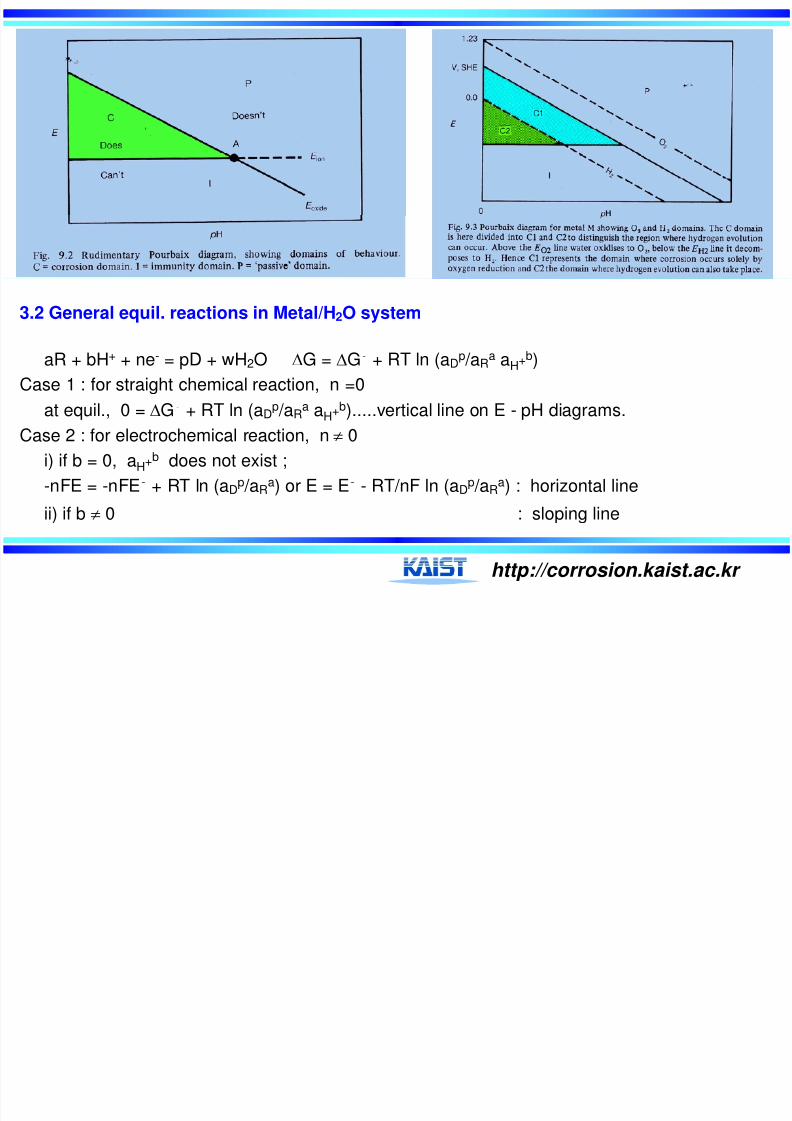
3.2 General equil. reactions in Metal/H2O system
aR + bH+ + ne- = pD + wH2O ΔG = ΔG° + RT ln (aDp /aR
a aH+b)
Case 1 : for straight chemical reaction, n =0
at equil., 0 = ΔG°
+ RT ln (aDp
/aRa
aH+b
).....vertical line on E - pH diagrams.Case 2 : for electrochemical reaction, n ≠ 0
i) if b = 0, aH+b does not exist ;
-nFE = -nFE° + RT ln (aDp /aR
a) or E = E° - RT/nF ln (aDp /aR
a) : horizontal line
ii) if b ≠ 0 : sloping line

8/6/2019 Iron Diagram
http://slidepdf.com/reader/full/iron-diagram 4/14http://corrosion.kaist.ac.kr
3.3 Pourbaix diagram of Fe-H2O system
25°C
Fe2+, FeO, Fe2O3, Fe3O4,Fe(OH)2, Fe(OH)3. Fe3+
H2, O2
H+, OH-
1) Fe2+ + 2e- = Fe E = E°+ 0.059/2 log aFe2+,
E = -0.44 + 0.059/2 log 10-6 = -0.62 V
2) Fe3+ + e- = Fe2+ E = E° - 0.059 log (aFe2+ /aFe3+)
assuming that aFe2+ = aFe3+ = 10-6 , E = 0.77 V
3) Fe2O3 + 6H+ + 2e- = 2Fe2+ + 3H2O E° = -ΔG° /2F = -(2G°Fe2+ + 3G°H2O - G°Fe2O3)/2F
= -{2[-20300] + 3[-56700] - [-177103]}/2x(-23604)
= 0.728 V
E = E°-0.059/2 log {(aFe2+2 aH2O
3)/(aFe2O3 aH+6)
= 0.728 - 0.059/2 x (-12) - 0.177 pH
= 1.082 - 0.177 pH.............sloping line
using the data :G°Fe2O3 = -177,103 cal/moleG°Fe2+ = -20,300 cal/moleG°H2O = -56700 cal/mole
H+
H+
H2O
OH-
H+
FeFe2+
Fe2O3

8/6/2019 Iron Diagram
http://slidepdf.com/reader/full/iron-diagram 5/14http://corrosion.kaist.ac.kr
4) Fe2O3 + 6H+ = 2Fe3+ + 3H2O (straight chemical reaction or no charge involved.)
ΔG = ΔG°+ 2.303 RT log (aFe3+2 /aH
+6) = 0...at equil. pH = 1.76
5) Fe3O4 + 8H+ + 2e- = 3Fe2+ + 4H2O E°= 0.98 V, G°Fe3O4 = -238,500 cal/mol
E = 1.511 - 0.236 pH
6) Fe3O4 + 8H+
+8e-
= 3Fe + 4H2O E = -0.0636 - 0.059 pH
7) HFeO2- + 3H+ + 2e- = Fe + 2H2O E = 0.493 - 0.0887 pH
8) Fe3O4 + 2H2O +2e- = 3HFeO2- + H+ E = -1.82 + 0.0295 pH
9) Fe2O3 + H2O +2e- = 2HFeO2- E = constant
10) 6Fe2O3 + 4H+ + 4e- = 4Fe3O4 + 2H2O E = 0.0583 - 0.059 pH

8/6/2019 Iron Diagram
http://slidepdf.com/reader/full/iron-diagram 6/14http://corrosion.kaist.ac.kr
• A
8/6/2019 Iron Diagram
http://slidepdf.com/reader/full/iron-diagram 7/14http://corrosion.kaist.ac.kr
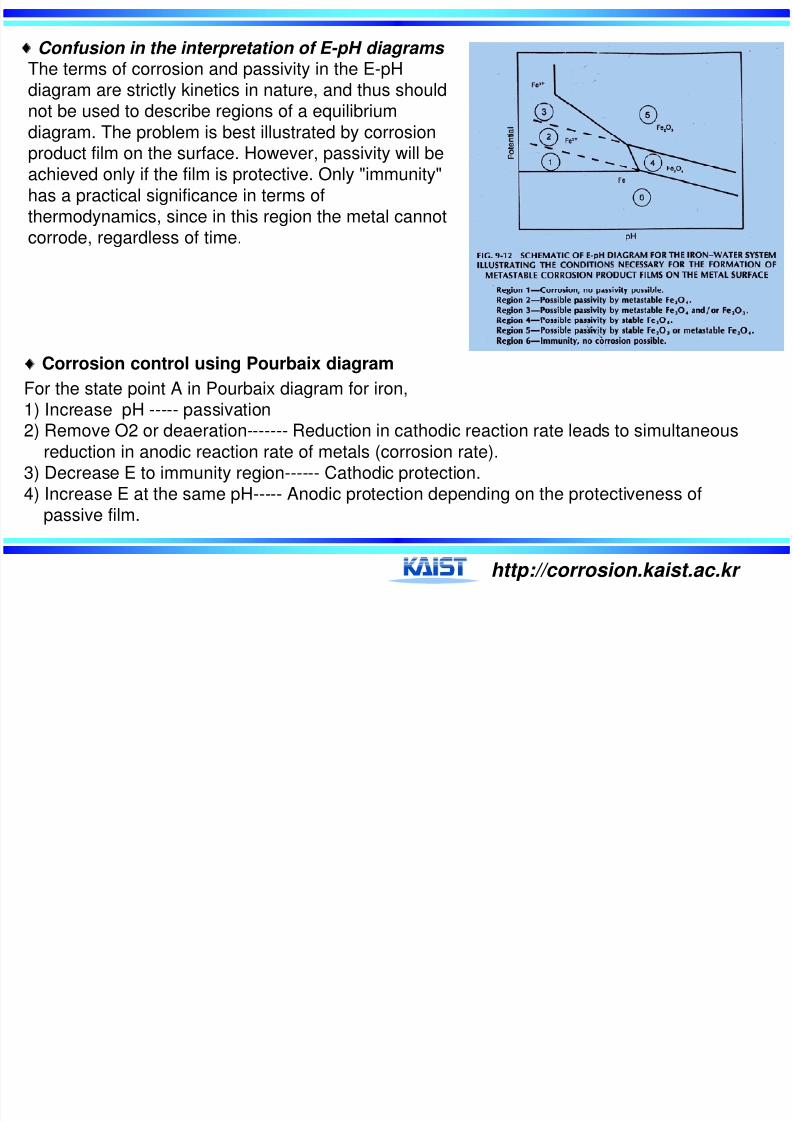
♦ Confusion in the interpretation of E-pH diagrams The terms of corrosion and passivity in the E-pHdiagram are strictly kinetics in nature, and thus should
not be used to describe regions of a equilibriumdiagram. The problem is best illustrated by corrosionproduct film on the surface. However, passivity will beachieved only if the film is protective. Only "immunity"
has a practical significance in terms ofthermodynamics, since in this region the metal cannotcorrode, regardless of time.
♦ Corrosion control using Pourbaix diagram
For the state point A in Pourbaix diagram for iron,
1) Increase pH ----- passivation2) Remove O2 or deaeration------- Reduction in cathodic reaction rate leads to simultaneous
reduction in anodic reaction rate of metals (corrosion rate).3) Decrease E to immunity region------ Cathodic protection.4) Increase E at the same pH----- Anodic protection depending on the protectiveness of
passive film.

8/6/2019 Iron Diagram
http://slidepdf.com/reader/full/iron-diagram 8/14
http://corrosion.kaist.ac.kr
Region Fe=Fe2++2e- H2=2H++2e- Fe2++3H2O =Fe2O3+6H++2e-
2H2O =O2+4H++4e-
E < -0.6 Reduction Reduction Reduction Reduction
-0.6 < E < -0.4 Oxidation Reduction Reduction Reduction
-0.4 < E < -0.2 Oxidation Oxidation Reduction Reduction
-0.2 < E < +0.8 Oxidation Oxidation Oxidation Reduction
+0.8 < E Oxidation Oxidation Oxidation Oxidation
3.4 Dependence of electrochemical reaction direction on electrode potential
8/6/2019 Iron Diagram
http://slidepdf.com/reader/full/iron-diagram 9/14
http://corrosion.kaist.ac.kr
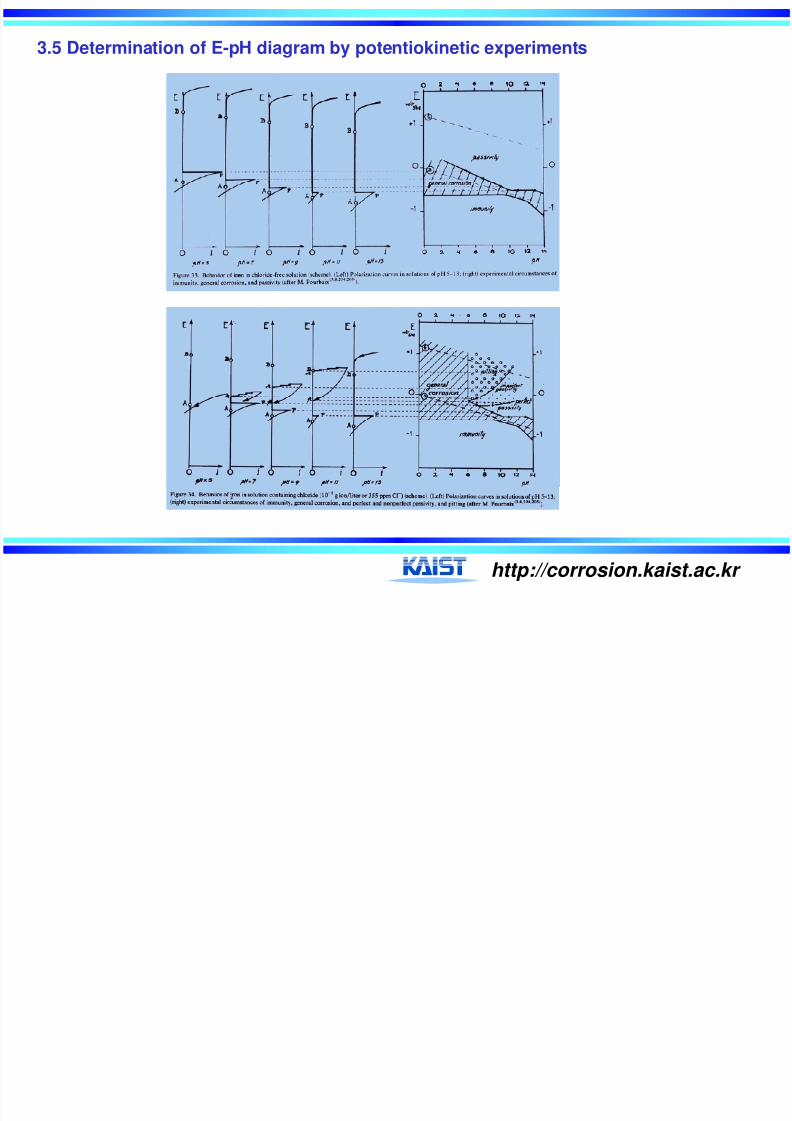
3.5 Determination of E-pH diagram by potentiokinetic experiments

8/6/2019 Iron Diagram
http://slidepdf.com/reader/full/iron-diagram 10/14
http://corrosion.kaist.ac.kr
3.6 E - pH diagram of Fe-H2O system at high temperatureThe principal effects of increasing temperature :
1. The decrease in the thermodynamic stability of water2, An expansion in the stability domain of the Fe(III) oxyanion(HFeO2-) at high pH3. The shift in the predominance domains for Fe2+ and Fe3+ to lower values4. The increased stability of anionic species at the expanse of cationic species at
elevated temperatures is a fairly general phenomenon for metal-water system.
8/6/2019 Iron Diagram
http://slidepdf.com/reader/full/iron-diagram 11/14
http://corrosion.kaist.ac.kr
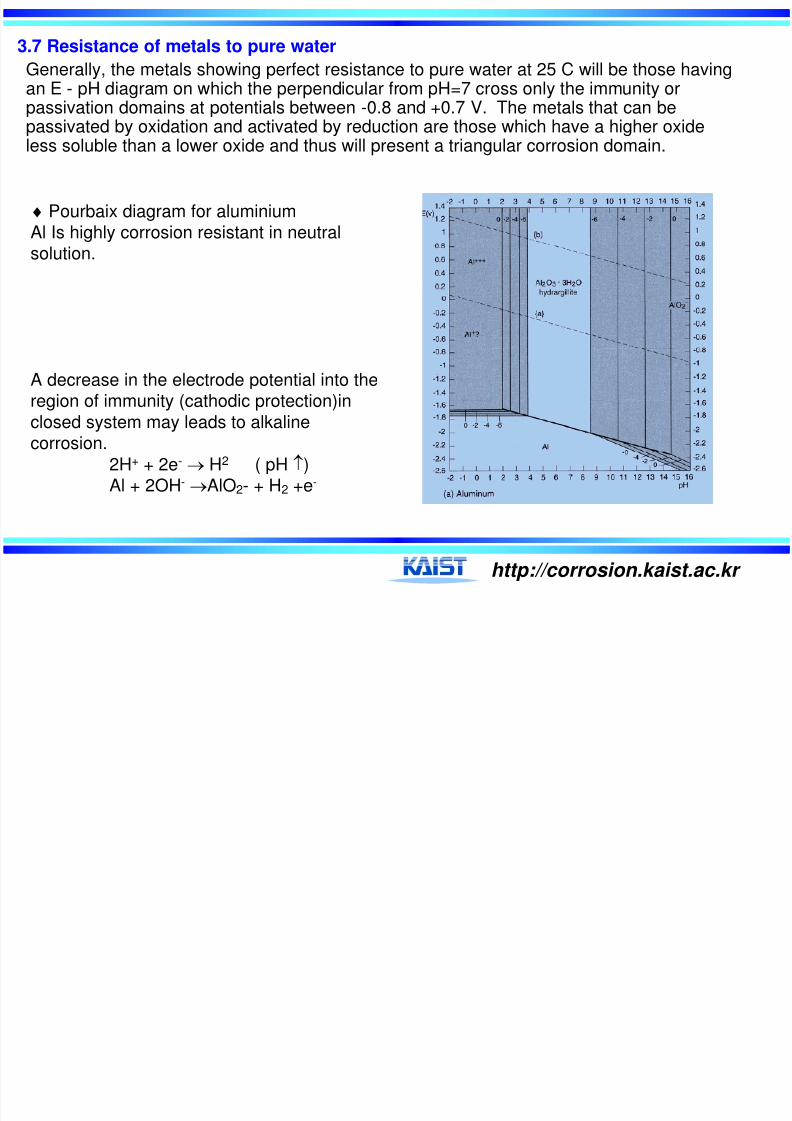
3.7 Resistance of metals to pure water
Generally, the metals showing perfect resistance to pure water at 25 C will be those havingan E - pH diagram on which the perpendicular from pH=7 cross only the immunity or
passivation domains at potentials between -0.8 and +0.7 V. The metals that can bepassivated by oxidation and activated by reduction are those which have a higher oxideless soluble than a lower oxide and thus will present a triangular corrosion domain.
♦ Pourbaix diagram for aluminiumAl Is highly corrosion resistant in neutralsolution.
A decrease in the electrode potential into theregion of immunity (cathodic protection)in
closed system may leads to alkalinecorrosion.
2H+ + 2e- → H2 ( pH ↑)Al + 2OH- →AlO2- + H2 +e-

8/6/2019 Iron Diagram
http://slidepdf.com/reader/full/iron-diagram 12/14
http://corrosion.kaist.ac.kr
♦ Pourbaix diagram for copperBased on the data in table 1, draw the E- pH
relationships for the equilibrium reactionoccurring on the surface in pure water at 25°Cand plot the Pourbaix diagram of Cu/H2O
Table 1. Standard free energies G° in
cal./mole of the various chemical speciesinvolved in the Cu-H2O system.
H2O -56,690 Cu2+ 15,530
OH- -37,595 CuO2- -43,500
Cu+ 12,000 HCuO2- -61,420
Cu 0 CuO -30,400
Cu2O -34,980 Cu(OH)2 -85,300
Copper will not be corroded in deaerated water since the value of Ecu2+ /cu is higher than thatof EH+ /H2. Thus Cu is not corroded in nonoxidizing acids like dil. HCl and H2SO4 etc. But inoxidizing acids like HNO3, Cu corrodes. The addition of oxidizing species Fe3+ tononoxidizing acid can give rise to severe corrosion attack.

8/6/2019 Iron Diagram
http://slidepdf.com/reader/full/iron-diagram 13/14
http://corrosion.kaist.ac.kr
♦Pourbaix diagrams of TiTi is thermodynamically reactive, but isnevertheless very corrosion resistant becauseof a highly resistant passive film that is stableat all pHs in oxidizing potentials. It corrodes
only at low pH in solutions without oxidizers.Ti does not corrode in HNO3 due to theoxidising nature of HNO3, but corrodes indilute HCl and H2SO4.
By adding some oxidising agent such as Fe3+,
corrosion reaction of Ti in HCl or H2SO4 canbe reduced.

8/6/2019 Iron Diagram
http://slidepdf.com/reader/full/iron-diagram 14/14
http://corrosion.kaist.ac.kr
Metal
H+ Cl- H2OH+
Bulk Electrolyte
IR drop
Local pH &
Potential
3.8 Limitation of Pourbaix Diagram
• Tell us what can happen, not necessarily what will happen.
• No information on the rate of reaction.• limited to pure elements, pure water and 25°C.
• passivation criteria.