ir report nihon m&a center...balance sheet key data p07 paid-in stock options and performance...
TRANSCRIPT
Assisting companies to continue and prosper through M&A
30.7.2020
IRReportFinancial Results Report for Q1 FY2020
Year to March 2021 TSE 1st Section 2127
The information included in this presentation, such as industry trends and analysis, future plans and forecasts, is based on data available at the time of release. As the operating environment is subject to risks of large changes and uncertainties we make no guarantees regarding future plans or forecasts.
Nihon M&A Center

Copyright©2020 Nihon M&A Center Inc. All rights reserved. 1
Table of contents
Our Vision P02
To Become the Top Global Integrated M&A Company P03
Overview of Q1 FY2020 Results P04
Income Statement Key Data P05
Sales and Profit by Business Segment P06
Balance Sheet Key Data P07
Paid-in Stock Options and Performance Targets P08
Transaction Volumes P09
10-year Results Record P10
Number of Transactions Closed P11
Development of Ordinary Profit in Q1 P12
Number of Employees P13
FEATURE(1)~(8) P14~P22
Some information on Other Businesses(1)~(2) P23~P24
Dividend Payments and Market Capitalization P25
Dividend Per Share P26
Share Ownership P27
Our response to the increase in the coronavirus infection rate FY2020-Q1 and the impacts this has had P28
Number of Transactions Closed in Q1 (1/4) P29~P32
Company Overview P33
Introduction P34
Corporate Profile (End-June 2020) P35
Corporate History P36
Business Model A Platform for the M&A Market P37
Becoming an Integrated M&A Company P38
The strengths of Nihon M&A Center P39
Our Workflow as an M&A Intermediary P40
Our Organization Structure (from April 2020) P41
Human Resources Training P42
Human Resource Development Plan P43
Sustainability P44
CSR Initiatives P45
Distribution of the Age of Owners & Changes in the Average Age of Retirement P46
Strong Increase in Succession Outside Family P47
Future Projections for the Numbers of Companies and Workers P48
M&A Market Potential P49
Lastly P50

Copyright©2020 Nihon M&A Center Inc. All rights reserved. 2
Our Vision
Aiming to become the top global integrated M&A companyBecame Japan’s top M&A intermediary companyStart-up phase
1991 2001 2011 2021 (year)
Became Japan’s topM&A intermediary company
TSE Mothers listing in 2006
TSE 1st Section listing in 20071991
founding
「 Aiming to become the
top global integrated
M&A company 」

Copyright©2020 Nihon M&A Center Inc. All rights reserved. 3
To Become the Top Global Integrated M&A Company
Top market capitalisation in the M&A sectorMarket capitalisation
Motivation, personal development, remunerationEmployee satisfaction
Integrated solutionsProviding a full range of services, including PMI, strategic, financial and HR planning, as well as every kind of related activity
Expanding operations from very small customers to large ones (in different space from investment banks) increasing our global presence
Broad coverage
Eight leading qualities related to M&A that our group
is aiming to achieve
*Our aim is not to gain top rankings in league tables or among investment banks – it is to become the top global integrated company by achieving the eight qualities described above.
Number of mandated projects, number of transactrions closed
Number of projects
Valuation, execution
Quality control
Creating new industry standardsfor M&A
Innovation
Optimal matching and post-merger integration Customer satisfaction

Copyright©2020 Nihon M&A Center Inc. All rights reserved. 4
Overview of Q1 FY2020 Results
Sales and ordinary profit at record highsfor any Q1 period by overcoming Coronavirus crisis
while sales activity was restricted
FY2020
Q1(Result)
FY2019
Q1(Result) Change (yoy)
Sales(¥mn) 9,089 7,697 118.1%
Ordinary profit (¥mn) 4,876 3,928 124.1%

Copyright©2020 Nihon M&A Center Inc. All rights reserved. 5
Income Statement Key Data
(¥mn, %)
FY2020(Q1 Result) YoY
FY2019(Q1 Result)
FY2019(Full-year Result)
Total % % Total % Total %
Sales 9,089 100.0 +18.1% 7,697 100.0 32,009 100.0
(of which M&A sales) (8,924) (98.2) (7,520) (97.7) (31,191) (97.4)
Cost of sales 2,812 30.9 2,641 34.3 12,557 39.2
(of which referral fees and outsourcing expenses) (895) (9.9) (1,082) (14.1) (4,748) (14.8)
(of which personnel and transportation costs) (1,892) (20.8) (1,491) (19.4) (7,714) (24.1)
Gross profit 6,277 69.1 5,055 65.7 19,452 60.8
SGA expenses 1,389 15.3 1,159 15.1 5,204 16.3
Operating profit 4,887 53.8 +25.4% 3,896 50.6 14,247 44.5
Non-operating income 7 0.1 33 0.4 228 0.7
Non-operating expenses 18 0.2 1 0.0 7 0.0
Ordinary profit 4,876 53.7 +24.1% 3,928 51.0 14,467 45.2
Extraordinary gain 0 0.0 - - 214 0.7
Extraordinary loss 0 0.0 - - 0 0.0
Pretax profit 4,876 53.7 3,928 51.0 14,681 45.9Tax (corporation tax & other) 1,553 17.1 1,246 16.2 4,442 13.9
Net profit 3,323 36.8 +23.9% 2,681 34.8 10,239 32.0
Q1 sales : +18.1% yoy,
ordinary profit : + 24.1% yoy

Copyright©2020 Nihon M&A Center Inc. All rights reserved. 6
FY 2017 FY 2018 FY 2019(1Q) FY 2019 FY 2020(1Q)
Total % Total % YoY Total % % Total % % Total % YoY
Sales ① 24,625 100.0% 28,463 100.0% 115.6% 7,697 100.0% 129.1% 32,009 100.0% 112.5% 9,089 100.0% 118.1%
Direct costs*1 ② 3,716 15.1% 4,493 15.8% 120.9% 1,150 14.9% 115.4% 4,842 15.1% 107.8% 920 10.1% 80.0%
Gross profit (before unallocated cost of sales}
20,909 84.9% 23,969 84.2% 114.6% 6,547 85.1% 131.8% 27,167 84.9% 113.3% 8,169 89.9% 124.8%
M&A sales 24,321 100.0% 27,965 100.0% 115.0% 7,520 100.0% 128.2% 31,191 100.0% 111.5% 8,924 100.0% 118.7%
M&A cost of sales*2 3,578 14.7% 4,328 15.5% 121.0% 1,082 14.4% 115.4% 4,748 15.2% 109.7% 895 10.0% 82.7%
M&A gross profit 20,742 85.3% 23,636 84.5% 114.0% 6,438 85.6% 130.6% 26,442 84.8% 111.9% 8,029 90.0% 124.7%
Other sales 304 100.0% 497 100.0% 163.5% 176 100.0% 182.9% 818 100.0% 164.5% 165 100.0% 93.6%
Other cost of sales 137 45.1% 164 33.1% 120.0% 68 38.6% 116.0% 94 11.5% 57.1% 24 14.9% 36.0%
Other gross profit 167 54.9% 332 66.9% 199.2% 108 61.4% 286.8% 724 88.5% 217.6% 140 85.1% 129.8%
Unallocated cost of sales*3 ③ 5,413 22.0% 6,857 24.1% 126.7% 1,491 19.4% 116.7% 7,714 24.1% 112.5% 1,892 20.8% 126.9%
Gross profit(①-②-③) 15,495 62.9% 17,111 60.1% 110.4% 5,055 65.7% 137.0% 19,452 60.8% 113.7% 6,277 69.1% 124.2%
Sales and Profit by Business Segment
Breakdown of consolidated
sales and gross profit by M&A and other
*1 Direct costs include M&A cost of sales (referral fees, outsourcing expenses) and other cost of sales
*2 M&A cost of sales consists of referral fees and outsourcing expenses
*3 Unallocated cost of sales includes personnel costs, transportation costs, other
(¥mn)
Copyright©2020 Nihon M&A Center Inc. All rights reserved. 7
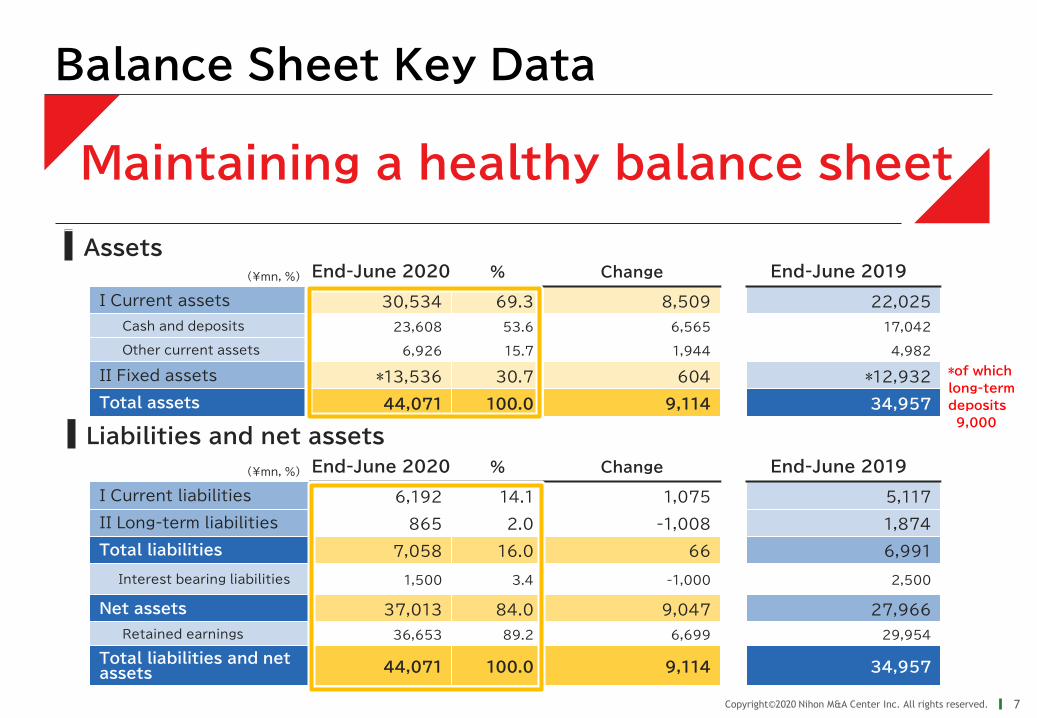
(¥mn, %) End-June 2020 % Change End-June 2019
I Current assets 30,534 69.3 8,509 22,025
Cash and deposits 23,608 53.6 6,565 17,042
Other current assets 6,926 15.7 1,944 4,982
II Fixed assets *13,536 30.7 604 *12,932
Total assets 44,071 100.0 9,114 34,957
【資産】
(¥mn, %) End-June 2020 % Change End-June 2019
I Current liabilities 6,192 14.1 1,075 5,117
II Long-term liabilities 865 2.0 -1,008 1,874
Total liabilities 7,058 16.0 66 6,991
Interest bearing liabilities 1,500 3.4 -1,000 2,500
Net assets 37,013 84.0 9,047 27,966
Retained earnings 36,653 89.2 6,699 29,954
Total liabilities and net assets 44,071 100.0 9,114 34,957
Balance Sheet Key Data
Maintaining a healthy balance sheet
Assets
Liabilities and net assets
*of which
long-term
deposits
9,000

Copyright©2020 Nihon M&A Center Inc. All rights reserved. 8
PeriodConditions on ordinary profit
(annual)
Ratio of exercisable paid-in stock options
Notes on ordinary income
1. FY2018Over
11.5 billion yen
¥12.53 bn With (1) and (2)
30% of all paid-in stock
options allotted2. FY2019
Over
12.5 billion yen ¥14.46 bn
3. FY2020Over
13.5 billion yen
30% of all paid-in stock options allotted
4. FY2021Over
15 billion yen
40% of all paid-in stock options allotted
Paid-in Stock Options and Performance Targets
Achieved FY2020 ordinary profit target (¥13.5 billion) in FY2019
➡ Aiming for early achievement of ¥15 billion target
FY2018 result
FY2019 result
* The maximum share issuance from paid-in stock options is equivalent to 2.7% of outstanding shares, exercisable on or after 1 July 2022
* In the event that ordinary income dips below 9 billion yen at any time between FY2018 and FY2021 the paid-in stock options cannot be exercised (regardless of other conditions)

Copyright©2020 Nihon M&A Center Inc. All rights reserved. 9
FY2017 FY2018 FY2019
Q1Fullyear
Q1 Q2 Q3 Q4Full
yearQ1 Q2 Q3 Q4
Full
yearQ1
1
Total number of transactions closed (by number of companies) *1
173 649 173 212 220 165 770 234 285 224 142 885 232
1-1Cumulative total for the financial year
173 - 173 385 605 770 - 234 519 743 885 - 232
2-1Number of sell-side transactions closed
83 323 89 106 106 81 382 118 145 114 72 449 116
2-2Number of buy-side transactions closed
90 326 84 106 114 84 388 116 140 110 70 436 116
3-1 M&A sales (¥mn) 6,422 24,321 5,867 8,268 8,228 5,601 27,965 7,520 9,814 8,249 5,606 31,191 8,924
3-2M&A sales/transaction (¥mn) *2
37.1 37.5 33.9 39.0 37.4 33.9 36.3 32.1 34.4 36.8 39.4 35.2 38.5
4-1Total number of transactions closed *1
91 332 89 110 115 88 402 119 145 114 73 451 118
4-2Cumulative total for the financial year
91 - 89 199 314 402 - 119 264 378 451 - 118
5Number of new sell-side mandates
152 773 243 287 218 255 1,003 221 251 240 261 973 243
Q1 transactions closed : the same level as last year (yoy base),
despite the Coronavirus crisis
*1 The total number of transactions closed by number of companies represents the sum of the number of completed sell-side and buy-side mandated transactions;the total number of transactions closed represents the number of transactions in which we were involved.
*2 This number represents M&A sales (including retainers and other fees) divided by the number of transactions closed (number of companies)*3 In almost all of our newly contracted mandates, we receive a retainer fee from the seller side.
(Units:number of deals, million yen)
FY2020
Transaction Volumes

Copyright©2020 Nihon M&A Center Inc. All rights reserved. 10
The number of transactions closed has been increasing steadily
420
524
649
770
885
0
100
200
300
400
500
600
700
800
900
2016/3期 2017/3期 2018/3期 2019/3期 2020/3期
Number of transactions closed
▲After the successful completion of an M&A transaction we hold closing ceremonies in all parts of the country. Nihon M&A Center has formed a specialist team for arrangement of these completion ceremonies.
Number of Transactions Closed
(Unit: transaction volume)
FY2015 FY2016 FY2017 FY2018 FY2019

Copyright©2020 Nihon M&A Center Inc. All rights reserved. 11
3,655 5,008
6,005 7,214
10,547
12,227
14,778
19,069
24,625
28,463
32,009
1,376 2,171 2,834 3,437
5,496 6,310
7,116
9,070
11,670 12,533
14,467
0
5,000
10,000
15,000
20,000
25,000
30,000
35,000
2010/3期 2011/3期 2012/3期 2013/3期 2014/3期 2015/3期 2016/3期 2017/3期 2018/3期 2019/3期 2020/3期
売上高
経常利益
10-year Results Record
10th consecutive period of higher sales and profit
Reach ¥5 bn
(¥mn)
Sales
Ordinary profit
Reach ¥10 bn
FY2018FY2016FY2015FY2014FY2013FY2012FY2011 FY2017FY2009 FY2010 FY2019

Copyright©2020 Nihon M&A Center Inc. All rights reserved. 12
337
451
582638
0
100
200
300
400
500
600
700
2018/3
期末
2019/3
期末
2020/3
期末
2020/3
1Q末
Number of EmployeesDespite temporarily putting recruitment activity on hold
due to the coronavirus crisis, headcount increased by 56 in Q1. We fully resumed recruitment activity in July
→ in response to strong M&A demand
End ofFY2017
End ofFY2018
End ofFY2019
End of June2020
M&A consultants,
specialists ※1
264 328 390 409
Supportstaff ※1
55 88 138 176
Administrationheadquarters,Internal auditoffice
18 35 54 53
Total 337 451 582 638
※2
※2
Number of employees
(Unit: Number of people)
Cost of sales
SGA expenses
End ofFY2017
End ofFY2018
End ofFY2019
End of June2020
※1 The definitions of M&A consultants/specialists and Support staff included in the total number of employees is as follows.
M&A consultants, specialists: sales personnel (including at subsidiaries); Mid-cap Support Office members; legal and accounting professionals specialized in M&A transaction support
Support staff: employees in corporate planning department, training department, internal sales, sales support in subsidiaries, IT support, Office of the President
※2 From Q1 FY2020 the cost of staff in IT support and the Office of the President (15 in total as at 1 April) has been included under Cost of Sales rather than SGA and so the headcount now comes under Support staff.
* Seconded employees are not included in the number of employees shown above
Graduate recruitment scheme impact from FY2018.

Copyright©2020 Nihon M&A Center Inc. All rights reserved. 13
Quarterly development of Ordinary Profit
1,896 2,278 3,631
2,592 3,928
4,876 1,773
3,359
3,536 4,362
5,317
2,257
2,058
3,256 3,874
3,757
1,188
1,375
1,247 1,703
1,463
0
2,000
4,000
6,000
8,000
10,000
12,000
14,000
16,000
2016/3期 2017/3期 2018/3期 2019/3期 2020/3期 2021/3期
1Q
第1四半期
第2四半期
第3四半期
第4四半期
Q1 ordinary profit at record high
Quarterly ordinary profit
(¥mn)
Q1
Q2
Q3
Q4
FY2015 FY2016 FY2017 FY2018 FY2019 End of June2020

Copyright©2020 Nihon M&A Center Inc. All rights reserved. 14
TOPICS(1)-1
Informing company owners nationwideabout the coronavirus crisis
Now is the time for a strategy with a strong partner to be resilient to risks!
The situation with limited business activity and the situation for ownersas measures are taken in Japan to prevent the spread of COVID-19 infection
Period of the declarationof a state of emergency
Easing following the period of thedeclaration of a state of a emergency
Dramatic change in the environmentfor economic activity
Experience ofunprecedentedconfusion over thenew situation
Break away from entrenched methodsDiversify areas of activityIncrease distribution channels
June 2020April – May 2020 During COVID-19 pandemic After COVID-19 pandemic
Review of future direction Execution of major structuralreforms to businesses
Bringing forward considerationsof a successorFuture uncertaintyImpoverishment bydepletion of capital
19 June – 20 July
Full utilisation of sales infrastructure to publicise our messagesDirect mail, website, web media, newspapers, seminars

Copyright©2020 Nihon M&A Center Inc. All rights reserved. 15
FEATURE(1)-2
Examples of measures taken
▲250,000 pamphlets distributed nationally (direct mail)
Informing company owners nationwideabout the coronavirus crisis
▲Providing information about COVID-19 impacts and responses, plus special urgent features in THE OWNER, our media platform for company owners
The world has changed. If your management style
doesn’t change now, there will be no “next”!

Copyright©2020 Nihon M&A Center Inc. All rights reserved. 16
FEATURE(2)
Webinars held
Period held Industry target
May 2020 Food, food manufacturing, food wholesale
May-June 2020 Open
June 2020 IT
June-July 2020 Logistics
June-July 2020 Construction
June-July 2020 Manufacturing
June-July 2020 Dispensing pharmacies
June-July 2020 Food
July 2020 IT
Period held Industry target
July 2020 Manufacturing
July 2020 Staffing services
July 2020 Dispensingpharmacies
July 2020 Food
July 2020 Healthcare
July 2020 Logistics
July 2020 Construction
July-Aug 2020 Open
Attention to quick follow through on opportunities for new mandatesarising from a limited amount of seminars during the coronavirus crisis
Launch of webinar programme
Following the ending of the declaration of the state of emergency, since June 30 have already
been held with over 2,000 registrations
▲Many industry specific seminars with themes such as “With coronavirus” and “Company growth post coronavirus”
Copyright©2020 Nihon M&A Center Inc. All rights reserved. 17
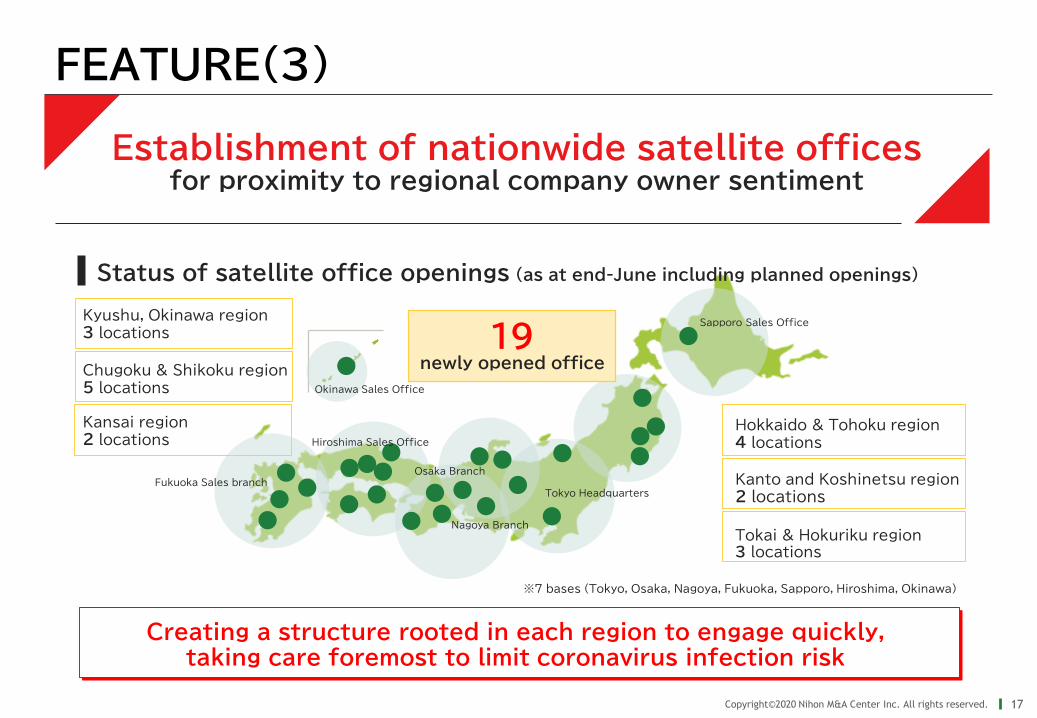
FEATURE(3)
Establishment of nationwide satellite officesfor proximity to regional company owner sentiment
Creating a structure rooted in each region to engage quickly, taking care foremost to limit coronavirus infection risk
Status of satellite office openings (as at end-June including planned openings)
Hokkaido & Tohoku region
4 locations
Kanto and Koshinetsu region
2 locations
Kyushu, Okinawa region
3 locations
Chugoku & Shikoku region
5 locations
Tokai & Hokuriku region3 locations
Kansai region
2 locations
Sapporo Sales Office
Tokyo Headquarters
Osaka Branch
Nagoya Branch
Fukuoka Sales branch
Hiroshima Sales Office
Okinawa Sales Office
※7 bases (Tokyo, Osaka, Nagoya, Fukuoka, Sapporo, Hiroshima, Okinawa)
19newly opened office

Copyright©2020 Nihon M&A Center Inc. All rights reserved. 18
FEATURE(4)
Announcement of 8th M&A Bank of the Year awards
Due to the coronavirus crisis the award ceremony was not heldas usual in a hotel. Instead the president of each recipient bank
received the award in a web-based ceremony including interviews.
M&A Bank of the Year criteria. Awards are made to banks with which we collaborate and are based on factors such as overall excellence of M&A results, individual transactions and contribution to the region. Award selection criteria include results, number of transactions, content of completed transactions, contribution to the region, new mandates, information development and strengthening of M&A organization.
Name of award Recipient bank
Bank of the Year
Hokuriku Bank
Award for contributionto the region
Hokkaido,Tohoku The 77 Bank
Kanto The Musashino Bank
Hokuriku,Koshinetsu Hokuriku Bank
TokaiShizugin Management
Consulting
Kinki The Shiga Bank
Chugoku, Shikoku Chugoku Bank
Kyushu, Okinawa The Miyazaki Bank
Deal of the Year
Hokuetsu Bank
Name of award Recipient bank
Deal of the Year
Toho Bank
Bank of Nagoya
The Iyo Bank
Award for information
development
Aomori Bank
North Pacific Bank
Special awards
The Tochigi Bank
The Tsukuba Bank
The Nanto Bank
The Tottori Bank

Copyright©2020 Nihon M&A Center Inc. All rights reserved. 19
FEATURE(5)
Now 4 locations in ASEAN
Establishment of presence in new ASEAN locations
Number of participants in live eventand visits to recording on Facetime
totalled over 1,000
Vietnam local office
4 locations overseas
Indonesia
Representative office
Singapore office
18 June Held a webinar for SME owners in Malaysia and Singapore
Theme:
“M&A strategy in the time of the coronavirus”
Malaysia
Representative office
Opened April 2016
Opened Oct 2019
Opened Feb 2020
Opened March 2020
Building a network centred on local presence➡ Creating alliances with financial institutions
and accountancy officesIncreasing also our own direct relationships
in each location
Spotlight - ASEAN news

Copyright©2020 Nihon M&A Center Inc. All rights reserved. 20
FEATURE(6)
Inclusion as member of MSCI World Index9 Japanese companies changed
We are the only M&A support specialist in any of these indices
31 August 2015
2 April 2018
29 May 2020
JPX-Nikkei Index 400
Nikkei 500 Stock Average
MSCI World Index
Indices in which we have been included to date (chronological order)

Copyright©2020 Nihon M&A Center Inc. All rights reserved. 21
FEATURE(7)
Focus on futurenew management structure
Independent directorTokihiko Mori
Independent directorAnna Dingley
Independent directorMinako Takeuchi
Audit & Supervisory Committee member
Iwao Hirayama
Audit & Supervisory Committee independent member
Yoshinori Yamada
Audit & Supervisory Committee independent member
Naoki KinoshitaFinance & accounting
Related activities, overseas business Sales
TOKYO PRO Market,Overseas business
Human resource development,corporate & management strategy
Finance, accounting,capital structure
Legal, risk management,internal control, governance
ChairmanYasuhiro Wakebayshi
PresidentSuguru Miyake
Vice PresidentTakamaro Naraki
Managing directorMasahiko Otsuki
Managing directorNaoki Takeuchi
DirectorTsuneo Watanabe
DirectorHideyuki Kumagai
Diversity of Board of Directors – variety in gender, nationality and age
M&A experience
M&A experience,strategy for sales & management
M&A experience;strategy for sales & management
M&A experience, new business area entry
=Newly appointed from June 2020
Corporate advisoryIndustry groups
Experience in corporate &management strategy, M&A

Copyright©2020 Nihon M&A Center Inc. All rights reserved. 22
Audit
FEATURE(8)
Strengthening ofcorporate governance structure
Establishment of voluntary Nomination Advisory Committee and Remuneration Advisory Committee1
Appointment of female and foreign directors2
Actively inviting independent directors to join the board3
The majority of the members of the NominationAdvisory Committee and the RemunerationAdvisory Committee are independent directors
The chairs of both committees are appointedfrom the independent directors
The ratio of female directors is15.4% (end-June 2020)
The ratio of independent directors is38.5% (end-June 2020)
Corporate governance structure
Shareholders General Meeting
Board of Directors
President
Au
dito
r
Audit and Supervisory Committee
Internal Audit Office
Appointments・Dismissals
Appointments
Audit
Supervision
BusinessExecution
InternalAudit
Internal Audit
Internal Audit
Administration
HQ
Sales HQ・General Planning HQ・President Management HQ
Discussion
Risk Management
Committee
Nomination Advisory CommitteeRemuneration Advisory Committee
Consulations Reports
Appointments・Dismissals
Appointments・Dismissals
Reports

Copyright©2020 Nihon M&A Center Inc. All rights reserved. 23
Some information on Other Businesses(1)
70
110
192
350376
0
50
100
150
200
250
300
350
400
17/3期末 18/3期末 19/3期末 20/3期末 21/3期…
2,709
7,039
24,436
42,872
47,291
0
5,000
10,000
15,000
20,000
25,000
30,000
35,000
40,000
45,000
50,000
17/3期末 18/3期末 19/3期末 20/3期末 21/3期…
Targeting the M&A needs of owners of small companies with under ¥100mn turnover,accounting for over 85% of all industry (individual operators included)
21/3期
1Q末21/3期
1Q末
User registrations Transactions completed Transactions
People
End-Mar2017
End-Mar2018
End-Mar2019
End-Mar2020
End-June2020
21/3期
1Q末End-Mar
2017End-Mar
2018End-Mar
2019End-Mar
2020End-June
2020
Online M&A matching site 「Batonz」
Copyright©2020 Nihon M&A Center Inc. All rights reserved. 24
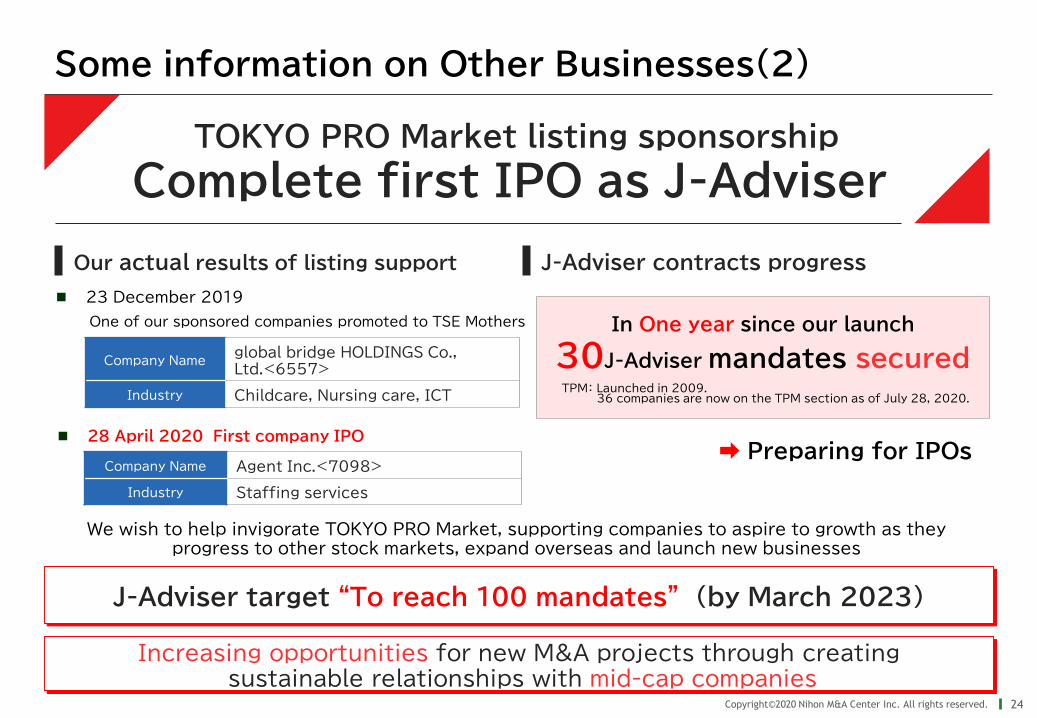
TOKYO PRO Market listing sponsorship
Complete first IPO as J-Adviser
Company Name Agent Inc.<7098>
Industry Staffing services
Increasing opportunities for new M&A projects through creatingsustainable relationships with mid-cap companies
Our actual results of listing support J-Adviser contracts progress
23 December 2019
One of our sponsored companies promoted to TSE Mothers
28 April 2020 First company IPO
In One year since our launch
30J-Adviser mandates secured
➡ Preparing for IPOs
We wish to help invigorate TOKYO PRO Market, supporting companies to aspire to growth as they progress to other stock markets, expand overseas and launch new businesses
J-Adviser target “To reach 100 mandates” (by March 2023)
Company Nameglobal bridge HOLDINGS Co., Ltd.<6557>
Industry Childcare, Nursing care, ICTTPM: Launched in 2009.
36 companies are now on the TPM section as of July 28, 2020.
Some information on Other Businesses(2)

Copyright©2020 Nihon M&A Center Inc. All rights reserved. 25
1,000
2,000
3,000
4,000
5,000
6,000
7,000
8,000
9,000
1,959
2,481
3,295
3,699
4,239
40.5 40.2 40.3
41.7 41.1
30
32
34
36
38
40
42
44
46
48
50
0
500
1,000
1,500
2,000
2,500
3,000
3,500
4,000
4,500
2016/3期 2017/3期 2018/3期 2019/3期 2020/3期
(%)
配当総額
配当性向
Market cap. as of
end-June 2020
¥808 bn
Dividend Payments and Market Capitalization
Aiming for sustained long-term growth
Dividends and the pay-out ratio Market capitalization(From end-Apr 2015)
(¥bn)(¥mn)
DividendsPay-out Ratio
FY 2015 FY 2016 FY 2017 FY 2018 FY 2019
900
800
700
600
500
400
300
200
100
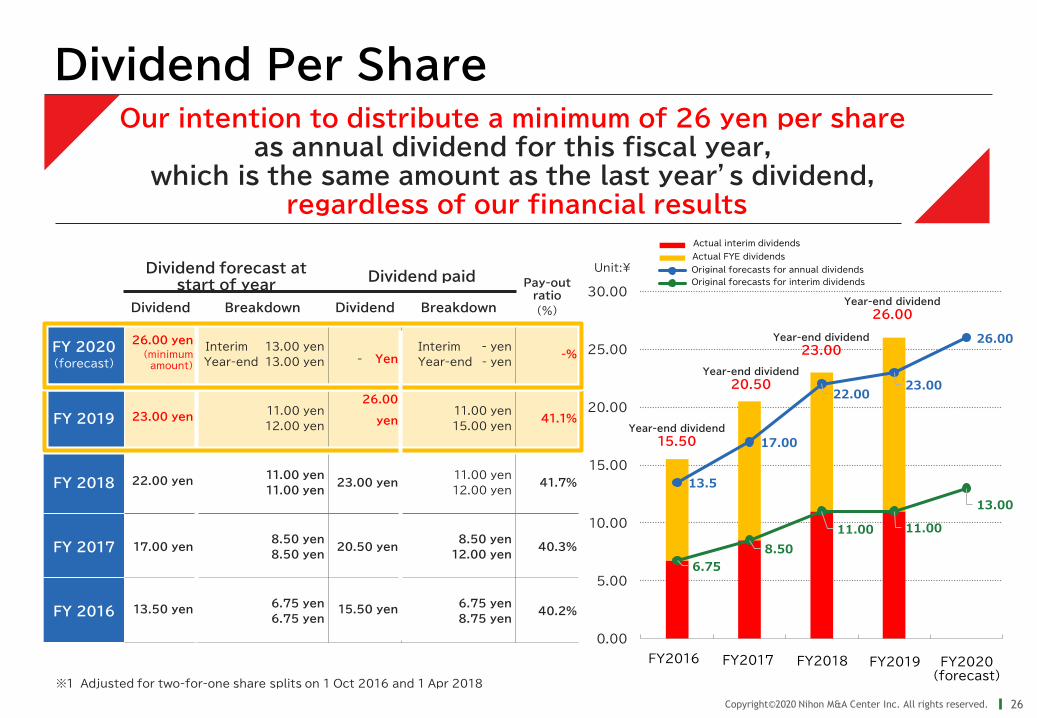
Copyright©2020 Nihon M&A Center Inc. All rights reserved. 26
13.5
17.00
22.0023.00
26.00
6.758.50
11.00 11.00
13.00
0.00
5.00
10.00
15.00
20.00
25.00
30.00
2017/3期 2018/3期 2019/3期 2020/3期 2021/3期(予想)
中間配当実績期末配当実績当初年間配当予想当初中間配当予想
Dividend forecast at start of year
Dividend paid Pay-out ratio
(%)Dividend Breakdown Dividend Breakdown
FY 2020(forecast)
26.00 yen
(minimum amount)
Interim 13.00 yen
Year-end 13.00 yen - YenInterim - yen
Year-end - yen-%
FY 2019 23.00 yen11.00 yen
12.00 yen
26.00
yen11.00 yen
15.00 yen41.1%
FY 2018 22.00 yen11.00 yen
11.00 yen23.00 yen
11.00 yen
12.00 yen41.7%
FY 2017 17.00 yen8.50 yen
8.50 yen20.50 yen
8.50 yen
12.00 yen40.3%
FY 2016 13.50 yen6.75 yen
6.75 yen15.50 yen
6.75 yen
8.75 yen40.2%
Year-end dividend
15.50
Year-end dividend
20.50
Year-end dividend
23.00
Our intention to distribute a minimum of 26 yen per share as annual dividend for this fiscal year,
which is the same amount as the last year’s dividend, regardless of our financial results
Year-end dividend
26.00
Dividend Per Share
Actual FYE dividends
Actual interim dividends
Original forecasts for annual dividends
Original forecasts for interim dividends
Unit:¥
FY2016 FY2017 FY2018 FY2019 FY2020(forecast)
※1 Adjusted for two-for-one share splits on 1 Oct 2016 and 1 Apr 2018

Copyright©2020 Nihon M&A Center Inc. All rights reserved. 27
Share Ownership
Foreign share ownership has now risen to 51.6%
Number of shareholders : 17,823
number of shares issued : 166,022,800
Foreign
51.6% Financial institutions
24.8%
Individuals19.5%
Other Corporations2.3%
Treasury stock1.8%Other Corporations
2.7%
Treasury stock1.8%
Foreign
46.8% Financial institutions
26.4%
Individuals22.3%
31 March 202030 September 2019
(of which trust banks and
life insurance companies circa 26%)
Number of shareholders : 16,229
number of shares issued : 166,065,200
(of which trust banks and
life insurance companies circa 24%)

Copyright©2020 Nihon M&A Center Inc. All rights reserved. 28
Our response to the increase in the coronavirus infection rate in FY2020-Q1 and the impacts this has had
Establishment of methods to minimize the risk of clients, partners and employees in our group contracting the disease1
Our main responses to the coronavirus problem 2
The influence of the coronavirus3
The number of people infected by COVID-19 is continuing to increase even now, and our policy is that we have a duty to prepare flawlessly the provision of appropriate solutions to all our clients throughout the country wishing to pursue M&A, at the same time continuously taking care over the risk of contracting the disease.
Establishment of satellite offices
Preparing a structure for remote working and introducing video conferencing systems
During the period of the declaration of the state of emergency it was difficult to have face to face sales activity, all kinds of seminar were cancelled or proposed, leading to tough conditions for any kind of sales activity. Nevertheless in our group we introduced an impactful slogan “Overcome the coronavirus crisis through innovation” throughout the organization, all the timeplacing top priority on the prevention of the spread of infection. And we could record historical highs for both sales and ordinary profit.
Hosting webinars
250,000 pamphlets distributed. Full-page advertisement in Nikkei newspaper.
Our financial forecasts and annual dividend forecast for FY20204Regarding our financial forecasts for this fiscal year to March 2021, meaningful calculations about the impact of the coronavirus are still difficult. We shall announce full year forecasts as soon as there is sufficient certainty for doing so.
With regard to annual dividend forecast for this fiscal year, we would like to distribute a minimum of 26 yen per share as annual dividend, which is the same amount as the last fiscal year, regardless of our financial results, as a show of appreciation to our shareholders who have supported our company even under the current uncertain outlook.

Copyright©2020 Nihon M&A Center Inc. All rights reserved. 29
Selling company Acquiring companyTransaction type
Industry classification Region Industry classification Region
1 Industrial machinery manufacture Kanto Other machinery manufacture Kansai Stock transfer
2 Pharmacy / drugstore Hokkaido, Tohoku Pharmacy / drugstore Kanto Stock transfer
3 Customised software development Kanto Manpower dispatching Kanto Stock transfer
4 Pharmacy / drugstore Hokkaido, Tohoku Pharmacy / drugstore Kanto Stock transfer
5 Metal parts wholesale Koshinetsu Metal parts wholesale Koshinetsu Stock transfer
6 Hospital Chugoku, Shikoku Nursing and welfare Chugoku, Shikoku Equity scheme
7 Pharmacy / drugstore Kyushu, Okinawa Pharmacy / drugstore Kansai Stock transfer
8 Construction rental / leasing Kanto Construction rental / leasing Kanto Stock transfer
9 Customised software development Kanto Electric components manufacture Kanto Stock transfer
10 Customised software development Koshinetsu Customised software development Kanto Stock transfer
11 Proprietary software development Kansai Truck transportation Kansai Stock transfer
12 Hospital Kanto Hospital Kanto Others
13 Truck transportation Tokai, Hokuriku Truck transportation Kansai Stock transfer
14 Proprietary software development Tokai, Hokuriku Proprietary software development Kansai Stock transfer
15 Interior finish work Kanto Building construction Kanto Stock transfer
16 Civil engineering contractor Hokkaido, Tohoku Building construction Hokkaido, Tohoku Stock transfer
17 Electric components manufacture Kanto Electric components manufacturing Kansai Stock transfer
18 Industrial machinery manufacture Kansai Industrial machinery manufacture Tokai, Hokuriku Stock transfer
19 Pharmacy / drugstore Koshinetsu Medical related services Koshinetsu Stock transfer
20 Pharmacy / drugstore Koshinetsu Pharmacy / drugstore Kanto Stock transfer
21 Resin parts processing Kansai Metal parts manufacture Kansai Stock transfer
22 Nursing and welfare Kansai Education Kansai Stock transfer
23 Nursing and welfare Kanto Clinic Kanto Business transfer
24 Clinic Kanto Medical related services Kanto Equity scheme
25 Property development / sales Kanto Other construction works Overseas Stock transfer
Number of Transactions Closed in Q1 (1/4)
118 transactions closed, 232 by number of companies

Copyright©2020 Nihon M&A Center Inc. All rights reserved. 30
Selling company Acquiring companyTransaction type
Industry classification Region Industry classification Region
26 Pharmacy / drugstore Tokai, Hokuriku Pharmacy / drugstore Kanto Stock transfer
27 Food wholesale Koshinetsu Food wholesale Kanto Stock transfer
28 Architect Kanto Building construction Hokkaido, Tohoku Stock transfer
29 Electrical and telecoms contractor Kansai Electrical and telecoms contractor Kansai Stock transfer
30 Truck transportation Tokai, Hokuriku Truck transportation Tokai, Hokuriku Stock transfer
31 Exterior finish work Hokkaido, Tohoku Life related services Kanto Stock transfer
32 Property management / sale Hokkaido, Tohoku Property management / sale Kanto Stock transfer
33 Civil engineering contractor Tokai, Hokuriku Building construction Tokai, Hokuriku Stock transfer
34 Nursing and welfare Tokai, Hokuriku Medical related services Kanto Equity scheme
35 IT related business Kanto Others Kanto Stock transfer
36 Restaurants Tokai, Hokuriku Food manufacture Chugoku, Shikoku Business transfer
37 Energy Kansai Energy Kanto Stock transfer
38 Web marketing Tokai, Hokuriku Sales promotion Tokai, Hokuriku Stock transfer
39 Industrial machinery wholesale Koshinetsu Industrial machinery wholesale Koshinetsu Stock transfer
40 Pipe contractor Chugoku, Shikoku Building construction Chugoku, ShikokuAbsorption-type
split
41 Clinic Kansai Clinic Kansai Others
42 Building construction Hokkaido, Tohoku Truck transportation Hokkaido, Tohoku Stock transfer
43 Pharmacy / drugstore Kansai Property development / sales Kansai Stock transfer
44 Electrical and telecoms contractor Hokkaido, Tohoku Electrical and telecoms contractor Hokkaido, Tohoku Stock transfer
45 Electrical and telecoms contractor Tokai, Hokuriku Education related services Tokai, Hokuriku Stock transfer
46 Metals parts processing Kanto Manpower dispatching Kanto Stock transfer
47 Taxi Hokkaido, Tohoku Food wholesale Hokkaido, Tohoku Stock transfer
48 Pharmacy / drugstore Kansai Pharmacy / drugstore Koshinetsu Stock transfer
49 Pharmacy / drugstore Kansai Pharmacy / drugstore Kanto Stock transfer
50 Metals parts processing Kansai Can manufacture / sheet metal Kansai Stock transfer
51 E-commerce services Koshinetsu Convenience goods wholesale KantoTransfer of equity
interests
52 Livestock farming Tokai, HokurikuAgricultural related manufacture /
salesTokai, Hokuriku Stock transfer
53 Plant engineering Kanto Life related services Kanto Business transfer
54 Nursing and welfare Kanto Nursing and welfare Kyushu, Okinawa Stock transfer
55 Energy Hokkaido, Tohoku Energy Hokkaido, Tohoku Stock transfer
56 Pharmacy / drugstore Hokkaido, Tohoku Pharmacy / drugstore Kansai Stock transfer
57 Electrical and telecoms contractor Hokkaido, Tohoku Building construction Hokkaido, Tohoku Stock transfer
Number of Transactions Closed in Q1 (2/4)

Copyright©2020 Nihon M&A Center Inc. All rights reserved. 31
Selling company Acquiring companyTransaction type
Industry classification Region Industry classification Region
58 Transportation related services Kanto Printing Tokai, Hokuriku Stock transfer
59 Pipe contractor Hokkaido, Tohoku Building construction Hokkaido, Tohoku Stock transfer
60 Customised software development Tokai, Hokuriku Customised software development Kanto Stock transfer
61 Construction materials wholesale Kanto Building construction Hokkaido, Tohoku Stock transfer
62 Pharmacy / drugstore Koshinetsu Pharmacy / drugstore Hokkaido, Tohoku Business transfer
63 Web marketing Kanto Printing Tokai, Hokuriku Stock transfer
64 Electrical and telecoms contractor Kanto Electrical and telecoms contractor Kanto Stock transfer
65 Packaging materials wholesale Kansai Packaging materials wholesale Kanto Stock transfer
66 Customised software development Kanto Customised software development Kanto Stock transfer
67 Pharmacy / drugstore Kyushu, Okinawa Pharmacy / drugstore Kyushu, Okinawa Stock transfer
68 Electrical and telecoms contractor Kanto Pipe contractor Tokai, Hokuriku Stock transfer
69 Pharmacy / drugstore Kanto Pharmacy / drugstore Hokkaido, Tohoku Business transfer
70 Property management / sale Koshinetsu Property management / sale Kanto Stock transfer
71 Truck transportation Hokkaido, Tohoku Truck transportation Kanto Stock transfer
72Convenience goods manufacture /
wholesaleTokai, Hokuriku Printing Tokai, Hokuriku Stock transfer
73 Pharmacy / drugstore Koshinetsu Medical related services Koshinetsu Stock transfer
74 Daily goods manufacture / wholesale KantoHousehold goods manufacture /
wholesale Kanto Stock transfer
75 Industrial waste management Kanto Industrial waste management Kanto Stock transfer
76 Education related services Tokai, Hokuriku Manpower dispatching Kyushu, Okinawa Stock transfer
77 Pharmacy / drugstore Tokai, Hokuriku Pharmacy / drugstore Tokai, Hokuriku Stock transfer
78Food manufacture /contract food
serviceKanto
Food manufacture /contract food service
Hokkaido, Tohoku Stock transfer
79 Truck transportation Kansai Truck transportation Kansai Stock transfer
80 Truck transportation Kansai Truck transportation Kansai Stock transfer
81 Industrial machinery wholesale Hokkaido, Tohoku Nursing and welfare Kanto Stock transfer
82 Can manufacture / sheet metal Chugoku, Shikoku Industrial machinery wholesale Chugoku, Shikoku Stock transfer
83 Civil engineering contractor Koshinetsu Construction materials wholesale Kyushu, Okinawa Stock transfer
84 Clinic Hokkaido, Tohoku Nursing and welfare Kanto Others
85 Building construction Kanto Building construction Kanto Stock transfer
86 Building construction Kanto Property development / sales Kanto Stock transfer
87 Hospital Tokai, Hokuriku Hospital Kanto Equity scheme
88 Restaurants Kansai Property development / sales Kansai Stock transfer
89 Building construction Kanto Property development / sales Tokai, Hokuriku Stock transfer
Number of Transactions Closed in Q1 (3/4)

Copyright©2020 Nihon M&A Center Inc. All rights reserved. 32
Selling company Acquiring companyTransaction type
Industry classification Region Industry classification Region
90 Interior finish work Kansai Building maintenance Kansai Stock transfer
91 Building maintenance Kansai Building maintenance Kanto Stock transfer
92 Nursing and welfare Tokai, Hokuriku Medical related services Kanto Equity scheme
93 Civil engineering contractor Chugoku, Shikoku Services for corporate customers Kanto Stock transfer
94 Civil engineering contractor Koshinetsu Private equity fund Kanto Stock transfer
95 Office for professional occupations Kanto Accounting firm Kanto Equity scheme
96 Clinic Kyushu, Okinawa Hospital Kyushu, Okinawa Business transfer
97 Industrial waste management Kanto Industrial waste management Koshinetsu Stock transfer
98 Construction materials wholesale Kansai Construction materials wholesale Kanto Stock transfer
99 Civil engineering contractor Kyushu, Okinawa Building construction Kyushu, Okinawa Stock transfer
100 Pipe contractor Hokkaido, Tohoku Building construction Hokkaido, Tohoku Stock transfer
101 Exterior finish work Tokai, Hokuriku Building construction Tokai, Hokuriku Stock transfer
102 Juwelry goods retail Kanto Apparel business Kanto Stock transfer
103Food manufacture /contract food service
Hokkaido, Tohoku Food wholesale Hokkaido, Tohoku Stock transfer
104 Leasing Kanto Leasing Hokkaido, Tohoku Business transfer
105 Sport Kyushu, Okinawa Entertainment Kansai Stock transfer
106 Hospital Kanto Clinic Kanto Equity scheme
107 Food manufacture Koshinetsu Food manufacture Koshinetsu Business transfer
108 Property management / sale Kanto Property management / sale Kanto Stock transfer
109 Food manufacture Kanto Food manufacture Koshinetsu Stock transfer
110 Industrial machinery manufacture Hokkaido, Tohoku Industrial machinery manufacture Tokai, Hokuriku Stock transfer
111 Pharmacy / drugstore Kanto Pharmacy / drugstore Kyushu, Okinawa Stock transfer
112 Industrial machinery wholesale Kanto Electric components manufacture Hokkaido, Tohoku Stock transfer
113 Pharmacy / drugstore Kyushu, Okinawa Pharmacy / drugstore Kanto Stock transfer
114 Pharmacy / drugstore Kanto Pharmacy / drugstore Hokkaido, Tohoku Business transfer
115 Building construction Tokai, Hokuriku Construction materials wholesale Kansai Stock transfer
116 Property management / sale Kanto Property management / sale KantoAbsorption-type split
117 Property business Kyushu, Okinawa Property business Kyushu, Okinawa Stock transfer
118 Food wholesale Hokkaido, Tohoku Food wholesale Kanto Stock transfer
Number of Transactions Closed in Q1 (4/4)
Company Overview
Copyright©2020 Nihon M&A Center Inc. All rights reserved. 34
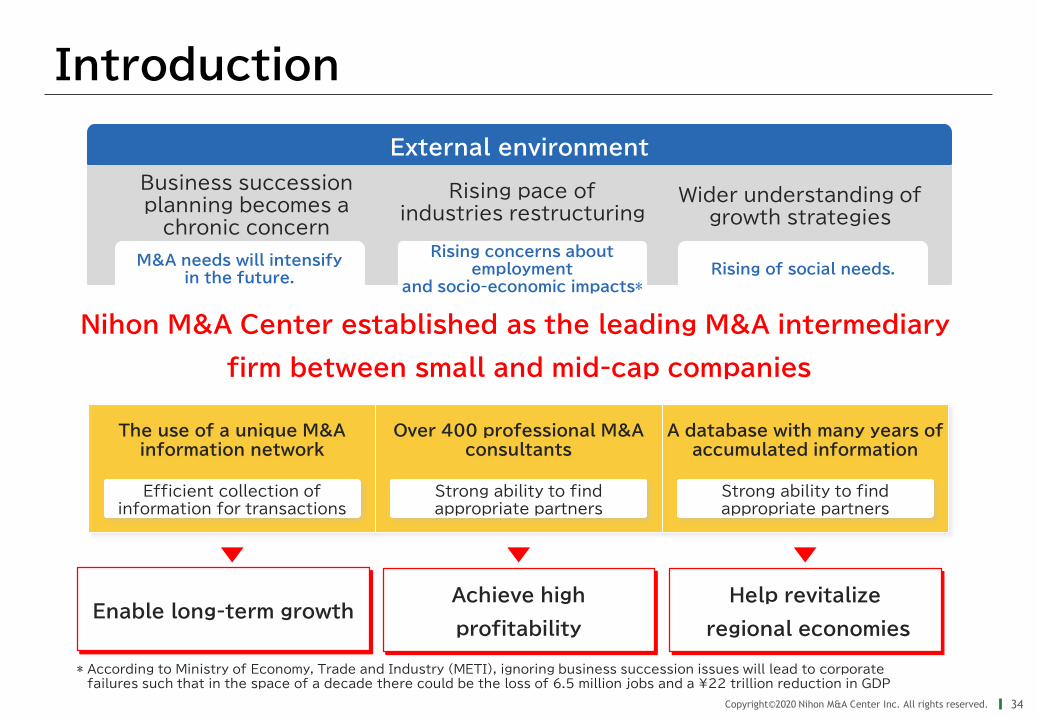
Introduction
Nihon M&A Center established as the leading M&A intermediary
firm between small and mid-cap companies
Enable long-term growthAchieve high
profitability
Help revitalize
regional economies
External environment
Business succession planning becomes a
chronic concern
Rising pace of industries restructuring
Wider understanding of growth strategies
M&A needs will intensifyin the future.
Rising concerns about employment
and socio-economic impacts*
The use of a unique M&A information network
Over 400 professional M&A consultants
A database with many years of accumulated information
Efficient collection of information for transactions
Strong ability to find appropriate partners
Strong ability to find appropriate partners
* According to Ministry of Economy, Trade and Industry (METI), ignoring business succession issues will lead to corporate failures such that in the space of a decade there could be the loss of 6.5 million jobs and a ¥22 trillion reduction in GDP
Rising of social needs.

Copyright©2020 Nihon M&A Center Inc. All rights reserved. 35
Company name Nihon M&A Center Inc.
Established April 1991
Business outline M&A support for small and medium-sized enterprises (SMEs)
RepresentativesChairman and founder Yasuhiro WakebayashiPresident Suguru Miyake
Offices
Domestic 7:Tokyo headquarters, Osaka branch, Nagoya branch, Fukuoka branch, Sapporo sales office, Hiroshima sales office, Okinawa sales office
Overseas 4:Singapore office, Indonesia representative office, Nihon M&A Center Vietnam co., LTD, Malaysia Representative Office
Paid-in capital ¥2.5 billionNumber of
shares issued 166,065,200
Market listingTokyo Stock Exchange
1st sectionStock code 2127
No. of employees(consolidated)
638(excluding 8 full-time directors)
Breakdown ofemployees by type
Consultants 409Other 229
Corporate Profile (End-June 2020)
Leading company in M&A intermediary services with a track record of over 5,500 completed transactions

Copyright©2020 Nihon M&A Center Inc. All rights reserved. 36
Corporate History
016年 4月
TPM(TOKYO PRO Market)
sponsor license
Createoverseasoffices
TSE 1st section
listing
TSE Motherslisting
Network of
regional financial
institutions
Chairman Yasuhiro Wakebayashi and President Suguru Miyake worked at Olivetti Japan. They had responsibility for sales of computers nationally to accounting firms and regional financial institutions. The current M&A network has evolved from their network at that time.
We established a nationwide M&A study group to expand our network with regional banks
formed a business alliance with Shinkin Central Bank, followed by a roll out of similar alliances with its subsidiary Shinkin Capital and shinkin banks throughout Japan.
Nihon M&A Center Inc. was founded with eminent certified public accountants and tax accountants nationwide at the core. Accounting offices throughout the country were organized into a network of regional M&A centers.
Shares were listed on the TSE Mothers Stock Exchange on 10 October 2006.
The company's stock was transferred from TSE Mothers to 1st Section on 10 December 2007 (a year and two months from listing on TSE Mothers, the fourth fastest such transfer)
May 2000
October 2006
April 1991
880 regional M&A centers as at end-June 2020
Alliances with 98 regional banks and 215 shinkin banks as at end-June 2020.
This was the first listing of a company in Japan specializing
in M&A intermediary services for SMEs.
Start first overseas office in Singapore
Open Indonesia representative office (October 2019)
Commence IPO support service
December 2007
★We have been profitable since the second year ofour history and have continuously paid a dividend
Company
founded
Prior to our
founding
1st inJapan
1st inJapan We were the first M&A intermediary services firm to list on the
TSE 1st Section.
April 2016
July 2019
Form company in Vietnam (February 2020)
Open Malaysia Representative Office(March 2020)

Copyright©2020 Nihon M&A Center Inc. All rights reserved. 37
Se
lle
rs
Bu
ye
rs
Accounting firms
…880 Regional M&A centers
Regional banks
…Collaboration agreements with 98 (out of a total of 102)
Shinkin banks
…Collaboration agreements with 215 (out of a total of 255)
Large financial institutions
…Nomura Securities Co.,Ltd.、Daiwa Securities Co. Ltd.、
MUFG Bank, Ltd.
Seminars, websites, direct mail
Industry Focus Team
(medical, pharmacy, logistics, construction, IT, Food)
private equity
Information
Direct information
Information
Information
Business Model A Platform for the M&A Market
Top M&A information network
Nihon M&A Center
Collaboration agreement figures as of end-June 2020
Information
Information

Copyright©2020 Nihon M&A Center Inc. All rights reserved. 38
Becoming an Integrated M&A Company
Nihon M&A Center becoming a hub for specialized high quality group companies
M&A support services
Internet
matching
Private equityfunds
Nihon M&A Center
Batonz Co., Ltd.
Yano Research Institute Ltd.
Corporate Value Laboratory Inc.
Japan PMI consulting Inc.
Japan Private
Equity Co., Ltd.
Japan Investment
Fund Inc.
Full M&A support services
PMI consulting services
Internet matching service for micro enterprises
Private equity fund supporting business
succession
Private equity fund to support growth strategy
PMINegotiation,
closing
Introductions, dialogue with
principalsCompany valuation
Start ofproject
Market researchSuccession and asset consulting
ZUUM-A
Media
platform
operator
Information services
Corporate valuation
Business succession,
growth strategy consulting
market research
(Joint venture
with ZUU)
(Joint venture with
Kyodo News Group)(Joint venture with
Aoyama Zaisan Networks)
(joint venture with Development Bank of Japan)
(joint venture with Development Bank of Japan)
Business Succession Navigator Inc.

Copyright©2020 Nihon M&A Center Inc. All rights reserved. 39
The strengths of Nihon M&A Center
Never let any competitor catch upDifferentiation through service,
superiority without competing on price
1.Strong systems for developing
valuable information
2.Powerful matchmaking
capability
3. High level of M&A expertise and
knowledge of the industry
4.Highly trusted
Very strong network for M&A information
Regional financial institutions, accountants, large financial institutions, other
Top in the industry with over 400 well organized specialist M&A consultants
Database which has accumulated information for a long period of time.
30 or so people with legal, accounting and tax qualifications
(lawyers, notaries, certified public accountants, tax accountants)
A wealth of in-house expertise, finding M&A solutions in a timely way with M&A processes
Pioneer in SME M&A with an outstanding track record
29 years of history, over 5,500 successful transactions
Integration
Several subsidiaries which specialise in all the processes, from company valuation to post-merger integration (PMI)

Copyright©2020 Nihon M&A Center Inc. All rights reserved. 40
Our Workflow as an M&A Intermediary
BuyerSeller
Presenting investment memorandum
Signing of confidentiality agreement
Explanation of teaser (anonymous)
Signing of advisory agreement
Provision of detailed information
Due diligence
Signing of letter of intent
Negotiation of price & terms
Management meeting, site visits
Negotiation of final terms
Signing of definitive agreement
Completion, settlement, announcement
Preparation of investment memorandum
Preparation of teaser (anonymous)
Company analysis, sector research, selection of potential buyers
Valuation
Provision of materials
Signing of advisory agreement
Consultation
Retainer
fee
Interim
fee
Retainer
fee
Success
fee
Success
fee
Nihon M&A Center

Copyright©2020 Nihon M&A Center Inc. All rights reserved. 41
AdministrationH.Q.
Board of Executive Officers
ITS
olu
tion
sD
ep
t.
Co
rpo
rate
Ad
vis
ory
Offic
e
Me
dic
al
&N
urs
ing
Care
De
pt.
Ind
ustria
lR
estru
ctu
ring
De
pt.
Le
gal
Ad
vis
ory
Offic
e
Dire
ct
Mark
etin
gD
ep
t.
Co
rpo
ratio
ns
De
pt.
Chairman
Board of Directors
IRO
ffice
AccountingCh.
StrategyMgmt. Div.
TPMDiv.
Co
rpo
rate
Pla
nn
ing
Offic
e
Tra
nsactio
nM
gm
t.S
ec.
Mid
-Cap
Su
pp
ort
Se
c.
Law
ye
r / Ju
dic
ial s
criv
en
er
Stre
ng
the
nin
g o
f m
atc
hin
g a
ctiv
ities
CP
As /
Tax a
cco
un
tan
ts
Fo
cu
sin
g in
ind
ustrie
s
facin
g w
ith re
org
an
izatio
n
Me
dic
al a
nd
nu
rsin
g c
are
Dire
ct s
earc
h fo
r p
ote
ntia
l bu
ye
rs
Dire
ct m
ark
etin
g
Ne
two
rk s
earc
h fo
r p
ote
ntia
l bu
ye
rs
Priv
ate
eq
uity
M&
A
Pro
mo
tion
of M
&A
g
row
th s
trate
gy
Co
ord
inatio
n w
ith la
rge
fin
an
cia
l institu
tion
s
Co
ord
inatio
n w
ith
acco
un
ting
offic
es
Co
ord
inatio
n w
ith re
gio
nal
finan
cia
l institu
tion
s
Cu
sto
me
r satis
factio
n,
sale
s p
rom
otio
n, P
R
Info
rmatio
n s
yste
ms,
IT d
eve
lop
me
nt, d
ata
mark
etin
g
IP
O s
po
nso
rsh
ip
IPO
pro
mo
tion
B
us. d
eve
lop
me
nts
A
SE
AN
pro
mo
tion
O
utb
ou
nd
M&
A p
rom
otio
n
StrategyPromotion
Mgmt.Div.
HR FirstMgmt.Div.
AllianceMgmt. Div.
RegionalFinancial
InstitutionsCh.
LargeFinancial
InstitutionsDiv.
General Planning H.Q.
Acco
un
tan
tsD
ep
t.
Re
gio
nal
Fin
an
cia
lIn
stitu
tion
sD
ep
t.
Larg
eFin
an
cia
lIn
stitu
tion
sD
ep
t.
Acco
un
tan
tsIn
form
atio
nD
eve
lop
me
nt
De
pt.
Co
rpo
rate
Stra
teg
yD
ep
t.
Priv
ate
Eq
uity
De
pt.
Gro
wth
Stra
teg
yD
ep
t.
Allia
nce
sD
ep
t.
ISR
Offic
e
Pro
ject
Activ
atio
nS
ec.
Sales H.Q.
IndustryFocusDiv.
CorporateAdvisory
Mgmt. Div.
Hu
man
Re
so
urc
es
De
pt.
Ge
ne
ral
Affa
irsD
ep
t.
Acco
un
ting
De
pt.
Related GroupCompanies
H.Q.
InternationalDiv.
IR
、ESG
Pro
mo
tion
for
ne
w m
an
date
s
Insid
e s
ale
s
Exam
inatio
n a
nd
pro
ce
ss
co
ntro
l of m
an
date
s
Activ
atio
n o
f slo
w-m
ovin
g p
roje
cts
Su
pp
ort b
y m
id-c
ap
sp
ecia
lize
d C
PA
s
Se
rvic
e fo
r liste
d
co
mp
an
ies
Our Organization Structure (from April 2020)
S
trate
gy P
rom
otio
n
Co
rpo
rate
Bra
nd
ing
H
R s
trate
gy
D
eve
lop
me
nt S
up
po
rt
Shareholders Annual General Meeting
Audit and other committees
President
Internal Audit Office
President Mgmt. H.Q.
Transaction Mgmt. Div.
Matc
hin
gM
gm
t.S
ec.
Sale
sP
lan
nin
gD
ep
t.

Copyright©2020 Nihon M&A Center Inc. All rights reserved. 42
Human Resources Training
It takes 6-12 months to get an overall understanding of M&A, but we always have several M&A transactions on the go, enabling employees to gain a lot of practical experience in a short space of time
Subsidy system for training of new recruits and further development of key employees
Internal training External training
Training for new recruits Improvement for every level Regular training
Understanding of our company and management principals of our chairman
M&A project flow
Creating company profiles
Company valuation
Matching of companies
Use of databases for projects
Role playing
Success and failure analysis
M&A special structures
M&A by industry type (when required)
M&A related tax/legal regulation change
Sales technique
Off-sites with senior management
Future generation leadership
Leaders training
Presentations and public speaking.
Monthly training Compliance
Information security systems
Annual training Overseas visits(high performers)
Management principals explanation meeting・Training for all employees
Dale Carnegie course
Management training
Coaching
Ritsumeikan University Saionji leadership course
Lee Kuan Yew School of Public Policy short graduate programme
Education
subsidies
Training inexperienced employees to develop quickly into M&A specialists
Training M&A specialists to reach a more senior level
Bookkeeping Level 2 Business succession,
M&A expert qualifications
Public accountant, tax accountant,social security officer,SME advisor and equivalents
Contribution to cost of purchase of specialist textbooks
English conversation

Copyright©2020 Nihon M&A Center Inc. All rights reserved. 43
Human Resource Development Plan
A layered approach for thoroughness. We aim to achieve fast results from the training
layer
0
layer
1
layer
2
layer
3
layer
4Creating and implementing growth strategies for our company.
General managers and above.
Voluntary applicants and selected employees from fourth year of entry to assistant general manager level.
Reiwa trainingGaining knowledge through collaboration
between colleagues throughout the firm
Gaining practical knowledge and developing a
high-level perspective by vision sharing with
senior executives and management
Senior executives
Management
Future leaders
Selected new recruits
All new recruits
For
Goal
Senior executive officers and above.
Deepening awareness of future leadership responsibilities.
For
Goal
For
Goal
Developing a high-level perspective and receiving the education necessary to carryout one's role as a top-class businessperson.
Gaining management skills.
For
Goal
30 selected front office consultants with up to three years of experience at the company
To understand fully and put into practice our corporate knowledge culture, maximizing the performance of each individual
Core to strengthened training plan
Evaluation
Management interviews
Senior level offsites
Future leader offsites
(次世代管理職研修)We now provide training for newly appointed
administrative staff members internally rather than outsourcing – enabling to be tailored
to the company needs.
Selection of group leadersGaining management skills as group leader.
training for future administrators
Executive offsites
Management meetings
Gaining knowledge through collaboration between colleagues throughout the firm
“Challenge-Reiwa” training(Encourage refreshment of skills outside office hours)
For
Goal
Front office consultants with up to three years of experience at the company
Gaining ability to get advisory mandates from potential clients

Copyright©2020 Nihon M&A Center Inc. All rights reserved. 44
Sustainability
Environmental Social and Governance (ESG) practice
Important topics Our main policiesEn
v
Society orientatedtowards recycling
Decreasing the environmental burden Use of public transport, promoting use of IT, reduction of unnecessary printing
So
cia
l
Employment practices
Employee satisfaction
Employee reviews(twice per year), “secret letter” to CEO system、ranked fourth in the category of employee satisfaction in the 2018 Fisco institutional investor and analyst industrial research award(published on 18 February 2019)
Respect for human rights and promotion of diversity
Discrimination prohibited; promotion of activities by females; medium-term target of 30% for female employees across the group
System for increasing motivation Stock option plan
Promotion of communication Subsidies for events including tennis, basketball, 5-a-side football and running
Health and safetyCreation of a safe and healthy workplace
Health and stress checks, subsidies for spouse health checks, vaccinations to prevent influenza, health advice from occupational health and safety specialist
Human development Education system (See pages 37-38 of this document)
Go
ve
rna
nce
Corporate governance
Corporate governance systemRatio of 1:3 of non-executive directors, corporate governance system( https://www.nihon-ma.co.jp/corporate/businessbase.html ), establishment of committees for audit and other, Nomination and Remuneration committee
Internal control systemEstablishment of internal regulatory system ( https://www.nihon-ma.co.jp/ir/pdf/report_governance1906.pdf ), strict scrutiny of M&A projects
10 guiding principals for compliance behaviour
Periodic training for all employees in the 10 selected guiding principals for compliant behaviour
Internal communication system Employee communication protocols codified
Risk managementRisk management committee Creation of risk management committee
Response to incidents Objectives (1)No highly serious incidents to occur (2)Strive to prevent
occurrence of incidents
Information securityInformation security maintained andISO27001accredition
Implementation of information security systems and oversight policies
Information security policy created (https://www.nihon-ma.co.jp/corporate/security_policy.html)
ISO27001international standard obtained ※All domestic branches, foreign offices excluded

Copyright©2020 Nihon M&A Center Inc. All rights reserved. 45
CSR Initiatives
Our commitment to support amicable M&A contributes to the sustainable growth ofsociety by reinforcing mangement foundations and growth in employment
Other activities contributing to society
・Donations following natural catastrophes・Education support (scholarships) in areas impacted by natural
catastrophes・Cultural sponsorship(support for young artists in film production,
Noh, opera,photography and other)・Protection of designated Cultural Properties
Overview of our group CSR policaies
"Continuously improving our corporate value"
Enhancing the social contributions of our business operations through activities that involve corporate citizens
Clients
Partners
Global environmentEmployees
Shareholders
Business activities
Social issues
Activities with corporate citizens
Creating value
Providing solutions to
social issues
through business activities
Regional communities
¥
After 3 years¥906.6bn
Avoidance of
economic loss
¥327bnEmployment creation
29,687 people
In FY2019 we acted as an
M&A intermediary for 403 companies
After 5 years¥1,453.4bn
In 10 years¥2,644.5bn
FY2018 contribution to avoidance of economic loss ※1
Sell-side advisor for 403 transactions in which combined turnover of companies sold was ¥302.4bn
※1 Source: Yano Research Institute Ltd
“Contributing to sustainable social development"
Developing business operations to solve social
issues

Copyright©2020 Nihon M&A Center Inc. All rights reserved. 46
Source: White Paper on Small and Medium Enterprises in Japan (26 April 2019)
Distribution of the Age of Owners & Changes in the Average Age of Retirement
Highest average age category of SME owners has risen to 69 (Figure1)Rising average retirement age (Figure 2)
0
5
10
15
20
25
15~19 20~24 25~29 30~34 35~39 40~44 45~49 50~54 55~59 60~64 65~69 70~74 75~79 80~
(%)
In 2015In 2010In 2005In 2000In 1995In 2018
61.3
66.1
67.5 67.8 67.762.6
68.1
69.870.7 70.5
56
58
60
62
64
66
68
70
72
30年以上前 20~29年前 10~19年前 5~9年前 0~4年前
(事業承継時間)
小規模事業者
中規模企業
The peak in owners average age has risen from 47 to 69 in 23 years
Age distribution of SME owners (in 5-year categories) Changes in owners average retirement age
Source: Small and Medium Enterprise Agency, Discussion forum for corporate revitalization, focus on succession (1st in series)
Data source: Corporate Profile Database (COSMOS 2) by Teikoku Databank, Ltd
Note: Since ages are in 5-year categories the peak on the chart is the same in 2015 and 2018, but underlying data shows the peak to have increased by three years in this period.
(Age)
(Age)
Small companies
Medium-size companies
5-910-1920-29Over30 0-4
Time of succession (number or years ago)

Copyright©2020 Nihon M&A Center Inc. All rights reserved. 47
親族内承継
Strong Increase in Succession Outside Family
Succession outside family has increased to over 65%
Source: Small and Medium Enterprise Agency, Discussion forum for corporate revitalization, focus on succession (1st in series)
Relatives Children Relatives who are not children
OtherDirectors/employees who are not relatives
Outsiders
Shift in background of company presidents viewed by length of term of office
9.2
7.4
9.6
12.4
9.3
14.5
9.5
7.6
3.7
6.5
11.7
9.1
12.1
17.6
24.4
26.4
3.7
3.7
3.2
5.5
11.7
10.9
20.6
39.3
0% 10% 20% 30% 40% 50% 60% 70% 80% 90% 100%
Relatives
35 - 40 years
30 - 35 years
25 – 30 years
20 – 25 years
15 – 20 years
10 – 15 years
5 – 10 years
0 – 5 years
Other 65.7%
83.5
82.5
75.5
73
66.9
57
45.5
26.7

Copyright©2020 Nihon M&A Center Inc. All rights reserved. 48
Future Projections for the Numbers of Companies and Workers
Number of companies to decrease by 830,000
within the next 10 years
*Basis for calculation: end-2015 = 100%
End-2015End-2020
End-2025
End-2030
End-2035
End-2040
Number of companies
(,000)
4,025 3,607 3,195 3,103 3,014 2,956
100% 90% 79% 77% 75% 73%
Working population
(,000)
58,457 55,054 51,460 49,553 47,693 45,981
100% 96% 89% 86% 83% 80%
Working age
population(,000)
77,282 74,058 71,701 68,754 64,942 59,777
100% 96% 93% 89% 84% 77%50%
60%
70%
80%
90%
100%
2015年 2020年 2025年 2030年 2035年 2040年
企業数
就業人口数
生産年齢人口数
4.03 million companies
in 2015
*Includes individual business proprietors
3.2 million companies
in 2025
Sources : Numbers of companies and workers - Estimates of Future Numbers of Companies and Employees by Region, Yoshiaki Murakami, Naomi Kodama and Yoshio Higuchi, from Financial Review published June 2017 by the Policy Research Institute, Ministry of Finance, JapanWorking age population - Regional Population Projections for Japan“ (statistics from 2018)Estimates of Future Numbers of Companies and Employees by Region - Population Decline and Local Economies, by the Policy Research Institute, Ministry of Finance, Japan
Number of companies
Working age population
Working population
2015 2020 2025 2030 2035 2040

Copyright©2020 Nihon M&A Center Inc. All rights reserved. 49
EmployeesNumber ofcompanies
Ratio of companies
with no successor
Number of companies
with no successor
Sales per M&A
transaction
M&A market
sizeOur position/initiative
100~300 48,673 × 48.40% = ¥23,558 ¥50 mn
¥23
trillion
New market to developTaking measures to
increase our presence
20~99 535,783 × 63.00% = ¥350,151 ¥30 mn
Established with dominant network
Expanding presence as top brand
1~19 3,003,013 × 75.00% = ¥2,252,260 ¥5 mnMostly domain of
our subsidiary BatonzHigh growth segment
M&A Market Potential
Note: These estimates are based on data from sources including Small and Medium Enterprise Agency, Ministry of Internal Affairs and Communications,
METI、Teikoku Data Bank, as well as Nihon M&A Center completed transactions in April 2016 – September 2019
There is a potential market in excess of ¥20 trillion
Business succession potential market estimate
In addition, M&A arising from restructuring of industries and growth strategies, unrelated to business succession(20% of our sell-side transactions completed in FY2018 were for companies with a CEO under 50 years old)

Copyright©2020 Nihon M&A Center Inc. All rights reserved. 50
Contact : https://www.nihon-ma.co.jp/action/contact/ IR page URL: https://www.nihon-ma.co.jp/ir/ English website URL : https://www.nihon-ma.co.jp/en/about/investors/
Lastly
Management principles Company goal
Increase in market value together with stability and growth in dividends
Return profits to shareholdersIncrease market value
Assisting companies to continue and prosper through M&A
We aim to increase market value through high profitability
and growth
Management priority on adherence to compliance and corporate social responsibilityBuilding up higher level governance structure
Ⅰ. Management principles
Ⅱ. To investors