ipsos mori veracity index 2018 - biz-file.com · veracity index 2018 | november 2018 | version 1 |...
TRANSCRIPT

Veracity Index 2018 | November 2018 | Version 1 | Internal Use Only
© 2016 Ipsos. All rights reserved. Contains Ipsos' Confidential and Proprietary information and may
not be disclosed or reproduced without the prior written consent of Ipsos.
1
2018
Ipsos MORI Veracity Index
© 2018 Ipsos. All rights reserved. Contains Ipsos' Confidential and Proprietary information
and may not be disclosed or reproduced without the prior written consent of Ipsos.

2Veracity Index 2018 | November 2018 | Version 1 | Internal Use Only
Veracity Index 2018 – all professions
96%92%
89%87%
86%85%
83%78%
76%62%62%62%62%
52%48%
45%41%
40%34%
30%26%
22%19%
16%
Nurses
Doctors
Teachers
Engineers
Professors
Scientists
Judges
Members of the Armed Forces
The Police
Television news readers
Clergy/priests
The ordinary man/woman in the street
Civil Servants
Pollsters
Charity chief executives
Trade union officials
Bankers
Local councillors
Business leaders
Estate agents
Journalists
Government Ministers
Politicians generally
Advertising executives
“Now I will read you a list of different types of people. For each would you tell me if you generally trust them to tell the truth, or not?”
% trust to tell the truth
Base: 1,001 British adults aged 15+, fieldwork 12 - 21 October 2018

3Veracity Index 2018 | November 2018 | Version 1 | Internal Use Only
The five most trusted professions, 2018
96%
92%
89%
87%
86%
Nurses
Doctors
Teachers
Engineers
Professors
% trust to tell the truth:
Base: 1,001 British adults aged 15+, fieldwork 12 – 21 October 2018
2017 score:
94%
91%
87%
-
85%
4Veracity Index 2018 | November 2018 | Version 1 | Internal Use Only
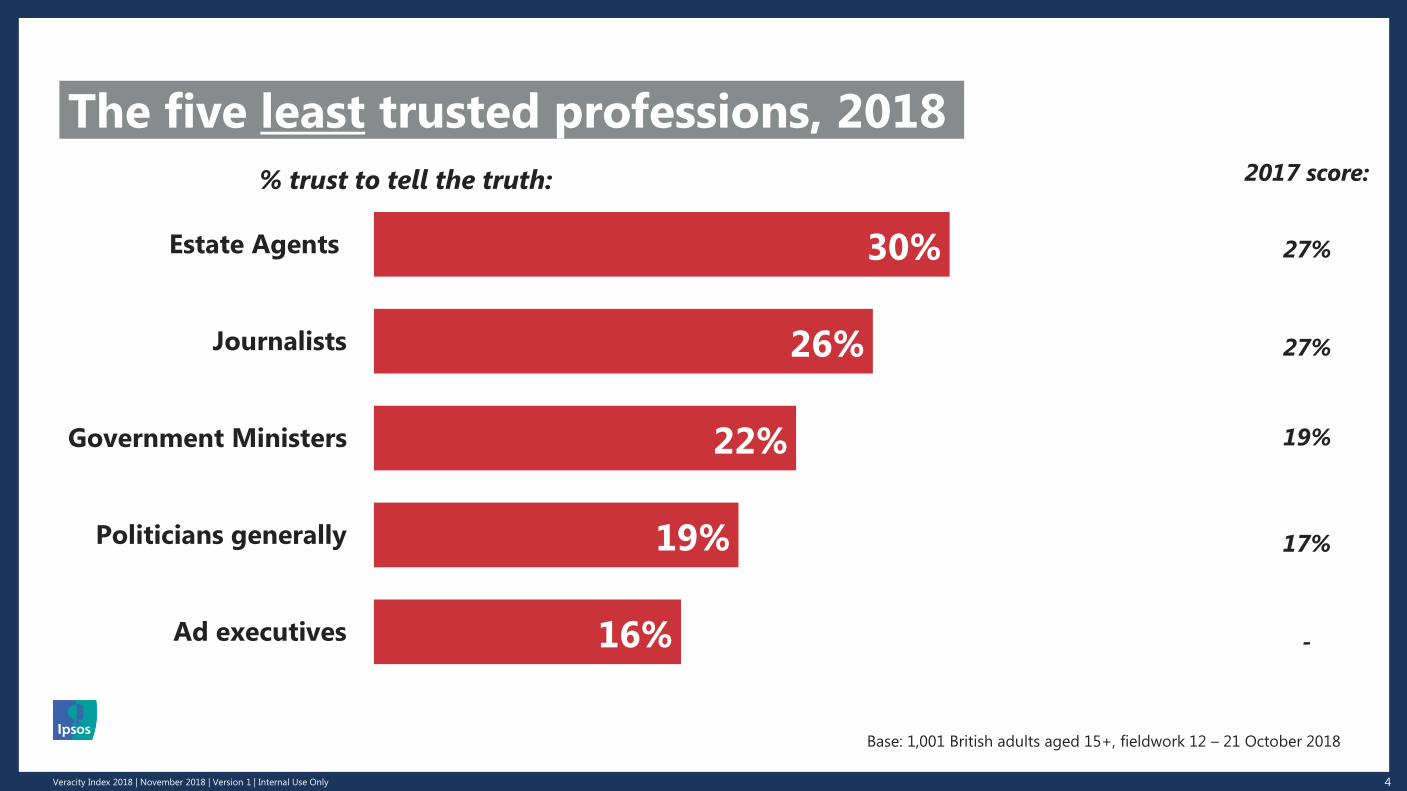
The five least trusted professions, 2018
30%
26%
22%
19%
16%
Estate Agents
Journalists
Government Ministers
Politicians generally
Ad executives
% trust to tell the truth:
Base: 1,001 British adults aged 15+, fieldwork 12 – 21 October 2018
2017 score:
27%
27%
19%
17%
-

5Veracity Index 2018 | November 2018 | Version 1 | Internal Use Only
9385
80 78 77 73 7061
56
30 30 29 29
122
-100
-50
0
50
100
-1
-14 -16-26
-37-44
-51-59 -63
-100
-50
0
50
100
Net trust in professions 2018
Nurses Doctors Teachers Engi-
neers
Profe-
ssors
Scien-
tists
Judges Armed
Forces
Members
The
Police
Man/
woman
in the
street
Civil
Servants
TV
News
Readers
Clergy/
priests
Pollsters Charity
Chief
Execs
Trade
Union
officials
Local
council-
llors Bankers
Business
Leaders
Govt.
Ministers
Journ-
alists
Estate
Agents
Politic-
ians
Ad
Execs
Base: 1,001 British adults aged 15+, fieldwork 12 – 21 October 2018
Net trust = % trust to tell the truth - % do not trust to tell the truth

6Veracity Index 2018 | November 2018 | Version 1 | Internal Use Only
Key movers in public trust over time
0
25
50
75
100
1983 1988 1993 1998 2003 2008 2013 2018
% trust to tell the truth:
Base: c. 1,000 British adults aged 15+ per year
Doctors – 92% (+10 ppt since 1983)Teachers – 89% (+10 ppt since 1983)Professors – 86% (+16 ppt since 1993Scientists – 85% (+22 ppt since 1997
The Police – 76% (+17 ppt since 1983)
Clergy/Priests – 62%
(-23 ppt since 1983)
Civil Servants – 62%
(+37 ppt since 1983)
Trade Union officials – 45%
(+27 ppt since 1983)
Bankers – 41% (+12 ppt since 2011)
Journalists – 26% (+7 ppt since 1983)
7Veracity Index 2018 | November 2018 | Version 1 | Internal Use Only
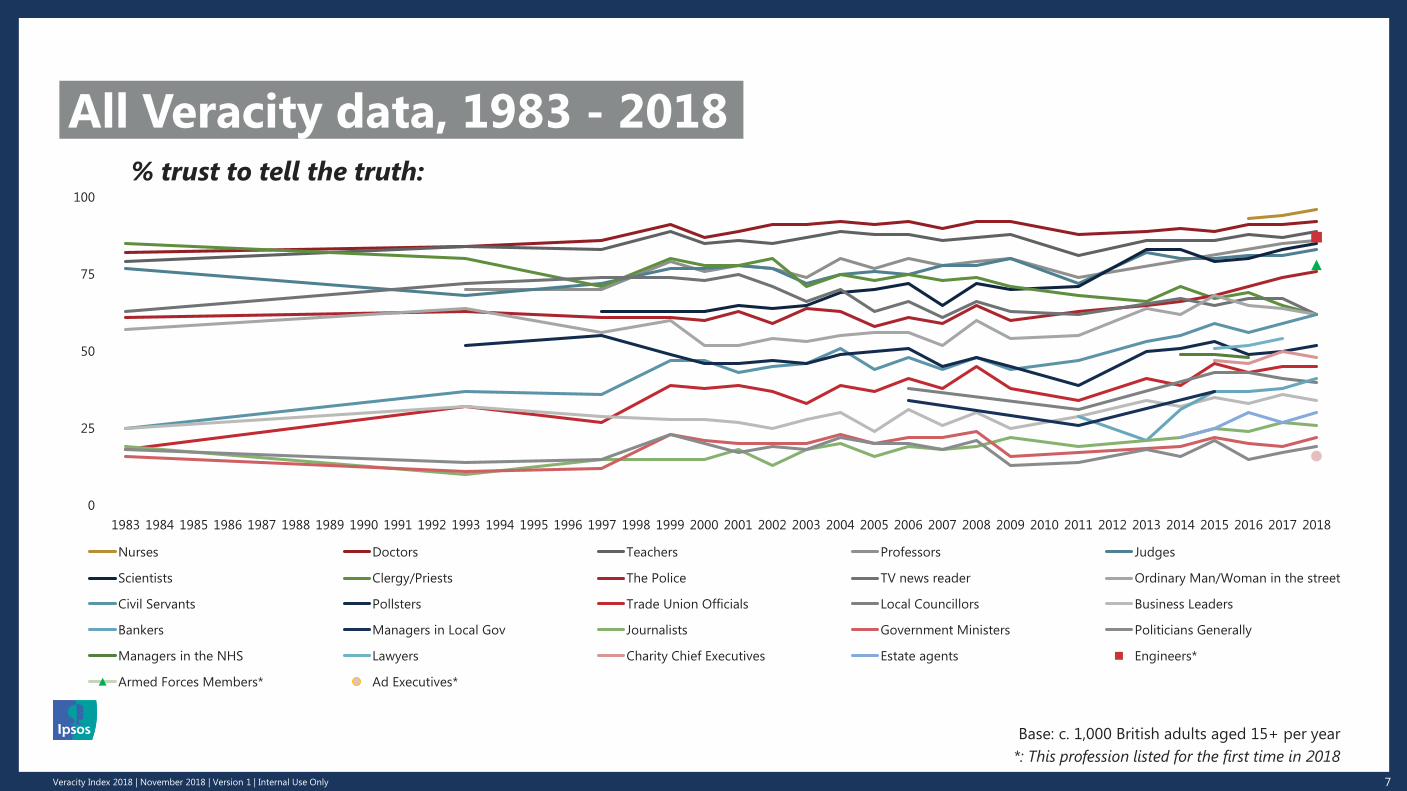
All Veracity data, 1983 - 2018
0
25
50
75
100
1983 1984 1985 1986 1987 1988 1989 1990 1991 1992 1993 1994 1995 1996 1997 1998 1999 2000 2001 2002 2003 2004 2005 2006 2007 2008 2009 2010 2011 2012 2013 2014 2015 2016 2017 2018
Nurses Doctors Teachers Professors Judges
Scientists Clergy/Priests The Police TV news reader Ordinary Man/Woman in the street
Civil Servants Pollsters Trade Union Officials Local Councillors Business Leaders
Bankers Managers in Local Gov Journalists Government Ministers Politicians Generally
Managers in the NHS Lawyers Charity Chief Executives Estate agents Engineers*
Armed Forces Members* Ad Executives*
% trust to tell the truth:
*: This profession listed for the first time in 2018
Base: c. 1,000 British adults aged 15+ per year

8Veracity Index 2018 | November 2018 | Version 1 | Internal Use Only
Ipsos MORI Veracity Index 2018Base: 1,001 British adults aged 15+, fieldwork 12 - 21 October 2018
The social and demographic drivers of trust
The Social Trust Index6.7
5
6.1
2
6.0
2
6.0
1
5.9
5
5.8
8
5.8
6
5.8
2
5.5
5
5.4
9
5.4
2
5.3
8
5.3
6
5.3
6
5.3
6
5.3
2
5.2
2
5.1
6
5.1
6
5.1
5
5.0
2
5.0
0
4.9
7
4.9
6
4.9
1
4.8
8
4.8
6
4.8
2
4.7
8
4.6
5
4.4
4.1
3
4.0
4
3.8
5
3.8
5
3.7
8
3.6
1
3.2
9
2.6
3
2.3
4
Gen
era
tio
n Z
Rem
ain
vo
ter
Mille
nn
ial g
en
era
tio
n
Ow
ns
ho
use
on
mo
rtg
ag
e
So
cial G
rad
e A
B
Co
nse
rvati
ve P
art
y ID
Ed
uca
ted
to
deg
ree level
Lon
do
n r
esi
den
t
So
cial G
rad
e C
1
So
uth
En
gla
nd
resi
den
t
In w
ork
Lab
ou
r P
art
y ID
Marr
ied
/liv
ing
as
Sin
gle
Read
s n
o n
ew
spap
ers
Urb
an
dw
eller
A L
evel ed
uca
tio
n
Sco
tlan
d r
esi
den
t
Pri
vate
Ren
ter
Bro
ad
sheet
read
er
Su
bu
rban
dw
eller
Male
Mid
lan
ds
resi
den
t
To
tal
Fem
ale
GC
SE/O
Level ed
uca
tio
n
Pre
War
gen
era
tio
n
So
cial G
rad
e C
2
Ow
ner
occ
up
ier
Gen
era
tio
n X
No
t w
ork
ing
Ru
ral d
weller
Mid
Mark
et
pap
er
read
er
Vo
ted
Leave
Bab
y B
oo
mer
gen
era
tio
n
No
rth
En
gla
nd
resi
den
t
No
fo
rmal q
ualifica
tio
ns
So
cial g
rad
e D
E
So
cial R
en
ter
Wid
ow
ed
/div
orc
ed
The social trust index is the average number of professions
trusted minus the average not trusted per group

9Veracity Index 2018 | November 2018 | Version 1 | Internal Use Only
Trust in professions by party support
Nurses
Doctors
Teachers
Engineers
Professors
Scientists
Judges
Members of the Armed Forces
The Police
Television news readers
Clergy/priests
The ordinary man/woman in the street
Civil Servants
Pollsters
Charity chief executives
Trade union officials
Bankers
Local councillors
Business leaders
Estate agents
Journalists
Government Ministers
Politicians generally
Advertising executives
Conservative supporters
Labour supporters
“Now I will read you a list of different types of people. For each would you tell me if you generally trust them to tell the truth, or not?”
% trust to tell the truth
Base: 1,001 British adults aged 15+, fieldwork 12 - 21 October 2018
Conservative Labour
98% 96%
95% 93%
89% 90%
91% 88%
85% 89%
83% 88%
90% 82%
85% 73%
83% 73%
74% 61%
72% 60%
66% 65%
56% 70%
58% 54%
44% 52%
29% 61%
45% 36%
39% 41%
43% 35%
37% 29%
24% 31%
25% 21%
22% 18%
16% 15%

10Veracity Index 2018 | November 2018 | Version 1 | Internal Use Only
Trust in professions by referendum vote
Nurses
Doctors
Teachers
Engineers
Professors
Scientists
Judges
Members of the Armed Forces
The Police
Television news readers
Clergy/priests
The ordinary man/woman in the street
Civil Servants
Pollsters
Charity chief executives
Trade union officials
Bankers
Local councillors
Business leaders
Estate agents
Journalists
Government Ministers
Politicians generally
Advertising executives
Remain Leave
“Now I will read you a list of different types of people. For each would you tell me if you generally trust them to tell the truth, or not?”
% trust to tell the truth
Base: 1,001 British adults aged 15+, fieldwork 12 - 21 October 2018
Remain Leave
97% 96%
96% 89%
92% 85%
93% 87%
90% 83%
90% 82%
89% 79%
78% 81%
81% 73%
67% 66%
63% 63%
66% 63%
67% 55%
58% 46%
53% 39%
51% 38%
35% 42%
46% 30%
36% 32%
28% 30%
30% 23%
24% 16%
22% 14%
13% 14%

11Veracity Index 2018 | November 2018 | Version 1 | Internal Use Only
Trust in professions by educational attainment
Nurses
Doctors
Teachers
Engineers
Professors
Scientists
Judges
Members of the Armed Forces
The Police
Television news readers
Clergy/priests
The ordinary man/woman in the street
Civil Servants
Pollsters
Charity chief executives
Trade union officials
Bankers
Local councillors
Business leaders
Estate agents
Journalists
Government Ministers
Politicians generally
Advertising executives
Degree holder
Non-degree holder
“Now I will read you a list of different types of people. For each would you tell me if you generally trust them to tell the truth, or not?”
% trust to tell the truth
Base: 1,001 British adults aged 15+, fieldwork 12 - 21 October 2018
Degree No degree
96% 96%
93% 91%
90% 88%
91% 85%
89% 84%
90% 82%
86% 81%
78% 78%
82% 74%
64% 62%
62% 62%
67% 59%
67% 59%
58% 48%
54% 45%
48% 44%
34% 45%
48% 36%
39% 32%
24% 33%
34% 22%
26% 20%
22% 17%
16% 16%

www.ipsos-mori.com/
Veracity Index 2018 | November 2018 | Version 1 | Internal Use Only 12
Gideon Skinner
Research Director
@gideonskinner
Michael Clemence
Research Manager
@mwclemence