ipa touchpoints presentation to cimm june 3 rd...
TRANSCRIPT

IPA TouchPointsPresentation to CIMM June 3rd 2010
Belinda Beeftink (IPA)Manfred Mareck (Research Marketing)

2
IPA TouchPoints
Why TouchPoints and what did the IPA do?The TouchPoints data integrationWhere is TouchPoints now? Key issues – the end users’ views The data in action Examples

3
TouchPoints Evaluation Study
Short review of TouchPoints’ development and methodology Review of the ‘Hub plus Fusion’ concept TouchPoint’s reception in the UK advertising market Key issues and concerns raised by end users Short summary of other Hub + Fusion initiatives globally Conclusions and Recommendations Selected Bibliography and relevant TouchPoints material

4
The world is changing fast:—power of any single medium is declining—consumers increasingly in control—need to know more than numbers—all industry research is single media based
IPA TouchPoints: Why
Credibility gap for the industry
5
The Motivation
6
IPA TouchPoints: Requirement/Remit
“A tool which evaluates mixed media schedules, both for planning and post campaign
evaluation”
To deliver new and fresh insights in its own right
To act as a gateway across data sourcesNOT to act as an alternative to current
industry research

7
where with whom main activities media (usage and attitude to) mood lifestyles and attitudes shopping habits
Deliverable 1 – The Hub Survey
A time based study of how consumers spend their time:

8
Self-Completion Questionnaire
c5,000 sample of adults in GB
Undertaken by IPSOS using NRS re-contact and panels
Telephone recruitment, postal delivery and return
£20 incentive
TP3 fieldwork Sep’09-Mar’10
e.Diary
The IPA TouchPoints Hub Survey

Covers ALL media
Lifestyles/ Attitudes
Shopping
Self Completion Questionnaire
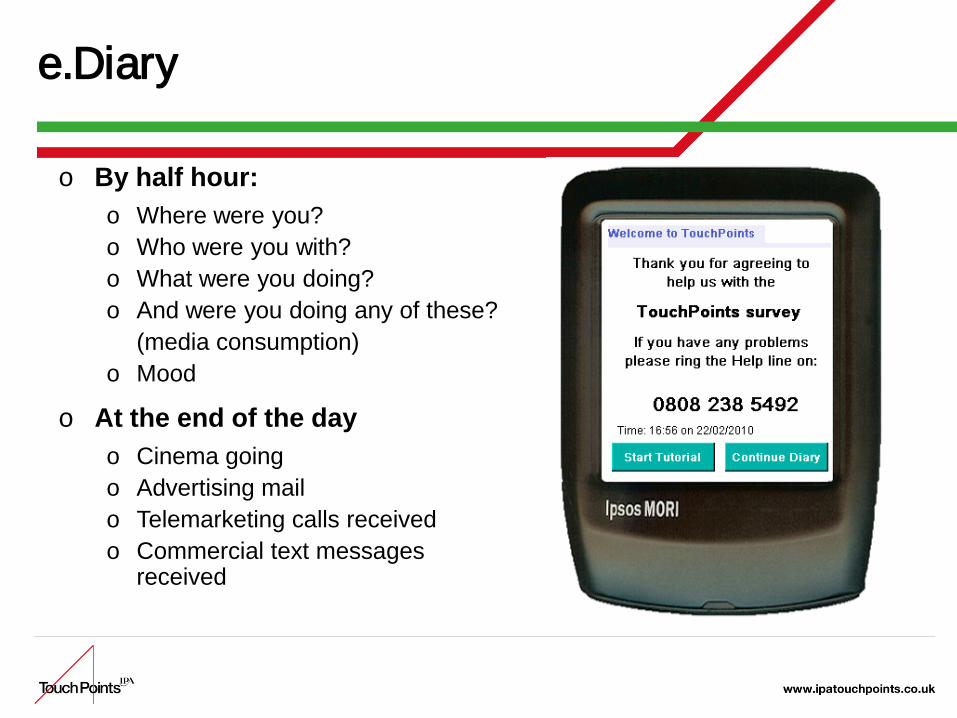
o By half hour:o Where were you?o Who were you with?o What were you doing?o And were you doing any of these?
(media consumption)o Mood
o At the end of the dayo Cinema goingo Advertising mailo Telemarketing calls receivedo Commercial text messages
received
e.Diary
11
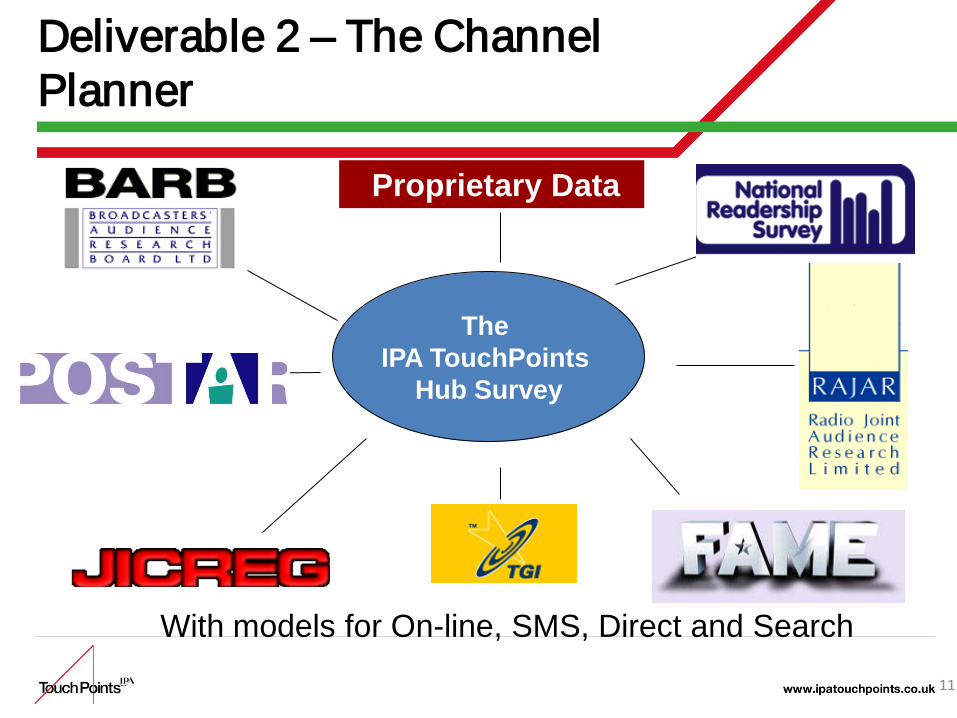
Deliverable 2 – The Channel Planner
The IPA TouchPoints
Hub Survey
Proprietary Data
With models for On-line, SMS, Direct and Search
12
The Channel Planner
The first, industry available, multi-media planning
system.
13
Multi channel planning
Understanding the benefit and value of each media vehicle and each medium
Demonstrating the unique reach that each delivers on the schedule
Demonstrating the delivery of the schedule against the planned / behavioural target as well as the buying target
Demonstrating cost benefit Brand portfolio analysis Traditional media vs non traditional media Media partnerships Delivering the bottom line to the advertiser
14
Who is using TouchPoints?
Bought by 59 companies 44 agencies 14 media owners 1 advertiserEmulated around the worldConsistently gaining traction in the UK
marketplace

15
Who is using TouchPoints?
All Response MediaAMSArena BLMAssociated NewspapersBauer Consumer MediaBBHBray LeinoBrilliant MediaCaratCOIDCMExperienceFallon LondonFeather BrooksbankGlobal Radio iLevelIDSInitiative Media
IPCITVJC DecauxJohn Ayling AssociatesKineticLeo BurnettMaxusMcCann Erickson (London)McCann Erickson (Manchester)Media Campaign ServicesMedia Planning GroupMediacomMediacom NorthMediaedge:CIAMediaedge:CIA (Manchester)MediaVest (Manchester)MGOMDMike Colling & CoMindshare Media NakedNews International
OMD UKOrangePearl & DeanPHD MediaPHD NorthPosterscopePublicisPure MediaRappSMGStarcom MediaVestThe Media ShopThinkboxTotal MediaTruly LondonUniversal McCannUM (Midlands)VizeumYahoo! UKZenith Optimedia

16
Why TouchPoints is unique
Diary data – contextMultiple media activityMulti channel analysisCross platform analysis

Research Marketing Ltd
TouchPoints:A step toward a multi-media
planning Nirvana ?
Research Marketing Ltd
• Why TouchPoints and what did the IPA do?
• The TouchPoints data integration• Where is TouchPoints now? • Key issues – the end users’ views• The data in action • Examples
Research Marketing Ltd
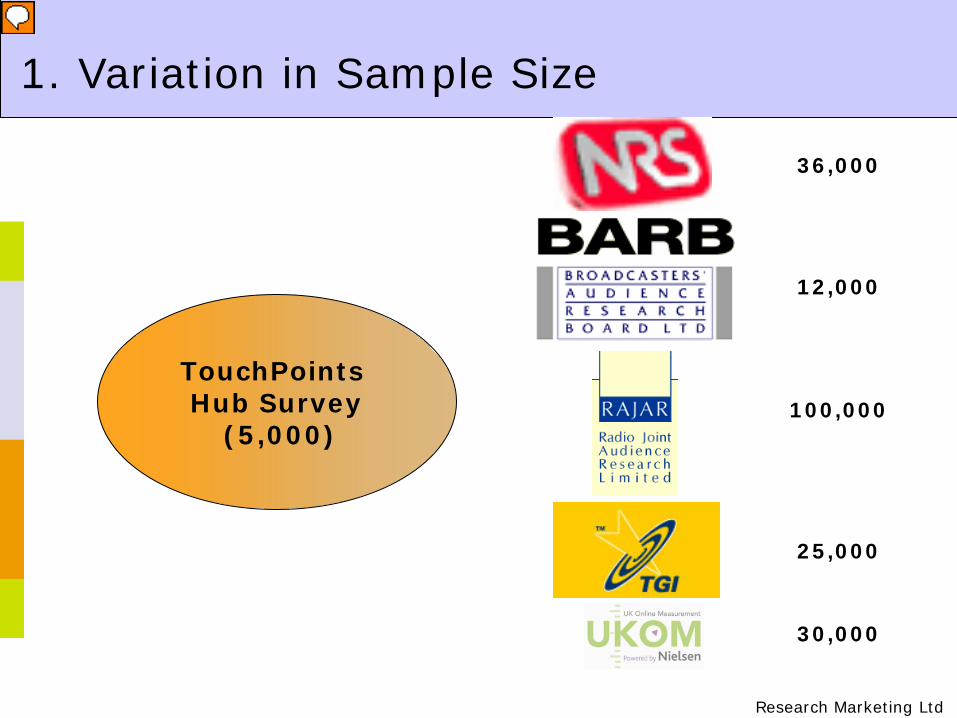
1. Variation in Sample Size
TouchPoints Hub Survey
(5,000)
36,000
30,000
25,000
100,000
12,000
Research Marketing Ltd
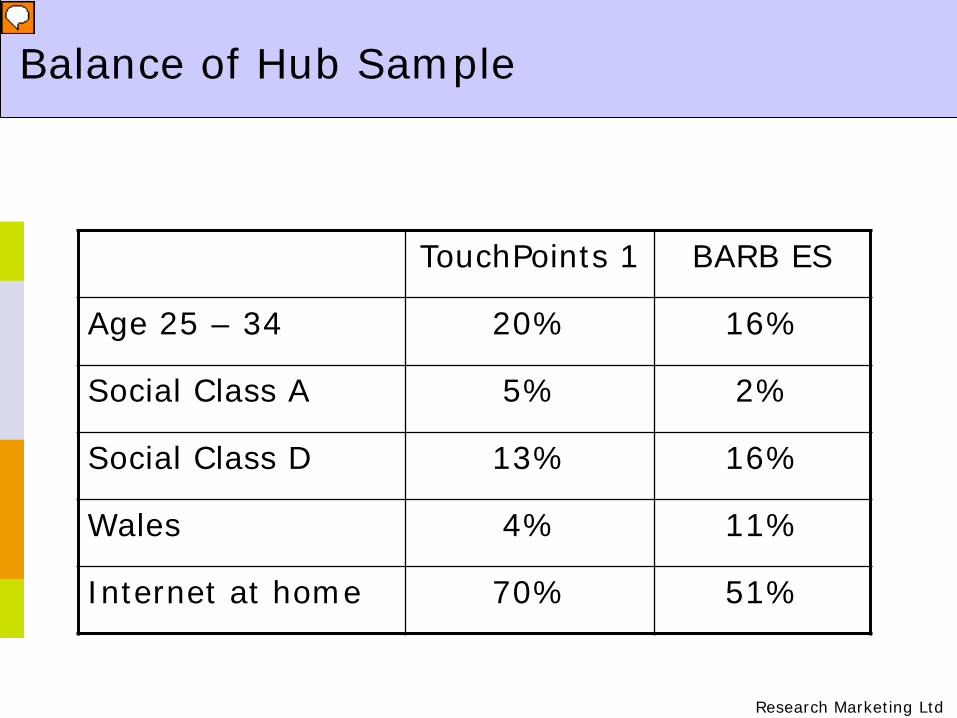
Balance of Hub Sample
TouchPoints 1 BARB ES
Age 25 – 34 20% 16%
Social Class A 5% 2%
Social Class D 13% 16%
Wales 4% 11%
Internet at home 70% 51%

Research Marketing Ltd
TouchPoints BARB ES
Re-engineering the Hub Survey

Research Marketing Ltd
Media
Fusion
Media
Media
Equivalent to weighting and replication Original currency sample sizes preserved in
subsequent fusion processes
Re-engineering the Hub Survey
TouchPoints BARB ES

Research Marketing Ltd
Large random sample more even use of donor respondents in the
subsequent fusion more representative sample for all planning
groups
Variety of hooks to be used in subsequent fusion of currencies Demographic hooks Geographic hooks Plus additional media imperative
The expanded Hub Survey

Research Marketing Ltd
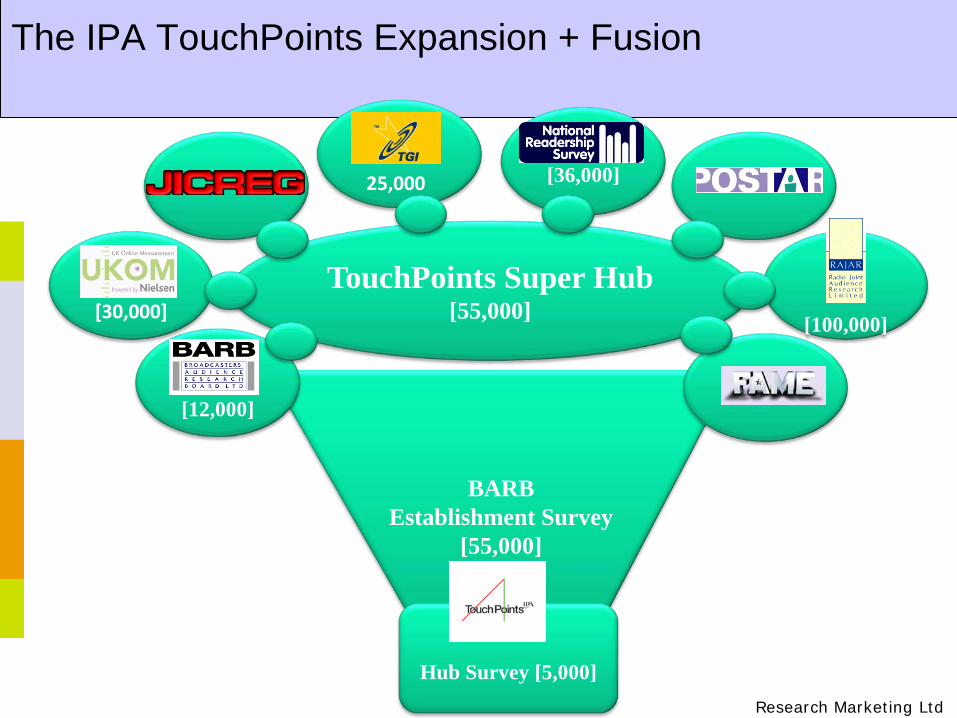
Television: Fusion from BARBNat’l press/magazines: Fusion from NRSRadio: Fusion from RAJARProduct Usage: Fusion from TGIPosters: Calibration from POSTARCinema: Calibration from admissionsRegional press profile matching from JICREGInternet, SMS, DM measured in TouchPoints
2. Multiple Fusion Methods
Research Marketing Ltd
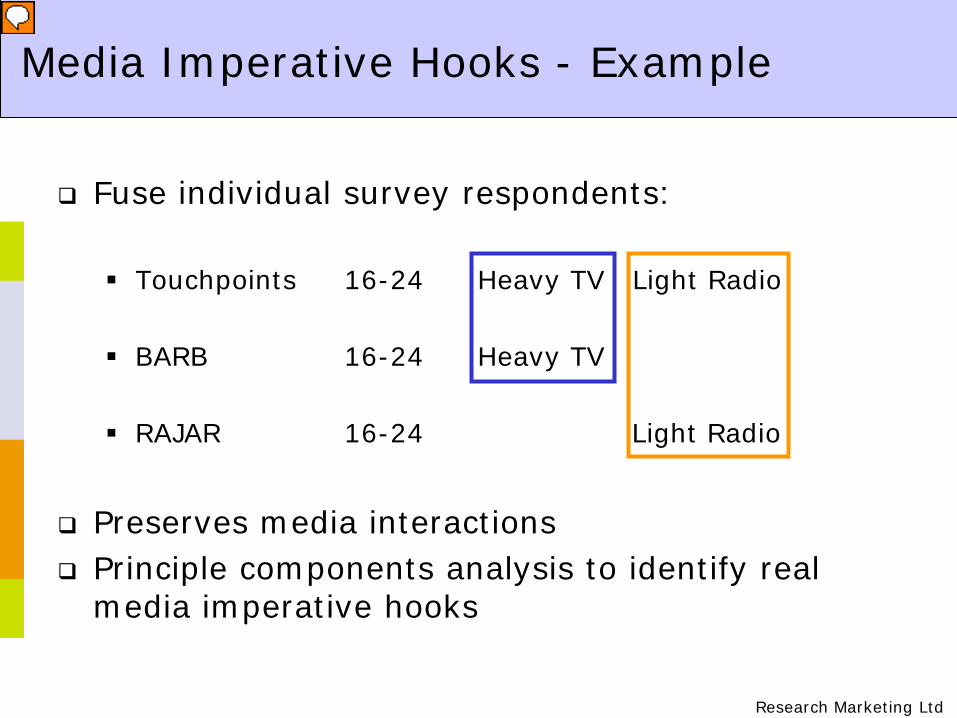
Media Imperative Hooks - Example
Fuse individual survey respondents:
Touchpoints 16-24 Heavy TV Light Radio
BARB 16-24 Heavy TV
RAJAR 16-24 Light Radio
Preserves media interactions Principle components analysis to identify real
media imperative hooks
Research Marketing Ltd
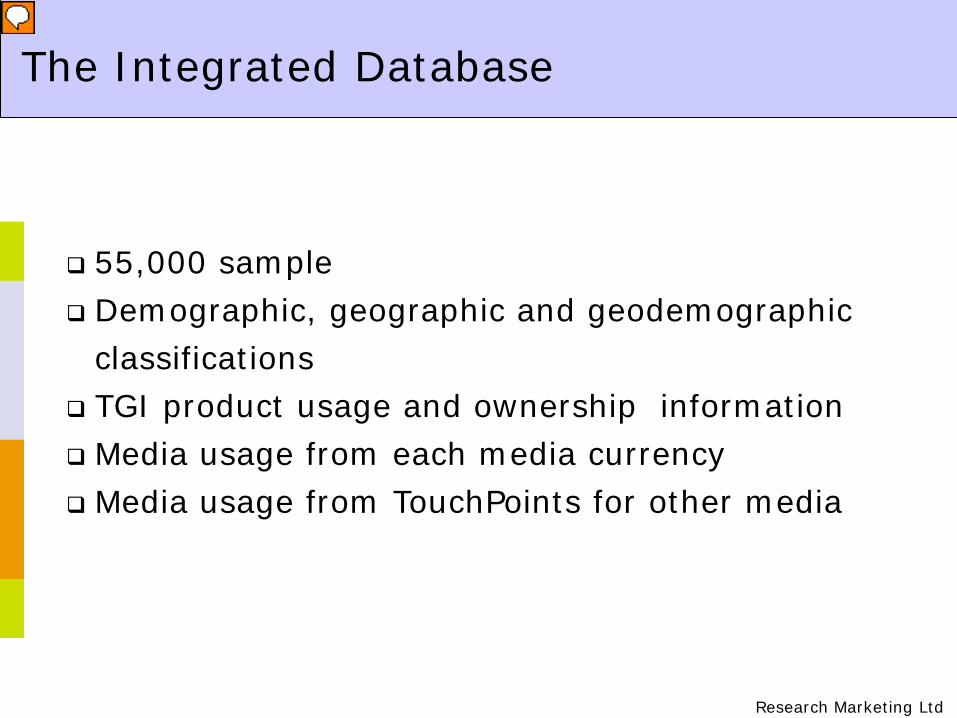
55,000 sample Demographic, geographic and geodemographic
classifications TGI product usage and ownership information Media usage from each media currency Media usage from TouchPoints for other media
The Integrated Database
Research Marketing Ltd
The IPA TouchPoints Expansion + Fusion
BARBEstablishment Survey
[55,000]
TouchPoints Super Hub[55,000]
[12,000]
[30,000]
[36,000]
[100,000]
Hub Survey [5,000]
25,000
Research Marketing Ltd
Integrated database to calculate unduplicated reach and frequency for multi-media schedules
Each media currency has a different statistical expansion model to estimate multiple exposures
Personal probabilities provide a common solution for all TouchPoints currencies
3. Personal Probabilities

Research Marketing Ltd
• For TV, probabilities were calculated from the 12-week BARB data as an average by channel, day of the week and time segment
• Most channels (with the exception of TV) use short-term measurement (p=0, p=1)
• Require expansion to estimate an individual’s probability of making 1,2,3,4 …i contacts with any media event
Personal Probabilities

Research Marketing Ltd
• Conducted by Ken Baker (Ken Baker Associates)
• Expansion to the BARB ES– Good match: demographics (incl. age groups), TEA, use of IT
equipment– Less good: actual age, status (social grade)
• Fusion of BARB TV data– Good match for most key criteria– Poor matches for social grade
4. TouchPoints fusion assessment

Research Marketing Ltd
The fusions of BARB, RAJAR and NRS into TouchPoints have worked well
The fusion hooks relating to media imperatives preserved media interrelationships observed within TouchPoints very well
The fusion of TGI into TouchPoints showed the highest level of statistical matching attained in any fusion
The overall estimate of fusion efficiency is estimated at 93%. Overall regression to the mean is 7%
TouchPoints Fusion assessment
Research Marketing Ltd
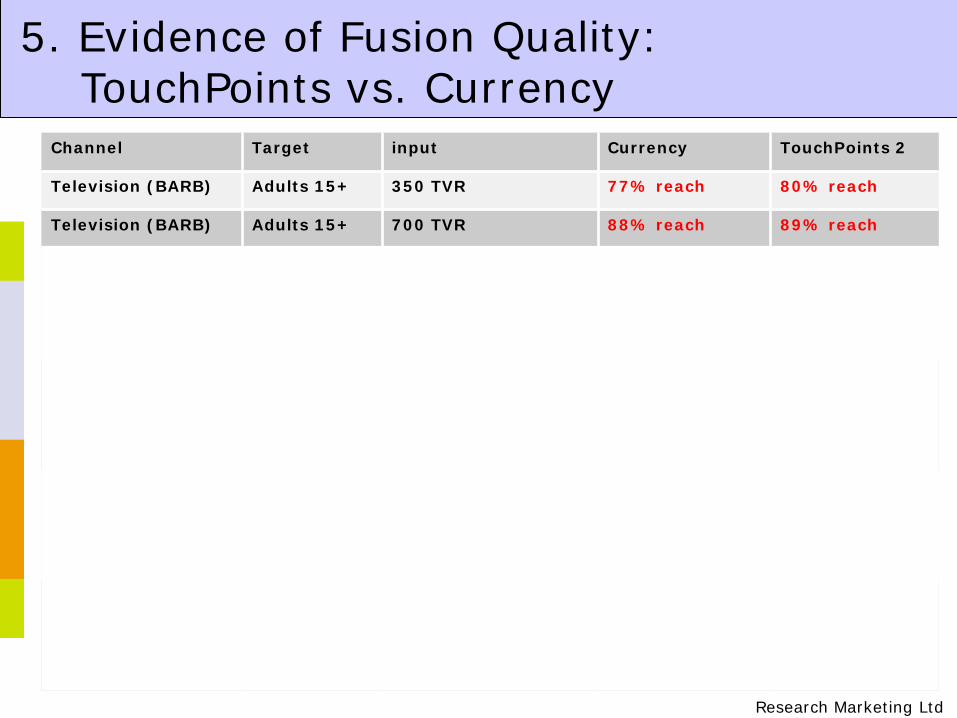
Channel Target input Currency TouchPoints 2
Television (BARB) Adults 15+ 350 TVR 77% reach 80% reach
Television (BARB) Adults 15+ 700 TVR 88% reach 89% reach
National Print(NRS)
Adults 15+ 27 insertions in 17newspapers andMagazines
51% reach104 GRP2.04 frequency50,841 impacts
54% reach104 GRP1.94 frequency49,802 impacts
National Print(NRS)
Women 15+ 91 insertions in 16Magazines
66% reach421 GRP6.42 frequency105,539 impacts
61% reach421 GRP6.91 frequency103349 impacts
Radio (RAJAR) Adults 15+ Capital Radio 3% reach18.6 GRP6.95 frequency9,357 impacts
3% reach19.3 GRP7.56 frequency9,243 impacts
Radio (RAJAR) Adults 15-34 63 GRP over 10stations
15% reach65.6 GRP4.29 frequency31,111 impacts
16% reach69.1 GRP4.42 frequency31,515 impacts
5. Evidence of Fusion Quality:TouchPoints vs. Currency
Research Marketing Ltd
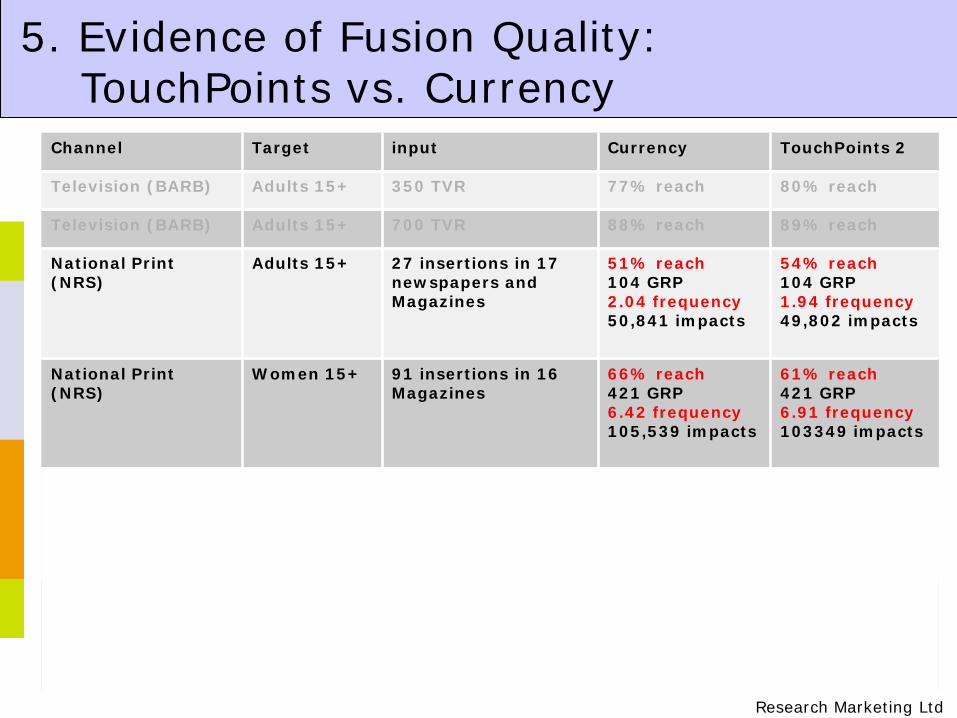
Channel Target input Currency TouchPoints 2
Television (BARB) Adults 15+ 350 TVR 77% reach 80% reach
Television (BARB) Adults 15+ 700 TVR 88% reach 89% reach
National Print(NRS)
Adults 15+ 27 insertions in 17newspapers andMagazines
51% reach104 GRP2.04 frequency50,841 impacts
54% reach104 GRP1.94 frequency49,802 impacts
National Print(NRS)
Women 15+ 91 insertions in 16Magazines
66% reach421 GRP6.42 frequency105,539 impacts
61% reach421 GRP6.91 frequency103349 impacts
Radio (RAJAR) Adults 15+ Capital Radio 3% reach18.6 GRP6.95 frequency9,357 impacts
3% reach19.3 GRP7.56 frequency9,243 impacts
Radio (RAJAR) Adults 15-34 63 GRP over 10stations
15% reach65.6 GRP4.29 frequency31,111 impacts
16% reach69.1 GRP4.42 frequency31,515 impacts
5. Evidence of Fusion Quality:TouchPoints vs. Currency

Research Marketing Ltd
TouchPoints 2 used same methodology:
6. Improvements over time
Improved fusion control (e.g. for Social grade or
Internet access at home
Resulting in better fusion and less calibration:
TP1: TV viewing overstated by approx 10%TP2: TV viewing overstated by approx 4%
Research Marketing Ltd
Users, non-users and previous users of TouchPoints 1 and/or 2
‘Hands-on’ planners and more senior insight/research managers
Mix of media owners, agencies, and advertisers, software providers, representatives of the currencies (JICs)
“Delivering the Nirvana?”
Discussion and interviews with over 30 industry professionals (April-May 2010)
Research Marketing Ltd
• Usage of TouchPoints– Which parts of Touchpoints– Perceived benefits of using TouchPoints data
• Areas of concern– Technical issues (methodology, fusion etc)– Practical issues (sample size, data input/output)– Understanding TouchPoints data
• Overall assessment/opinion– Usage personally/within their organisation– Within the industry in general, trends/changes
Key Questions included:

Research Marketing Ltd42
Any Hurdles – could everybody jump?

Research Marketing Ltd43
Did some of them stumble?

Research Marketing Ltd44
Did some of them crash?

Research Marketing Ltd
Success: The Fusion
“In the last few years people have become used to data fusion. It is a very commonly used technique by many of our clients who fuse their own customer segmentation data with other surveys. It is the best and most cost effective option we currently have” (insight manager, agency)
“I go with the experts like Wilcox and Baker. The results make sense … and at top level there is absolute consistency between TouchPoints and the original BARB data. It is very close .. I am very pleased” (head of research, television)
“It’s all a bit complicated and nebulous so people tend not to worry too much about fusion and data collection method” (planner, agency)

Research Marketing Ltd
Success: TouchPoints frequency
“Two year old data is not ideal but we can’t use this as an excuse not to use TouchPoints. We have to be realistic.” (planning director, digital agency)
“In the end we expect TouchPoints to give us some broad brush strokes, for example on a typical Monday evening more people like to watch television in combination with other media and these patterns don’t actually change that much. It is also down to the planner’s intelligence to get the best interpretation of the data” (business director, agency)
“Every two years TouchPoints needs a major re-fresh. But I am not sure whether media usage changes significantly enough to warrant more frequent updates” (head of marketing services, advertiser)

Research Marketing Ltd
Success: TouchPoints Hub data
“We use the Hub data for segmentation work and target group information as well as a lot of the time-diary data. We get a lot of insights that are useful when pitching for new business” (planner, agency)
“There were surprising learnings, for example the parallel media use between television and online. There's interesting data on how people download TV programmes and videos, use VOD and mobile access. Using TouchPoints we could recommend a TV plus online campaign, whilst previously they only used TV” (planning director, digital agency)
“With TouchPoints 3 the Hub data should provide us with a lot of trend analysis over the past five years. It also gives us very granular data on media usage throughout the day and across the week” (head of research, TV)

Research Marketing Ltd
Success: TouchPoints Hub data
“We didn’t necessarily gain a lot of new insights about our readers but had many of our assumptions confirmed. In an age of accountability this benefit should not be underestimated” (strategic insight specialist, media owner)
“We nearly always use the Hub survey. The time diary is particularly useful and over time we got quite good at using it to its full potential. On balance the data is still used more often to back something up but sometimes we get utterly new and fresh insights just by playing around with the data” (insight manager, agency)
Research Marketing Ltd
Partial Failure: Sampling
Confusion between original (n=5,000) and expanded Hub sample (n=55,000)
Effective sample size? (n ~ 3,800) More guidance / better prompts Some limitations for smaller media and regional
planning tasks

Research Marketing Ltd
Partial Failure: Sampling
“TV is planned and bought mainly nationally these days and regional sample sizes are not a big issue. For network audiences the Hub sample is sufficient” (head of research, TV)
“Sample size is OK for top line level but for smaller media owners or specific targets it can become an issue” (planner, agency)
“There are a lot of things you have to bear in mind when working with TouchPoints data. You have to remember to divide the grossed-up sample by ten and sometimes people simply forget. There is currently nothing to flag this up”. (insight manager, agency)

Research Marketing Ltd
Partial Failure: Digital Channels
• No online currency until 2010 (UKOM)• Online usage measurement limited to data
collected within the Hub Survey itself– Limited number of individual websites
(~50, including major media owners’ sites)
– 40 site genres (auction, dating, banking, shopping, travel, sports, news, etc…)
– Online search (Ask, AOL, Google, MSN, Yahoo!)
• Somewhat limited usage for digital agencies
Research Marketing Ltd
Partial Failure: Digital Channels
“Many of the questions relating to online and digital come across as fairly basic. The time diary stuff is great for a general picture of internet usage, but is not detailed enough. We would look at 300-500 websites for a client but on the TouchPoints Hub survey there are only 30-40 websites. We already know what there is to know from other sources.Constructing a media plan cross channels does not work so well for online”. (planning director, digital agency)
“For many of the communication channels we are using, especially online and social media the Channel Planner is of limited use” (senior strategist, agency)
“Digital media was poorly represented until now but this will be rectified with TouchPoints 3 and UKOM data” (research manager, agency)

Research Marketing Ltd
Significant Failures
Understanding the multi-media world Organisation within agencies and media owners Software and systems

Research Marketing Ltd
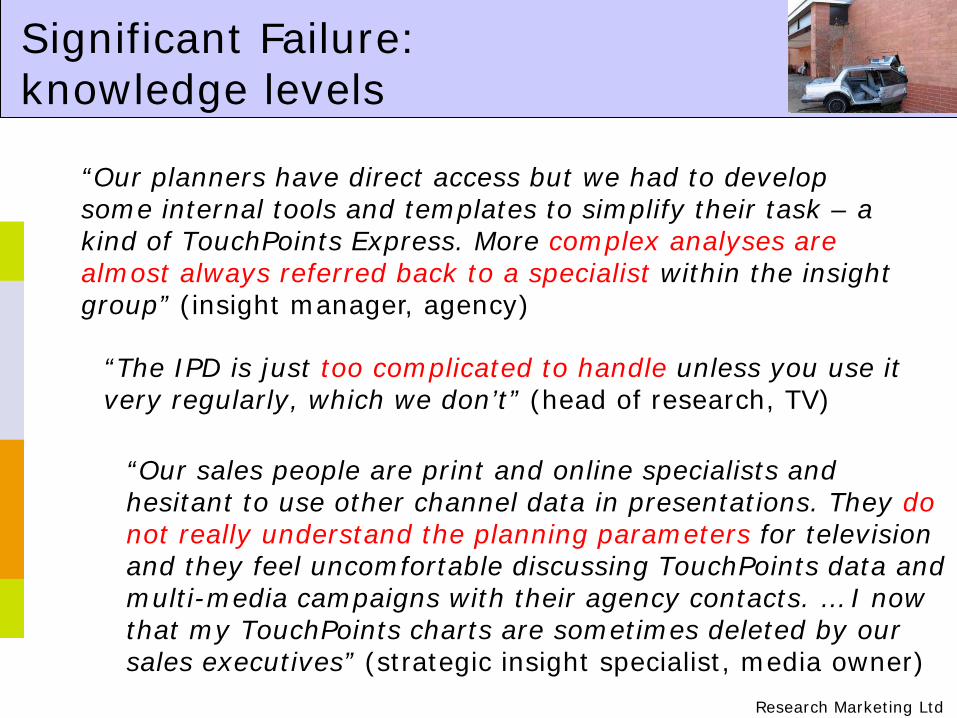
Significant Failure:knowledge levels
Most consumers habitually use multi-media, often simultaneously
Many media professional talk about multi-media usage and multitasking
Few media planners really understand the communications model of all major platform
Research Marketing Ltd
Significant Failure:knowledge levels
“Our planners have direct access but we had to develop some internal tools and templates to simplify their task – a kind of TouchPoints Express. More complex analyses are almost always referred back to a specialist within the insight group” (insight manager, agency)
“The IPD is just too complicated to handle unless you use it very regularly, which we don’t” (head of research, TV)
“Our sales people are print and online specialists and hesitant to use other channel data in presentations. They do not really understand the planning parameters for television and they feel uncomfortable discussing TouchPoints data and multi-media campaigns with their agency contacts. … I now that my TouchPoints charts are sometimes deleted by our sales executives” (strategic insight specialist, media owner)
Research Marketing Ltd
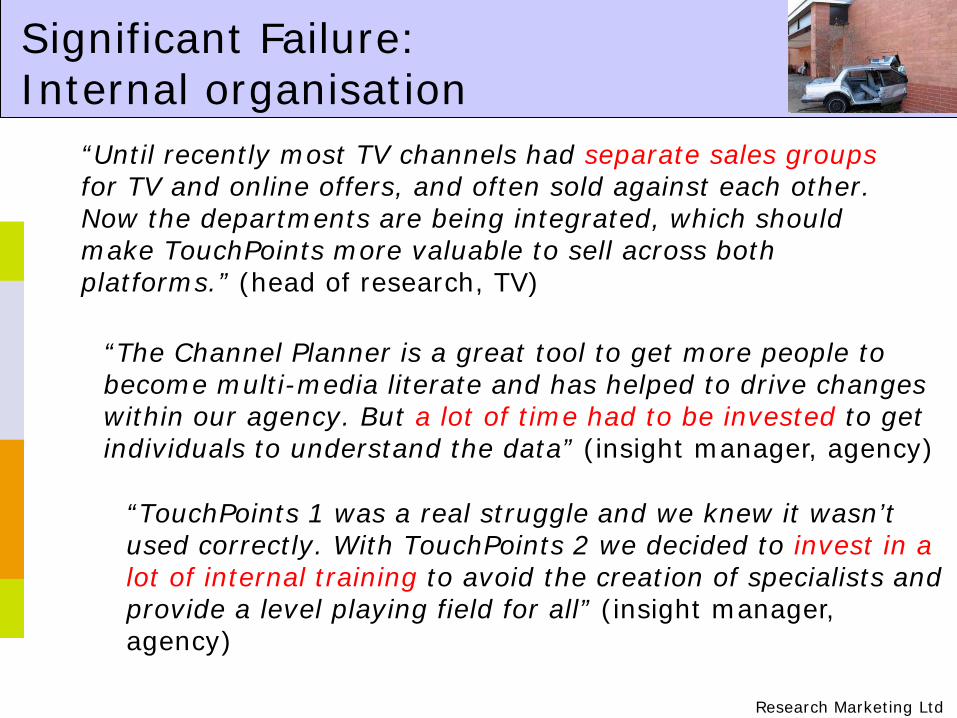
Significant Failure:Internal organisation
“Until recently most TV channels had separate sales groupsfor TV and online offers, and often sold against each other. Now the departments are being integrated, which should make TouchPoints more valuable to sell across both platforms.” (head of research, TV)
“The Channel Planner is a great tool to get more people to become multi-media literate and has helped to drive changes within our agency. But a lot of time had to be invested to get individuals to understand the data” (insight manager, agency)
“TouchPoints 1 was a real struggle and we knew it wasn’t used correctly. With TouchPoints 2 we decided to invest in a lot of internal training to avoid the creation of specialists and provide a level playing field for all” (insight manager, agency)

Research Marketing Ltd
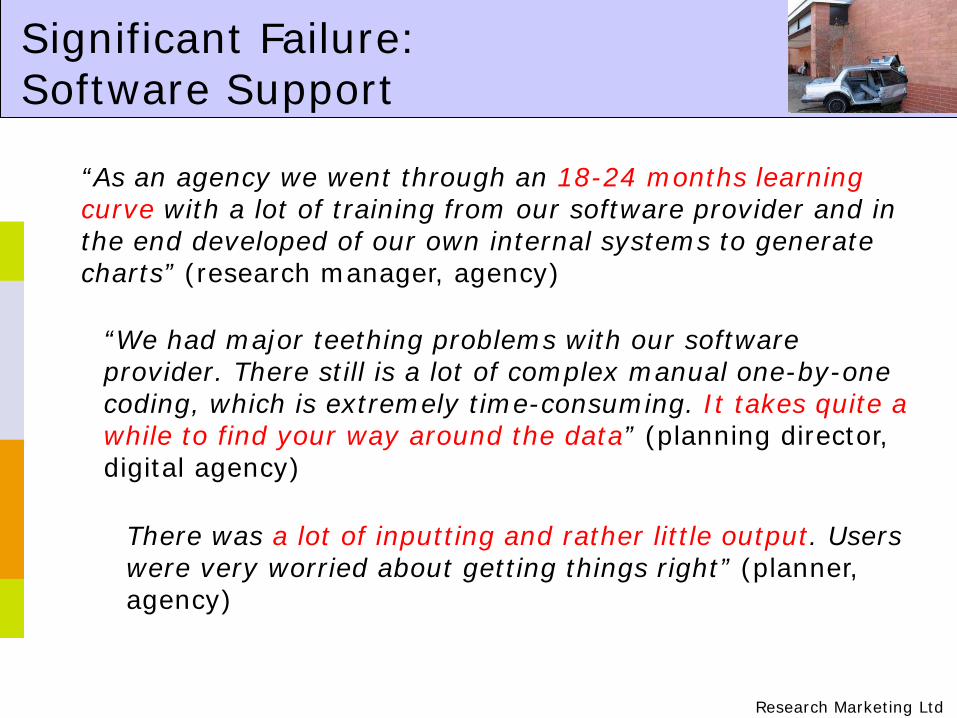
Individual users really struggled (and still do) Coding was complex, time consuming and error-
prone Checking of data was difficult Software bureaux reacted too slowly to revise
their standard packages to incorporate TouchPoints data
Lack of standards and service levels
Significant Failure:Software Support
Research Marketing Ltd
Significant Failure:Software Support
“As an agency we went through an 18-24 months learning curve with a lot of training from our software provider and in the end developed of our own internal systems to generate charts” (research manager, agency)
“We had major teething problems with our software provider. There still is a lot of complex manual one-by-one coding, which is extremely time-consuming. It takes quite a while to find your way around the data” (planning director, digital agency)
There was a lot of inputting and rather little output. Users were very worried about getting things right” (planner, agency)

Research Marketing Ltd
Significant Failure:Software Support
“We also find it very difficult to share data with other agencies that work on the same campaign. We can’t always exchange the codes for the target group definition when they use a different software house” (planning director, digital agency)
“Real issues for agencies that work for the same client”(media agency + digital agency)

Research Marketing Ltd
Key issues mainly outside of TouchPoints
TouchPoints Survey
Software & SystemsKnowledge & Understanding
Economic Factors Digital Channels
Research Marketing Ltd61
Visi
bilit
y
Time
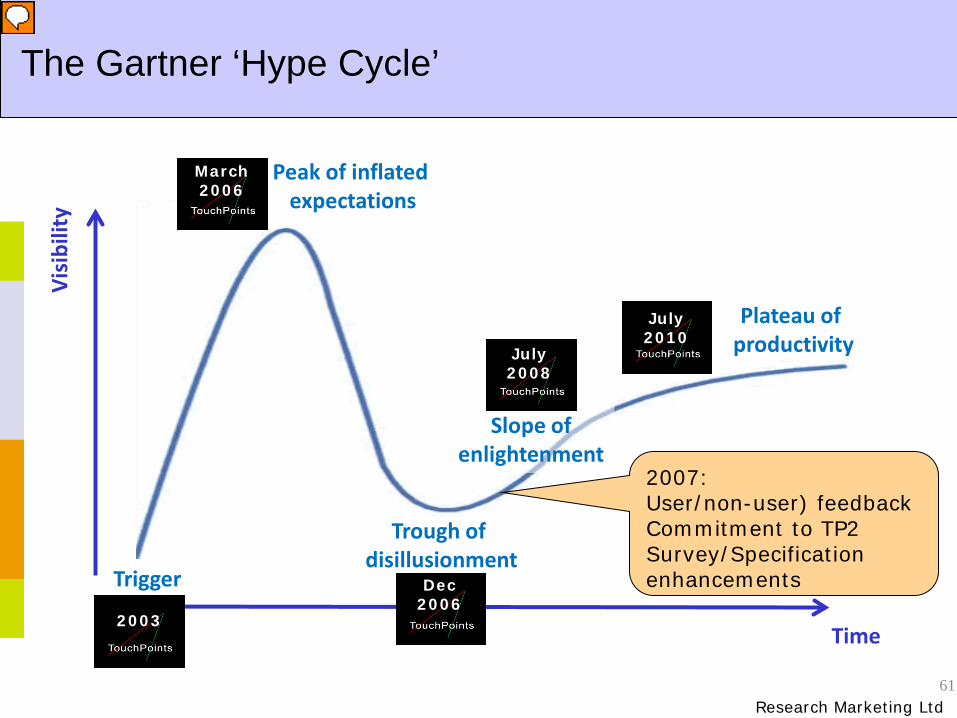
Trigger
Peak of inflated expectations
Trough of disillusionment
Slope of enlightenment
Plateau of productivity
The Gartner ‘Hype Cycle’
2003
Dec 2006
March 2006
July 2008
July 2010
2007:User/non-user) feedback Commitment to TP2Survey/Specification enhancements
Research Marketing Ltd
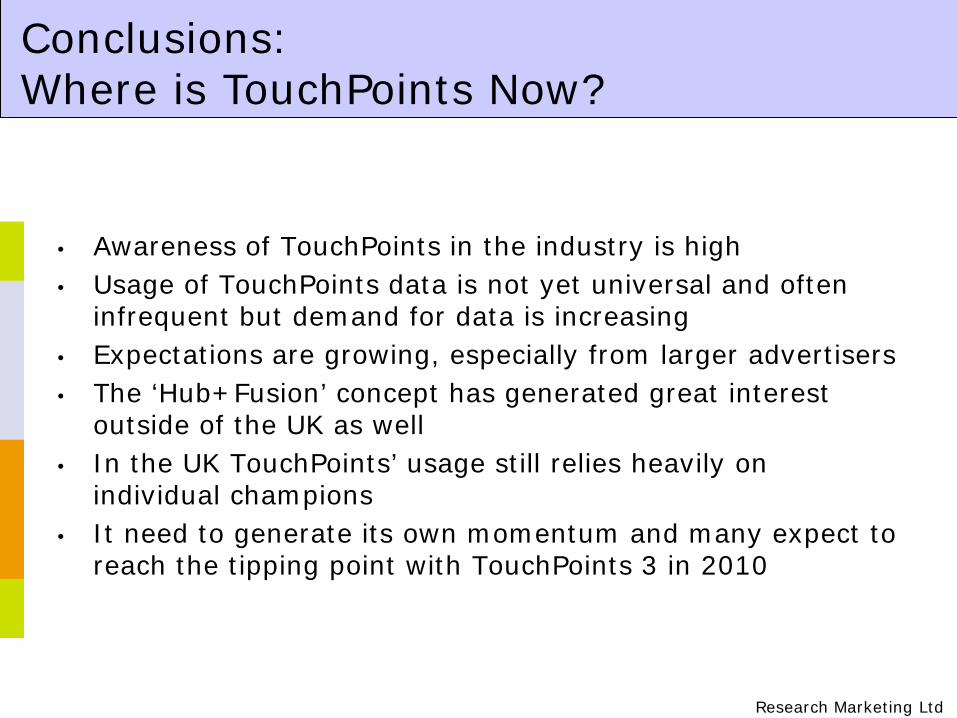
• Awareness of TouchPoints in the industry is high• Usage of TouchPoints data is not yet universal and often
infrequent but demand for data is increasing• Expectations are growing, especially from larger advertisers• The ‘Hub+Fusion’ concept has generated great interest
outside of the UK as well• In the UK TouchPoints’ usage still relies heavily on
individual champions• It need to generate its own momentum and many expect to
reach the tipping point with TouchPoints 3 in 2010
Conclusions:Where is TouchPoints Now?
Research Marketing Ltd
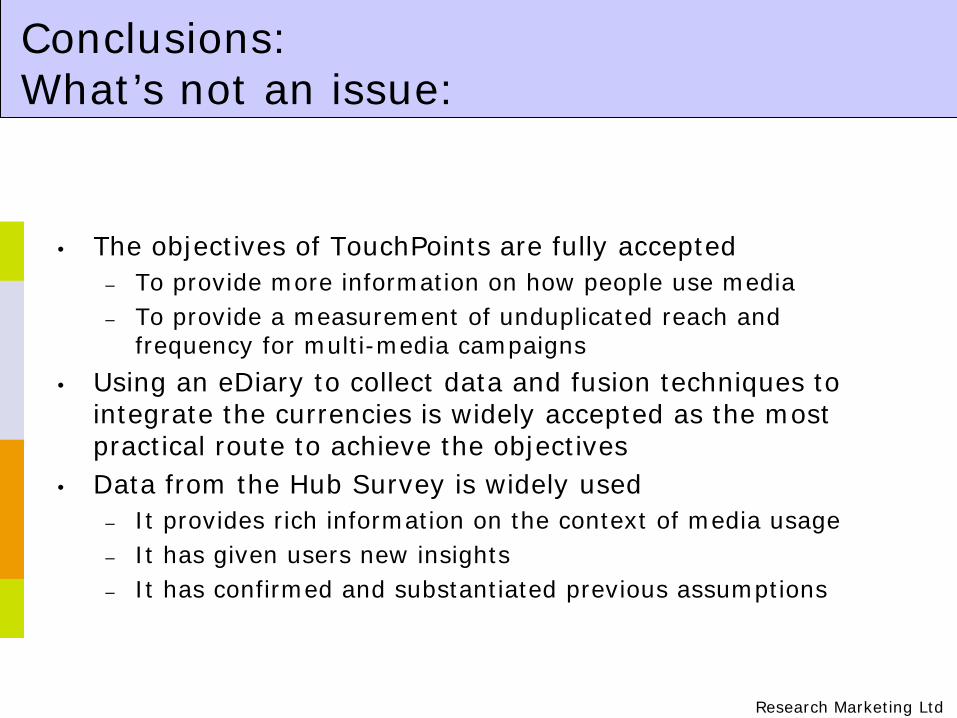
• The objectives of TouchPoints are fully accepted– To provide more information on how people use media– To provide a measurement of unduplicated reach and
frequency for multi-media campaigns• Using an eDiary to collect data and fusion techniques to
integrate the currencies is widely accepted as the most practical route to achieve the objectives
• Data from the Hub Survey is widely used– It provides rich information on the context of media usage– It has given users new insights– It has confirmed and substantiated previous assumptions
Conclusions:What’s not an issue:

Research Marketing Ltd
• Users have some issues with the sample of the Hub– Conceptually (original Hub vs. expanded Hub)– Practically
• Digital channel– Limited data on the fastest growing channel– Until 2010 no industry currency for online– High hopes for improvement with TouchPoints 3 and the
Nielsen/UKOM data• Frequency of data release
– Current 2-year cycle not ideal but acceptable– Inclusion of online currency likely to increase pressure for more
frequent updates– As with sampling, people understand the economic implications
Conclusions:Could do better:

Research Marketing Ltd
• Knowledge levels are not as high as many in the industry may have assumed; inertia and a resistance to embrace new ideas are more pronounced than expected
• More consistent education and training to improve the understanding of multi-media channels across the industry
• Software providers need to improve their offers as the functionality of their programmes and the quality of their help-desk facilities are a major factor that affects usage of the data
• Software providers should have to guarantee minimum service levels before they can offer TouchPoints to their clients
Conclusions:Must do better in future:
Research Marketing Ltd
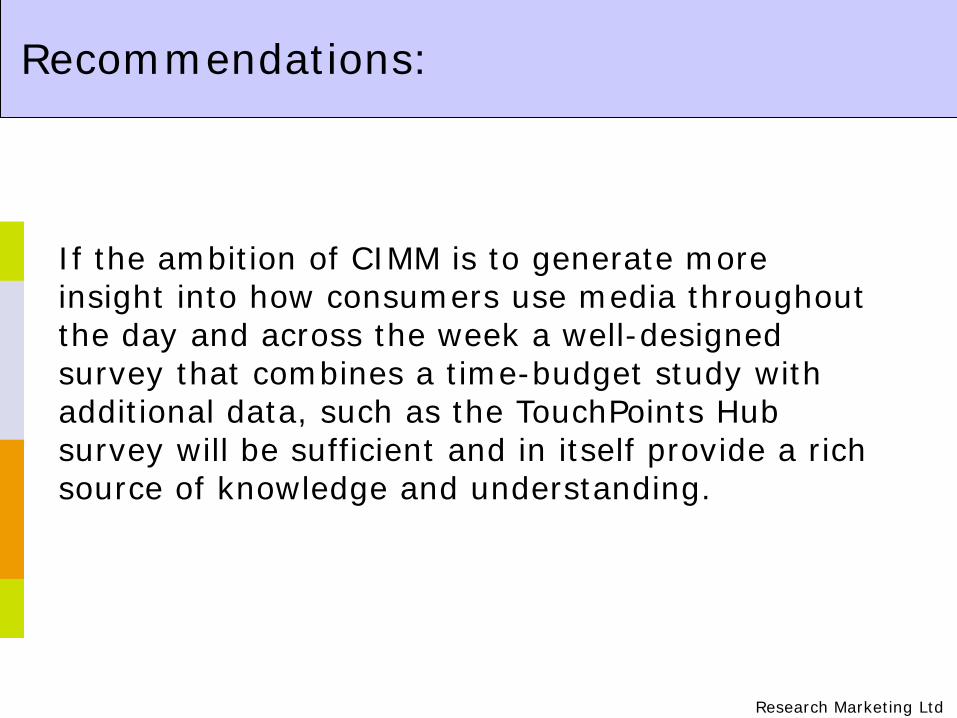
Recommendations:
If the ambition of CIMM is to generate more insight into how consumers use media throughout the day and across the week a well-designed survey that combines a time-budget study with additional data, such as the TouchPoints Hub survey will be sufficient and in itself provide a rich source of knowledge and understanding.
Research Marketing Ltd
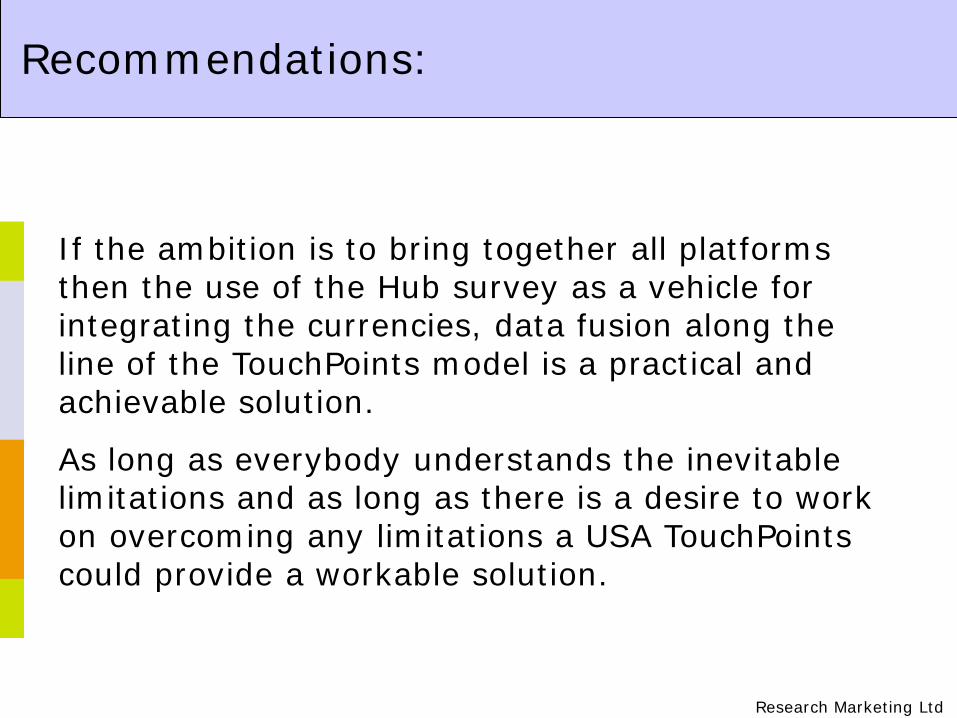
Recommendations:
If the ambition is to bring together all platforms then the use of the Hub survey as a vehicle for integrating the currencies, data fusion along the line of the TouchPoints model is a practical and achievable solution.
As long as everybody understands the inevitable limitations and as long as there is a desire to work on overcoming any limitations a USA TouchPointscould provide a workable solution.

Research Marketing Ltd
Recommendations:
Don’t waste time pondering about Gold Standard or Holy Grails – that can be reserved for learned papers at conferences

Research Marketing Ltd
Recommendations:
There is a danger to get bogged down in too many technical details at an early stage. The often-posed question 'How good is a fusion?' is the wrong question. The key issue to ask is 'whether the use of fusion provides something new and important that is otherwise not available?'

Research Marketing Ltd
Recommendations:
It is important to produce the new tool first, but marketing, sales, training and education programmes, as well as the necessary resources need to be part of the whole process. For end users there is much more involved than simply signing up to another survey.

Research Marketing Ltd
Recommendations:
Do not let the assumption that there are limitations stop you from embarking in this journey. Nothing is perfect – if want perfection stop using the current currencies immediately.

72
How the industry is using TouchPoints data
The Hub: being used in all stages of the
communication planning process
The Channel Planner becoming a standard tool in media
evaluation
Growing body of case histories
73
The Data in Action

Male and Age 18 – 34Saturday media consumption
0
10
20
30
40
50
60
06:00
07:00
08:00
09:00
10:00
11:00
12:00
13:00
14:00
15:00
16:00
17:00
18:00
19:00
20:00
21:00
22:00
23:00
Col
umn
(%)
Listening To The Radio Watching/Using The TV Reading Using The Internet
Source: IPA TouchPoints SuperHub 2008
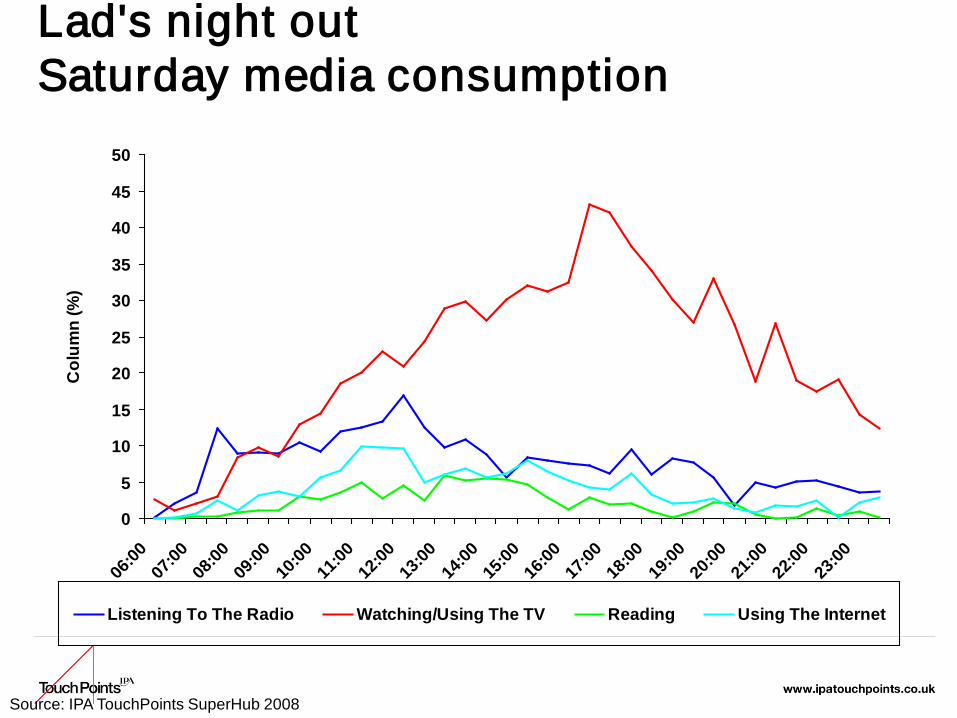
Lad's night out Saturday media consumption
0
5
10
15
20
25
30
35
40
45
50
06:00
07:00
08:00
09:00
10:00
11:00
12:00
13:00
14:00
15:00
16:00
17:00
18:00
19:00
20:00
21:00
22:00
23:00
Col
umn
(%)
Listening To The Radio Watching/Using The TV Reading Using The Internet
Source: IPA TouchPoints SuperHub 2008

All 18-34 Men vs. Lad’s night outSaturday media
0
10
20
30
40
50
6000
:00
01:0
0
02:0
0
03:0
0
04:0
0
05:0
0
06:0
0
07:0
0
08:0
0
09:0
0
10:0
0
11:0
0
12:0
0
13:0
0
14:0
0
15:0
0
16:0
0
17:0
0
18:0
0
19:0
0
20:0
0
21:0
0
22:0
0
23:0
0
Col
umn
(%)
Men 18 - 34 Radio Lads night out Radio Men 18 - 34 TV Lads night out TV
Source: IPA TouchPoints SuperHub 2008
TV viewing dips but radio stays with them until late PM
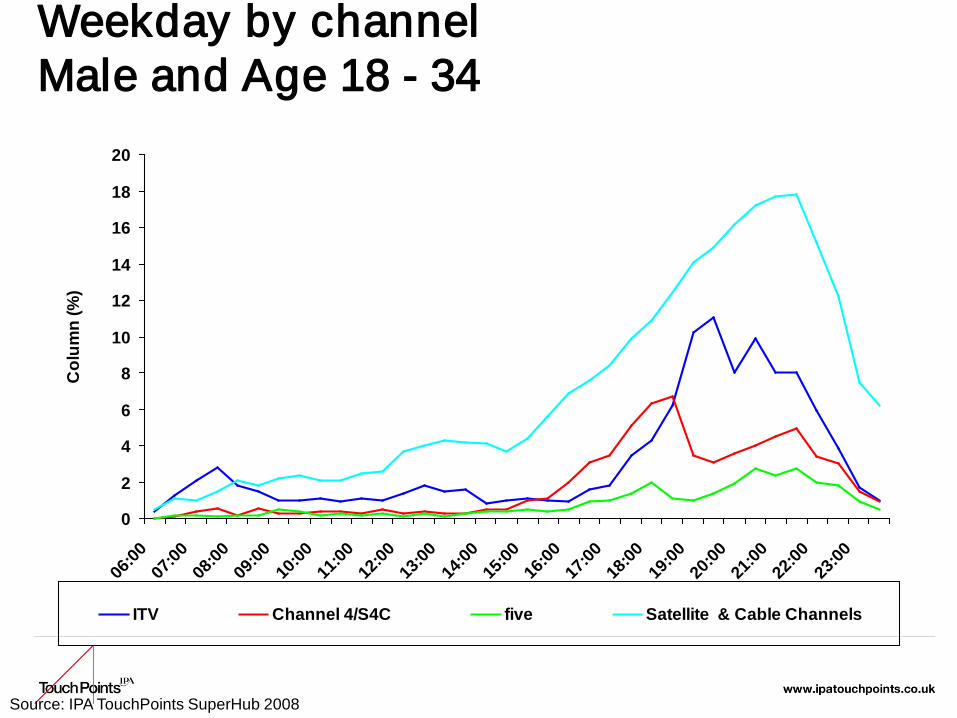
Weekday by channel Male and Age 18 - 34
0
2
4
6
8
10
12
14
16
18
20
06:00
07:00
08:00
09:00
10:00
11:00
12:00
13:00
14:00
15:00
16:00
17:00
18:00
19:00
20:00
21:00
22:00
23:00
Col
umn
(%)
ITV Channel 4/S4C five Satellite & Cable Channels
Source: IPA TouchPoints SuperHub 2008
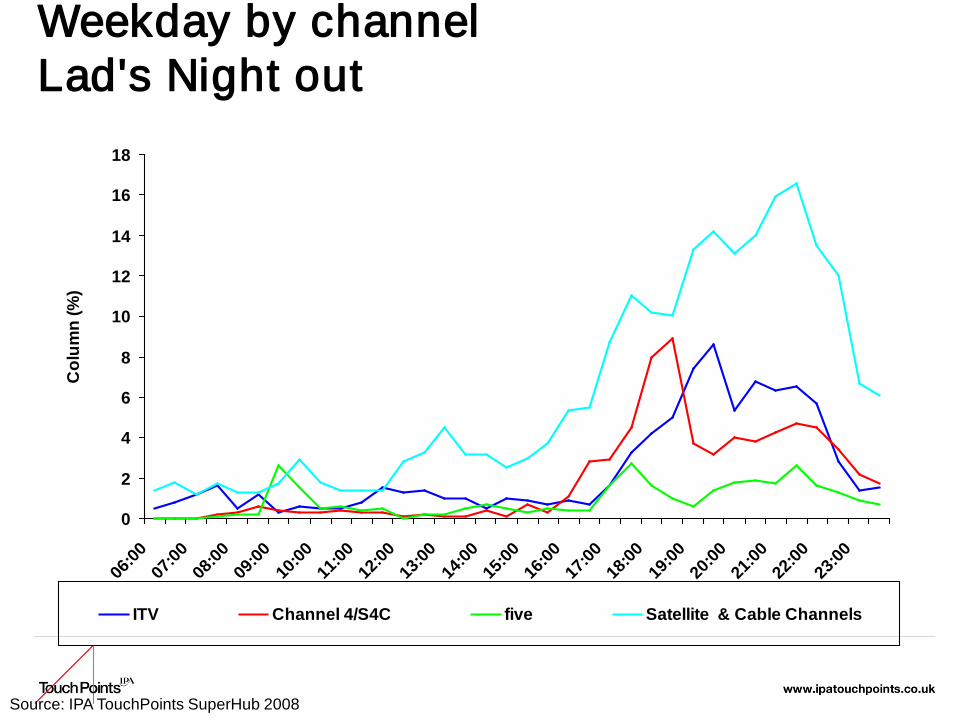
Weekday by channel Lad's Night out
0
2
4
6
8
10
12
14
16
18
06:00
07:00
08:00
09:00
10:00
11:00
12:00
13:00
14:00
15:00
16:00
17:00
18:00
19:00
20:00
21:00
22:00
23:00
Col
umn
(%)
ITV Channel 4/S4C five Satellite & Cable Channels
Source: IPA TouchPoints SuperHub 2008
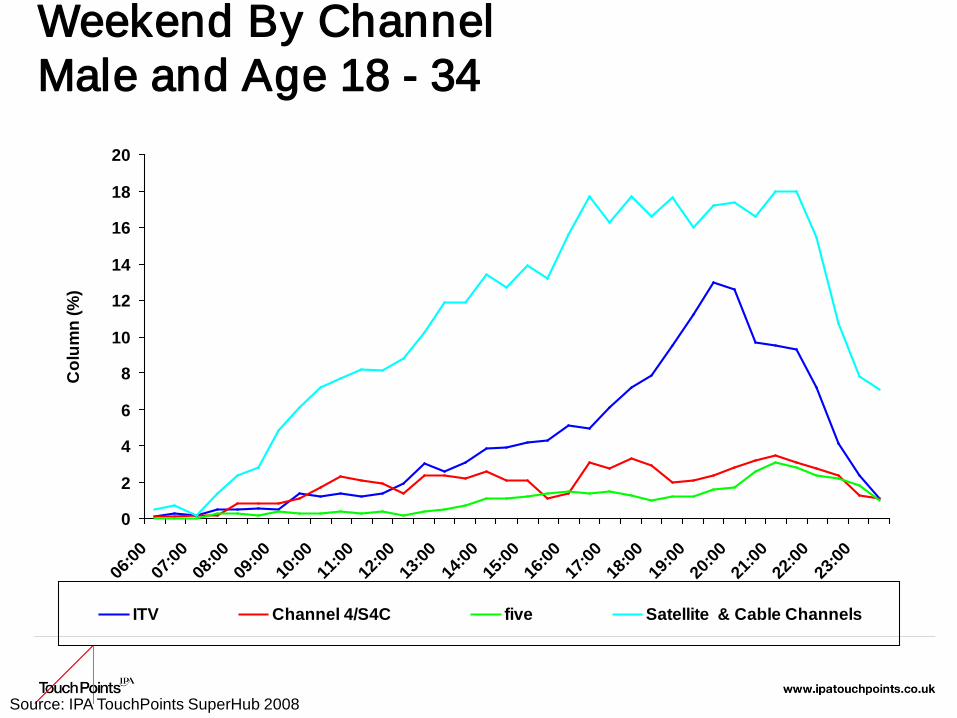
Weekend By ChannelMale and Age 18 - 34
0
2
4
6
8
10
12
14
16
18
20
06:00
07:00
08:00
09:00
10:00
11:00
12:00
13:00
14:00
15:00
16:00
17:00
18:00
19:00
20:00
21:00
22:00
23:00
Col
umn
(%)
ITV Channel 4/S4C five Satellite & Cable Channels
Source: IPA TouchPoints SuperHub 2008

Weekend By ChannelLad's Night out
0
5
10
15
20
25
06:00
07:00
08:00
09:00
10:00
11:00
12:00
13:00
14:00
15:00
16:00
17:00
18:00
19:00
20:00
21:00
22:00
23:00
Col
umn
(%)
ITV Channel 4/S4C five Satellite & Cable Channels
Source: IPA TouchPoints SuperHub 2008

Mood on Saturday
0
5
10
15
20
25
30
35
40
4500
:00
01:0
0
02:0
0
03:0
0
04:0
0
05:0
0
06:0
0
07:0
0
08:0
0
09:0
0
10:0
0
11:0
0
12:0
0
13:0
0
14:0
0
15:0
0
16:0
0
17:0
0
18:0
0
19:0
0
20:0
0
21:0
0
22:0
0
23:0
0
Col
umn
(%)
Male and Age 18 - 34 (Mood top quintile) Lad's night out ( Mood top quintile)
Source: TPT08 IPA Touchpoints SuperHub 2008 (inc TGI)
Saturday night out and about and feeling good!

And what about Sunday?

Proportion awake (Sunday)
0
10
20
30
40
50
60
70
80
90
100
06:00 06:30 07:00 07:30 08:00 08:30 09:00 09:30 10:00 10:30 11:00 11:30 12:00
Col
umn
(%)
Male and Age 18 - 34 Lad's night out
Source: TPT08 IPA Touchpoints SuperHub 2008 (i TGI)
“Lad’s night out” sleeping in!

Saturday “ Nighters” eating & drinkingSunday afternoon/evening
0
5
10
15
20
25
30
06:00
12:30
13:30
14:30
15:30
16:30
17:30
18:30
19:30
20:30
21:30
22:30
23:30
Col
umn
(%)
Male and Age 18 - 34 Lad's night out
But when up, never stop consuming food and drink!
Source: TPT08 IPA Touchpoints SuperHub 2008 (inc TGI)
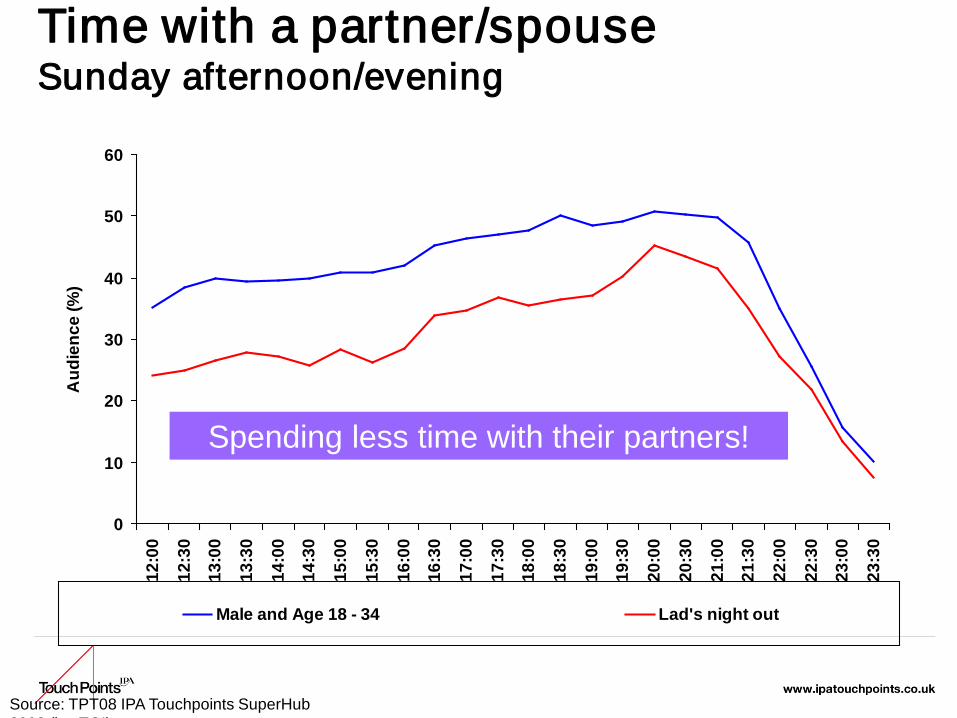
Time with a partner/spouseSunday afternoon/evening
0
10
20
30
40
50
6012
:00
12:3
0
13:0
0
13:3
0
14:0
0
14:3
0
15:0
0
15:3
0
16:0
0
16:3
0
17:0
0
17:3
0
18:0
0
18:3
0
19:0
0
19:3
0
20:0
0
20:3
0
21:0
0
21:3
0
22:0
0
22:3
0
23:0
0
23:3
0
Aud
ienc
e (%
)
Male and Age 18 - 34 Lad's night out
Source: TPT08 IPA Touchpoints SuperHub 2008 (i TGI)
Spending less time with their partners!
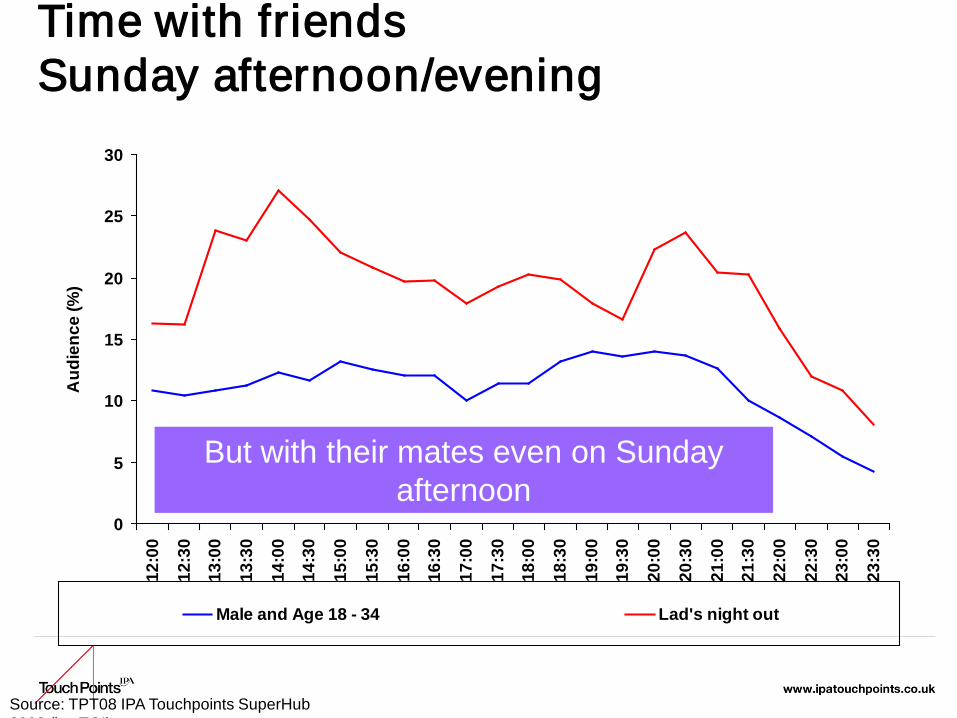
Time with friendsSunday afternoon/evening
0
5
10
15
20
25
3012
:00
12:3
0
13:0
0
13:3
0
14:0
0
14:3
0
15:0
0
15:3
0
16:0
0
16:3
0
17:0
0
17:3
0
18:0
0
18:3
0
19:0
0
19:3
0
20:0
0
20:3
0
21:0
0
21:3
0
22:0
0
22:3
0
23:0
0
23:3
0
Aud
ienc
e (%
)
Male and Age 18 - 34 Lad's night out
Source: TPT08 IPA Touchpoints SuperHub 2008 (i TGI)
But with their mates even on Sunday afternoon
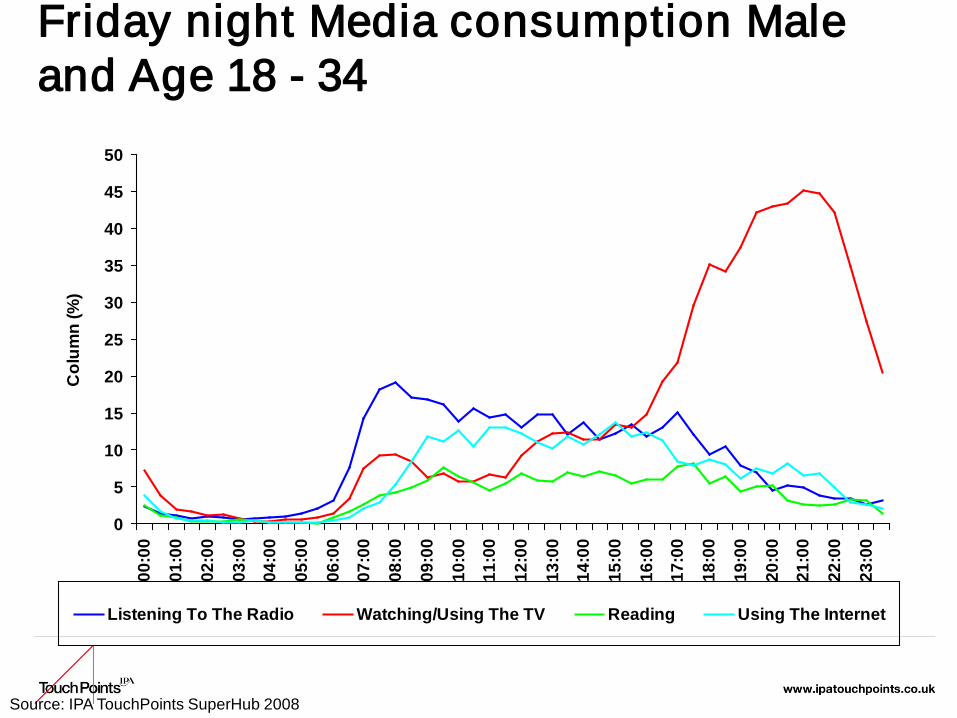
Friday night Media consumption Male and Age 18 - 34
0
5
10
15
20
25
30
35
40
45
5000
:00
01:0
0
02:0
0
03:0
0
04:0
0
05:0
0
06:0
0
07:0
0
08:0
0
09:0
0
10:0
0
11:0
0
12:0
0
13:0
0
14:0
0
15:0
0
16:0
0
17:0
0
18:0
0
19:0
0
20:0
0
21:0
0
22:0
0
23:0
0
Col
umn
(%)
Listening To The Radio Watching/Using The TV Reading Using The Internet
Source: IPA TouchPoints SuperHub 2008

Friday night Media consumption Lad's night out
0
5
10
15
20
25
30
35
40
45
5000
:00
01:0
0
02:0
0
03:0
0
04:0
0
05:0
0
06:0
0
07:0
0
08:0
0
09:0
0
10:0
0
11:0
0
12:0
0
13:0
0
14:0
0
15:0
0
16:0
0
17:0
0
18:0
0
19:0
0
20:0
0
21:0
0
22:0
0
23:0
0
Col
umn
(%)
Listening To The Radio Watching/Using The TV Reading Using The Internet
Source: IPA TouchPoints SuperHub 2008
89
Department of Health, MECStroke savers
—TouchPoints Contribution—Used TouchPoints to identify who the at risk
audiences were with, where they were and what media they were consuming throughout the day.
—Also found out what % of time the at risk audience spent at home and out and about- as different messages were required for each environment.

90
Department of Health, MECThe TouchPoints contribution:At-risk audiences- where are they and who are they with?
91
Department of Health, MEC
—Not just about the target market i.e. the Stroke victim but also the potential Stroke Saver
—TouchPoints was unique in not only showing where the audience was but also who they were with.
—Needed to emphasise the fact that every second counts when someone may be having a stroke.
—Therefore very important to catch potential Stroke Savers throughout the day. Requiring a mix of TV, press, radio, as well as display and out of home.
92
FMCG, MEC
—Context:– Client wanted to investigate the most efficient way to
use their TV budget– Aim to build coverage and achieve cut through (many of
their competitors were on TV)—Issue:
– Too many ratings would lead to diminishing returns which wouldn’t provide the best coverage for the money
– Wanted to prove that some investment in Cinema would increase reach and have the added benefit of being the only brand in this category using Cinema
93
FMCG, MEC
—TouchPoints contribution:– Created three campaigns
• 1 using all the budget in TV• 2 using all the budget in Cinema• 3 34% of budget invested in Cinema and 66% in TV

94
FMCG, MEC

95
FMCG, MEC
—Combined campaign using TV and Cinema is an efficient option for Brand Z. The reach increased overall, with no increase in budget.
—If Brand Z tried to get the same reach with just TV it would require an extra 120 ratings which would be an additional cost for the client.
—TouchPoints showed the client that they could reach more people for the same investment.

96
Brand T,MPG
—Context: Brand T is in the TV Services, Platforms and Electrical Goods category– A number of different target audiences were
defined in TouchPoints• Existing TV Services• Existing TV devices• Attitudes to TV and Technology• Wish to change TV service in next 12 months
97
Brand T, MPG
—Issues: – Client had a budget for driving awareness on
TV but also wanted to consider media to support the point of purchase
• Web comparison sites• Search
—Contribution: – MPG used the Channel planner to work out the
most effective media mix to achieve the client’s objectives
98
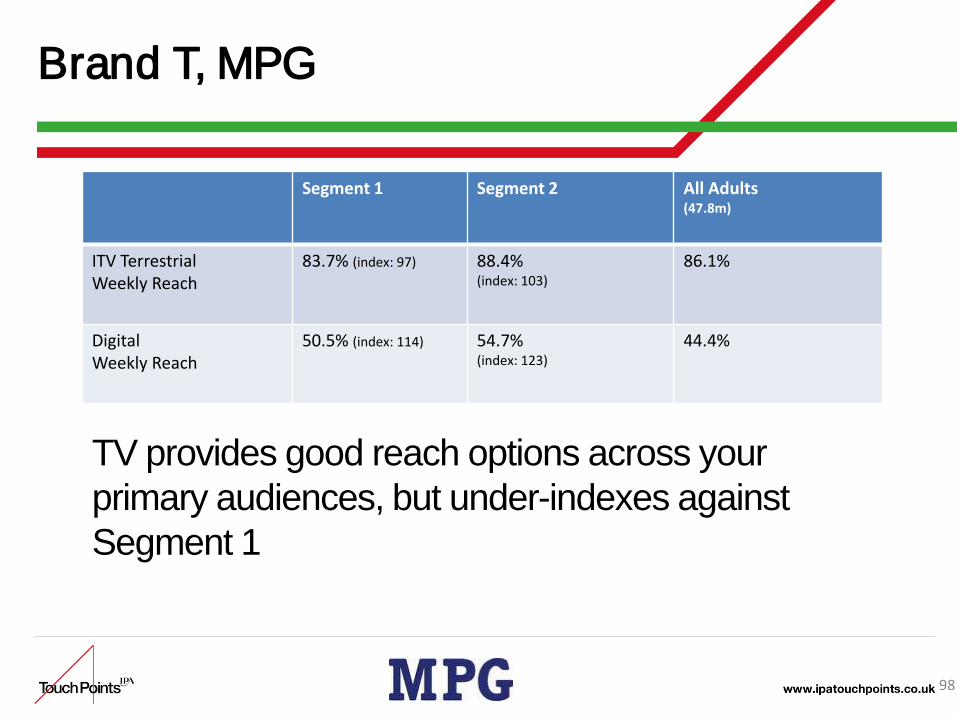
Brand T, MPG
Segment 1 Segment 2 All Adults (47.8m)
ITV TerrestrialWeekly Reach
83.7% (index: 97) 88.4% (index: 103)
86.1%
Digital Weekly Reach
50.5% (index: 114) 54.7% (index: 123)
44.4%
TV provides good reach options across your primary audiences, but under-indexes against Segment 1
99
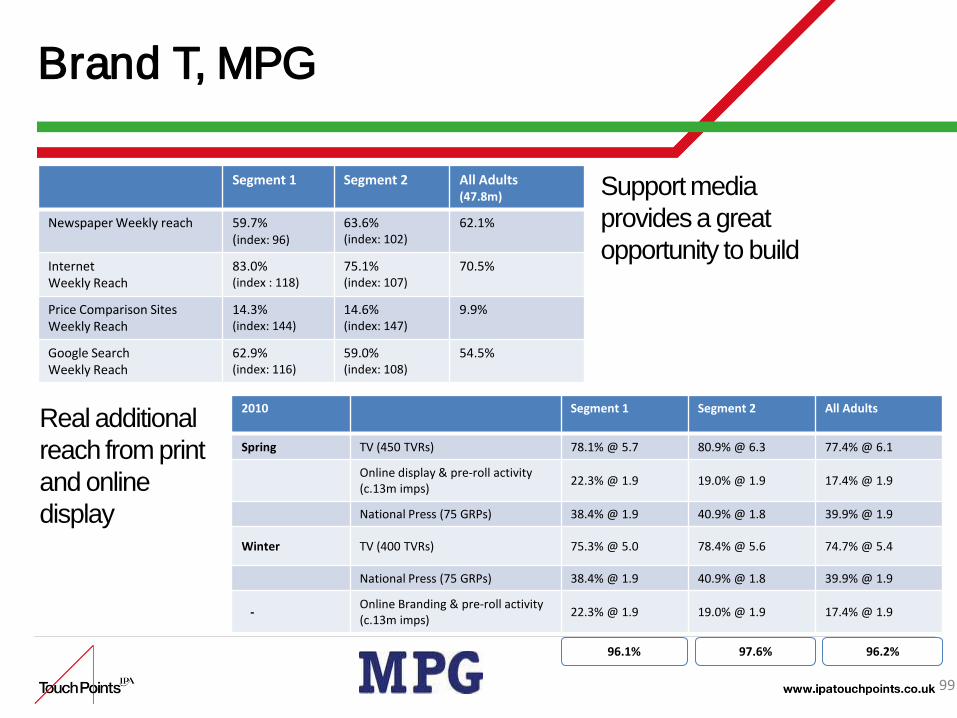
Brand T, MPG
Segment 1 Segment 2 All Adults (47.8m)
Newspaper Weekly reach 59.7% (index: 96)
63.6% (index: 102)
62.1%
InternetWeekly Reach
83.0% (index : 118)
75.1% (index: 107)
70.5%
Price Comparison Sites Weekly Reach
14.3% (index: 144)
14.6% (index: 147)
9.9%
Google Search Weekly Reach
62.9% (index: 116)
59.0% (index: 108)
54.5%
2010 Segment 1 Segment 2 All Adults
Spring TV (450 TVRs) 78.1% @ 5.7 80.9% @ 6.3 77.4% @ 6.1
Online display & pre-roll activity (c.13m imps) 22.3% @ 1.9 19.0% @ 1.9 17.4% @ 1.9
National Press (75 GRPs) 38.4% @ 1.9 40.9% @ 1.8 39.9% @ 1.9
Winter TV (400 TVRs) 75.3% @ 5.0 78.4% @ 5.6 74.7% @ 5.4
National Press (75 GRPs) 38.4% @ 1.9 40.9% @ 1.8 39.9% @ 1.9
- Online Branding & pre-roll activity (c.13m imps) 22.3% @ 1.9 19.0% @ 1.9 17.4% @ 1.9
Support media provides a great opportunity to build
Real additional reach from print and online display
96.2%96.1% 97.6%
100
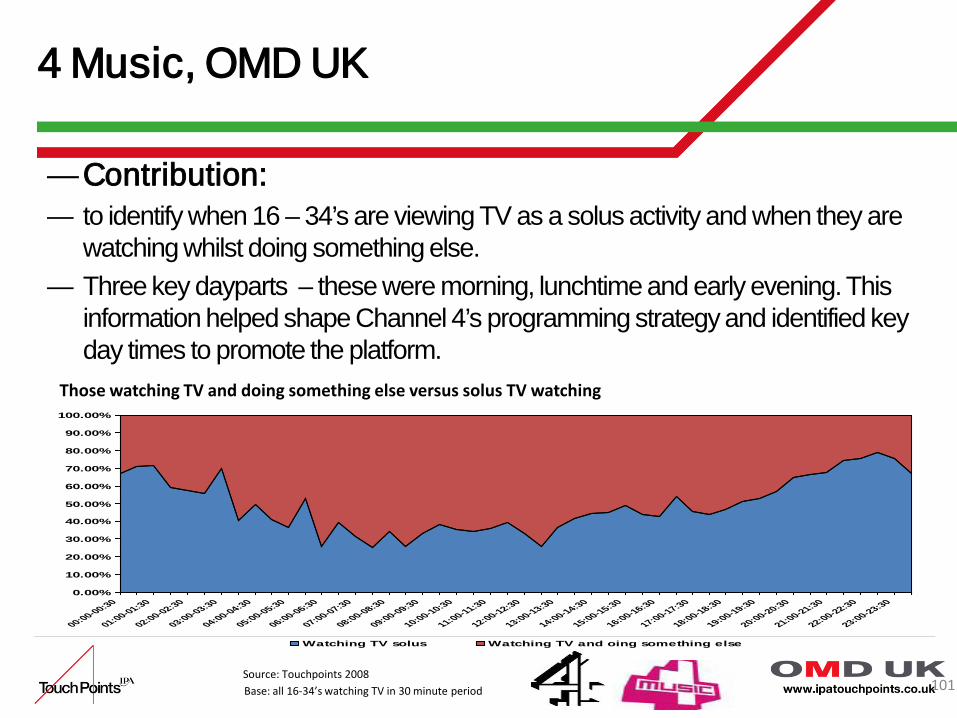
4 Music, OMD UK
—Context: – Channel 4’s music platform, 4 Music, is
regarded as a TV station which viewers watch alongside other activities.
—Issue:– OMD wanted to understand when the key 16-34
audience is watching TV as a primary or secondary activity in order to identify key potential viewing times for this audience.
101
0.00%
10.00%
20.00%
30.00%
40.00%
50.00%
60.00%
70.00%
80.00%
90.00%
100.00%
00:00-00:30
01:00-01:30
02:00-02:30
03:00-03:30
04:00-04:30
05:00-05:30
06:00-06:30
07:00-07:30
08:00-08:30
09:00-09:30
10:00-10:30
11:00-11:30
12:00-12:30
13:00-13:30
14:00-14:30
15:00-15:30
16:00-16:30
17:00-17:30
18:00-18:30
19:00-19:30
20:00-20:30
21:00-21:30
22:00-22:30
23:00-23:30
Watching TV solus Watching TV and oing something else
Those watching TV and doing something else versus solus TV watching
Source: Touchpoints 2008Base: all 16-34’s watching TV in 30 minute period
4 Music, OMD UK
—Contribution:— to identify when 16 – 34’s are viewing TV as a solus activity and when they are
watching whilst doing something else.— Three key dayparts – these were morning, lunchtime and early evening. This
information helped shape Channel 4’s programming strategy and identified key day times to promote the platform.

102
Citroen C5, OMD UK
—Context:– In an environment as competitive as the automotive market,
maintaining the gains made from a launch campaign - without the launch budget - is a real challenge. Smart audience targeting can make the difference.
—The Issue:– Ensuring that awareness and purchase consideration increases
for C5 were maintained in year 2 was the strategic challenge for OMD.
– We recognised that zeroing in on the lives of our fleet user-chooser audience was the only way to achieve our objectives on a modest budget

103
Citroen C5, OMD UK
—IPA TouchPoints Contribution:—Audience analysis showed us how little time these guys had, and
how much of it was spent in their car. TouchPoints allowed us to plan media to penetrate the cocoon of their car and working day, while also reaching them in their precious moments of leisure time.
—The mood diary function allowed us to plan advertising to suit their mood states in our two core strategic areas (Work and Leisure).

104
0
10
20
30
40
50
60
05.0006.30
08.0009.30
11.0012.30
14.0015.30
17.0018.30
20.0021.30
23.0024.30
Watching TVRelaxed >30
0
5
10
15
20
25
30
05.00
06.30
08.00
09.30
11.00
12.30
14.00
15.30
17.00
18.30
20.00
21.30
23.00
24.30
In the CarAlert (+80)Radio
Citroen C5, OMD UK Two key messages at two key times
Product led, functional messages
Emotional Brand led messages

SCA/ Bodyform, Carat
• Carat were given the challenge of launching a new range from the Bodyform parent brand whilst maximising cut through with a budget lower than that of their competitors.
• 30% of target audience claimed they were more likely to buy a product if it is advertised on a website or featured in an online competition over the tradition TV medium.
— Using identical campaign budgets, IPA TouchPoint’s Channel Planner was able to help demonstrate that online can improve TVs reach and frequency without incremental media spend
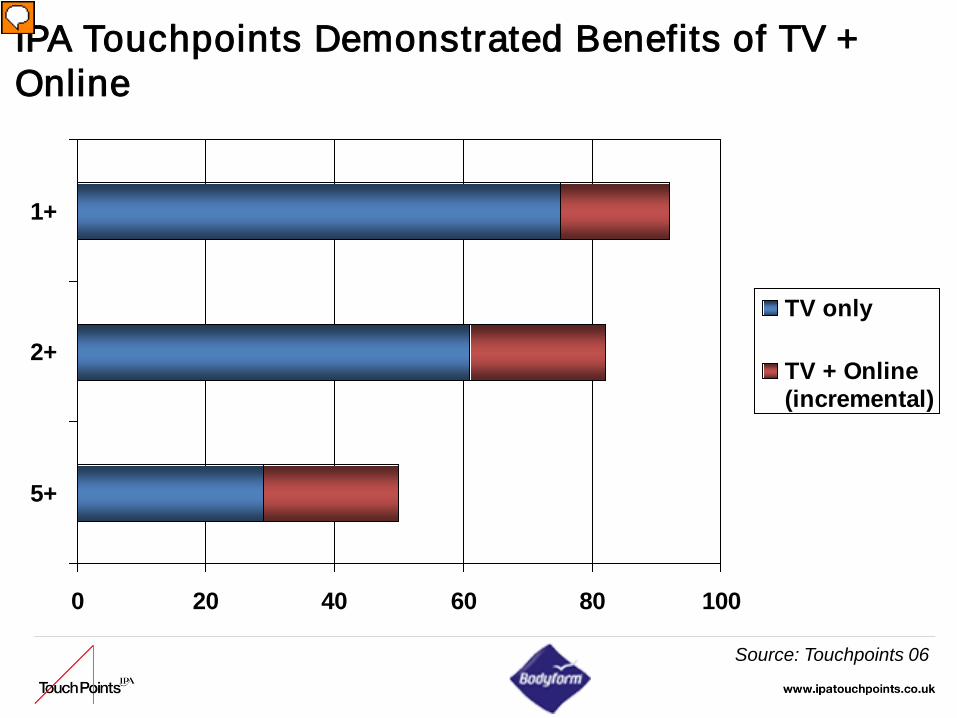
IPA Touchpoints Demonstrated Benefits of TV + Online
Source: Touchpoints 06
0 20 40 60 80 100
5+
2+
1+
TV only
TV + Online(incremental)
107
In summary
—Unique—Delivers it’s objective—An invaluable database in its own right—Is challenging—Forcing the industry to change it’s structures—Is being adopted as an industry data set—Has the ability to link with and leverage other
databases—Is still only 4 years old!

108
Questions?
www.ipatouchpoints.co.uk