iowa nutrient reduction science assessment cost estimate and outreach john d. lawrence associate...
TRANSCRIPT

Iowa Nutrient Reduction Science Assessment
Cost Estimate and Outreach
John D. Lawrence
Associate Dean and Director
Ag and Natural Resources Extension
Iowa State University
Cost Estimates
• Acknowledgement– N and P Teams– Dr. Mike Duffy– ISU Ag Decision Maker Farm Management
• What is not included– Monetized environmental benefits– Adoption time

Overview
• Economic process– Direct estimates
– Indirect effects
• Challenges and remaining questions
• Outreach plans

Cost Estimation
• Focus on farm-level costs
• Price levels
–$5.00, $12.50, $0.50, $0.59
• No overhead costs
• No beyond-the-farm costs or benefits
• No reflection of a cost curve

Equal Annualized Cost
• Allows comparison across practices– Combine recurring annual cost and initial investment
• Annualized initial investment– Used design life of 50 years and discount rate of 4%– Practices with shorter life were replaced to 50 years
• Reoccurring costs– Operations– Inputs

Equal Annualized Cost
• Cost estimates based on current information– Structures based on recent experience– Operations based on 2011 ISU Extension budgets
and surveys for custom rate– Input prices based on 2011 actuals
• When appropriate, consider impact on corn yield
• Land retirement use 2011 Cash Rental Rate Survey

Positive EAC = CostNegative EAC = Benefit
• Examples of positive EAC– Cover crops– Installing bioreactors– Installing wetlands– Land use changes

Positive EAC = CostNegative EAC = Benefit
• Examples of negative EAC– Moving anhydrous ammonia and liquid swine
manure from fall to spring– Reduce fertilizer to recommended rate– Use nitrification inhibitor on fall applied N
• Compared to baseline application rates.
• Crop cost associated with corn yield impact
• Doesn’t account for other costs or risks

Cost per Pound Removed
• It is possible to calculate the EAC per pound removed.
• Why not start with lowest cost practice until it is exhausted then move to next lowest cost?
• Costs differ by site and region
• Shape of cost curve

Cost per Pound Removed N = Page 26, P = page 23
Nitrate-N Reduction %
(from baseline)
Cost of N Reduction $/lb (from baseline)
State Average EAC ** ($/acre)Practice/Scenario
Cover crops (rye) on ALL CS and CC acres 28 5.96 49Reducing nitrogen application rate from background to the MRTN 133 lb N/ac on CB and to 190 lb N/ac on CC (in MLRAs where rates are higher than this)
9 -0.58 -2
Cover crops (rye) on all no-till acres 6 5.97 45Sidedress all spring applied N 4 0.00 0Using a nitrification inhibitor with all fall applied fertilizer
1 -1.53 -3
Move all liquid swine manure and anhydrous to spring preplant
0.3 -74.36 -20
Moving fall anhydrous fertilizer application to spring preplant
0.1 -283.27 -20

Cost curves
Cost
Q
MC
ATC
AFC
AVC

Scenario Approach• Requires a combination of practices
• Example not optimized
• Identify example scenarios that achieves the targeted reduction– Professional judgment– Categories of practices– Round number adoption targets
• Model reductions and farm level costs
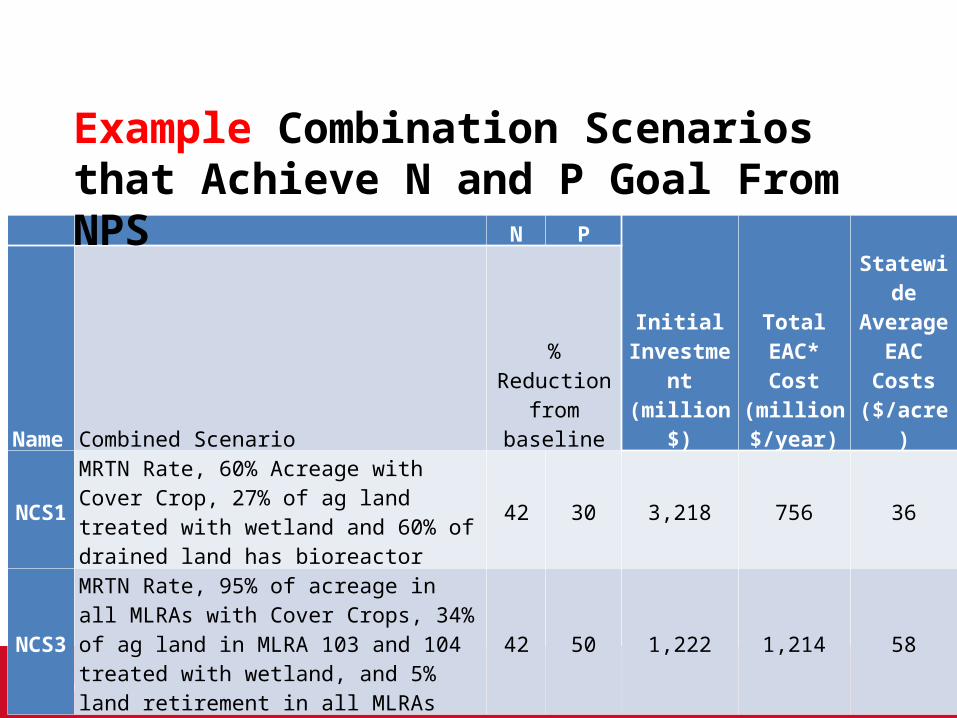
N P
Initial Investment (million $)
Total EAC* Cost
(million $/year)
Statewide Average
EAC Costs ($/acre)Name Combined Scenario
% Reduction from baseline
NCS1MRTN Rate, 60% Acreage with Cover Crop, 27% of ag land treated with wetland and 60% of drained land has bioreactor
42 30 3,218 756 36
NCS3
MRTN Rate, 95% of acreage in all MLRAs with Cover Crops, 34% of ag land in MLRA 103 and 104 treated with wetland, and 5% land retirement in all MLRAs
42 50 1,222 1,214 58
Example Combination Scenarios that Achieve N and P Goal From NPS

N P
Initial Investment (million $)
Total EAC* Cost
(million $/year)
Statewide Average
EAC Costs ($/acre)Name Combined Scenario
% Reduction from baseline
NCS8
MRTN Rate, Inhibitor with all Fall Commercial N, Sidedress All Spring N, 70% of all tile drained acres treated with bioreactor, 70% of all applicable land has controlled drainage, 31.5% of ag land treated with a wetland, and 70% of all agricultural streams have a buffer) - Phosphorus reduction practices (phosphorus rate reduction on all ag land, Convert 90% of Conventional Tillage CS & CC acres to Conservation Till and Convert 10% of Non-No-till CS & CC ground to No-Till
42 29 4,041 77 4
Example Combination Scenarios that Achieve N and P Goal From NPS

Summary of Example Scenarios
Initial Investment (million $)
Total EAC* Cost (million $/year)
Statewide Average EAC
Costs ($/acre)Name
NCS1 3,218 756 36
NCS3 1,222 1,214 58
NCS8 4,041 77 4

Cost Comparison
• EAC includes annualized initial investment– Comparing apples to apple slices
• Initial investment addresses feasibility– Cost share and incentives not included
• Annual operating costs tests enforcement– Cost of enforcement and verification not included
• Negative EAC a key issue

Other Economic Considerations
• These are farm level average cost estimates– Cost curve and high adoption rates
• No overhead costs– Implementation– Enforcement
• Infrastructure costs– Agribusiness– Construction

Other Economic Considerations• From individual to market
– Cover crops, 312,000 acres of rye for seed production, more than was harvested in 2011
– Bioreactors, 111,000 acres of trees – Fall to spring application, $194 million/year for
infrastructure costs
• Yield impact of delayed planting from more spring work

Other Economic Considerations• Impact of supply changes on price
– Corn $0.00136/bu– Soybeans $0.00625/bu– Alfalfa 0.8% / 1.0%
• Higher prices for sellers but higher costs for buyers – NFI change is about half GFI change– Price gain doesn’t offset production lost

Net Farm Income
• For a 2.3 bbu Iowa corn crop, GFI increases $230 million per dime.
• A dime price change in corn impacts Iowa NFI by $110 million in the same direction.
• Beyond farm consumers also impacted– Processors– Export customers

Challenges and Remaining Issues
• Benefits – Environmental benefits discussed, not monetized– Non-yield benefits of SOM not captured– Investments and practices will generate economic
activity
• Costs– Some practices have downsides– P surplus producers have higher application cost

Challenges and Remaining Issues
• Changes will lead to winners and losers• Unintended consequences, positive and
negative, not fully explored• High adoption rates
– Will have market implications– Markets implications change cost estimates– Will require time for logistics and costs

Challenges and Remaining Issues
• One state v. regional or national policy• Global response to change in US prices• Food price implications• Value of cleaner water locally and in the Gulf• Cost – benefit may differ by practice and
location

Outreach Plan• Announcement at PAT• Overview and detail at CAS• Overview at MAC• Dedicated website• Opportunity for comment
– Website– At meetings with detail– Public meetings– Formal comments