iowa comprehensive annual financial report
TRANSCRIPT

Iowa ComprehensiveAnnual Financial Report
For the Fiscal Year Ended June 30, 2015

Effigy Mounds National Monument in Harpers Ferry, Iowa, is home to over 200 prehistoric American Indian burial and ceremonial mounds, 31 of which are shaped in the likeness of bears or birds. The park is located on 2,500 scenic acres of forested land along the Mississippi River in Northeast Iowa.
Photo: Iowa Tourism Office

COMPREHENSIVE ANNUAL
FINANCIAL REPORT
For the Fiscal Year
Ended June 30, 2015
GOVERNOR:
Terry E. Branstad
PREPARED BY:
The Iowa Department of Administrative Services - State Accounting Enterprise

INTRODUCTORY SECTION
Letter of Transmittal 6-10
GFOA Certificate of Achievement 11
State of Iowa Organizational Chart 12
Principal Officials 13
FINANCIAL SECTION
INDEPENDENT AUDITOR'S REPORT 16-18
MANAGEMENT'S DISCUSSION AND ANALYSIS 19-31
BASIC FINANCIAL STATEMENTS
Government-wide Financial Statements
Statement of Net Position 34-35
Statement of Activities 37
Governmental Fund Financial Statements
Balance Sheet 40
Reconciliation of the Balance Sheet - Governmental Funds to the Statement of Net Position 41
Statement of Revenues, Expenditures and Changes in Fund Balances 42
Reconciliation of the Statement of Revenues, Expenditures and Changes in Fund Balances -
Governmental Funds to the Statement of Activities 43
Proprietary Fund Financial Statements
Statement of Net Position 46
Statement of Revenues, Expenses and Changes in Fund Net Position 47
Statement of Cash Flows 48-49
Fiduciary Fund Financial Statements
Statement of Fiduciary Net Position 52
Statement of Changes in Fiduciary Net Position 53
Component Unit Financial Statements
Statement of Net Position 56-57
Statement of Activities 58-59
Notes to the Financial Statements 61-127
REQUIRED SUPPLEMENTARY INFORMATION
Budgetary Comparison Schedule - General Fund 130-131
Budgetary Comparison Schedule - Budget to GAAP Reconciliation - General Fund 132
Notes to Required Supplementary Information - Budgetary Reporting 133-135
Schedules of Funding Progress 136
Schedule of the Proportionate Share of the Net Pension Liability 137
Schedules of Changes in Net Pension Liability and Related Ratios 138-139
Schedules of Contributions 140-142
Notes to Required Supplementary Information - Schedules of Contributions 143-146
STATE OF IOWA
Comprehensive Annual Financial Report
Table of Contents
For the Fiscal Year Ended June 30, 2015
2

SUPPLEMENTARY INFORMATION
Governmental Funds
Combining Balance Sheet - By Fund Type 148
Combining Statement of Revenues, Expenditures and Changes in Fund Balances - By Fund Type 149
Special Revenue Funds
Combining Balance Sheet 152
Combining Statement of Revenues, Expenditures and Changes in Fund Balances 153
Combining Schedule of Revenues, Expenditures and Changes in Fund Balances - Budget and
Actual - Budgetary Basis 155-157
Capital Projects Funds
Combining Balance Sheet 160
Combining Statement of Revenues, Expenditures and Changes in Fund Balances 161
Permanent Funds
Combining Balance Sheet 164
Combining Statement of Revenues, Expenditures and Changes in Fund Balances 165
Proprietary Funds
Enterprise Funds
Combining Statement of Net Position 168
Combining Statement of Revenues, Expenses and Changes in Fund Net Position 169
Combining Statement of Cash Flows 171
Internal Service Funds
Combining Statement of Net Position 174
Combining Statement of Revenues, Expenses and Changes in Fund Net Position 175
Combining Statement of Cash Flows 177
Fiduciary Funds
Pension and Other Employee Benefit Funds
Combining Statement of Fiduciary Net Position 180
Combining Statement of Changes in Fiduciary Net Position 181
Private Purpose Trust Funds
Combining Statement of Fiduciary Net Position 184
Combining Statement of Changes in Fiduciary Net Position 185
Agency Funds
Combining Statement of Fiduciary Net Position 188
Combining Statement of Changes in Assets and Liabilities 189
STATISTICAL SECTION Schedule
Schedule of Net Position by Component 1 194
Schedule of Changes in Net Position 2 195-196
Schedule of Fund Balances of Governmental Funds 3 197
Schedule of Changes in Fund Balances of Governmental Funds 4 198
Schedule of Tax Revenue by Source - Governmental Funds 5 199
Schedule of Individual Income Tax Returns Filed and Tax Rates 6 200
Schedule of Retail Sales by Business Classification 7 201
Schedule of Ratios of Outstanding Debt by Type 8 202
Schedule of Revenue Bond Coverage 9 203-206
Schedule of Demographic and Economic Statistics 10 207
Schedule of Principal Non-governmental Employers 11 208
Schedule of Significant Classes of Capital Assets by Function 12 209-210
Schedule of Operating Indicators by Function 13 211
Schedule of Number of Employees - Primary Government 14 212
Schedule of Current Expenditures - General Fund 15 213
ACKNOWLEDGMENTS
3

IOWA
4

I N T R O D U C T O R Y
S E C T I O N
5

December 14, 2015
TO THE CITIZENS, GOVERNOR AND MEMBERS OF THE IOWA GENERAL ASSEMBLY
In accordance with Iowa Code Section 8A.502(8), we are pleased to submit the Comprehensive
Annual Financial Report (CAFR) for the State of Iowa for the fiscal year ended June 30, 2015. As
required by State statute, this report has been prepared in accordance with U.S. Generally Accepted
Accounting Principles (GAAP) for governments as promulgated by the Governmental Accounting
Standards Board (GASB).
The Department of Administrative Services and the Department of Management are responsible for
both the accuracy of the presented data and the completeness and fairness of the presentation. We
believe the information presented is accurate in all material respects and the necessary disclosures
have been made in order to enable the reader to understand the State’s financial activity.
The State’s system of internal controls over assets recorded in the accounting system have been
designed to provide reasonable, but not absolute, assurance that assets are safeguarded against
unauthorized use or disposition and financial records from all appropriate sources are reliable for
preparing financial statements and maintaining accountability. The concept of reasonable assurance
recognizes the cost of internal controls should not exceed the benefits likely to be derived from their
use. To monitor the adequacy of internal controls, the Auditor of State reviews internal control
procedures as an integral part of departmental audits.
The Auditor of State is required by Chapter 11 of the Code of Iowa to audit annually all departments
of the State. The accompanying basic financial statements of the State of Iowa have been audited by
the Auditor of State in accordance with U.S. generally accepted auditing standards and the
standards applicable to financial audits contained in Government Auditing Standards, issued by the
Comptroller General of the United States. The Auditor of State’s report appears elsewhere herein. In
addition, the Auditor of State conducts a single audit under the requirements set forth in the Single
Audit Act of 1984, the Single Audit Amendments of 1996 and OMB Circular A-133, Audits of States,
Local Governments, and Non-Profit Organizations which is issued separately.
GAAP requires that management provide a narrative introduction, overview and analysis to
accompany the basic financial statements in the form of the Management’s Discussion and Analysis
(MD&A). This letter of transmittal is designed to complement the MD&A and should be read in
conjunction with it. The MD&A can be found immediately following the Independent Auditor’s
Report.
6

PROFILE OF THE GOVERNMENT
The State of Iowa was admitted into the Union as the 29th state in 1846. Iowa is a midsize state with
a mid-continent location. It covers 56,276 square miles, making it the 26th largest state in the United
States. The Mississippi River carves out Iowa’s eastern border, while the flow of the Missouri and Big
Sioux Rivers form the western border. Iowa has a population of 3.1 million.
In Iowa, government power is distributed among three branches. The Legislative branch creates laws
that establish policies and programs; the Executive branch carries out the policies and programs
created in the laws and the Judicial branch resolves any conflicts arising from interpretation or
application of the laws. The Executive branch agencies are the Governor, Lieutenant Governor,
Secretary of State, Treasurer of State, Secretary of Agriculture, Attorney General, and Auditor of
State, as well as 31 agencies lead by appointed State officials. The Legislative branch is comprised of
two houses, a 50 member Senate and a 100 member House of Representatives. The Judicial branch
is presided over by the Iowa Supreme Court, which is led by the Chief Justice of the Iowa Supreme
Court.
The State provides a range of services such as education, health and human services, highway
maintenance and construction, natural resources and agriculture management, law enforcement,
public safety, and economic development programs.
This report includes all of the fund types, departments and agencies of the State, as well as the
boards, commissions, authorities and universities for which the State is financially accountable.
Component units also included in the report are the Iowa Finance Authority, Iowa Economic
Development Authority, Iowa State Fair Authority, Iowa Lottery Authority, University Foundations,
University of Iowa Research Foundation, and University of Iowa Health System and Subsidiaries.
The reader is directed to Note 1.B in the Notes to the Financial Statements for a more complete
description of the factors used to define the reporting entity.
State Budget and Budgetary Controls. The annual budgetary process serves as the foundation for
the State’s financial planning and control. Each year state departments submit budget requests to
the Governor’s Office by October 1. The State’s budget is prepared by the Governor on an annual
basis and is required to be submitted, along with proposed appropriation bills, to the General
Assembly by the first of February prior to the new fiscal year. The General Assembly approves
appropriation bills which establish spending authority for the upcoming fiscal year. The Governor
has the ability to approve, veto or item veto appropriation bills as they are presented to him.
Departments may request revisions to allotments, appropriation transfers, or supplemental
appropriations. The Department of Management approves revised allotments within an
appropriation, subject to the Governor’s review. The Governor and the Department of Management
approve all appropriation transfers. The General Assembly and the Governor act on supplemental
appropriation bills in a manner similar to original appropriations. Appropriations lapse at fiscal
year-end and all unencumbered or unobligated balances revert to the State treasury, unless
otherwise provided.
7

All claims presented for payment must be approved by the appropriate department. The expenditure
must be for a purpose intended by law and a sufficient existing and unexpended appropriation
balance must be available. Budgetary controls are incorporated into State accounting systems. The
annual budget of the State is established through separate appropriations to individual departments
for specific purposes, special outlays and/or operating expenditures. Budgetary control is essentially
maintained at the departmental level except for certain grant and aid programs where control is
maintained at the program level.
ECONOMIC CONDITION AND OUTLOOK
National Economic Outlook 2015-2016
During calendar year 2014, gross domestic product showed growth of 2.4 percent, reflecting the
continued overall rebound the national economy is experiencing. According to Moody’s Analytics, the
projection for gross domestic product growth in calendar year 2015 is 2.5 percent and 3.2 percent in
calendar year 2016.
Job growth has continued to improve over the past year. During calendar year 2014, 1.9 million jobs
were gained nationally. Projections provided by Moody’s Analytics for calendar year 2015 are for
continued growth with 2.1 million jobs gained, and 1.9 million gained for calendar year 2016.
State and Local Economy
Iowa’s economy is supported by a diverse mixture of industry, agriculture, services and government
employment. In calendar year 2014, 18.3 percent of the state’s gross domestic product was in
manufacturing, down from 20.4 percent 10 years ago. The finance, insurance, and real estate sector
has continued to be the largest part of the State’s economy at 21.5 percent during calendar year
2014. With the growth in renewable fuels processing in Iowa, and higher grain and livestock prices,
agriculture has grown from 5.7 percent in 2004 to 7.2 percent in 2014. However, with the slowdown
in the past year in agriculture, in calendar year 2014, Iowa’s real gross domestic product increased
only 0.4 percent ranking Iowa 45th in growth rate nationally. The United States average growth
during the calendar year was 2.2 percent.
Personal Income. Personal income, as reported by the U.S. Department of Commerce, for the
nation increased 3.9 percent during calendar year 2014. Iowa’s personal income rose 1.3 percent for
the calendar year 2014, ranking Iowa 49th in growth rate nationally. For the second quarter,
calendar year 2015, Iowa’s personal income increased 0.8 percent, ranking Iowa 31st in growth rate
nationally.
Employment. Over the past 10 years, Iowa’s unemployment rate has been between one and three
percentage points below the national average. As of June 2015, the state unemployment rate stood
at 3.7 percent, while the national average stood at 5.3 percent. Following the national trend,
unemployment at the state level has continued to drop during calendar year 2014, from 4.4 percent
in January 2014 to 4.3 percent in December 2014. During calendar year 2014, nonfarm
employment on a nonseasonally adjusted basis increased a net 22,800 jobs. During this time period,
the construction sector gained 7,900 jobs, the trade and transportation and government sectors
gained 3,100 jobs each, leisure and hospitality sector gained 3,000 jobs, 2,400 jobs were gained in
8

the education and health sector, 2,200 jobs gained in the professional and business sector, and 600
jobs in the financial activities and other services sectors. These gains were offset by reductions of
500 jobs in the information sector. The rest of the economic sectors had smaller job changes.
Exports. Exporting industries have been an important factor in Iowa’s economic growth since the
1990’s. Growth in exports of various agriculture and manufacturing commodities have helped
diversify Iowa’s economy. In calendar year 2014 according to the U.S. Census Bureau, Iowa exports
increased 8.7 percent, after dropping 5.0 percent in calendar year 2013.
Canada continues to remain the top country for Iowa’s exports, with Mexico as Iowa’s second best
trading partner. In 2014, Iowa’s agricultural export value was second to California nationally.
Farmland Values. The Federal Reserve Bank of Chicago, in their August 2015 public release,
reported that farmland values for the Seventh Federal Reserve District (Chicago) had decreased 3.0
percent from a year ago for the second quarter of 2015. Farmland values in Iowa decreased by 7.0
percent for the period July 1, 2014 to July 1, 2015. A majority of bankers responding to the survey
sent out by the Federal Reserve Bank of Chicago believe that land values have stabilized, while some
projected agricultural land values will decrease in the coming quarters.
Manufacturing. Iowa’s manufacturing employment increased to an average of 216,800 for 2014, up
from the 2013 level of 214,400. During calendar year 2014, durable goods products accounted for
about 60.4 percent of manufacturing employment.
Financial Policies
The Governor and General Assembly have statutory responsibility to balance the budget.
Spending is limited to 99.0 percent of adjusted revenues, 95.0 percent of any new revenue
implemented in a fiscal year, and any carry-over from the previous year.
The Governor and the Legislature are required to use the revenue estimates agreed to by the
December Revenue Estimating Conference, or the spring estimate if it is lower, as a basis to
determine the General Fund budget for the following fiscal year.
Two reserve funds have been created: the Cash Reserve Fund and the Economic Emergency
Fund. Expenditures from these funds are limited by statute for nonrecurring, emergency
expenditures.
MAJOR INITIATIVES AND ISSUES
Increase funding for transportation infrastructure. During the 2015 session, the General
Assembly passed and the Governor signed into law an increase in gasoline tax which is estimated to
support the investment of $3.2 billion over five years in Iowa’s roads and bridges.
9

10

11

Voters
Legislative BranchLegislative Branch Legislative BranchExecutive Branch Legislative BranchJudicial Branch
SenateSenateSupreme
CourtSupreme
Court
State CourtAdministrator
State CourtAdministrator
DistrictCourtDistrictCourt
Court ofAppealsCourt ofAppeals
SecretaryOf StateSecretaryOf State
Auditorof StateAuditorof State
LieutenantGovernorLieutenantGovernor
Governor
Governor TreasurerOf StateTreasurerOf State
AttorneyGeneralAttorneyGeneral
Secretaryof Agriculture
Secretaryof Agriculture
Department ofAdministrative
Services
Department ofAdministrative
ServicesDepartment ofManagementDepartment ofManagement
SenateDepartment of
Commerce
SenateIowa WorkforceDevelopment
SenateDepartment of
Inspections andAppeals
SenateDepartment of
Natural Resources
SenateDepartment on
Aging
SenateDepartment ofHuman Rights
SenateDepartment of
Human Services
SenateDepartment ofPublic Health
SenateDepartment of
Veterans Affairs
SenateDepartment for
the Blind
SenateCollege Student Aid Commission
SenateDepartment ofCultural Affairs
SenateDepartment of
Education
SenateIowa
CommunicationsNetwork
SenateDepartment of
Corrections
SenateLaw
EnforcementAcademy
SenateDepartment ofPublic Defense
SenateDepartment ofPublic Safety
SenateDepartment ofTransportation
Legislative ServiceAgency
Legislative ServiceAgency
House of Representatives
House of Representatives
SenateCivil RightsCommission
Department of Agriculture & Land
Stewardship
Iowa Finance Authority
SenateDepartment of
Revenue
Department of Justice
Citizen’sAid/Ombudsman
Citizens’Aide/Ombudsman
State of Iowa Organizational Chart
SenateIowa Veterans
Home
Executive Branch
Agencies
SenateIowa Homeland
Security
SenateIowa Economic Development
Authority
SenateIowa Fair
BoardSenateIowa LotterySenateIPERS
SenateOffice of the Chief Information Officer
Prepared for the Fiscal Year 2015 Comprehensive Annual Financial Report12

GOVERNOR - Terry E. Branstad
LIEUTENANT GOVERNOR - Kimberly K. Reynolds
SECRETARY OF STATE - Paul D. Pate
AUDITOR OF STATE - Mary Mosiman
TREASURER OF STATE - Michael L. Fitzgerald
SECRETARY OF AGRICULTURE - William H. Northey
ATTORNEY GENERAL - Thomas J. Miller
PRESIDENT OF THE SENATE - Pam Jochum
SPEAKER OF THE
HOUSE OF REPRESENTATIVES - Kraig Paulsen
CHIEF JUSTICE OF
THE SUPREME COURT - Mark S. Cady
Elected Officials
Principal Officials
Legislative Branch
Judicial Branch
13

IOWA
14

F I N A N C I A L
S E C T I O N
15

OFFICE OF AUDITOR OF STATE STATE OF IOWA
State Capitol Building
Des Moines, Iowa 50319-0004
Telephone (515) 281-5834 Facsimile (515) 242-6134
Mary Mosiman, CPA
Auditor of State
Independent Auditor’s Report
To the Governor and Members of the General Assembly:
Report on the Financial Statements
We have audited the accompanying financial statements of the governmental activities, the
business-type activities, the aggregate discretely presented component units, each major fund and
the aggregate remaining fund information of the State of Iowa, as of and for the year ended
June 30, 2015, and the related Notes to Financial Statements, which collectively comprise the
State’s basic financial statements listed in the table of contents.
Management’s Responsibility for the Financial Statements
Management is responsible for the preparation and fair presentation of these financial
statements in accordance with U.S. generally accepted accounting principles. This includes the
design, implementation and maintenance of internal control relevant to the preparation and fair
presentation of financial statements that are free from material misstatement, whether due to
fraud or error.
Auditor’s Responsibility
Our responsibility is to express opinions on these financial statements based on our audit.
We did not audit the financial statements of the Tobacco Settlement Authority, which is a major
fund and represents 3% of the assets and less than 1% of the net position and the revenues of the
governmental activities. We did not audit the financial statements of the Iowa Finance Authority,
the University of Iowa Foundation, the Iowa State University Foundation, the University of
Northern Iowa Foundation, the University of Iowa Research Foundation and the University of Iowa
Health System and Subsidiaries, which represent a total of 93%, 92% and 47%, respectively, of
the assets, the net position and the revenues of the aggregate discretely presented component
units. Those financial statements were audited by other auditors whose reports have been
furnished to us, and our opinion, insofar as it relates to the amounts included for the Tobacco
Settlement Authority, the Iowa Finance Authority, the University of Iowa Foundation, the Iowa
State University Foundation, the University of Northern Iowa Foundation, the University of Iowa
Research Foundation and the University of Iowa Health System and Subsidiaries, is based solely
on the reports of the other auditors. We conducted our audit in accordance with U.S. generally
accepted auditing standards and the standards applicable to financial audits contained in
Government Auditing Standards, issued by the Comptroller General of the United States. Those
standards require that we plan and perform the audit to obtain reasonable assurance about
whether the financial statements are free from material misstatement. The financial statements of
the University of Iowa Foundation, the Iowa State University Foundation, the University of
Northern Iowa Foundation and the University of Iowa Health System and Subsidiaries were not
audited in accordance with Government Auditing Standards.
16

An audit involves performing procedures to obtain audit evidence about the amounts and
disclosures in the financial statements. The procedures selected depend on the auditor’s
judgment, including the assessment of the risks of material misstatement of the financial
statements, whether due to fraud or error. In making those risk assessments, the auditor
considers internal control relevant to the State of Iowa’s preparation and fair presentation of the
financial statements in order to design audit procedures that are appropriate in the
circumstances, but not for the purpose of expressing an opinion on the effectiveness of the State
of Iowa’s internal control. Accordingly, we express no such opinion. An audit also includes
evaluating the appropriateness of accounting policies used and the reasonableness of significant
accounting estimates made by management, as well as evaluating the overall presentation of the
financial statements.
We believe the audit evidence we have obtained is sufficient and appropriate to provide a
basis for our audit opinions.
Opinions
In our opinion, based on our audit and the reports of the other auditors, the financial
statements referred to above present fairly, in all material respects, the respective financial
position of the governmental activities, the business-type activities, the aggregate discretely
presented component units, each major fund and the aggregate remaining fund information of the
State of Iowa as of June 30, 2015, and the respective changes in its financial position and, where
applicable, its cash flows thereof for the year then ended in accordance with U.S. generally
accepted accounting principles.
Emphasis of a Matter
As discussed in Note 20 to the financial statements, the State of Iowa adopted new
accounting guidance related to Governmental Accounting Standards Board (GASB) Statement No.
68, Accounting and Financial Reporting for Pensions - an Amendment of GASB Statement No. 27
and GASB Statement No. 71, Pension Transition for Contributions Made Subsequent to the
Measurement Date. Our opinions are not modified with respect to this matter.
Other Matters
Required Supplementary Information
U.S. generally accepted accounting principles require Management’s Discussion and
Analysis, the Budgetary Comparison Information, the Schedules of Funding Progress, the
Schedule of the Proportionate Share of the Net Pension Liability, the Schedules of Changes in Net
Pension Liability and Related Ratios and the Schedules of Contributions on pages 19 through 31
and 130 through 146 be presented to supplement the basic financial statements. Such
information, although not a part of the basic financial statements, is required by the
Governmental Accounting Standards Board which considers it to be an essential part of financial
reporting for placing the basic financial statements in an appropriate operational, economic or
historical context. We and the auditors of the Tobacco Settlement Authority, the Iowa Finance
Authority and the University of Iowa Research Foundation have applied certain limited procedures
to the required supplementary information in accordance with U.S. generally accepted auditing
standards, which consisted of inquiries of management about the methods of preparing the
information and comparing the information for consistency with management’s responses to the
auditor’s inquiries, the basic financial statements and other knowledge obtained during our audit
of the basic financial statements. We do not express an opinion or provide any assurance on the
information because the limited procedures do not provide us with sufficient evidence to express
an opinion or provide any assurance.
17

Supplementary and Other Information
Our audit was conducted for the purpose of forming opinions on the financial statements
that collectively comprise the State of Iowa’s basic financial statements. The supplementary
information identified in the Table of Contents and the Introductory and Statistical Sections are
presented for purposes of additional analysis and are not a required part of the basic financial
statements.
The supplementary information is the responsibility of management and was derived from
and relates directly to the underlying accounting and other records used to prepare the basic
financial statements. Such information has been subjected to the auditing procedures applied in
the audit of the basic financial statements and certain additional procedures, including comparing
and reconciling such information directly to the underlying accounting and other records used to
prepare the basic financial statements or to the basic financial statements themselves, and other
additional procedures in accordance with U.S. generally accepted auditing standards by us and
the other auditors. In our opinion, based on our audit, the procedures performed as described
above, and the reports of the other auditors, the supplementary information is fairly stated, in all
material respects, in relation to the basic financial statements taken as a whole.
The Introductory and Statistical Sections have not been subjected to the auditing
procedures applied in the audit of the basic financial statements and, accordingly, we do not
express an opinion or provide assurance on them.
Other Reporting Required by Government Auditing Standards
Our report on the State of Iowa’s internal control over financial reporting and other tests of
its compliance with certain provisions of laws, regulations, contracts and grant agreements and
other matters required by Government Auditing Standards will be issued under separate cover.
The purpose of that report is to describe the scope of our testing of internal control over financial
reporting and compliance and the results of that testing, and not to provide an opinion on the
internal control over financial reporting or on compliance. That report is an integral part of an
audit performed in accordance with Government Auditing Standards and should be considered in
assessing the results of our audits.
MARY MOSIMAN, CPA WARREN G. JENKINS, CPA
Auditor of State Chief Deputy Auditor of State
December 14, 2015
18
MANAGEMENT’S DISCUSSION AND ANALYSIS
The Management’s Discussion and Analysis of the State of Iowa’s Comprehensive Annual Financial Report (CAFR) presents a discussion and analysis of the State’s financial performance during the fiscal year that ended on June 30, 2015. Readers are encouraged to consider this information in conjunction with the letter of transmittal located at the front of the CAFR and the State’s financial statements, which follow this section of the CAFR.
FINANCIAL HIGHLIGHTS – PRIMARY GOVERNMENT
Government-wide Highlights
The assets and deferred outflows of resources of the State of Iowa exceeded its liabilities and deferred inflows
of resources at the close of fiscal year 2015 by $15,501.3 million (net position). Of this amount, $1,346.2million (unrestricted net position) is available to be used to meet the State’s ongoing obligations to citizensand creditors.
Total net position decreased $437.9 million from June 30, 2014 (not restated) to June 30, 2015. See NOTE
20 – BEGINNING BALANCE ADJUSTMENTS. Net position of governmental activities decreased $737.1million, or 7.8%, while net position of business-type activities increased $299.2 million, or 4.6%.
In the State’s governmental activities, revenues increased 6.3% to $16,123.3 million while expenses increased7.5% to $15,409.7 million.
For business-type activities, revenues increased 0.7% to $4,845.2 million while expenses increased 3.0% to
$5,000.3 million.
Fund Highlights
The State’s governmental funds reported a combined ending fund balance of $2,482.6 million, a $481.7million decrease from the prior year. Of this amount, $60.9 million represents nonspendable fund balances,$1,299.1 million represents spendable restricted fund balances, $1,700.7 million represents spendable
committed fund balances and a negative $578.1 million represents unassigned fund balances.
The General Fund total fund balance decreased $474.7 million to $2,309.6 million.
The proprietary funds reported net position at year-end of $6,937.1 million, an increase of $288.6 million.
Long-term Debt
The State’s total long-term debt decreased $0.3 million to $3,679.1 million during the current fiscal year.
OVERVIEW OF THE FINANCIAL STATEMENTS
The Financial Section of the CAFR consists of four parts – management’s discussion and analysis (this section), the basic financial statements, required supplementary information and an optional section that presents supplementary information.
Basic Financial Statements
The basic financial statements include the government-wide financial statements, the fund financial statements
and the notes to the financial statements.
Government-wide Financial Statements
The government-wide financial statements are designed to provide readers with a broad overview of the State’s financial activity. These statements are prepared using the accrual basis of accounting and the economic resources measurement focus, in a manner similar to a private-sector business.
The Statement of Net Position presents financial information on all of the State’s assets, liabilities, anddeferred outflows/inflows of resources, with the difference reported as net position. Over time, increases
or decreases in net position may serve as a useful indicator of whether the financial position of the Stateis improving or deteriorating, respectively.
The Statement of Activities presents information showing how the State’s net position changed during themost recent fiscal year. This statement is formatted to report direct expenses, program revenues and the
19

net revenues or expenses for each of the State’s governmental functions and business-type activities. This format identifies the extent to which each function is self-financed or is supported by the general revenues of the State.
The government-wide financial statements of the State are divided into three categories:
Governmental activities – Most services generally associated with State government, such as administration & regulation, education, health & human rights, human services, justice & public defense, economic development, transportation and agriculture & natural resources, are included in this category.
Business-type activities – State operations such as the Universities and the Unemployment Benefits Fund
that charge fees to external customers and function similarly to private business are included here.
Component units – These are operations that are legally separate from the State, but for which the State is
financially accountable. The State’s discretely presented component units are:
- Iowa Finance Authority (Business-type)
- Iowa Economic Development Authority (Business-type)
- Iowa State Fair Authority (Business-type)
- Iowa Lottery Authority (Business-type)
- University of Iowa Foundation (Business-type)
- Iowa State University Foundation (Business-type)
- University of Northern Iowa Foundation (Business-type)
- University of Iowa Research Foundation (Business-type)
- University of Iowa Health System & Subsidiaries (Business-type)
Additional information about the State’s component units is presented in NOTE 1-B of the Notes to the Financial Statements.
Fund Financial Statements
The fund financial statements provide more detailed information about the State’s most significant funds. The State has three types of funds:
Governmental funds – Most of the basic services provided by the State are accounted for in governmental funds. Governmental funds use the modified accrual basis of accounting and the flow of current financial resources measurement focus. Modified accrual accounting is used to show the flow of financial assets of the funds and the balances available for spending at year-end. These statements provide a detailed short-
term view that assists in determining whether there are adequate financial resources available to meet the current needs of the State. Because this information does not encompass the long-term focus of the government-wide statements, reconciliation schedules accompany the governmental funds statements. The General Fund, Tobacco Settlement Authority and Tobacco Collections Fund are the State’s major governmental funds. Nonmajor governmental funds are reported by fund type in the Combining Financial Statements – Nonmajor Funds.
Proprietary funds – Services for which the State charges customers a fee are generally reported in
proprietary funds. Proprietary funds use the accrual basis of accounting and, like the government-wide statements, provide both long-term and short-term financial information.
- The State’s enterprise funds (one type of proprietary fund) are used to report activities, such as universities, that are presented as business-type activities in the government-wide statements.
- The State’s internal service funds (the other type of proprietary fund) are used to account for activities that provide supplies and services for other State programs and activities – such as the Workers’ Compensation Fund.
The University Funds and the Unemployment Benefits Fund are the State’s major proprietary funds. Nonmajor proprietary funds are reported by fund type in the Combining Financial Statements – Nonmajor Funds.
Fiduciary funds – These funds are used to show assets held by the State as trustee or agent for others
outside the State, such as the Iowa Public Employees’ Retirement System and the Iowa Educational Savings Plan Trust. Similar to proprietary funds, these funds use the accrual basis of accounting.
20

Because the State cannot use these assets to finance its operations, fiduciary funds are not included in the government-wide financial statements discussed above.
Governmental Funds Proprietary Funds Fiduciary Funds
Scope Entire State government
(except fiduciary funds)
and the State's
component units
The activities of the
State that are not
proprietary or fiduciary,
such as Human
Services and
Transportation
Activities the State
operates similar to
private businesses: the
universities and the
Iowa Communications
Network
Instances in which the
State is the trustee or
agent for someone
else's resources, such
as the retirement plan
for public employees
Statement of net
position
Balance sheet Statement of net
position
Statement of fiduciary
net position
Statement of activities Statement of revenues,
expenditures, and
changes in fund
balances
Statement of revenues,
expenses, and changes
in fund net position
Statement of changes in
fiduciary net position
Statement of cash flows
Accounting
basis and
measurement
focus
Accrual accounting and
economic resources
focus
Modified accrual
accounting and current
financial resources
focus
Accrual accounting and
economic resources
focus
Accrual accounting and
economic resources
focus
Type of asset/
liability
information
All assets and
liabilities, both
financial and capital,
and short-term and long-
term
Only assets expected to
be used up and
liabilities that come due
during the year or soon
thereafter; no capital
assets included
All assets and
liabilities, both
financial and capital,
and short-term and long-
term
All assets and
liabilities, both short-
term and long-term; the
State's funds do not
contain capital assets,
although they can
Type of
deferred
outflow/inflow
information
Consumption/
acquisition of net
position that is
applicable to a future
reporting period.
Consumption/
acquisition of fund
balance that is
applicable to a future
reporting period.
Consumption/
acquisition of net
position that is
applicable to a future
reporting period.
Consumption/
acquisition of net
position that is
applicable to a future
reporting period.
Type of inflow/
outflow
information
All revenues and
expenses during the
year, regardless of when
cash is received or paid
Revenues for which
cash is received during
or soon after the end of
the year; expenditures
when goods or services
have been received and
payment is due during
the year or soon
thereafter
All revenues and
expenses during the
year, regardless of when
cash is received or paid
All revenues and
expenses during the
year, regardless of when
cash is received or paid
Fund StatementsGovernment-wide
Statements
Required
financial
statements
Major Features of the State's Government-wide and Fund Financial Statements
Table 1
Notes to the Financial Statements
The notes provide additional information that is essential to fully understand the government-wide and fund financial statements. The notes also explain some of the information contained in the financial statements and present more detail than is practical in the financial statements.
Required Supplementary Information
In addition to this Management’s Discussion and Analysis, Required Supplementary Information (RSI) includes the Budgetary Comparison Schedule. This schedule presents both the original and final appropriated budget for
major funds. The Budgetary Comparison Schedule is accompanied by a Budget to GAAP Reconciliation and by
21

Notes to RSI. Schedules of funding progress for Other Postemployment Benefits and schedules of net pension liability and contributions for the pension plans are also presented.
Supplementary Information The Supplementary Information includes combining financial statements for non-major governmental funds, non-major enterprise funds, internal service funds and fiduciary funds, which are added together and presented in single columns in the basic financial statements.
FINANCIAL ANALYSIS OF THE STATE AS A WHOLE
Net Position
The State’s combined net position (governmental and business-type activities) totaled $15,501.3 million at June 30, 2015, compared to $15,939.2 million at June 30, 2014, as indicated in Table 2.
The State of Iowa implemented GASB Statement No. 68, Accounting and Financial Reporting for Pensions – an Amendment of GASB Statement No. 27 and GASB Statement No. 71, Pension Transition for Contributions Made Subsequent to the Measurement Date in fiscal year 2015. These standards establish new accounting and financial
reporting standards for governmental employee pensions and are applicable to the State’s three pension plans:
the Iowa Public Employees’ Retirement System (IPERS), the Peace Officers’ Retirement, Accident and Disability System (PORS) and the Judicial Retirement System (JRS).
The beginning net position as of July 1, 2014, was restated by $996.4 million to retroactively report the net pension liability and related deferred outflows of resources as of June 30, 2014. Fiscal year 2014 financial statement amounts were not restated because the information was not available. The pension related balances at June 30, 2015 were: net pension liability $820.9 million, deferred outflows of resources related to pensions $181.2 million, and deferred inflows of resources related to pensions $347.4 million. See NOTE 15 – PENSION PLANS and NOTE 20 – BEGINNING BALANCE ADJUSTMENTS for more details.
Total
Percentage
Not Restated Not Restated Not Restated Change
2015 2014 2015 2014 2015 2014 2014-2015
Current &
other assets 4,634.1$ 4,851.1$ 5,116.0$ 5,106.1$ 9,750.1$ 9,957.2$ -2.1%
Capital assets 8,662.7 8,269.0 5,041.0 4,612.0 13,703.7 12,881.0 6.4%
Total assets 13,296.8 13,120.1 10,157.0 9,718.1 23,453.8 22,838.2 2.7%
Deferred outflows
of resources 177.1 23.3 32.5 4.6 209.6 27.9 651.3%
Long-term
liabilities 2,649.5 1,995.3 2,324.4 2,165.1 4,973.9 4,160.4 19.6%
Other liabilities 1,804.8 1,709.9 1,027.6 1,047.3 2,832.4 2,757.2 2.7%
Total liabilities 4,454.3 3,705.2 3,352.0 3,212.4 7,806.3 6,917.6 12.8%
Deferred inflows
of resources 318.5 - 37.3 9.3 355.8 9.3 3725.8%
Net position:
Net investment in
capital assets 8,360.4 7,960.1 3,225.0 2,917.0 11,585.4 10,877.1 6.5%
Restricted 855.8 1,064.2 1,713.9 1,662.9 2,569.7 2,727.1 -5.8%
Unrestricted (515.1) 413.9 1,861.3 1,921.1 1,346.2 2,335.0 -42.3%
Total net position 8,701.1$ 9,438.2$ 6,800.2$ 6,501.0$ 15,501.3$ 15,939.2$ -2.7%
Activities Activities Total
Table 2
Net Position
(In Millions)
Governmental Business-type
22

Net position of the State’s governmental activities decreased 7.8% to $8,701.1 million. The largest component (96.1%) of the State’s net position is its investment in capital assets (e.g. land, buildings, equipment, infrastructure and others), less any related outstanding debt that was used to acquire or construct the assets. Restricted net position is the next largest component (9.8%). These represent resources that are subject to
external restrictions, constitutional provisions or enabling legislation on how they can be used. Unrestricted net position is the remaining portion (negative 5.9%) and may be used at the State’s discretion, but often have limitations on use based on State statutes.
The net position of business-type activities increased 4.6% to $6,800.2 million. Generally, the State can only use the net position to finance the continuing operations of the universities, unemployment insurance and other business-type activities.
Long-term liabilities increased 19.6% to $4,973.9 million due primarily to an increase of $757.1 million in net pension liability. Deferred outflows of resources and deferred inflows of resources increased $181.7 million and $346.5 million, respectively due almost entirely to the recognition of amounts related to pensions.
Other liabilities increased 2.7% to $2,832.4 million. The $75.2 million increase resulted from an increase of $119.4 million in accounts payable & accruals, offset largely by a decrease in funds held in custody of $38.5 million.
The chart presented below provides a visual representation of the three components of the State’s total net
position of $15,501.3 million at June 30, 2015.
Net Investment in Capital Assets,
$11,585.4
Restricted, $2,569.7
Unrestricted, $1,346.2
Total Net Position (In Millions)
23

Changes in Net Position
The State’s total net position decreased by $437.9 million from June 30, 2014 (not restated) to June 30, 2015, as indicated in Table 3.
Total
Percentage
Not Restated Not Restated Not Restated Change
2015 2014 2015 2014 2015 2014 2014-2015
Program revenues
Charges for services 1,980.9$ 1,981.0$ 3,813.4$ 3,673.5$ 5,794.3$ 5,654.5$ 2.5%
Operating grants & contributions 5,349.9 4,905.6 746.7 783.0 6,096.6 5,688.6 7.2%
Capital grants & contributions 501.4 472.9 173.1 90.3 674.5 563.2 19.8%
General revenues
Personal income tax 3,456.5 3,206.5 - - 3,456.5 3,206.5 7.8%
Corporate income tax 464.1 387.2 - - 464.1 387.2 19.9%
Sales & use tax 2,670.1 2,625.3 - - 2,670.1 2,625.3 1.7%
Other tax 771.7 756.2 7.8 7.5 779.5 763.7 2.1%
Motor fuel tax restricted for
transportation purposes 524.6 446.4 - - 524.6 446.4 17.5%
Road use tax restricted for
transportation purposes 346.9 322.5 - - 346.9 322.5 7.6%
Unrestricted investment earnings 19.2 21.4 46.9 186.9 66.1 208.3 -68.3%
Other 38.0 36.3 57.3 68.1 95.3 104.4 -8.7%
Total revenues 16,123.3 15,161.3 4,845.2 4,809.3 20,968.5 19,970.6 5.0%
Expenses
Administration & regulation 1,595.9 1,436.5 - - 1,595.9 1,436.5 11.1%
Education 3,909.9 3,749.2 - - 3,909.9 3,749.2 4.3%
Health & human rights 422.7 423.7 - - 422.7 423.7 -0.2%
Human services 6,463.8 5,757.1 - - 6,463.8 5,757.1 12.3%
Justice & public defense 1,202.4 1,255.6 - - 1,202.4 1,255.6 -4.2%
Economic development 158.6 160.0 - - 158.6 160.0 -0.9%
Transportation 1,340.5 1,236.0 - - 1,340.5 1,236.0 8.5%
Agriculture & natural resources 223.9 219.1 - - 223.9 219.1 2.2%
Interest expense 92.0 95.3 - - 92.0 95.3 -3.5%
University Funds - - 4,339.4 4,156.1 4,339.4 4,156.1 4.4%
Unemployment Benefits Fund - - 396.8 439.9 396.8 439.9 -9.8%
Other - - 264.1 260.6 264.1 260.6 1.3%
Total expenses 15,409.7 14,332.5 5,000.3 4,856.6 20,410.0 19,189.1 6.4%
Increase (decrease) in net position
before transfers 713.6 828.8 (155.1) (47.3) 558.5 781.5 -28.5%
Special items -
Loss on extinguishment of debt - (5.7) - - - (5.7) -100.0%
Transfers (534.1) (575.6) 534.1 575.6 - - 0.0%
Increase in net position 179.5 247.5 379.0 528.3 558.5 775.8 -28.0%
Net position - July 1, restated 8,521.6 9,190.7 6,421.2 5,972.7 14,942.8 15,163.4 -1.5%
Net position - June 30 8,701.1$ 9,438.2$ 6,800.2$ 6,501.0$ 15,501.3$ 15,939.2$ -2.7%
Activities Activities Total
Table 3
Changes in Net Position
(In Mill ions)
Governmental Business-type
The American Recovery and Reinvestment Act of 2009 (ARRA) programs are concluding. As a result, the State of
Iowa received and spent only minimal ARRA funds in fiscal year 2015, and does not anticipate receiving significant ARRA funds in the future.
Governmental Activities
Overall, total revenues for governmental activities increased 6.3% over the prior year.
Program revenues increased $472.7 million, or 6.4%. The largest fluctuation in program revenues was in operating grants and contributions with an increase of $444.3 million. The increase in operating grants and contributions occurred primarily in human services and was largely due to an increase in federal support for medical assistance. Capital grants and contributions increased $28.5 million, or 6.0%. This increase is attributable to an increase in federal highway planning and construction funding.
24

General revenues experienced a net increase of $489.3 million or 6.3% from FY2014. This is due in part to increases in personal income tax of $250.0 million or 7.8%, corporate income tax of $76.9 million or 19.9%, and in motor fuel tax of $78.2 million or 17.5%. Personal income tax increased as a result of strong withholding growth during FY 2015 in line with the relatively strong employment growth during the year.
Individual returns also showed strong positive gains which reflected two things, the pull back in estimated payments for the 2014 tax year as compared to 2013, resulting in higher final payments and the drop in the 2014 Taxpayers Trust Fund Tax Credit from $54 to $15. The corporate income tax increase is generally attributed to improved economic conditions. The increase in motor fuel tax receipts reflect four months of the ten cent per gallon increase in the tax rate.
Overall, total expenses for governmental activities increased 7.5% over the prior year.
Expenses increased most significantly in human services, 12.3%, education, 4.3% and transportation, 8.5%. The increase in human services of $706.7 million is largely a result of an increase in medical assistance payments while the increase in education expenses of $160.7 million is primarily due to state aid to schools. The transportation increase of $104.5 million is attributed to the inherent variability in the year to year progress and completion of construction projects. The 4.2% decrease in justice and public defense expenses relates to the decrease in state aid for disaster reimbursements.
Revenues by Source
Taxes51%
Other1%
Grants & Contributions36%
Charges for Services12%
Expenses by Function
Education26%
Health & Human Rights
3%Administration &
Regulation10%
Justice & Public Defense
8%
Transportation9%
Other2%
Human Services42%
25
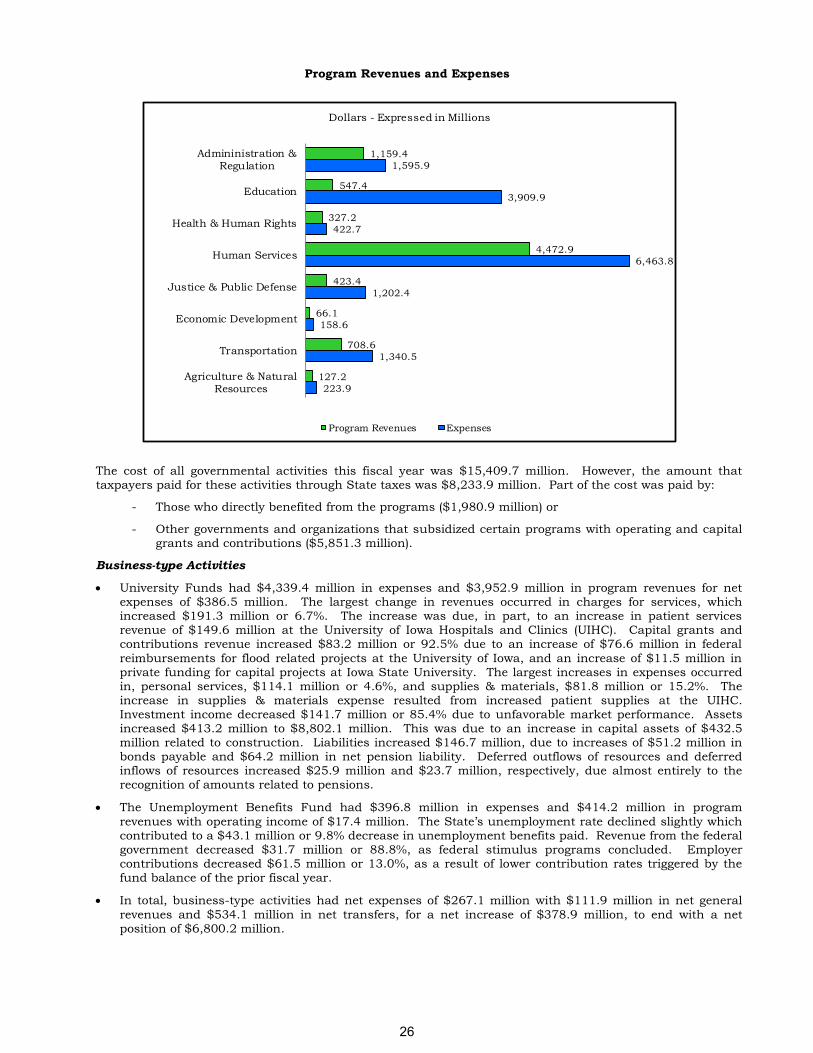
Program Revenues and Expenses
223.9
1,340.5
158.6
1,202.4
6,463.8
422.7
3,909.9
1,595.9
127.2
708.6
66.1
423.4
4,472.9
327.2
547.4
1,159.4
Agriculture & NaturalResources
Transportation
Economic Development
Justice & Public Defense
Human Services
Health & Human Rights
Education
Admininistration &Regulation
Dollars - Expressed in Millions
Program Revenues Expenses
The cost of all governmental activities this fiscal year was $15,409.7 million. However, the amount that taxpayers paid for these activities through State taxes was $8,233.9 million. Part of the cost was paid by:
- Those who directly benefited from the programs ($1,980.9 million) or
- Other governments and organizations that subsidized certain programs with operating and capitalgrants and contributions ($5,851.3 million).
Business-type Activities
University Funds had $4,339.4 million in expenses and $3,952.9 million in program revenues for netexpenses of $386.5 million. The largest change in revenues occurred in charges for services, whichincreased $191.3 million or 6.7%. The increase was due, in part, to an increase in patient servicesrevenue of $149.6 million at the University of Iowa Hospitals and Clinics (UIHC). Capital grants andcontributions revenue increased $83.2 million or 92.5% due to an increase of $76.6 million in federal
reimbursements for flood related projects at the University of Iowa, and an increase of $11.5 million inprivate funding for capital projects at Iowa State University. The largest increases in expenses occurredin, personal services, $114.1 million or 4.6%, and supplies & materials, $81.8 million or 15.2%. Theincrease in supplies & materials expense resulted from increased patient supplies at the UIHC.Investment income decreased $141.7 million or 85.4% due to unfavorable market performance. Assetsincreased $413.2 million to $8,802.1 million. This was due to an increase in capital assets of $432.5million related to construction. Liabilities increased $146.7 million, due to increases of $51.2 million inbonds payable and $64.2 million in net pension liability. Deferred outflows of resources and deferredinflows of resources increased $25.9 million and $23.7 million, respectively, due almost entirely to therecognition of amounts related to pensions.
The Unemployment Benefits Fund had $396.8 million in expenses and $414.2 million in program
revenues with operating income of $17.4 million. The State’s unemployment rate declined slightly whichcontributed to a $43.1 million or 9.8% decrease in unemployment benefits paid. Revenue from the federalgovernment decreased $31.7 million or 88.8%, as federal stimulus programs concluded. Employercontributions decreased $61.5 million or 13.0%, as a result of lower contribution rates triggered by thefund balance of the prior fiscal year.
In total, business-type activities had net expenses of $267.1 million with $111.9 million in net general
revenues and $534.1 million in net transfers, for a net increase of $378.9 million, to end with a netposition of $6,800.2 million.
26

Other business-type activities expenses increased $3.5 million and program revenues increased $9.8
million. The Liquor Control Act fund which accounts for the revenues and expenses related to the sale of alcoholic beverages experienced a $15.0 million increase in operating revenues and a $9.8 million increase in operating expenses.
FINANCIAL ANALYSIS OF THE STATE’S FUNDS
Governmental Funds
The governmental funds reported total fund balances of $2,482.6 million, a decrease of 16.3% from the previous year. Net revenues totaled $15,992.1 million with expenditures of $15,939.9 million.
Fund balance classifications for governmental funds are reported in categories which describe the extent to which certain resources may be spent. Resources are categorized as spendable or nonspendable.
Nonspendable fund balance includes inventory, prepaid items, noncurrent receivables and the principal of endowments. These resources cannot be spent because they are either not in spendable form or are legally required to remain intact. When the proceeds from noncurrent receivables are restricted, committed or assigned, the fund balances for those amounts will be reported in the appropriate spendable fund balance classification.
Spendable fund balance includes resources that are in spendable form (e.g. cash) and are available for spending. Spendable fund balance is further classified as restricted, committed, assigned or unassigned. The following describes the different levels of constraint, if any, on spendable fund balance classifications for the total governmental funds:
Restricted – $1,299.1 million and $1,534.5 million for FY2015 and FY2014, respectively, includes
amounts that can be spent only for the specific purposes stipulated by constitution, external resource providers (e.g. creditors, grantors and contributors) or enabling legislation.
Committed – $1,700.7 million and $1,941.6 million for FY2015 and FY2014, respectively, includes
amounts that can be used only for the specific purposes determined by a formal action of the State’s highest level of decision-making authority. The Iowa Legislature and Governor represent the State’s highest level of decision-making authority. Formal action consists of legislation passed by both the House and Senate and signed by the Governor and is required to establish, modify or rescind a limitation.
Assigned – includes amounts intended to be used by the State for a specific purpose but do not meet the
criteria to be classified as restricted or committed. Currently, the State does not have a policy which authorizes the establishment of assigned fund balances.
Unassigned – negative $578.1 million and negative $569.4 million for FY2015 and FY2014, respectively,
includes the residual amount of the General Fund not included in the categories above, which is available for any purpose, and any negative fund balances in the other governmental fund types.
The State’s modified accrual revenue recognition policy for governmental fund statements recognizes revenues if received within sixty days of year-end and deferred if received past sixty days. This creates a negative impact when the payables/expenditures related to the deferred revenues are recognized in the statements. A portion of the negative unassigned fund balance is due to deferral of federal receivables/revenues while associated payables/expenditures have been recognized. The largest portion of the negative unassigned fund balance relates to the Tobacco Collections Fund deficit. (See NOTE 21 - DEFICIT FUND BALANCE)
General Fund
The General Fund is the chief operating fund of the State. Total fund balance decreased from $2,784.3 million for fiscal year 2014 to $2,309.6 million for fiscal year 2015. The fiscal year 2015 General Fund
consists of the following fund balances: $44.5 million nonspendable, an increase of 8.0%, $861.6 million restricted, a decrease of 17.6%, $1,676.6 committed, a decrease of 12.3%, and negative $273.1 million unassigned, a decrease of 27.2%. For fiscal year 2015, the committed fund balance includes $697.9 million in reserve (rainy day) funds, an increase of 4.2%.
Gross revenues of the General Fund increased $882.1 million in fiscal year 2015. Total gross taxes increased by $502.5 million, a 6.0% increase from fiscal year 2014 to $8,917.3 million in fiscal year 2015. Major contributors to the tax increase include an individual income tax increase of $239.6 million, which comes after two years of significant swings caused in a large part by changes in the federal income tax rates; a fuel tax increase of $81.8 million due primarily to increased fuel sales and an increase in the Iowa gas tax effective March 1, 2015. Also, sales tax increased $79.7 million in fiscal year 2015. Receipts from other entities had a
27

net increase of $284.2 million as a result of an increase in federal revenue for the medical assistance program in the Department of Human Services, decreases in several Department of Human Services programs and an increase of federal revenue in the Department of Transportation for federal highway planning and construction. In addition, refunds and reimbursements increased $37.9 million due in part to the medical
assistance program within the Department of Human Services receiving a new type of drug rebate.
Total expenditures of the General Fund increased $1,121.5 million in fiscal year 2015. Medical assistance expenditures in the Department of Human Services increased $727.7 million due to an increase in nursing facility spending due to an increased number of bed days and increased cost per day, the State’s health home program was expanded, Money Follows the Person program experienced significant growth, Medicaid provider payments increased, and the Iowa Health and Wellness Program saw enrollment grow by 40%. Education expenses increased $176.2 million due primarily to an increase in School Foundation Aid and increases of state aid for various education related programs. Capital outlays increased $115.7 million due primarily to Department of Transportation projects. In addition, debt service payments had a net decrease of $61.2 million primarily due to fiscal year 2014 having had expenditures for the early extinguishment of debt.
Tobacco Settlement Authority
The Tobacco Settlement Authority (Authority), a blended component unit of the State of Iowa classified as a Special Revenue Fund, receives money from the Tobacco Collections Fund to pay operating expenditures and
for repayment of debt. The Authority’s ending fund balance decreased $50.7 million to $387.5 million. The decrease was due to receipt of funds from the Tobacco Collections Fund which reduced the interfund advance (receivable). These funds were primarily used to pay principal and interest on bonds totaling $11.7 million and $40.6 million, respectively.
Tobacco Collections Fund
The Tobacco Collections Fund, a Special Revenue Fund, accounts for the tobacco settlement moneys received pursuant to a Master Settlement Agreement between the State of Iowa and the five largest tobacco manufacturers. The ending fund balance in the Tobacco Collections Fund increased $49.7 million to a deficit balance of $305.0 million. The increase is due to the reduction of the interfund advance (liability) for the tobacco settlement moneys remitted to the Tobacco Settlement Authority during the year.
Proprietary Funds
The State of Iowa’s proprietary funds provide the same type of information found in the government-wide financial statements, but in more detail.
Total net position of the University Funds increased $268.7 million to $5,532.6 million while unrestricted net position decreased $54.8 million to $1,834.4 million.
The total net position of the Unemployment Benefits Fund, which is entirely restricted for unemployment benefits, increased $39.0 million to end fiscal year 2015 at $1,163.3 million.
The nonmajor enterprise funds total net position decreased $8.7 million or 7.3% to $110.8 million. The decrease in net position in the nonmajor enterprise funds is primarily due to recognizing the net pension liability and related deferred outflows of resources and deferred inflows of resources as explained in the Financial Analysis of the State as a Whole section of management’s discussion and analysis.
The Iowa Communications Network net position decreased $4.5 million or 12.2% to $32.7 million. The decrease in net position is primarily due to recognizing the net pension liability and related deferred outflows of resources and deferred inflows of resources.
The Honey Creek Park total net position decreased $1.4 million or 2.8% to $46.9 million. The decrease in net position is attributable to a $1.4 million decrease in capital assets, net of accumulated depreciation, due to
recognition of the current year’s depreciation expense offset by a minimal amount of additions to capital assets.
The Liquor Control Act total net position decreased $2.4 million or 34.9% to $4.4 million. The decrease in net position is primarily due to recognizing the net pension liability and related deferred outflows of resources and deferred inflows of resources.
Iowa State Prison Industries total net position decreased $0.9 million or 4.3% to $20.6 million. The decrease in net position is primarily due to recognizing the net pension liability and related deferred outflows of resources and deferred inflows of resources.
Other factors concerning the finances of proprietary funds have already been addressed in the discussion of the State of Iowa’s business-type activities.
28

General Fund Budgetary Highlights
Over the course of the year, the State revised the budget several times. These budget amendments fall into two categories:
Supplemental appropriations: $56,040,000
Adjustments to standing appropriations: $20,872,780
The originally enacted General Fund budget for fiscal year 2015 of $6,986.5 million was predicated on $6,983.2 million or 4.5% growth in General Fund revenues, as projected by the State’s Revenue Estimating Conference (REC) on December 12, 2013. The December estimate reflected the expectation that revenues would increase
from an estimated -1.3% growth for fiscal year 2014. Also included in the enacted General Fund budget was a negative $19.6 million in revenue adjustments for changes in tax law and revenue changes along with $745.7 million in surplus from reserve funds back to the General Fund.
At the March 20, 2014 meeting, the REC kept its fiscal year 2015 General Fund revenue estimate the same at $6,983.2 million or an estimated growth of 4.5%. At the October 9, 2014 meeting, the REC revised its fiscal year 2015 General Fund revenue estimate downward to $6,850.3 million but as the FY2014 base changed, the growth was at 5.6%. This change was based upon the revised base of fiscal year 2014 of a decline of -4.1%. On December 12, 2014, the REC increased the revenue estimate slightly to $6,857.1 million. On March 19, 2015, the
REC decreased the revenue estimate to $6,767.4 million or 4.3% growth, which reflected year-to-date revenues were growing slower than expected.
The State of Iowa has various statutory standing appropriations where a fixed amount is not appropriated. These are either formula-driven (as in the case of the largest General Fund appropriation, for school foundation aid to local school districts), or for items such as paying claims against the State through the State Appeal Board. These are either increases or decreases to the estimates made at the beginning of the year. For fiscal year 2015, these standing appropriations were more than the original estimates by $20.9 million. A variety of standing appropriations make up the changes to standing appropriations.
During May and June of 2015, and throughout the accrual period, actual General Fund revenue collections continued to come in above the official REC projections. At the close of fiscal year 2015, revenue collections totaled $6,819.7 million which is a 5.1% growth over fiscal year 2014. As a result, the General Fund budgetary ending balance for fiscal year 2015, statutorily required to be transferred to the Cash Reserve Fund in fiscal year 2016, totaled $410.6 million.
CAPITAL ASSET AND DEBT ADMINISTRATION
Capital Assets
At June 30, 2015, the State had $13,703.7 million invested in capital assets, net of accumulated depreciation of $11,447.9 million. Depreciation charges totaled $838.0 million in fiscal year 2015. The details of these assets are presented in Table 4. Additional information about the State’s capital assets is presented in NOTE 6 of the financial statements.
Total
Percentage
Change
2015 2014 2015 2014 2015 2014 2014-2015
Land 815.3$ 794.6$ 88.6$ 85.4$ 903.9$ 880.0$ 2.7%
Buildings & improvements 918.1 903.2 2,835.0 2,579.6 3,753.1 3,482.8 7.8%
Equipment 194.9 201.3 370.8 367.3 565.7 568.6 -0.5%
Land improvements 42.0 39.2 34.9 35.1 76.9 74.3 3.5%
Works of art & collections 1.2 1.2 390.8 374.1 392.0 375.3 4.4%
Computer software 91.5 67.4 63.0 53.2 154.5 120.6 28.1%
Infrastructure 6,335.9 5,978.6 401.8 398.5 6,737.7 6,377.1 5.7%
Other intangibles - - 1.7 1.9 1.7 1.9 -10.5%
Construction in progress 212.9 213.4 847.9 701.3 1,060.8 914.7 16.0%
Computer software in progress 50.9 70.1 6.5 15.6 57.4 85.7 -33.0%
Total 8,662.7$ 8,269.0$ 5,041.0$ 4,612.0$ 13,703.7$ 12,881.0$ 6.4%
Activities Activities Total
Table 4
Capital Assets, Net of Depreciation
(In Millions)
Governmental Business-type
29

In the governmental activities, capital assets, net of accumulated depreciation, increased $393.7 million, or 4.8%, to $8,662.7 million. Infrastructure increased $357.3 million, or 6.0%, primarily due to increases in highway and bridge construction projects by the Iowa Department of Transportation (DOT), offset by the recognition of depreciation expense for the year. Land increased $20.7 million, or 2.6%, as a result of increases of $9.7 million
and $9.6 million at the DOT and Iowa Department of Natural Resources, respectively. In addition, buildings & improvements increased $14.9 million, or 1.6%, due to increases at the Iowa Veterans Home, Iowa Braille School and Iowa Department of Public Defense, offset by the recognition of depreciation expense for the year.
Capital assets, net of accumulated depreciation, in the business-type activities increased $429.0 million, or 9.3%, to $5,041.0 million. Construction in progress increased $146.6 million, or 20.9%, primarily due to increased construction projects at the University of Iowa. Buildings & improvements, net of accumulated depreciation, increased $255.4 million, or 9.9%, due to increases at the University of Iowa and Iowa State University and the recognition of depreciation expense for the year. The University of Iowa experienced unprecedented construction levels on campus, including new buildings (Hancher Auditorium Replacement Facility and School of Music Replacement Facility), new dormitories and construction at Children’s Hospital.
Outstanding commitments for future capital expenditures as of June 30, 2015 include $575.1 million (net of $522.8 million in anticipated federal funding) for highway and bridge construction, $515.1 million for various projects at the three State universities, $23.3 million for State facilities and buildings, $12.3 million for State parks, recreational areas, fisheries and wetland projects, and $9.6 million for construction at the Iowa State
Penitentiary and remodeling of the Iowa Correctional Institution for Women.
Long-term Debt
At year-end, the State had $3,679.1 million in revenue bonds and leases and other financing arrangements outstanding as shown in Table 5. More detailed information about the State’s long-term liabilities is presented in NOTE 7 to the financial statements.
Total
Percentage
Change
2015 2014 2015 2014 2015 2014 2014-2015
Revenue bonds 1,675.6$ 1,720.3$ 1,903.5$ 1,852.3$ 3,579.1$ 3,572.6$ 0.2%
Leases & other financing
arrangements 1.6 1.8 98.4 105.0 100.0 106.8 -6.4%
Total 1,677.2$ 1,722.1$ 2,001.9$ 1,957.3$ 3,679.1$ 3,679.4$ 0.0%
Activities Activities Total
Table 5
State of Iow a's Outstanding Debt
(In Mill ions)
Governmental Business-type
Revenue bonds issued by the State and its various authorities totaled $4,944.3 million outstanding at fiscal year-end. This amount consisted of $1,365.3 million of component unit (proprietary) revenue bonds (Iowa Finance Authority and Iowa State University Foundation), $1,903.5 million in revenue bonds issued by the three State universities (for equipment and facilities), $755.1 million in revenue bonds issued by the Tobacco Settlement Authority, $10.5 million in revenue bonds issued by the State of Iowa for the Iowa Utilities Board, $689.9 million in revenue bonds issued by the State of Iowa for the IJOBS program, $138.0 million in revenue bonds issued by the State of Iowa for Prison Infrastructure and $82.1 million in revenue bonds issued by the State of Iowa for the Vision Iowa Program. These bonds are backed by the revenues of the issuing program or authority.
Governmental activities outstanding revenue bonds decreased $44.7 million, due to the payment of principal as it came due in fiscal year 2015.
Business-type activities outstanding revenue bonds increased $51.2 million, due to the issuance of new debt at the University of Iowa, Iowa State University and the University of Northern Iowa and the payment of principal as it came due by the three State universities.
30

ECONOMIC FACTORS AND NEXT YEAR’S BUDGET AND RATES
Iowa enjoyed improved fiscal health in fiscal year 2015 with the fiscal year showing increased growth in revenue collections. Iowa’s 5.1% growth in General Fund revenues rebounded from the -4.1% growth in fiscal year 2014, showing growth in all three major tax categories.
The Governor and General Assembly finished their work on June 5, 2015, on the 145th day of the originally anticipated 110 day first session of the 86th General Assembly, finalizing the General Fund budget for fiscal year 2016. Amounts available for appropriation in fiscal year 2016 based on the 99% budget limitation after Governor’s vetoes; in the General Fund budget were $7,444.2 million. General Fund appropriations totaled $7,174.3 million.
At the REC meeting in October 2015, the fiscal year 2016 revenue estimate was decreased from a revised $7,186.7 million to $7,054.5 million, largely as a reflection of actual revenue collections in fiscal year 2015, law changes passed during the 2015 Legislative Session which increased revenue a total of $11.2 million, current year to date revenue growth, and the anticipated slow growth of tax revenues that is reflective of the slowdown in the agricultural economy in the State. The revised estimate reflects projected revenue growth of 3.4% compared to actual revenues for the previous fiscal year.
Recent revenue performance has been sluggish but positive, which is reflective of the continued impact of the
agricultural slowdown on Iowa’s economy. Iowa’s unemployment rate was at 3.6% in September 2015, down from the rate for August 2015 of 3.7% and lower than the national rate of 5.1% for September 2015, showing Iowa’s labor market holding its own.
According to Moody’s Analytics, while short term overall U.S. economic growth has slowed, this should prove temporary. The U.S. economy remains on track to return to full employment by mid-2016, which should soon
convince the Federal Reserve to begin normalizing interest rates. Recent job growth has reflected the recent slowdown in the U.S. economy with only 142,000 jobs added in September, well below the consensus expectation of about 200,000. Downward revisions in July and August reduced payrolls by a combined 59,000. According to Moody’s Analytics, job growth is expected to reaccelerate in the near term and the past two months’ of data are likely to receive upward revisions. Growth is expected to accelerate throughout 2016, with the labor market generating 2.6 million jobs through 2015 and close to 3 million in 2016. The labor market will reach full employment, below 5% unemployment, by mid-2016. Wage growth will slowly accelerate as the labor market tightens and reach 3% by 2017.
CONTACTING THE STATE’S FINANCIAL MANAGEMENT
This financial report is designed to provide our citizens, legislators, customers, investors and creditors with a general overview of the State’s finances and to demonstrate the State’s accountability for the money it receives. If you have questions about this report or need additional financial information, contact:
Iowa Department of Administrative Services State Accounting Enterprise Hoover State Office Building Des Moines, IA 50319
31

IOWA
32

S T A T E M E N T S
B A S I C
F I N A N C I A L
33

STATE OF IOWA
Statement of Net Position
June 30, 2015
(Expressed in Thousands)
GOVERNMENTAL BUSINESS-TYPE COMPONENT
ACTIVITIES ACTIVITIES TOTAL UNITS
ASSETS
Current assets:
Cash & investments 2,380,562$ 1,624,779$ 4,005,341$ 1,537,046$
Cash & investments - restricted - - - 618
Deposits with trustees 119,751 52 119,803 -
Accounts receivable (net) 1,865,799 734,478 2,600,277 91,311
Interest receivable - 2,860 2,860 6,023
Loans receivable (net) 4,000 7,620 11,620 86,292
Internal balances 20,083 (20,083) - -
Inventory 21,814 64,897 86,711 3,037
Prepaid expenses 33,548 36,974 70,522 950
Other assets - - - 3,226
Total current assets 4,445,557 2,451,577 6,897,134 1,728,503
Noncurrent assets:
Cash & investments - 2,518,502 2,518,502 1,763,514
Deposits with trustees 77,839 14,800 92,639 -
Accounts receivable (net) 95,455 18,784 114,239 164,426
Interest receivable - 436 436 -
Loans receivable (net) 15,266 67,668 82,934 1,555,432
Capital assets - nondepreciable 1,079,089 1,289,131 2,368,220 19,135
Capital assets - depreciable (net) 7,583,607 3,751,863 11,335,470 91,252
Prepaid expenses - 370 370 -
Other assets - 43,867 43,867 26,059
Total noncurrent assets 8,851,256 7,705,421 16,556,677 3,619,818
TOTAL ASSETS 13,296,813 10,156,998 23,453,811 5,348,321
DEFERRED OUTFLOWS OF
RESOURCES
Accumulated decrease in fair value
of hedging derivatives - - - 3,105
Debt refunding loss 21,503 6,882 28,385 26,703
Excess consideration provided for
acquisition - - - 1,542
Related to pensions 155,632 25,584 181,216 2,663
TOTAL DEFERRED OUTFLOWS OF
RESOURCES 177,135 32,466 209,601 34,013
The notes are an integral part of the financial statements.
(continued on next page)
PRIMARY GOVERNMENT
34
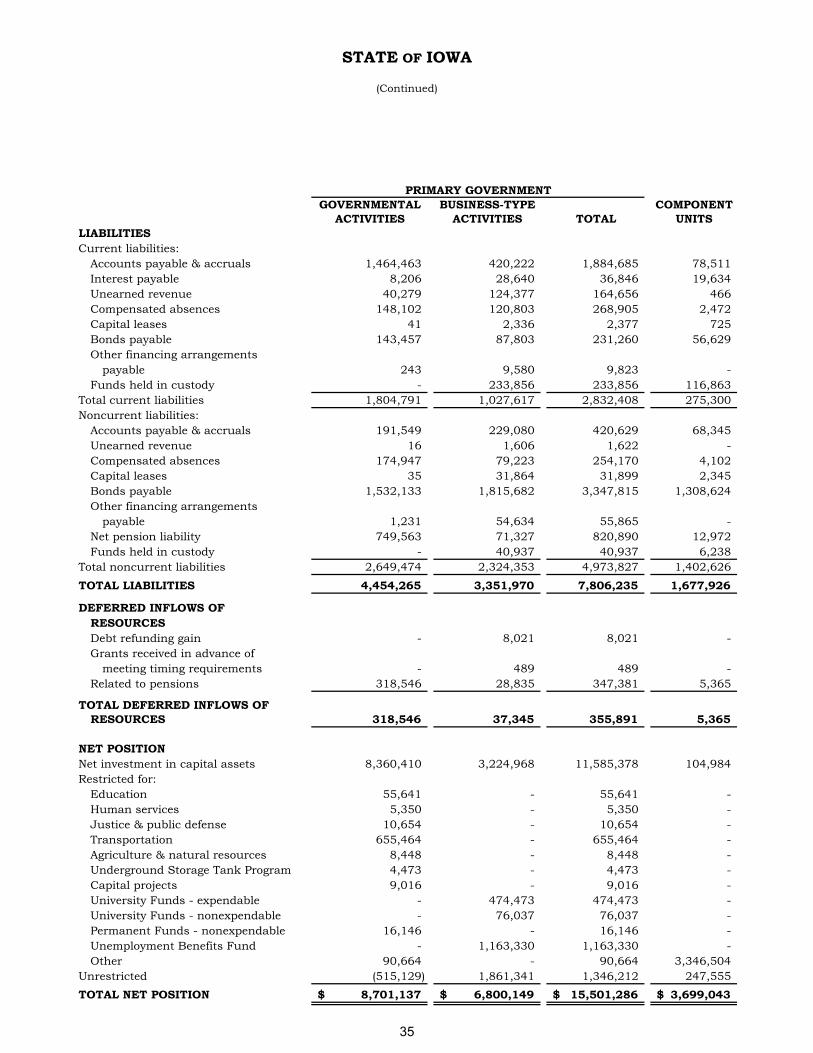
STATE OF IOWA
(Continued)
GOVERNMENTAL BUSINESS-TYPE COMPONENT
ACTIVITIES ACTIVITIES TOTAL UNITS
LIABILITIES
Current liabilities:
Accounts payable & accruals 1,464,463 420,222 1,884,685 78,511
Interest payable 8,206 28,640 36,846 19,634
Unearned revenue 40,279 124,377 164,656 466
Compensated absences 148,102 120,803 268,905 2,472
Capital leases 41 2,336 2,377 725
Bonds payable 143,457 87,803 231,260 56,629
Other financing arrangements
payable 243 9,580 9,823 -
Funds held in custody - 233,856 233,856 116,863
Total current liabilities 1,804,791 1,027,617 2,832,408 275,300
Noncurrent liabilities:
Accounts payable & accruals 191,549 229,080 420,629 68,345
Unearned revenue 16 1,606 1,622 -
Compensated absences 174,947 79,223 254,170 4,102
Capital leases 35 31,864 31,899 2,345
Bonds payable 1,532,133 1,815,682 3,347,815 1,308,624
Other financing arrangements
payable 1,231 54,634 55,865 -
Net pension liability 749,563 71,327 820,890 12,972
Funds held in custody - 40,937 40,937 6,238
Total noncurrent liabilities 2,649,474 2,324,353 4,973,827 1,402,626
TOTAL LIABILITIES 4,454,265 3,351,970 7,806,235 1,677,926
DEFERRED INFLOWS OF
RESOURCES
Debt refunding gain - 8,021 8,021 -
Grants received in advance of
meeting timing requirements - 489 489 -
Related to pensions 318,546 28,835 347,381 5,365
TOTAL DEFERRED INFLOWS OF
RESOURCES 318,546 37,345 355,891 5,365
NET POSITION
Net investment in capital assets 8,360,410 3,224,968 11,585,378 104,984
Restricted for:
Education 55,641 - 55,641 -
Human services 5,350 - 5,350 -
Justice & public defense 10,654 - 10,654 -
Transportation 655,464 - 655,464 -
Agriculture & natural resources 8,448 - 8,448 -
Underground Storage Tank Program 4,473 - 4,473 -
Capital projects 9,016 - 9,016 -
University Funds - expendable - 474,473 474,473 -
University Funds - nonexpendable - 76,037 76,037 -
Permanent Funds - nonexpendable 16,146 - 16,146 -
Unemployment Benefits Fund - 1,163,330 1,163,330 -
Other 90,664 - 90,664 3,346,504
Unrestricted (515,129) 1,861,341 1,346,212 247,555
TOTAL NET POSITION 8,701,137$ 6,800,149$ 15,501,286$ 3,699,043$
PRIMARY GOVERNMENT
35

IOWA
36

STATE OF IOWA
Statement of Activities
For the Year Ended June 30, 2015
(Expressed in Thousands)
CHARGES OPERATING CAPITAL BUSINESS-
FOR GRANTS & GRANTS & GOVERNMENTAL TYPE COMPONENT
FUNCTIONS/PROGRAMS EXPENSES SERVICES CONTRIBUTIONS CONTRIBUTIONS ACTIVITIES ACTIVITIES TOTAL UNITS
PRIMARY GOVERNMENT:
Governmental activities:
Administration & regulation 1,595,922$ 1,064,230$ 95,158$ -$ (436,534)$ $ (436,534)$
Education 3,909,866 20,656 526,696 5 (3,362,509) (3,362,509)
Health & human rights 422,677 80,767 239,458 7,025 (95,427) (95,427)
Human services 6,463,802 544,631 3,928,265 - (1,990,906) (1,990,906)
Justice & public defense 1,202,362 95,952 327,347 124 (778,939) (778,939)
Economic development 158,632 1,749 64,322 - (92,561) (92,561)
Transportation 1,340,548 100,322 119,190 489,146 (631,890) (631,890)
Agriculture & natural resources 223,916 72,634 49,508 5,078 (96,696) (96,696)
Interest expense 92,011 - - - (92,011) (92,011)
Total governmental activities 15,409,736 1,980,941 5,349,944 501,378 (7,577,473) (7,577,473)
Business-type activities:
University Funds 4,339,376 3,037,054 742,632 173,150 (386,540) (386,540)
Unemployment Benefits Fund 396,842 410,209 4,001 - 17,368 17,368
Other 264,092 366,129 - - 102,037 102,037
Total business-type activities 5,000,310 3,813,392 746,633 173,150 (267,135) (267,135)
TOTAL PRIMARY GOVERNMENT 20,410,046$ 5,794,333$ 6,096,577$ 674,528$ (7,577,473) (267,135) (7,844,608)
COMPONENT UNITS:
Iowa Finance Authority 106,131$ 14,701$ 53,739$ -$ (37,691)$
Iowa Economic Development Authority 182,576 1,518 185,385 - 4,327
Iowa State Fair Authority 23,084 22,258 4,734 118 4,026
Iowa Lottery Authority 323,298 324,777 - - 1,479
University of Iowa Foundation 120,103 - 122,956 - 2,853
Iowa State University Foundation 97,396 - 153,674 - 56,278
University of Northern Iowa Foundation 14,655 - 15,292 - 637
University of Iowa Research Foundation 7,483 2,682 - - (4,801)
University of Iowa Health System &
Subsidiaries 26,253 26,001 - - (252)
TOTAL COMPONENT UNITS 900,979$ 391,937$ 535,780$ 118$ 26,856
GENERAL REVENUES:
Personal income tax 3,456,503 - 3,456,503 -
Corporate income tax 464,121 - 464,121 -
Sales & use tax 2,670,084 - 2,670,084 -
Other tax 771,702 7,765 779,467 -
Motor fuel tax restricted for transportation purposes 524,569 - 524,569 -
Road use tax restricted for transportation purposes 346,901 - 346,901 -
Unrestricted investment earnings 19,175 46,888 66,063 90,307
Other 36,680 57,303 93,983 12,004
Gain on sale of assets 1,401 20 1,421 38
Transfers (534,103) 534,103 - -
TOTAL GENERAL REVENUES & TRANSFERS 7,757,033 646,079 8,403,112 102,349
CHANGE IN NET POSITION 179,560 378,944 558,504 129,205
NET POSITION - JULY 1, RESTATED 8,521,577 6,421,205 14,942,782 3,569,838
NET POSITION - JUNE 30 8,701,137$ 6,800,149$ 15,501,286$ 3,699,043$
PROGRAM REVENUES PRIMARY GOVERNMENT
NET (EXPENSES) REVENUES & CHANGES IN NET POSITION
The notes are an integral part of the financial statements.
37

IOWA
38

GOVERNMENTAL FUND FINANCIAL STATEMENTS
Major Funds
General Fund - This is the State's operating fund. It accounts for the financial resources and transactions not accounted for in other funds. Tobacco Settlement Authority - The Tobacco Settlement Authority, a blended component unit of the State of Iowa, receives money from the Tobacco Collections Fund to pay for operating expenditures and repayment of debt. Tobacco Collections Fund - The Tobacco Collections Fund accounts for tobacco settlement monies received pursuant to a Master Settlement Agreement between the State of Iowa and the five largest tobacco manufacturers. The funds are then distributed to the Tobacco Settlement Authority and the Endowment for Iowa's Health Fund pursuant to the terms of a Sales Agreement (dated October 1, 2001, and amended November 1, 2005) between the State and the Tobacco Settlement Authority. Per Code of Iowa Section 12E.12.1.b(3)(b), the State's portion is then transferred to the Rebuild Iowa Infrastructure Fund. Nonmajor Governmental Funds are presented, by fund type, in the Supplementary Information section.
39

STATE OF IOWA
Balance Sheet
Governmental Funds
June 30, 2015
(Expressed in Thousands)
TOBACCO TOBACCO NONMAJOR TOTAL
GENERAL SETTLEMENT COLLECTIONS GOVERNMENTAL GOVERNMENTAL
FUND AUTHORITY FUND FUNDS FUNDS
ASSETS
Current assets:
Cash & investments 2,214,817$ 4,762$ -$ 93,734$ 2,313,313$
Deposits with trustees 119,751 - - - 119,751
Accounts receivable (net) 1,817,406 214 31,654 15,886 1,865,160
Loans receivable (net) 3,760 - - 240 4,000
Due from other funds 21,519 156,007 - 3,169 180,695
Inventory 13,516 - - 130 13,646
Prepaid expenditures 31,012 - - 176 31,188
Total current assets 4,221,781 160,983 31,654 113,335 4,527,753
Noncurrent assets:
Deposits with trustees - 77,839 - - 77,839
Accounts receivable (net) 88,434 - - 7,021 95,455
Loans receivable (net) 13,775 - - 1,491 15,266
Due from other funds/
advances to other funds - 148,995 - - 148,995
Total noncurrent assets 102,209 226,834 - 8,512 337,555
TOTAL ASSETS 4,323,990$ 387,817$ 31,654$ 121,847$ 4,865,308$
LIABILITIES
Current liabilities:
Accounts payable & accruals 1,394,825$ 135$ -$ 8,838$ 1,403,798$
Due to other funds/
advances from other funds 70,726 141 156,007 9,244 236,118
Unearned revenue 17,279 - - 362 17,641
Total current liabilities 1,482,830 276 156,007 18,444 1,657,557
Noncurrent liabilities:
Accounts payable & accruals 993 - - - 993
Due to other funds/
advances from other funds - - 148,995 - 148,995
Unearned revenue 16 - - - 16
Total noncurrent liabilities 1,009 - 148,995 - 150,004
TOTAL LIABILITIES 1,483,839 276 305,002 18,444 1,807,561
DEFERRED INFLOWS OF
RESOURCES
Deferred revenue 530,510 - 31,654 12,981 575,145
FUND BALANCES
Nonspendable 44,528 - - 16,451 60,979
Spendable:
Restricted 861,583 387,541 - 49,946 1,299,070
Committed 1,676,632 - - 24,038 1,700,670
Unassigned (273,102) - (305,002) (13) (578,117)
TOTAL FUND BALANCES 2,309,641 387,541 (305,002) 90,422 2,482,602
TOTAL LIABILITIES, DEFERRED
INFLOWS OF RESOURCES &
FUND BALANCES 4,323,990$ 387,817$ 31,654$ 121,847$ 4,865,308$
The notes are an integral part of the financial statements.
40

STATE OF IOWA
Reconciliation of the Balance Sheet -
Governmental Funds to the Statement of Net Position
June 30, 2015
(Expressed in Thousands)
Total fund balances - governmental funds 2,482,602$
8,558,912
136,919
575,145
21,503
Bonds payable
Accrued interest payable
Compensated absences
Capital leases
Other financing arrangements payable
Pollution remediation
Early retirement/termination benefits
Risk management
Net pension liability & related deferred amounts
Other postemployment benefits
Other long-term liabilities
Total long-term liabilities (3,073,944)$
8,701,137$
The notes are an integral part of the financial statements.
Net position of governmental activities
(1,675,590)$
(8,206)
(317,247)
(76)
(1,474)
(30,747)
(21,043)
(20,000)
(895,613)
(102,890)
(1,058)
Long-term liabilities, including related deferred amounts, are not due and payable in
the current year and, therefore, are not reported as liabilities in governmental funds.
Long-term liabilities at year-end consist of:
Amounts reported for governmental activities in the Statement of Net Position are different
because:
Capital assets used in governmental activities are not financial resources and, therefore,
are not reported as assets in governmental funds. The cost of assets, excluding internal
service funds, is $15,882,208,000 and the accumulated depreciation is
$(7,323,296,000).
Internal service funds are used by management to charge the costs of certain activities
to individual funds. A portion of the assets and liabilities of the internal service funds
are included in governmental activities in the Statement of Net Position.
Certain revenues are earned but not available and, therefore, are deferred in
governmental funds as deferred inflows of resources.
Debt refunding losses/gains are reported as current expenditures/revenues in
governmental funds. However, debt refunding losses/gains are amortized over the life
of the bonds and are included as deferred outflows/inflows of resources in
governmental activities in the Statement of Net Position.
41

STATE OF IOWA
Statement of Revenues, Expenditures and Changes in Fund Balances
Governmental Funds
For the Year Ended June 30, 2015
(Expressed in Thousands)
TOBACCO TOBACCO NONMAJOR TOTAL
GENERAL SETTLEMENT COLLECTIONS GOVERNMENTAL GOVERNMENTAL
FUND AUTHORITY FUND FUNDS FUNDS
REVENUES
Taxes 8,917,337$ -$ -$ -$ 8,917,337$
Receipts from other entities 5,930,405 - - 13,360 5,943,765
Investment income 16,102 2,635 - 404 19,141
Fees, licenses & permits 1,321,520 - - 37,141 1,358,661
Refunds & reimbursements 533,630 - 63,770 4,412 601,812
Sales, rents & services 35,242 - - 4,523 39,765
Miscellaneous 161,828 - - 15,882 177,710
GROSS REVENUES 16,916,064 2,635 63,770 75,722 17,058,191
Less revenue refunds 1,064,122 - - 1,945 1,066,067
NET REVENUES 15,851,942 2,635 63,770 73,777 15,992,124
EXPENDITURES
Current:
Administration & regulation 1,580,146 978 - 15,148 1,596,272
Education 3,893,529 - - 14,956 3,908,485
Health & human rights 420,350 - - 557 420,907
Human services 6,454,748 - - 176 6,454,924
Justice & public defense 1,172,132 - - 905 1,173,037
Economic development 158,282 - - - 158,282
Transportation 645,859 - - 622 646,481
Agriculture & natural resources 199,576 - - 8,247 207,823
Capital outlay 1,200,013 - - 38,396 1,238,409
Debt service:
Principal 33,890 11,735 - - 45,625
Interest & fiscal charges 49,015 40,644 - - 89,659
TOTAL EXPENDITURES 15,807,540 53,357 - 79,007 15,939,904
EXCESS (DEFICIENCY) OF REVENUES
OVER (UNDER) EXPENDITURES 44,402 (50,722) 63,770 (5,230) 52,220
OTHER FINANCING SOURCES (USES)
Transfers in 163,331 - - 37,280 200,611
Transfers out (682,624) - (14,029) (38,060) (734,713)
Leases, installment purchases
& other 199 - - - 199
TOTAL OTHER FINANCING USES (519,094) - (14,029) (780) (533,903)
NET CHANGE IN FUND BALANCES (474,692) (50,722) 49,741 (6,010) (481,683)
FUND BALANCES - JULY 1 2,784,333 438,263 (354,743) 96,432 2,964,285
FUND BALANCES - JUNE 30 2,309,641$ 387,541$ (305,002)$ 90,422$ 2,482,602$
The notes are an integral part of the financial statements.
42
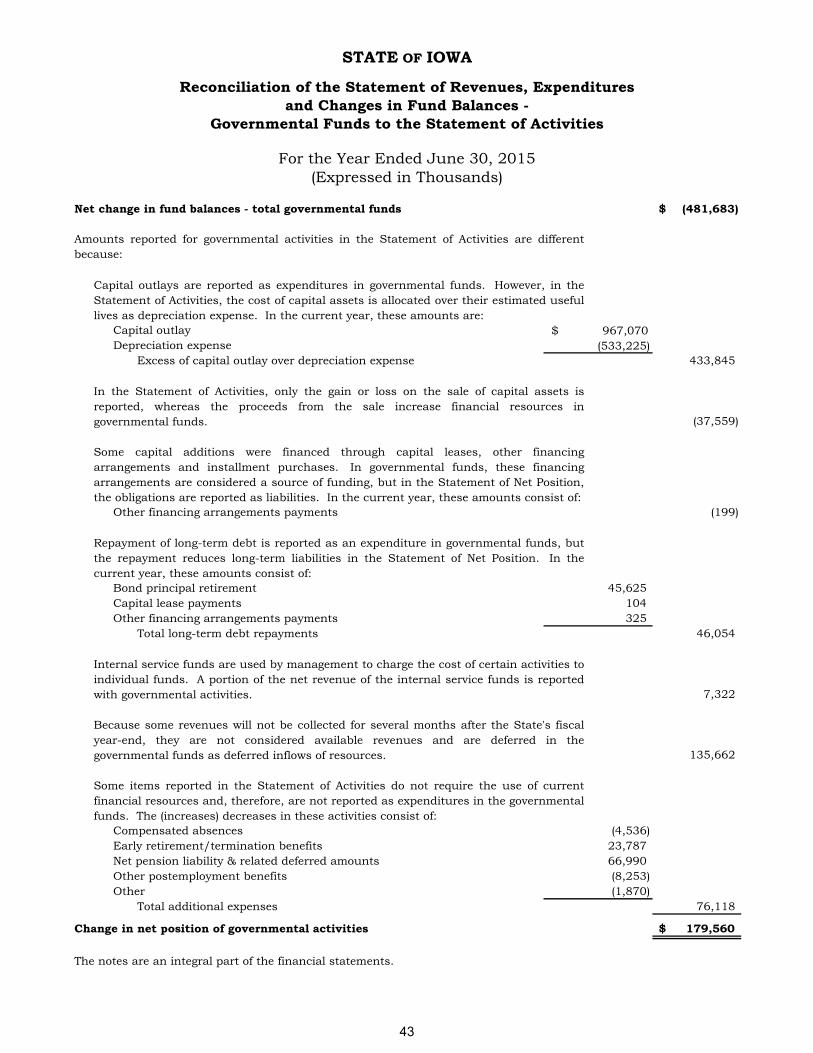
STATE OF IOWA
Reconciliation of the Statement of Revenues, Expenditures
and Changes in Fund Balances -
Governmental Funds to the Statement of Activities
Net change in fund balances - total governmental funds (481,683)$
Capital outlay
Depreciation expense
Excess of capital outlay over depreciation expense 433,845
(37,559)
Other financing arrangements payments (199)
Bond principal retirement
Capital lease payments
Other financing arrangements payments
Total long-term debt repayments 46,054
7,322
135,662
Compensated absences
Early retirement/termination benefits
Net pension liability & related deferred amounts
Other postemployment benefits
Other
Total additional expenses 76,118
179,560$
The notes are an integral part of the financial statements.
Change in net position of governmental activities
Some items reported in the Statement of Activities do not require the use of current
financial resources and, therefore, are not reported as expenditures in the governmental
funds. The (increases) decreases in these activities consist of:
(4,536)
23,787
66,990
(8,253)
(1,870)
Because some revenues will not be collected for several months after the State's fiscal
year-end, they are not considered available revenues and are deferred in the
governmental funds as deferred inflows of resources.
In the Statement of Activities, only the gain or loss on the sale of capital assets is
reported, whereas the proceeds from the sale increase financial resources in
governmental funds.
Some capital additions were financed through capital leases, other financing
arrangements and installment purchases. In governmental funds, these financing
arrangements are considered a source of funding, but in the Statement of Net Position,
the obligations are reported as liabilities. In the current year, these amounts consist of:
Repayment of long-term debt is reported as an expenditure in governmental funds, but
the repayment reduces long-term liabilities in the Statement of Net Position. In the
current year, these amounts consist of:
45,625
104
325
Internal service funds are used by management to charge the cost of certain activities to
individual funds. A portion of the net revenue of the internal service funds is reported
with governmental activities.
(533,225)
For the Year Ended June 30, 2015
(Expressed in Thousands)
Amounts reported for governmental activities in the Statement of Activities are different
because:
Capital outlays are reported as expenditures in governmental funds. However, in the
Statement of Activities, the cost of capital assets is allocated over their estimated useful
lives as depreciation expense. In the current year, these amounts are:
$ 967,070
43

IOWA
44
PROPRIETARY FUND FINANCIAL STATEMENTS
Major Funds
University Funds are maintained to account for the operations of the State's public institutions of higher education. The State University of Iowa, Iowa State University and the University of Northern Iowa comprise this group. Unemployment Benefits Fund receives contributions from employers and federal funds to provide benefits to eligible unemployed workers. Nonmajor Proprietary Funds are presented by fund in the Supplementary Information section.
45

STATE OF IOWA
Statement of Net Position
Proprietary Funds
June 30, 2015
(Expressed in Thousands)
GOVERNMENTAL
ACTIVITIES -
UNEMPLOYMENT NONMAJOR INTERNAL
UNIVERSITY BENEFITS ENTERPRISE SERVICE
FUNDS FUND FUNDS TOTAL FUNDS
ASSETS
Current assets:
Cash & investments 512,276$ 1,066,777$ 42,360$ 1,621,413$ 70,616$
Deposits with trustees 52 - - 52 -
Accounts receivable (net) 565,023 147,672 21,759 734,454 663
Interest receivable 2,860 - - 2,860 -
Loans receivable (net) 7,620 - - 7,620 -
Due from other funds/advances to other funds - 570 146 716 79,985
Inventory 52,591 - 12,306 64,897 8,169
Prepaid expenses 33,495 - 3,420 36,915 2,420
Total current assets 1,173,917 1,215,019 79,991 2,468,927 161,853
Noncurrent assets:
Cash & investments 2,518,502 - - 2,518,502 -
Deposits with trustees 14,800 - - 14,800 -
Accounts receivable 18,784 - - 18,784 -
Interest receivable 436 - - 436 -
Loans receivable (net) 67,668 - - 67,668 -
Due from other funds/advances to other funds - - - - 259
Capital assets - nondepreciable 1,282,450 - 6,681 1,289,131 -
Capital assets - depreciable (net) 3,681,277 - 70,586 3,751,863 103,781
Prepaid expenses 370 - - 370 -
Other assets 43,867 - - 43,867 -
Total noncurrent assets 7,628,154 - 77,267 7,705,421 104,040
TOTAL ASSETS 8,802,071 1,215,019 157,258 10,174,348 265,893
DEFERRED OUTFLOWS OF RESOURCES
Debt refunding loss 6,882 - - 6,882 -
Related to pensions 23,614 - 1,970 25,584 3,145
TOTAL DEFERRED OUTFLOWS OF RESOURCES 30,496 - 1,970 32,466 3,145
LIABILITIES
Current liabilities:
Accounts payable & accruals 381,779 20,432 16,748 418,959 32,287
Due to other funds/advances from other funds - 182 11,863 12,045 13,233
Interest payable 28,640 - - 28,640 -
Unearned revenue 90,309 31,075 2,993 124,377 22,638
Compensated absences 118,996 - 1,807 120,803 2,840
Capital leases 2,336 - - 2,336 -
Bonds payable 87,803 - - 87,803 -
Other financing arrangements payable 9,580 - - 9,580 -
Funds held in custody 233,856 - - 233,856 -
Total current liabilities 953,299 51,689 33,411 1,038,399 70,998
Noncurrent liabilities:
Accounts payable & accruals 227,496 - 1,584 229,080 44,459
Due to other funds/advances from other funds - - - - 259
Unearned revenue 1,606 - - 1,606 -
Compensated absences 77,264 - 1,959 79,223 2,962
Capital leases 31,864 - - 31,864 -
Bonds payable 1,815,682 - - 1,815,682 -
Other financing arrangements payable 54,634 - - 54,634 -
Net pension liability 64,217 - 7,110 71,327 14,007
Funds held in custody 40,937 - - 40,937 -
Total noncurrent liabilities 2,313,700 - 10,653 2,324,353 61,687
TOTAL LIABILITIES 3,266,999 51,689 44,064 3,362,752 132,685
DEFERRED INFLOWS OF RESOURCES
Debt refunding gain 8,021 - - 8,021 -
Grants received in advance of meeting timing requirements 489 - - 489 -
Related to pensions 24,491 - 4,344 28,835 6,002
TOTAL DEFERRED INFLOWS OF RESOURCES 33,001 - 4,344 37,345 6,002
NET POSITION
Net investment in capital assets 3,147,701 - 77,267 3,224,968 103,781
Restricted for:
Expendable 474,473 - - 474,473 -
Nonexpendable 76,037 - - 76,037 -
Unemployment benefits - 1,163,330 - 1,163,330 -
Unrestricted 1,834,356 - 33,553 1,867,909 26,570
TOTAL NET POSITION 5,532,567$ 1,163,330$ 110,820$ 6,806,717 130,351$
Adjustment to reflect the consolidation of internal service fund activities related to enterprise funds (6,568)
NET POSITION OF BUSINESS-TYPE ACTIVITIES 6,800,149$
The notes are an integral part of the financial statements.
BUSINESS-TYPE ACTIVITIES -
ENTERPRISE FUNDS
46

STATE OF IOWA
Statement of Revenues, Expenses and Changes in Fund Net Position
Proprietary Funds
For the Year Ended June 30, 2015
(Expressed in Thousands)
GOVERNMENTAL
ACTIVITIES -
UNEMPLOYMENT NONMAJOR INTERNAL
UNIVERSITY BENEFITS ENTERPRISE SERVICE
FUNDS FUND FUNDS TOTAL FUNDS
OPERATING REVENUES
Employer contributions -$ 410,209$ -$ 410,209$ -$
Receipts from other entities - 4,001 - 4,001 144,870
Fees, licenses & permits 2,371,830 - 21,425 2,393,255 2
Refunds & reimbursements - - 288 288 65,314
Sales, rents & services 376,020 - 341,089 717,109 2,026
Grants & contracts 552,781 - - 552,781 -
Independent/auxiliary operations 289,204 - - 289,204 -
Miscellaneous 57,297 6 3,327 60,630 5,042
TOTAL OPERATING REVENUES 3,647,132 414,216 366,129 4,427,477 217,254
OPERATING EXPENSES
General & administrative - - 15,866 15,866 -
Scholarship & fellowship 39,041 - - 39,041 -
Depreciation 283,328 - 5,870 289,198 15,585
Direct & other - - 27,448 27,448 -
Personal services 2,602,514 - 8,044 2,610,558 33,317
Travel & subsistence 36,886 - 740 37,626 18,463
Supplies & materials 622,052 - 381 622,433 49,530
Contractual services 122,884 - 6,710 129,594 38,647
Equipment & repairs 553,337 - 222 553,559 26,574
Claims & miscellaneous 13,228 - 194,361 207,589 27,460
Licenses, permits & refunds 5,084 - 702 5,786 178
State aid & credits - 396,842 3,718 400,560 -
TOTAL OPERATING EXPENSES 4,278,354 396,842 264,062 4,939,258 209,754
OPERATING INCOME (LOSS) (631,222) 17,374 102,067 (511,781) 7,500
NONOPERATING REVENUES (EXPENSES)
Gifts 189,852 - - 189,852 -
Taxes - - 7,765 7,765 -
Investment income 24,291 22,460 118 46,869 53
Interest expense (55,669) - - (55,669) -
Miscellaneous expenses (1,795) - - (1,795) -
Gain (loss) on sale of capital assets (3,762) - (11) (3,773) (7)
NET NONOPERATING REVENUES 152,917 22,460 7,872 183,249 46
INCOME (LOSS) BEFORE CONTRIBUTIONS
& TRANSFERS (478,305) 39,834 109,939 (328,532) 7,546
Capital contributions & grants 173,150 - - 173,150 -
Transfers in 643,274 - 2,353 645,627 -
Transfers out - (880) (110,645) (111,525) -
CHANGE IN NET POSITION 338,119 38,954 1,647 378,720 7,546
TOTAL NET POSITION - JULY 1, RESTATED 5,194,448 1,124,376 109,173 122,805
TOTAL NET POSITION - JUNE 30 5,532,567$ 1,163,330$ 110,820$ 130,351$
Adjustment to reflect the consolidation of internal service fund activities related to enterprise funds 224
CHANGE IN NET POSITION OF BUSINESS-TYPE ACTIVITIES 378,944$
The notes are an integral part of the financial statements.
BUSINESS-TYPE ACTIVITIES -
ENTERPRISE FUNDS
47

STATE OF IOWA
Statement of Cash Flows
Proprietary Funds
For the Year Ended June 30, 2015
(Expressed in Thousands)
GOVERNMENTAL
ACTIVITIES -
UNEMPLOYMENT NONMAJOR INTERNAL
UNIVERSITY BENEFITS ENTERPRISE SERVICE
FUNDS FUND FUNDS TOTAL FUNDS
CASH FLOWS FROM OPERATING ACTIVITIES
Cash received from customers/students 2,953,642$ -$ 362,246$ 3,315,888$ -$
Cash received from miscellaneous 87,097 6 3,364 90,467 -
Cash received from employers - 422,591 - 422,591 -
Cash received from other entities 521,504 4,001 - 525,505 17,147
Cash received from reciprocal interfund activity - - - - 204,401
Cash payments to suppliers for goods & services (1,447,296) - (244,717) (1,692,013) (162,193)
Cash payments to employees/students for services (2,510,799) - (17,574) (2,528,373) (34,103)
Cash payments for interfund transactions - (8) - (8) -
Cash payments for unemployment claims - (394,695) - (394,695) -
NET CASH PROVIDED (USED) BY OPERATING ACTIVITIES (395,852) 31,895 103,319 (260,638) 25,252
CASH FLOWS FROM NONCAPITAL FINANCING ACTIVITIES
Transfers in from other funds 598,256 - 2,353 600,609 -
Transfers out to other funds - (1,520) (109,661) (111,181) -
Receipts from related agencies 944,546 - - 944,546 -
Payments to related agencies (996,203) - - (996,203) -
Other noncapital financing receipts 26,173 - - 26,173 -
Other noncapital financing payments (3,336) - - (3,336) -
Proceeds from noncapital gifts 172,609 - - 172,609 -
Tax receipts - - 7,765 7,765 -
NET CASH PROVIDED (USED) BY NONCAPITAL FINANCING ACTIVITIES 742,045 (1,520) (99,543) 640,982 -
CASH FLOWS FROM CAPITAL & RELATED FINANCING ACTIVITIES
Acquisition & construction of capital assets (712,367) - (2,378) (714,745) (13,015)
Interest payments (60,394) - - (60,394) -
Debt payments (113,506) - - (113,506) -
Capital grants & contributions 68,102 - - 68,102 -
Debt proceeds 166,614 - - 166,614 -
Proceeds from sale of capital assets 3,153 - (11) 3,142 -
Other capital & related financing activities 141,957 - - 141,957 -
NET CASH USED BY CAPITAL & RELATED FINANCING ACTIVITIES (506,441) - (2,389) (508,830) (13,015)
CASH FLOWS FROM INVESTING ACTIVITIES
Interest & dividends on investments 34,792 22,460 118 57,370 53
Proceeds from sale & maturities of investments 1,917,906 - - 1,917,906 -
Purchase of investments (1,714,369) - - (1,714,369) -
NET CASH PROVIDED BY INVESTING ACTIVITIES 238,329 22,460 118 260,907 53
NET INCREASE IN CASH & CASH EQUIVALENTS 78,081 52,835 1,505 132,421 12,290
CASH & CASH EQUIVALENTS - JULY 1 310,128 1,013,942 40,855 1,364,925 58,326
CASH & CASH EQUIVALENTS - JUNE 30 388,209 1,066,777 42,360 1,497,346 70,616
INVESTMENTS 2,642,569 - - 2,642,569 -
CASH & INVESTMENTS PER STATEMENT OF NET POSITION 3,030,778$ 1,066,777$ 42,360$ 4,139,915$ 70,616$
(continued on next page)
BUSINESS-TYPE ACTIVITIES -
ENTERPRISE FUNDS
48

STATE OF IOWA
Statement of Cash Flows
Proprietary Funds
For the Year Ended June 30, 2015
(Expressed in Thousands)(continued)
GOVERNMENTAL
ACTIVITIES -
UNEMPLOYMENT NONMAJOR INTERNAL
UNIVERSITY BENEFITS ENTERPRISE SERVICE
FUNDS FUND FUNDS TOTAL FUNDS
RECONCILIATION OF OPERATING INCOME (LOSS) TO NET CASH PROVIDED
(USED) BY OPERATING ACTIVITIES
Operating income (loss) (631,222)$ 17,374$ 102,067$ (511,781)$ 7,500$
Adjustments to reconcile operating income (loss) to net cash provided (used)
by operating activities:
Depreciation 283,328 - 5,870 289,198 15,585
(Increase) decrease in accounts receivable (98,183) 28,869 (90) (69,404) 1,844
(Increase) decrease in due from - (8) (97) (105) (1,998)
(Increase) decrease in inventory (4,378) - (213) (4,591) 625
(Increase) decrease in prepaid expenses 403 - (2,691) (2,288) (268)
(Increase) decrease in loans receivable (821) - - (821) -
(Increase) decrease in other assets (3,620) - - (3,620) -
(Increase) decrease in deferred outflows of resources (14,153) - (495) (14,648) (1,081)
Increase (decrease) in accounts payable 49,154 1,071 737 50,962 (1,698)
Increase (decrease) in due to - - (1,058) (1,058) 1,474
Increase (decrease) in unearned revenue 9,474 (15,411) (332) (6,269) 2,974
Increase (decrease) in compensated absences 4,448 - 30 4,478 233
Increase (decrease) in other liability/capital leases (115) - - (115) -
Increase (decrease) in net pension liability (14,658) - (4,753) (19,411) (5,940)
Increase (decrease) in deferred inflows of resources 24,491 - 4,344 28,835 6,002
NET CASH PROVIDED (USED) BY OPERATING ACTIVITIES (395,852)$ 31,895$ 103,319$ (260,638)$ 25,252$
NONCASH INVESTING, CAPITAL & RELATED FINANCING ACTIVITIES
Capital assets acquired through capital leases 1,022$ -$ -$ 1,022$ -$
Capital assets contributed 4,670 - - 4,670 -
TOTAL NONCASH INVESTING, CAPITAL & RELATED FINANCING ACTIVITIES 5,692$ -$ -$ 5,692$ -$
The notes are an integral part of the financial statements.
BUSINESS-TYPE ACTIVITIES -
ENTERPRISE FUNDS
49

IOWA
50

FIDUCIARY FUND FINANCIAL STATEMENTS
Fiduciary Funds are presented by fund in the Supplementary Information section.
51

STATE OF IOWA
Statement of Fiduciary Net Position
Fiduciary Funds
June 30, 2015
(Expressed in Thousands)
PENSION PRIVATE
& OTHER PURPOSE
EMPLOYEE TRUST AGENCY
BENEFIT FUNDS FUNDS FUNDS
ASSETS
Cash & cash equivalents 257,087$ 28,469$ 237,212$
Receivables:
Accounts (net) - 735 198,724
Contributions 69,716 - -
Investments sold 526,387 - -
Foreign exchange contracts 653,246 - -
Interest & dividends 80,465 - -
Total receivables 1,329,814 735 198,724
Investments, at fair value:
Fixed income securities 9,742,568 - -
Equity investments 11,745,237 4,370,928 -
Real estate partnerships 2,330,619 - -
Investment in private equity/debt 3,242,207 - -
Real assets 1,732,239
Securities lending collateral pool 572,449 - -
Securities on loan with brokers 17,446 - -
Total investments 29,382,765 4,370,928 -
Capital assets:
Land 500 - -
Other - depreciable (net) 21,940 48 -
Total capital assets 22,440 48 -
Other assets 712 15 -
TOTAL ASSETS 30,992,818 4,400,195 435,936
LIABILITIES
Accounts payable & accruals 39,484 316 435,936
Foreign exchange contracts payable 657,515 - -
Payable for investments purchased 715,489 - -
Payable to brokers for rebate & collateral 572,261 - -
TOTAL LIABILITIES 1,984,749 316 435,936
NET POSITION
Restricted for:
Pension/other postemployment benefits 29,008,069 - -
Individuals, organizations & other entities - 4,399,879 -
TOTAL NET POSITION 29,008,069$ 4,399,879$ -$
The notes are an integral part of the financial statements.
52

STATE OF IOWA
Statement of Changes in Fiduciary Net Position
Fiduciary Funds
For the Year Ended June 30, 2015
(Expressed in Thousands)
PENSION PRIVATE
& OTHER PURPOSE
EMPLOYEE TRUST
BENEFIT FUNDS FUNDS
ADDITIONS
Contributions:
Member/participant contributions 450,736$ 372,479$
Employer contributions 684,236 -
Buy-back/buy-in contributions 17,476 -
Other contributions - 972
Gifts, bequests & endowments - 2,618
Total contributions 1,152,448 376,069
Investment income:
Net increase in fair value of investments 637,341 118,448
Interest 319,968 344
Dividends 116,556 -
Other 111,353 -
Total investment income 1,185,218 118,792
Less investment expense 80,916 -
Net investment income 1,104,302 118,792
Miscellaneous non-investment income 5,000 -
TOTAL ADDITIONS 2,261,750 494,861
DEDUCTIONS
Pension & annuity benefits 1,782,185 -
Distributions to participants - 308,361
Payments in accordance with agreements 1,229 -
Administrative expense 12,824 -
Refunds 47,167 -
Other - 1,176
TOTAL DEDUCTIONS 1,843,405 309,537
CHANGE IN NET POSITION 418,345 185,324
NET POSITION - JULY 1 28,589,724 4,214,555
NET POSITION - JUNE 30 29,008,069$ 4,399,879$
The notes are an integral part of the financial statements.
53

IOWA
54

COMPONENT UNIT FINANCIAL STATEMENTS
Iowa Finance Authority issues bonds to assist in attainment of adequate housing for special needs individuals such as the low to moderate income and the disabled and to provide limited types of financing to small businesses. Iowa Economic Development Authority undertakes programs to promote economic development including financing programs and the issuance of bonds. Iowa State Fair Authority conducts the annual State Fair and Exposition and other interim events on the Iowa State Fairgrounds.
Iowa Lottery Authority is used to account for lottery revenues, administrative and operating expenses of the Lottery Authority and the distribution of revenue to the General Fund. The University of Iowa Foundation, Iowa State University Foundation and University of Northern Iowa Foundation act primarily as fund-raising organizations to supplement the resources available to the State universities. University of Iowa Research Foundation commercializes University of Iowa developed technologies and inventions through licensing and new venture formation. University of Iowa Health System & Subsidiaries supports clinical, academic, and research programs of the University of Iowa College of Medicine and the University of Iowa Hospitals and Clinics.
55

STATE OF IOWA
Statement of Net Position
Component Units
June 30, 2015
(Expressed in Thousands)
IOWA IOWA
IOWA ECONOMIC STATE IOWA UNIVERSITY
FINANCE DEVELOPMENT FAIR LOTTERY OF IOWA
AUTHORITY AUTHORITY AUTHORITY AUTHORITY FOUNDATION
ASSETS
Current assets:
Cash & investments 510,255$ 129,424$ 21,621$ 21,112$ 609,834$
Cash & investments - restricted - - - 618 -
Accounts receivable - 17,831 1,805 3,723 31,221
Interest receivable 5,941 - 61 21 -
Loans receivable (net) 82,150 4,142 - - -
Inventory - - 182 1,968 -
Prepaid expenses - 161 - 129 18
Other assets 1,693 - - 1,349 -
Total current assets 600,039 151,558 23,669 28,920 641,073
Noncurrent assets:
Cash & investments 453,458 - - - 582,615
Accounts receivable - - 736 - 79,126
Loans receivable (net) 1,487,228 66,816 - - -
Capital assets - nondepreciable 716 - 15,744 1,592 123
Capital assets - depreciable (net) 2,100 173 59,105 6,567 18,810
Other assets 8,330 - - 7,418 -
Total noncurrent assets 1,951,832 66,989 75,585 15,577 680,674
TOTAL ASSETS 2,551,871 218,547 99,254 44,497 1,321,747
DEFERRED OUTFLOWS OF RESOURCES
Accumulated decrease in fair value of
hedging derivatives 3,105 - - - -
Debt refunding loss 26,703 - - - -
Excess consideration provided for acquisition - - - - -
Related to pensions 867 953 - 843 -
TOTAL DEFERRED OUTFLOWS OF RESOURCES 30,675 953 - 843 -
LIABILITIES
Current liabilities:
Accounts payable & accruals 31,637 13,169 1,060 23,762 2,218
Interest payable 19,634 - - - -
Unearned revenue - - 78 388 -
Compensated absences - 767 303 787 -
Capital leases - - - - 725
Bonds payable 56,496 - - - -
Funds held in custody - - - - 99,391
Total current liabilities 107,767 13,936 1,441 24,937 102,334
Noncurrent liabilities:
Accounts payable & accruals 10,379 11 - 7,457 27,000
Compensated absences - 1,577 1,146 1,379 -
Capital leases - - - - 2,345
Bonds payable 1,306,424 - - - -
Net pension liability 4,267 4,627 - 4,078 -
Funds held in custody - - - - -
Total noncurrent liabilities 1,321,070 6,215 1,146 12,914 29,345
TOTAL LIABILITIES 1,428,837 20,151 2,587 37,851 131,679
DEFERRED INFLOWS OF RESOURCES
Related to pensions 1,692 1,982 - 1,691 -
NET POSITION
Net investment in capital assets 2,816 173 74,849 8,159 15,863
Restricted for:
Bond resolutions 911,181 - - - -
Clean water and drinking water programs 151,087 - - - -
Title guaranty program 81,784 - - - -
Economic development - 56,174 - - -
Other purposes - - 3,502 - -
Nonexpendable - foundations - - - - 582,615
Expendable - foundations - - - - 577,229
Unrestricted 5,149 141,020 18,316 (2,361) 14,361
TOTAL NET POSITION 1,152,017$ 197,367$ 96,667$ 5,798$ 1,190,068$
The notes are an integral part of the financial statements. (continued on next page)
56

STATE OF IOWA
Statement of Net Position
Component Units
June 30, 2015
(Expressed in Thousands)
UNIVERSITY UNIVERSITY UNIVERSITY
IOWA STATE OF NORTHERN OF IOWA OF IOWA TOTAL
UNIVERSITY IOWA RESEARCH HEALTH SYSTEM COMPONENT
FOUNDATION FOUNDATION FOUNDATION & SUBSIDIARIES UNITS
ASSETS
Current assets:
Cash & investments 184,989$ 20,541$ 18,461$ 20,809$ 1,537,046$
Cash & investments - restricted - - - - 618
Accounts receivable 30,581 2,171 660 3,319 91,311
Interest receivable - - - - 6,023
Loans receivable (net) - - - - 86,292
Inventory - - - 887 3,037
Prepaid expenses 228 - 105 309 950
Other assets - 184 - - 3,226
Total current assets 215,798 22,896 19,226 25,324 1,728,503
Noncurrent assets:
Cash & investments 618,043 108,912 - 486 1,763,514
Accounts receivable 79,684 4,880 - - 164,426
Loans receivable (net) 1,388 - - - 1,555,432
Capital assets - nondepreciable 960 - - - 19,135
Capital assets - depreciable (net) 3,067 794 3 633 91,252
Other assets 5,138 1,515 3,658 - 26,059
Total noncurrent assets 708,280 116,101 3,661 1,119 3,619,818
TOTAL ASSETS 924,078 138,997 22,887 26,443 5,348,321
DEFERRED OUTFLOWS OF RESOURCES
Accumulated decrease in fair value of
hedging derivatives - - - - 3,105
Debt refunding loss - - - - 26,703
Excess consideration provided for acquisition - - - 1,542 1,542
Related to pensions - - - - 2,663
TOTAL DEFERRED OUTFLOWS OF RESOURCES - - - 1,542 34,013
LIABILITIES
Current liabilities:
Accounts payable & accruals 512 1,122 2,137 2,894 78,511
Interest payable - - - - 19,634
Unearned revenue - - - - 466
Compensated absences 615 - - - 2,472
Capital leases - - - - 725
Bonds payable 133 - - - 56,629
Funds held in custody 12,025 - - 5,447 116,863
Total current liabilities 13,285 1,122 2,137 8,341 275,300
Noncurrent liabilities:
Accounts payable & accruals 20,908 2,498 92 - 68,345
Compensated absences - - - - 4,102
Capital leases - - - - 2,345
Bonds payable 2,200 - - - 1,308,624
Net pension liability - - - - 12,972
Funds held in custody 6,238 - - - 6,238
Total noncurrent liabilities 29,346 2,498 92 - 1,402,626
TOTAL LIABILITIES 42,631 3,620 2,229 8,341 1,677,926
DEFERRED INFLOWS OF RESOURCES
Related to pensions - - - - 5,365
NET POSITION
Net investment in capital assets 1,694 794 3 633 104,984
Restricted for:
Bond resolutions - - - - 911,181
Clean water and drinking water programs - - - - 151,087
Title guaranty program - - - - 81,784
Economic development - - - - 56,174
Other purposes - - - - 3,502
Nonexpendable - foundations 611,339 86,453 - - 1,280,407
Expendable - foundations 244,723 40,417 - - 862,369
Unrestricted 23,691 7,713 20,655 19,011 247,555
TOTAL NET POSITION 881,447$ 135,377$ 20,658$ 19,644$ 3,699,043$
(continued on next page)
(continued)
57

STATE OF IOWA
Statement of Activities
Component Units
For the Year Ended June 30, 2015
(Expressed in Thousands)
IOWA IOWA
IOWA ECONOMIC STATE IOWA UNIVERSITY
FINANCE DEVELOPMENT FAIR LOTTERY OF IOWA
AUTHORITY AUTHORITY AUTHORITY AUTHORITY FOUNDATION
Expenses 106,131$ 182,576$ 23,084$ 322,934$ 120,103$
Program revenues:
Charges for services 14,701 1,518 22,258 324,777 -
Operating grants & contributions 53,739 185,385 4,734 - 122,956
Capital grants & contributions - - 118 - -
Total program revenues 68,440 186,903 27,110 324,777 122,956
Net program (expenses) revenues (37,691) 4,327 4,026 1,843 2,853
General revenues:
Investment income (loss) 65,348 630 57 76 33,805
Other - 7,284 825 - -
Gain (loss) on sale of assets - - - (364) -
Total general revenues 65,348 7,914 882 (288) 33,805
CHANGE IN NET POSITION 27,657 12,241 4,908 1,555 36,658
NET POSITION - JULY 1, RESTATED 1,124,360 185,126 91,759 4,243 1,153,410
NET POSITION - JUNE 30 1,152,017$ 197,367$ 96,667$ 5,798$ 1,190,068$
The notes are an integral part of the financial statements. (continued on next page)
58

STATE OF IOWA
Statement of Activities
Component Units
For the Year Ended June 30, 2015
(Expressed in Thousands)
UNIVERSITY UNIVERSITY UNIVERSITY
IOWA STATE OF NORTHERN OF IOWA OF IOWA TOTAL
UNIVERSITY IOWA RESEARCH HEALTH SYSTEM COMPONENT
FOUNDATION FOUNDATION FOUNDATION & SUBSIDIARIES UNITS
Expenses 97,396$ 14,655$ 7,483$ 26,253$ 900,615$
Program revenues:
Charges for services - - 2,682 26,001 391,937
Operating grants & contributions 153,674 15,292 - - 535,780
Capital grants & contributions - - - - 118
Total program revenues 153,674 15,292 2,682 26,001 927,835
Net program (expenses) revenues 56,278 637 (4,801) (252) 27,220
General revenues:
Investment income (16,202) 2,869 3,687 37 90,307
Other - - - 3,895 12,004
Gain (loss) on sale of assets - - - 38 (326)
Total general revenues (16,202) 2,869 3,687 3,970 101,985
CHANGE IN NET POSITION 40,076 3,506 (1,114) 3,718 129,205
NET POSITION - JULY 1 841,371 131,871 21,772 15,926 3,569,838
NET POSITION - JUNE 30 881,447$ 135,377$ 20,658$ 19,644$ 3,699,043$
(continued on next page)
(continued)
59

IOWA
60

STATE OF IOWA
NOTES TO THE FINANCIAL STATEMENTS
NOTE 1 – SUMMARY OF SIGNIFICANT ACCOUNTING POLICIES
A. Basis of Presentation
The accompanying financial statements of the State of Iowa have been prepared in conformity with U.S. generally accepted accounting principles (GAAP) as prescribed by the Governmental Accounting Standards Board (GASB).
B. Financial Reporting Entity
For financial reporting purposes, the State of Iowa includes all funds, departments, agencies and universities of the State. The State has also considered all potential component units for which it is financially accountable and other organizations for which the nature and significance of their relationship with the State are such that exclusion would cause the State’s financial statements to be misleading or incomplete. The GASB has set forth criteria to be considered in determining financial accountability. These criteria include appointing a voting majority of an organization’s governing body and (1) the ability of the State to impose its will on that organization or (2) the potential for the organization to provide specific financial benefits to, or impose specific financial burdens on, the State.
As required by GAAP, these financial statements present the State of Iowa (the primary government) and its component units. The component units are included in the State’s reporting entity because of the significance of
their operational or financial relationships with the State. The individual component unit financial statements, except for the Iowa Economic Development Authority (single fund type) which does not issue separate financial statements, can be obtained by contacting: Iowa Department of Administrative Services, State Accounting Enterprise, 3rd Floor, Hoover State Office Bldg., Des Moines, IA 50319.
Blended Component Units
These component units are legally separate organizations for which the State is financially accountable. The State appoints a voting majority of their boards and is able to impose its will on the organizations. In addition, these organizations provide specific financial benefits to, or impose specific financial burdens upon the State. Each of the following component units are reported as part of the State’s primary government and are blended with the appropriate funds as they provide services entirely to the State or exclusively benefit the State.
Iowa Public Television Foundation (Special Revenue and Permanent Funds) promotes and serves as a
funding medium for Iowa Public Television (IPTV), a department of the State of Iowa. It solicits and manages gifts of money or property for the exclusive purpose of granting gifts of money or property to IPTV which has sole discretion as to the use of the money or property. IPTV provides support to the Foundation, including office space, equipment, website, legal services, television studio space and equipment, as well as, broadcast production staff. The State has the ability to control fund raising activities and operations as well as personnel decisions regarding the management of the Foundation. The Foundation exclusively benefits the State and provides services entirely to the State.
Tobacco Settlement Authority (Special Revenue Fund) was created to issue bonds to securitize payments
due to the State pursuant to the Master Settlement Agreement between the State and the five largest tobacco manufacturers. The Authority’s board consists of the Treasurer of State, Auditor of State and the Director of the Department of Management. The State has the ability to impose its will on the Authority and its sole purpose is to provide a secure and stable source of revenue from the tobacco settlement for the State.
Honey Creek Premier Destination Park Authority (Special Revenue Fund), herein referred to as Honey
Creek Authority, was created to issue bonds to provide financing for the development of the Honey Creek Park (Enterprise Fund). The Authority’s board consists of the Treasurer of State, Auditor of State and the
Director of the Department of Management. The State has the ability to impose its will on the Authority and its purpose is to provide for and secure the issuance and repayment of its bonds. As discussed in NOTE 10 – BONDS PAYABLE, the bonds were defeased in FY2014; accordingly no activity is reported in the financial statements.
Discretely Presented Component Units
These component units are entities which are legally separate from the State, but are financially accountable to the State, or its relationship with the State is such that exclusion would cause the State’s financial statements to be misleading or incomplete. The Component Units include the financial data of these entities.
Iowa Finance Authority (Proprietary) issues bonds to assist in attainment of adequate housing for special
needs individuals such as low to moderate income and the disabled, and to provide limited types of
61

STATE OF IOWA
NOTES TO THE FINANCIAL STATEMENTS
financing to small businesses. The nine members of the board of directors are appointed by the Governor and confirmed by the Senate.
Iowa Economic Development Authority (Proprietary) undertakes programs to enhance economic
development and to provide financing programs. The eleven members of the board of directors are appointed by the Governor and confirmed by the Senate. The State is able to impose its will on the Authority.
Iowa State Fair Authority (Proprietary) conducts the annual State Fair and Exposition and other interim
events on the Iowa State Fairgrounds. The State must approve any bonds issued by the Authority. (October 31 year-end)
Iowa Lottery Authority (Proprietary) was created to operate the State Lottery. The five members of the board of directors are appointed by the Governor and confirmed by the Senate. The State has the ability to impose its will on the Authority and its purpose is to produce the maximum amount of net revenues for the State in a dignified manner that maintains the general welfare of the people.
During the year ended June 30, 2015, the Iowa Lottery Authority distributed $72.4 million to the State of Iowa General Fund and $2.2 million to the Veteran’s Trust Fund.
The University related discretely presented component units below are private, nonprofit organizations that report under FASB standards, including FASB Statement No. 117, (Financial Reporting for Not-for-Profit Organizations), except for the University of Iowa Research Foundation and the University of Iowa
Health System & Subsidiaries. As such, certain revenue recognition criteria and presentation features are different from GASB revenue recognition criteria and presentation features. No modifications have been made to the financial information; however, the assets, liabilities, revenues and expenses were reformatted to correspond to the State’s reporting format for the Statement of Net Position and Statement of Activities.
o University of Iowa Foundation, Iowa State University Foundation and University of Northern Iowa Foundation (Foundations) are legally separate, tax exempt entities. They act primarily as fund-raising organizations to supplement the resources available to the State Universities (Universities) in support of their programs. Although the State does not control the timing or amount of receipts from the Foundations, the majority of resources they hold and invest, and income thereon, are restricted to the activities of the Universities by the donors. Because the majority of these restricted resources can only be used by, or for the benefit of, the Universities, they are considered a component unit of the State and are discretely presented in the financial statements.
During the year ended June 30, 2015, the Foundations distributed $183.4 million to the Universities for academic and institutional support.
o University of Iowa Research Foundation (UIRF) (Proprietary) commercializes University of Iowa developed technologies and inventions through licensing and new venture formation and manages the subsequent revenue streams. The intention of the UIRF is to effectively manage University intellectual property to successful outcomes including: transferring University inventions to the marketplace for public benefit, generating significant income, operating as a self-sustaining operation, and supporting the research mission. Because the majority of these restricted resources can only be used by, or for the benefit of, the University of Iowa, they are considered a component unit of the State and are discretely presented in the financial statements.
o University of Iowa Health System & Subsidiaries (Proprietary) was formed to support clinical, academic, and research programs of the University of Iowa College of Medicine and the University
of Iowa Hospitals and Clinics. Because the majority of these restricted resources can only be used by, or for the benefit of, the University of Iowa, they are considered a component unit of the State and are discretely presented in the financial statements.
62

STATE OF IOWA
NOTES TO THE FINANCIAL STATEMENTS
Related Organizations
These related organizations are excluded from the reporting entity because the State’s accountability does not extend beyond appointing a voting majority of the organizations’ board members. Financial statements are available from the respective organizations.
Iowa Student Loan Liquidity Corporation
Iowa Comprehensive Health Association
Iowa Higher Education Loan Authority
C. Government-Wide and Fund Financial Statements
Government-Wide Financial Statements
The Statement of Net Position and Statement of Activities report information on all non-fiduciary activities of the primary government and its component units. Primary government activities are distinguished between
governmental and business-type activities. Governmental activities generally are financed through taxes, intergovernmental revenues and other non-exchange revenues. Business-type activities are financed in whole or
in part by fees charged to external parties for goods or services.
The Statement of Net Position presents the State’s non-fiduciary assets, liabilities and deferred outflows/inflows of resources, with the difference reported as net position. Net position is reported in three categories:
Net investment in capital assets consists of capital assets, net of accumulated depreciation and reduced by outstanding balances for bonds, notes and other debt that are attributed to the acquisition, construction or improvement of those assets.
Restricted net position results when constraints placed on net position use are either externally imposed
or imposed by law through constitutional provisions or enabling legislation.
Unrestricted net position consists of net position that does not meet the definition of the two preceding
categories. Unrestricted net position often has constraints on resources that are imposed by management but can be removed or modified.
When both restricted and unrestricted resources are available for use, generally it is the State’s policy to use restricted resources first.
The Statement of Activities demonstrates the degree to which the direct expenses of a given function or segment are offset by program revenues. Direct expenses are those clearly identifiable with a specific function. Program revenues include 1) charges to customers who purchase, use or directly benefit from goods, services or privileges provided by a given function and 2) grants and contributions that are restricted to meeting the operational or capital requirements of a particular function. Taxes and other items not meeting the definition of program revenues are reported as general revenues.
Fund Financial Statements
Separate financial statements are provided for governmental funds, proprietary funds and fiduciary funds even though the latter are excluded from the government-wide statements. Major individual governmental funds and major individual proprietary funds are reported as separate columns in the fund financial statements, with non-major funds being combined into a single column.
Governmental Fund Balance Reporting
The fund balance classifications for governmental funds are reported in categories which describe the extent to which certain resources may be spent. Resources are categorized as spendable or nonspendable.
Nonspendable fund balance includes inventory, prepaid items, noncurrent receivables and principal of endowments. These resources cannot be spent because they are either not in spendable form or are legally required to remain intact. When the proceeds from noncurrent receivables are restricted, committed or assigned, the fund balances for those amounts will be reported in the appropriate spendable fund balance classification.
63

STATE OF IOWA
NOTES TO THE FINANCIAL STATEMENTS
Spendable fund balance includes resources that are in spendable form (e.g. cash) and are available for spending. Spendable fund balance is further classified as restricted, committed, assigned or unassigned. The following describes the different levels of constraint, if any, on spendable fund balance classifications:
Restricted – includes amounts that can be spent only for the specific purposes stipulated by constitution, external resource providers (e.g. creditors, grantors and contributors) or enabling legislation.
Committed – includes amounts that can be used only for the specific purposes determined by a formal action of the State’s highest level of decision-making authority. The Iowa Legislature and Governor represent the State’s highest level of decision-making authority. Formal action consists of legislation passed by both the House and Senate and signed by the Governor and is required to establish, modify or rescind a limitation.
Assigned – includes amounts intended to be used by the State for a specific purpose but do not meet the
criteria to be classified as restricted or committed. Currently, the State does not have a policy which authorizes the establishment of assigned fund balances.
Unassigned – includes the residual amount of the General Fund not included in the categories above, which is available for any purpose, and any negative fund balances in the other governmental fund types.
When both restricted and unrestricted (committed, assigned, unassigned) resources are available for use, generally it is the State’s policy to use restricted resources first. Also, when committed and unassigned resources are available to be spent for the same purpose, the State’s policy is, in general, to spend committed resources first.
D. Financial Statement Presentation
The State reports the following major governmental funds:
General Fund
The General Fund is the State’s principal operating fund. It accounts for all financial resources except those accounted for in another fund.
Special Revenue Funds
Tobacco Settlement Authority – The Tobacco Settlement Authority, a blended component unit of the State of Iowa, receives money from the Tobacco Collections Fund to pay for operating expenses and repayment of debt.
Tobacco Collections Fund – The Tobacco Collections Fund accounts for tobacco settlement monies received
pursuant to a Master Settlement Agreement between the State of Iowa and the five largest tobacco manufacturers. The funds are then distributed to the Tobacco Settlement Authority and the Endowment for Iowa’s Health Fund pursuant to the terms of a Sales Agreement (dated October 1, 2001, and amended November 1, 2005) between the State and the Tobacco Settlement Authority (a collateralized borrowing per GASB Statement No. 48). Per Code of Iowa Section 12E.12.1.b(3)(b), the State’s portion is then transferred to the Rebuild Iowa Infrastructure Fund.
The State reports the following major proprietary funds:
Enterprise Funds
University Funds account for the operations of the State’s public institutions of higher education. The State University of Iowa, Iowa State University and the University of Northern Iowa comprise this group.
The Unemployment Benefits Fund receives contributions from employers and federal funds to provide benefits to eligible unemployed workers.
In addition, the State reports the following fund types:
Governmental Funds
Special Revenue Funds account for the proceeds of specific revenue sources (other than permanent or capital projects) that are legally restricted to expenditures for a specified purpose.
Capital Projects Funds account for financial resources to be used for the acquisition or construction of major capital facilities (other than those financed by proprietary funds).
64

STATE OF IOWA
NOTES TO THE FINANCIAL STATEMENTS
Permanent Funds account for resources legally restricted to the extent that only earnings, and not principal, may be used for the benefit of the government or its citizenry.
Proprietary Funds
Enterprise Funds account for the activities for which fees are charged to external users for goods and services. This fund type is also used when the activity is financed with debt that is secured with fees and charges, as well as when the pricing policy of the activity is designated to recover its costs.
Internal Service Funds account for the financing of goods or services provided by one department or agency to other departments or agencies of the State, or to other governmental units, on a cost reimbursement basis. The activities accounted for in internal service funds include information
technology, workers’ compensation, fleet operations, printing and mail services and property management.
Fiduciary Funds
Pension and Other Employee Benefit Trust Funds account for resources that are required to be held for the members and beneficiaries of the State’s defined benefit pension plans and other postemployment benefit plans. The pension plans included are the Iowa Public Employees’ Retirement System (IPERS), Peace Officers’ Retirement, Accident and Disability System (PORS) and the Judicial Retirement System (JRS).
Private Purpose Trust Funds account for resources of all other trust arrangements in which principal and income benefit individuals, private organizations or other governments. Examples include Iowa Educational Savings Plan Trust, Veterans Affairs donations, Braille & Sight Saving School Fund and Gaining Early Awareness & Readiness for Undergraduate Programs (GEAR-UP) Fund.
Agency Funds account for resources held by the State in a purely custodial capacity. These funds include tax collections, fines, fees and payroll deductions.
E. Measurement Focus and Basis of Accounting
Basis of accounting refers to when revenues and expenditures or expenses are recognized in the accounts and reported in the financial statements. Basis of accounting relates to the timing of the measurements made, regardless of the measurement focus applied.
The government-wide statements are reported using the economic resources measurement focus and the accrual basis of accounting. Revenues are recorded when earned and expenses are recorded when a liability is incurred, regardless of the timing of cash flows.
Governmental fund statements are reported using the current financial resources measurement focus and the
modified accrual basis of accounting. Revenues are recognized as they become susceptible to accrual; generally when they are both measurable and available. Revenues are considered to be available when they are collected within the current period or soon enough thereafter to pay liabilities of the current period. Most revenues, including taxes, fees, charges for services, refunds and reimbursements and receipts from other entities, are considered by the State to be available if collected within 60 days of the end of the fiscal year. Investment earnings are recorded as earned since they are measurable and available.
Expenditures are recognized when the related fund liability is incurred. An exception to the general modified accrual expenditure recognition criteria is the principal and interest on general long-term debt which is recognized when due. Income tax refunds are accrued for claims related to tax periods ended by June 30th, of the fiscal year, and paid within 60 days.
Proprietary and fiduciary fund statements are reported using the economic resources measurement focus (except
for agency funds which have no measurement focus) and the accrual basis of accounting. Revenues are recorded when earned and expenses are recorded when a liability is incurred, regardless of the timing of cash flows.
Amounts reported as program revenues include 1) charges to customers or applicants for goods, services or privileges provided, 2) operating grants and contributions and 3) capital grants and contributions. General revenues include all taxes and investment income.
Proprietary funds distinguish operating revenues and expenses from nonoperating items. Operating revenues and expenses generally result from providing services and producing and delivering goods in connection with a proprietary fund’s principal ongoing operations. Operating expenses for enterprise funds and internal service
funds include the cost of sales and services, administrative expenses and depreciation on capital assets. All revenues and expenses not meeting this definition are reported as nonoperating revenues and expenses.
65

STATE OF IOWA
NOTES TO THE FINANCIAL STATEMENTS
In fiscal year 2015, the State of Iowa implemented the following GASB standards:
GASB Statement No. 68, Accounting and Financial Reporting for Pensions an amendment of GASB
Statement No. 27. This Statement establishes new accounting and financial reporting requirements for state and local governments which provide their employees with pension benefits through pension plans administered through specific trusts or equivalent arrangements. This Statement requires the governmental employer to recognize a net pension liability, deferred outflows of resources, deferred inflows of resources and pension related expenses/expenditures.
GASB Statement No. 71, Pension Transition for Contributions Made Subsequent to the Measurement Date
an amendment of GASB Statement No. 68. At transition, GASB 68, Accounting and Financial Reporting for Pensions an amendment of GASB Statement No. 27, did not allow for beginning balances for deferred outflows of resources or deferred inflows of resources to be reported unless all balances were reported. GASB 71 modified this Statement to require that, at transition, governments recognize a beginning deferred outflow of resources for employer contributions made subsequent to the measurement date of the beginning net pension liability.
F. Cash, Investments and Securities Lending
Cash in most funds is held in the State treasury and is commingled in State bank accounts and investments. The moneys of most funds are pooled together and invested as an investment pool by the Treasurer of State (Treasurer). However, moneys of some funds may be invested separately from the investment pool where permitted by statute.
Investment earnings of the investment pool are allocated to the individual funds as provided by statute. Income
of $7,276,839 associated with certain funds has been assigned to other funds for fiscal year 2015.
The Treasurer’s deposits in financial institutions throughout the year and at year-end were entirely covered by the Federal Deposit Insurance Corporation, collateral held by the Treasurer’s custodial banks in the Treasurer’s name or by the bank assessment provisions of Section 12C.23 of the Code of Iowa.
The Treasurer may invest in obligations of the United States government, its agencies and instrumentalities; certificates of deposit in Iowa financial institutions; prime bankers’ acceptances, commercial paper or other short-term corporate debt; repurchase agreements; investments authorized for Iowa Public Employees’ Retirement System in section 97B.7A; money market mutual funds organized in trust form; obligations of the Iowa Finance Authority issued pursuant to Chapter 16 of the Code of Iowa and other investments as permitted by Section 12B.10 of the Code of Iowa.
Investments are valued at fair value in accordance with GASB Statement No. 31, Accounting and Financial Reporting for Certain Investments and for External Investment Pools. Fair value is calculated at market price at the close of business on June 30 by independent pricing services utilized by the Treasurer’s custodian bank. However, certain cash equivalent investments, such as commercial paper, bankers’ acceptances, certificates of deposit, guaranteed investment contracts and discount notes issued by government agencies, are valued using purchase price. IPERS has derivatives that are reported on the Statement of Fiduciary Net Position at fair value. (See NOTE 15 – PENSION PLANS.)
Certain State institutions participate in the Iowa Public Agency Investment Trust (IPAIT), a state and local government pooled investment account, created by Code of Iowa Chapter 28E. IPAIT is managed by Investors Management Group and is registered with the Securities and Exchange Commission. IPAIT follows established money market mutual fund parameters designed to maintain a $1 per unit net asset value.
Cash and cash equivalents include currency on hand, demand deposits with banks or other financial institutions,
investments readily convertible to known amounts of cash and investments so near their maturity they present
insignificant risk of changes in value because of changes in interest rates. In the Statements of Cash Flows, investments with an original maturity of three months or less are considered cash equivalents.
IPERS, PORS and JRS (together the “Systems”) participate in a securities lending program with Deutsche Bank as the lending agent and the Bank of New York Mellon as the custodian bank for IPERS and with Deutsche Bank as both lending agent and custodian bank for PORS and JRS. The participation of IPERS is authorized by the Code of Iowa and the participation of PORS and JRS is authorized by their Boards of Trustees. The lending agent is responsible for operating the program and is permitted to lend any of the securities it holds in custody for the Systems to broker-dealers and other entities in exchange for collateral. The lending agent is permitted to accept collateral in the form of cash in U.S. dollars, U.S. government securities or irrevocable letters of credit. The types of securities on loan included equity investments and fixed income securities.
66

STATE OF IOWA
NOTES TO THE FINANCIAL STATEMENTS
A borrower is required to initially deliver collateral in an amount equal to 102% of the fair value of any U.S. securities lent and 105% of the fair value of any non-U.S. securities lent. Borrowers are required to provide additional collateral any time the value of the collateral drops below 100% of the value of the security lent plus accrued interest income. Securities received as collateral cannot be sold or pledged unless the borrower defaults.
At year-end, the Systems had no credit risk exposure to borrowers because the amounts the borrowers owed the Systems did not exceed the amount the Systems owed the borrowers. The contracts with the lending agent require it to indemnify the Systems if a borrower fails to return the securities or fails to return all of the income attributable to securities on loan. The securities lending contracts do not allow the Systems to pledge or sell collateral securities received unless the borrower defaults. As of June 30, 2015, the Systems had securities on loan, including accrued interest income, with a total value of $559.2 million against collateral with a total value of $572.4 million.
The majority of securities loans are open loans, i.e. one day maturity, where the rebate rate due the borrower is renegotiated daily. All securities loans can be terminated on demand by either the Systems or the borrower. Cash collateral received from borrowers is invested in a cash collateral investment pool which is managed by the
lending agent in accordance with investment guidelines established by the Systems. The investment guidelines
do not require a matching of investment maturities with loan maturities, but do establish minimum levels of liquidity and other investment restrictions designed to minimize the interest rate risk associated with not matching the maturity of the investments with the loans. (See NOTE 2.)
The effective duration of the cash collateral pool at June 30, 2015, for IPERS was 0.0. Credit quality and years to maturity statistics for the cash collateral pool at June 30, 2015, for IPERS is as follows (expressed in thousands):
Credit Risk Investment
S&P Quality Maturity
Investment Type Fair Value Rating (Years)
Overnight repurchase agreements 554,543$ Not rated Less than 1
Securities Lending Collateral Pool
G. Accounts Receivable
Accounts receivable have been established and offset with proper provisions for estimated uncollectible accounts where applicable. Practically all receivables of governmental funds are due from other governmental entities, primarily the federal government, and are considered collectible. Receivables in other funds have arisen in the ordinary course of business.
Taxes receivable represent amounts due to the State at June 30, which will be collected sometime in the future. In the government-wide financial statements, a corresponding amount is recorded as revenue. In the governmental fund financial statements, the portion considered “available” is recorded as revenue; the remainder is recorded as deferred inflows of resources – deferred revenue.
H. Inventories
Inventories are valued at cost, which approximates market. The first-in/first-out (FIFO) cost flow method is used for the majority of inventories. Throughout the year, costs of inventories are recorded as expenditures when purchased. For financial reporting purposes, expenditures are adjusted at fiscal year-end for material inventory amounts to correlate with the consumption method. Inventory asset amounts are not available for budgetary
appropriation as they have been charged to expenditures when purchased rather than when used.
I. Prepaid Items
Payments made to vendors for services that will benefit periods beyond June 30 are recorded as prepaid items in
both government-wide and fund financial statements. In governmental funds, prepaid items are accounted for using the consumption method and a portion of fund balance equal to the prepaid items has been classified as nonspendable to indicate it is not available for appropriation.
J. Capital Assets
Capital assets are reported in the government-wide financial statements and proprietary fund statements at historical cost. Donated capital assets are reported at their estimated fair market value at the time of acquisition.
67

STATE OF IOWA
NOTES TO THE FINANCIAL STATEMENTS
Capital assets utilized in governmental funds are reported as expenditures when purchased in the governmental fund financial statements. Interest incurred during the construction phase of capital assets of enterprise funds is generally included as part of the capitalized value of the assets constructed. Infrastructure and intangible assets, as defined by the State’s policy, acquired after June 30, 1980, are reported. Reportable capital assets are defined by the State as assets above the following thresholds:
Infrastructure $ 1,000,000
Intangible assets $ 500,000
Land, buildings and improvements $ 50,000
Equipment $ 5,000
Capital assets are depreciated over their useful lives using the straight-line depreciation method. The government-wide, proprietary fund and component unit financial statements report depreciation expense. The following useful lives are used:
Infrastructure 10-50 years
Buildings 20-50 years
Improvements other than buildings 20-50 years
Intangible assets 5-20 years
Equipment 2-20 years
Vehicles 3-10 years
Each University sets its own capitalization threshold and useful life policies. See individual university financial reports.
K. Deferred Outflows of Resources
In addition to assets, the government-wide and fund financial statements will sometimes report a separate section of deferred outflows of resources. This separate financial statement element represents a consumption of net position or fund balance that applies to future period(s) and so will not be recognized as an outflow of resources (expense/expenditure) until then.
L. Compensated Absences
Employees’ compensated absences are accrued when earned. Accrued vacation is paid at 100% of the employee’s hourly rate upon retirement, death or termination. With certain exceptions, accrued sick leave is paid at 100% of the employee’s hourly rate to a maximum of $2,000 upon retirement. Employees may elect to use a portion of accrued sick leave balances to pay the state share of group health insurance premiums upon retirement. The liability for accrued compensated absences as reported in the government-wide and proprietary fund financial statements is based on the current rates of pay.
M. Long-term Liabilities
In the government-wide and proprietary fund financial statements, long-term debt and long-term liabilities are reported as liabilities. Bonds payable are reported net of the applicable bond premium or discount. Bond discounts for proprietary fund types are generally amortized over the terms of the bonds using the bonds-outstanding method or straight-line method, which approximates the effective interest method.
Long-term liabilities due within one year of the date of the statements are classified as current liabilities.
In governmental fund types, bond discounts are recognized in the current period.
N. Deferred Inflows of Resources
In addition to liabilities, the government-wide and fund financial statements will sometimes report a separate section for deferred inflows of resources. This separate financial statement element represents an acquisition of
net position or fund balance that applies to future period(s) and so will not be recognized as an inflow of resources (revenue) until that time.
68

STATE OF IOWA
NOTES TO THE FINANCIAL STATEMENTS
O. Interfund Activity and Balances
Interfund Activity
As a general rule, the effect of interfund activity has been eliminated from the government-wide statements. Exceptions to this rule are: 1) activities between funds reported as governmental activities and funds reported as business-type activities and 2) activities between funds reported in different functional categories in either the governmental or business-type activities column. Elimination of these activities would distort the direct costs and program revenues for the functions concerned.
Interfund Balances
Interfund receivables and payables have been eliminated from the Statement of Net Position, except for the residual amounts due between governmental and business-type activities.
P. Encumbrances
The State utilizes encumbrance accounting for budgetary control purposes. Obligations incurred for goods or
services not received or rendered are recorded to reserve that portion of the applicable fund balance. Section 8.33, unnumbered paragraph 2, of the Code of Iowa, states, “No payment of an obligation for goods or services shall be charged to an appropriation subsequent to the last day of the fiscal year for which the appropriation is
made unless the goods or services are received on or before the last day of the fiscal year, except that repair projects, purchase of specialized equipment and furnishings, and other contracts for services and capital expenditures for the purchase of land or the erection of buildings or new construction or remodeling, which were committed and in progress prior to the end of the fiscal year are excluded from this provision.” That is, except for the above stated exceptions, the State must have received the goods or services on or before June 30, creating an actual liability, or the encumbrance is cancelled against that fiscal year. If the encumbrances are still valid after June 30, they become expenditures/expenses of the next fiscal year.
Q. Stabilization Arrangements (Reserve Funds)
The State maintains two funds for emergency expenditures: the Iowa Economic Emergency Fund and the Cash Reserve Fund. The Iowa Economic Emergency Fund and the Cash Reserve Fund were created in Iowa Code Sections 8.55 and 8.56.
The maximum balance of the Iowa Economic Emergency Fund is the amount equal to 2.5 percent of the adjusted revenue estimate for the fiscal year. The moneys in this fund may only be appropriated by the General Assembly for emergency expenditures and only in the fiscal year for which the appropriation is made.
The maximum balance of the Cash Reserve Fund is equal to 7.5 percent of the adjusted revenue estimate for the General Fund of the State for the current fiscal year. Moneys in this fund may be used for cash flow purposes provided that any moneys so allocated are returned to the fund by the end of each fiscal year. The moneys in this fund may only be appropriated by the General Assembly for payment of nonrecurring emergency expenditures and shall not be appropriated for payment of any collective bargaining agreement or arbitrator’s decision negotiated or awarded. An appropriation shall not be made from this fund if the appropriation would cause the fund’s balance to be less than 3.75 percent of the adjusted revenue estimate for the year for which the appropriation is made unless the bill or joint resolution is approved by vote of at least three-fifths of the members of both chambers of the General Assembly and is signed by the Governor. Also, the appropriation must be contained in a bill or joint resolution in which the appropriation is the only subject matter of the bill or joint resolution, and the bill or joint resolution states the reasons the appropriation is necessary.
The fund balances for the Iowa Economic Emergency Fund and the Cash Reserve Fund are included in the committed spendable fund balance classification.
R. Minimum Fund Balance Requirements
Currently, the State has six governmental funds which are required by statute, federal regulations or bonding requirements to maintain minimum fund balances. However, the State does not have a formally adopted policy regarding minimum fund balances.
S. Budgeting and Budgetary Control
There are no material violations of finance-related legal and contractual provisions. Budgetary comparison schedules and related disclosures are reported as Required Supplementary Information (RSI).
69

STATE OF IOWA
NOTES TO THE FINANCIAL STATEMENTS
NOTE 2 – CASH, INVESTMENTS AND SECURITIES LENDING
A. Primary Government and Fiduciary Funds
Investments of the primary government and fiduciary funds at June 30, 2015, are scheduled as follows (expressed in thousands):
Primary Government Fiduciary Funds
Investment Type Fair Value Investment Type Fair Value
Fixed: Fixed:
U.S. government treasuries, U.S. government treasuries,
notes & bonds 246,145$ notes & bonds 2,265,841$
U.S. government agency 424,089 U.S. government agency 420,050
Government asset & Government asset &
mortgage-backed 1,818,495 mortgage-backed 1,544,116
Corporate bonds 120,062 Corporate bonds 2,587,144
Corporate asset backed 17,590 Corporate asset backed 187,776
Private placements 19,854 Private placements 1,470,014
Fixed income mutual funds 1,346,546 Commingled bond funds 2,076,570
Other fixed income 251,516 Other fixed income 47,079
Commercial paper 4,000 Total fixed 10,598,590
Total fixed 4,248,297
Equity: Equity:
U.S. equity 223,803 U.S. equity 6,286,303
Private equity 37,101 Private equity 3,231,676
Real estate 169 Real estate 1,693,712
Non U.S. equity 238,878 Commingled & mutual funds 11,422,783
Money market funds 339,820 Other 170,622
Pooled & mutual funds 125,610 Total equity 22,805,096
Repurchase agreements 45,108
Investment pools 1,687 Total invested assets 33,403,686$
Other 518,135
Total equity 1,530,311
Total invested assets 5,778,608$
Credit Risk
Credit risk is the risk an issuer or other counterparty to an investment will not fulfill its obligations to the State.
The Treasurer’s investment policy requires that domestic commercial paper maturing within 270 days from the date of purchase have the highest rating of both Standard & Poor’s and Moody’s on the date of purchase. Investments in short-term corporate debt, other than commercial paper maturing within 270 days from the date of purchase, are limited to one of the two highest ratings of either Standard & Poor’s or Moody’s on the date of purchase, provided at the time of purchase no more than 5% of amounts invested in short-term corporate debt or
commercial paper are rated in the second highest rating. Investments in obligations or guaranteed investment
contracts of domestic corporations with maturities greater than 270 days from the date of purchase are limited to long-term ratings of not less than A2 by Moody’s and not less than A by Standard & Poor’s. Investments in asset-backed securities are limited to those rated AAA by Standard & Poor’s or Aaa by Moody’s.
The State Board of Regents establishes policy and sets objectives for the Universities’ investments. Credit quality limitations for investments of operating funds are: the weighted average credit quality of each University’s operating portfolio shall be AA or Aa as rated by Standard & Poor’s or Moody’s, respectively; up to 20% of each University’s operating portfolio may be invested in bonds rated A and BBB in order to enhance portfolio yield; commercial paper or other short-term corporate debt maturing within 270 days rated within the two highest classifications, as established by at least one of the standard rating services, provided that at the time of purchase no more than 5% of all amounts invested in commercial paper and other short-term corporate debt shall be
70

STATE OF IOWA
NOTES TO THE FINANCIAL STATEMENTS
invested in paper and debt rated in the second highest classification; obligations of the Iowa Finance Authority (Authority) provided at the time of purchase the Authority has an issuer credit rating within the two highest classifications or the obligations to be purchased are rated within the two highest classifications, as established by at least one of the standard rating services; corporate debt with a maturity of greater than 270 days that is rated investment grade by Standard & Poor’s or Moody’s (at least BBB- or Baa3, respectively), or by another Nationally Recognized Statistical Rating Organization (NRSRO), including Rule 144A Securities deemed to be of investment grade credit quality by the external or internal investment manager, at the time of purchase.
Credit quality limitations for the Universities’ endowment funds are: the weighted average credit quality of each University’s endowment fixed income portfolio shall be AA or Aa as rated by Standard & Poor’s or Moody’s, respectively; up to 20% of each University’s operating portfolio may be invested in bonds rated A and BBB in order to enhance portfolio yield.
There are no policy limitations for credit risk exposures within the investment portfolios of the Systems (IPERS, PORS and JRS). Each IPERS portfolio is managed in accordance with an investment contract that is specific as to permissible quality ranges and the average credit quality of the overall portfolios. Policies related to credit risk
pertaining to IPERS’, PORS’ and JRS’ securities lending program is found under the securities lending disclosures
found in NOTE 1 F of these notes.
Investments in debt securities of the U.S. Government or obligations of U.S. Government agencies that are explicitly guaranteed by the U.S. Government are disclosed in the TSY and AGY columns of the credit risk schedules.
The State’s exposure to credit risk for the fixed income investments of the primary government and fiduciary funds at June 30, 2015, is summarized by credit quality ratings, as follows (expressed in thousands):
Investment Type TSY AAA AA A BBB
U.S. government treasuries, notes
& bonds 246,145$ -$ -$ -$ -$
U.S. government agency - 187,094 236,995 - -
Government asset & mortgage-backed - 49 1,807,855 - -
Corporate bonds - 6,752 23,372 67,249 7,487
Corporate asset backed - 13,627 4 - 1
Private placements - 6,100 12,510 10 16
Fixed income mutual funds 56,360 22,031 203,393 70,237 116,138
Other fixed income - 4,445 9 3,009 -
Total 302,505$ 240,098$ 2,284,138$ 140,505$ 123,642$
(continued)
Investment Type BB B CCC & Below A1+P1 NR
Government asset & mortgage-backed -$ -$ -$ -$ 10,591$
Corporate bonds 203 - - - 14,999
Corporate asset backed - - - - 3,958
Private placements - - - - 1,218
Fixed income mutual funds 76,809 197,622 4,851 - 599,105
Other fixed income - - - - 244,053
Commercial paper - - - 4,000 -
Total 77,012$ 197,622$ 4,851$ 4,000$ 873,924$
Credit Risk - S & P Quality Ratings
Primary Government
(continued)
Primary Government
Credit Risk - S & P Quality Ratings
71

STATE OF IOWA
NOTES TO THE FINANCIAL STATEMENTS
Investment Type TSY AGY AAA AA A
U.S. government treasuries, notes
& bonds 2,265,841$ -$ -$ -$ -$
U.S. government agency - - 2,282 61,021 62,874
Government asset & mortgage-backed - 169,410 42,858 862,249 27,497
Corporate bonds - - 31,412 155,097 584,575
Corporate asset backed - - 56,329 59,990 14,164
Private placements - - 89,242 88,719 203,047
Commingled bond funds 1,177,813 45,119 608,833 36,943 98,287
Other fixed income - - 3,522 9,865 32,353
Total 3,443,654$ 214,529$ 834,478$ 1,273,884$ 1,022,797$
(continued)
Investment Type BBB BB B Below B NR
U.S. government agency 110,254$ 46,063$ 6,277$ 16,383$ 114,896$
Government asset & mortgage-backed 19,850 1,368 7,549 11,075 402,260
Corporate bonds 809,950 574,120 346,354 37,732 47,904
Corporate asset backed 1,042 6,478 10,407 3,249 36,117
Private placements 253,093 300,427 265,208 45,809 224,469
Commingled bond funds 109,122 - - - 453
Other fixed income 59 1,109 149 - 22
Total 1,303,370$ 929,565$ 635,944$ 114,248$ 826,121$
Fiduciary Funds
Credit Risk - S & P Quality Ratings
Fiduciary Funds
(continued)
Credit Risk - S & P Quality Ratings
Interest Rate Risk
Interest rate risk is the risk changes in interest rates will adversely affect the fair value of an investment.
The Treasurer manages interest rate risk by utilizing a buy-and-hold strategy, maturity limitations and diversification parameters and liquidity requirements set by the Investment Committee.
Maturity Limitations: No investment shall be made in a U.S. Treasury note or bond, a U.S. government agency note or bond or a U.S. government instrumentality note or bond with a maturity that exceeds 61 months at the
time of purchase. (The 61-month maturity limitation does not apply to such securities if accepted as collateral under a repurchase agreement.) No investment shall be made in an asset-backed security that has an expected average life greater than two years at the time of purchase, and a final maturity greater than three years at the time of purchase. The maturities of commercial paper and bankers’ acceptances shall not exceed 270 days at the time of purchase. The maturities of all other investments shall not exceed 25 months at the time of purchase.
Maturity Diversification: The Investment Committee shall set permitted maximum dollar amounts that can be
invested in specific maturity sectors that are consistent with the overall portfolio strategy and this investment policy.
Liquidity Reserve: The Investment Committee shall specify how much liquidity shall be reserved to ensure adequate cash is available to meet any unexpected expenditures that may occur. The liquidity reserve should be
72

STATE OF IOWA
NOTES TO THE FINANCIAL STATEMENTS
continuously invested in money market mutual funds or money market accounts with Iowa financial institutions or short-term money market accounts.
The Universities’ policies for the operating portfolio prohibit investment in securities that at the time of purchase have effective maturities exceeding 63 months and that the maximum duration of each portfolio shall not exceed the duration of the Merrill 1-3 Government/Corporate Index by more than 20%. There is no explicit limit on the average maturity of fixed income securities in the endowment portfolio.
IPERS manages interest rate risk within the portfolio using the effective duration or option-adjusted methodology. It is widely used in the management of fixed income portfolios in that it quantifies to a much greater degree the risk of interest rate changes. The methodology takes into account optionality on bonds and scales the risk of price changes on bonds depending upon the degree of change in rates and the slope of the yield curve. All of IPERS’ fixed income portfolios are managed in accordance with investment contracts that require the effective duration of the portfolio shall always remain between 80% and 120% of the effective duration measure of the Index.
The State’s exposure to interest rate risk for the fixed income investments of the primary government and the
fiduciary funds at June 30, 2015, is summarized using the effective duration method, as follows (expressed in
thousands):
Primary Government Fiduciary Funds
Effective Effective
Duration Duration
Investment Type Fair Value (Years) Investment Type Fair Value (Years)
U.S. government treasuries, U.S. government treasuries,
notes & bonds 246,145$ 1.79 notes & bonds 2,265,841$ 6.42
U.S. government agency 424,089 1.60 U.S. government agency 420,050 6.30
Government asset & Government asset &
mortgage-backed 1,818,495 0.26 mortgage-backed 1,544,116 2.64
Corporate bonds 120,062 0.63 Corporate bonds 2,587,144 5.58
Corporate asset backed 17,590 0.60 Corporate asset backed 187,776 0.66
Private placements 19,854 0.19 Private placements 1,470,014 4.55
Fixed income mutual funds 1,346,546 2.45 Commingled bond funds 2,076,570 6.34
Other fixed income 251,516 0.17 Other fixed income 47,079 5.41
Commercial paper 4,000 0.04
Total 4,248,297$ 1.18 Total 10,598,590$ 5.28
Foreign Currency Risk
Foreign currency risk is the risk changes in exchange rates will adversely impact the fair value of an investment. IPERS allows its investment managers the discretion to hedge their foreign currency exposures. PORS’ external
managers may or may not hedge the portfolios’ foreign currency exposures with forward foreign exchange contracts, currency options, currency futures or options on currency futures depending upon their views on a specific foreign currency relative to the U.S. dollar. IPERS generally does not allow its investment managers to enter into currency positions greater than 100 percent or less than 0 percent of the underlying asset exposure in their respective portfolios. The only exceptions are (1) as it relates to specific cross-hedging activity, which may be permitted in certain investment manager contracts, and (2) in global macro investment strategies where the manager is permitted to tactically allocate across several asset classes and strategies, including currency. IPERS’
net foreign currency exposure of the global macro managers was less than 1% of IPERS’ total foreign currency exposure on June 30, 2015.
73

STATE OF IOWA
NOTES TO THE FINANCIAL STATEMENTS
Foreign currency risk by investment type for the pension system fiduciary funds, at June 30, 2015, follows (expressed in thousands):
Total Cash Derivatives Equity Fixed Income
Australian dollar 240,430$ 40,185$ (504)$ 159,599$ 41,150$
Brazilian real 31,372 (3,068) - 25,037 9,403
British pound 215,356 (59,478) 1,577 254,711 18,546
Canadian dollar (20,724) (20,623) (101) - -
Chilean peso 3,432 - - 3,190 242
Chinese yuan renminbi 6,170 6,170 - - -
Columbian peso 35 - - - 35
Czech koruna 4,388 - - 4,388 -
Danish krone 32,008 131 - 31,877 -
Euro 749,798 (44,622) (1,492) 734,189 61,723
Hong Kong dollar 229,008 2,769 (426) 226,405 260
Hungarian forint 1,033 - - 1,033 -
Indian rupee 50,983 143 - 49,985 855
Indonesian rupiah 9,399 49 - 9,350 -
Japanese yen 602,713 49,046 (784) 555,249 (798)
Mexican peso 55,798 152 - 15,489 40,157
New Zealand dollar 34,806 33,862 - 944 -
Norwegian krone 30,064 2,415 - 27,649 -
Philippine peso 7,382 - - 7,382 -
Polish zloty 2,975 2 - 2,973 -
Singaporean dollar 26,818 399 - 26,419 -
South African rand 41,666 163 - 41,503 -
South Korean won 64,841 1 - 64,840 -
Swedish krona 6,116 (8,788) - 14,904 -
Swiss franc 30,657 (37,920) - 68,577 -
Taiwanese dollar 43,576 377 - 43,199 -
Thai baht 10,865 - - 10,865 -
Turkish lira 11,027 - - 11,027 -
United Arab Emirates dirham 6,005 - - 6,005 -
Total 2,527,997$ (38,635)$ (1,730)$ 2,396,789$ 171,573$
Concentration of Credit Risk
Concentration of credit risk is the risk of loss that may be attributed to the magnitude of a government’s investment in a single issue. Policies of the Treasurer, Universities and Systems limit investment in any single issuer or corporate entity to no more than 5% of the market value of the portfolio or account. The policy does not apply to investments in U.S. treasuries, government agencies or instrumentalities.
Custodial Credit Risk
Deposits: Custodial credit risk for deposits is the risk the State’s deposits may not be returned to it in the event of a bank failure. Protection from custodial credit risk exists for the State’s deposits in excess of FDIC insurance coverage. Banks in Iowa which accept public funds deposits are required to pledge collateral in an amount equal
to, or in excess of, the total amount by which the public funds deposits in the bank exceed the total capital of the bank. If a bank fails, the Treasurer would liquidate any collateral the bank had pledged and use the proceeds to repay public units. If the proceeds from the sale of the collateral were not sufficient to reimburse the public units, the Treasurer would use money from the sinking fund to make the public units whole. If there is not enough money in the sinking fund to cover the uninsured public deposits, the Treasurer would assess a proportional
share of the loss against all remaining banks whose public funds deposits exceeded FDIC insurance to satisfy the remaining loss. The Universities and the Systems have no formal policy for custodial credit risk. The $973.1 million total combined bank deposits of the primary government and fiduciary funds at June 30, 2015, was exposed to custodial credit risk for $226.0 million of uninsured and uncollateralized bank deposits, of which $221.7 million was invested in money market funds as cash equivalents.
74

STATE OF IOWA
NOTES TO THE FINANCIAL STATEMENTS
Investments: Custodial credit risk for investments is the risk the State will not be able to recover the value of its investment or collateral securities in the possession of an outside party in the event of a failure of the counterparty. The Treasurer’s investment policy requires that all pooled investments be held by a third party custodian while the Universities and Systems have no formal policy for investment custodial credit risk. Of the $39,182.3 million total combined investments of the primary government and fiduciary funds at June 30, 2015, $1.9 million was exposed to custodial credit risk as uninsured and unregistered, with the securities held by the counterparty or by its trust department or agent but not in the State’s name.
The State’s Unemployment Benefits Fund had $920.6 million on deposit with the U.S. Treasury. This amount is presented as cash and investments but is not included in the carrying amounts of deposits nor is it categorized according to risk because it is neither a deposit with a financial institution nor an investment.
Deposits with Trustees
Deposits with trustees totaled $212.4 million at June 30, 2015. $15.1 million was invested in fixed U.S. government treasury securities with an effective duration of 4.22 years, $8.3 million was invested in fixed U.S.
government agency securities with an effective duration of 1.48 years and a credit quality rating of AAA, $182.5
million was invested in equity securities not subject to credit quality ratings and the remaining $6.5 million were cash and cash equivalents.
B. Component Units
Investments of the component units at June 30, 2015, are scheduled as follows (expressed in thousands):
Investment Type Fair Value
Fixed:
U.S. government treasuries, notes & bonds 26,840$
U.S. government agency 113,874
Government asset & mortgage-backed 400,887
Corporate bonds 9,797
Total fixed 551,398
Equity:
Pooled & mutual funds 50,276
Total invested assets 601,674$
Cash and investments of $2,164.7 million for the University related component units are not subject to GASB disclosure requirements.
Credit Risk
Credit risk is the risk an issuer or other counterparty to an investment will not fulfill its obligations to the component units. The component units have no formal policy to manage credit risk. Investments in debt securities of the U.S. Government or obligations of U.S. Government agencies that are explicitly guaranteed by the U.S. Government are disclosed in the TSY and AGY columns of the credit risk schedules.
The exposure to credit risk for the component units fixed income investments at June 30, 2015, is summarized by credit quality ratings, as follows (expressed in thousands):
Investment Type TSY AGY AA A
U.S. government treasuries, notes & bonds 26,840$ -$ -$ -$
U.S. government agency - 112,092 1,782 -
Government asset & mortgage-backed - 260,645 140,242 -
Corporate bonds - - - 9,797
Total 26,840$ 372,737$ 142,024$ 9,797$
Credit Risk - S & P Quality Ratings
75

STATE OF IOWA
NOTES TO THE FINANCIAL STATEMENTS
Interest Rate Risk
Interest rate risk is the risk changes in interest rates will adversely affect the fair value of an investment. The component units do not have formal policies that limit investment maturities as a means of managing exposure to credit risk.
The component units’ exposure to interest rate risk for the fixed income investments at June 30, 2015, is summarized using the weighted average maturity method, as follows (expressed in thousands):
Weighted Average
Investment Type Fair Value Maturity (Years)
U.S. government treasuries, notes & bonds 26,840$ 3.67
U.S. government agency 113,874 2.48
Government asset & mortgage-backed 400,887 22.46
Corporate bonds 9,797 2.31
Total 551,398$ 17.06
C. University Endowments
For donor restricted endowments, Chapter 540A of the Code of Iowa permits Universities to spend endowment income and to appropriate, within certain limitations, an amount of realized and unrealized endowment appreciation as the Universities determine to be prudent considering their long-term and short-term needs, their present and anticipated financial requirements, expected total return on investments, price level trends and general economic conditions.
The Universities’ policies are to retain the realized and unrealized appreciation with the endowment pursuant to the spending rules of the Universities. Spending rules for the Universities are as follows:
The University of Iowa’s spending rule adjusts dollar payouts by the trailing calendar year Consumer
Price Index (inflation rate). Total payout is banded at no less than 4% and no greater than 6% of calendar year-end market values.
Iowa State University’s spending rule is 5.5%, including a 1.25% administrative fee, of the three-year
moving market average.
The University of Northern Iowa’s spending rule is 5.0% of the three-year moving average of the fair value
of the fund.
Net appreciation of endowment funds available to meet spending rate distributions are as follows (expressed in thousands):
Amount Net Position Classification
University of Iowa 12,805$ Restricted nonexpendable net position
Iowa State University 6,573 Restricted expendable net position
University of Northern Iowa 672 Restricted expendable net position
D. Derivatives
Fiduciary Funds
GASB Statement No. 53, Accounting and Financial Reporting for Derivative Instruments, requires the fair value of
financial arrangements called “derivatives” or “derivative instruments” be reported in the financial statements of state and local governments. The statement further requires that derivatives be categorized as either a hedging derivative or an investment derivative. All of IPERS’ derivative exposures at June 30, 2015, are categorized as investment derivatives and, therefore, the hedge accounting provisions of GASB Statement No. 53 are not applicable.
Some of the IPERS’ external investment managers may be permitted through their individual investment contracts to use derivative instruments, subject to the IPERS’ derivative policy. Derivatives are contracts or securities whose returns are derived from the returns of other securities, indexes, or derivatives. While this definition includes the most common type of derivative, collateralized mortgage obligations (which typically make up a portion of IPERS’ fixed income portfolio), it is also intended to include (but not be limited to) futures, forwards, options, options on futures, swaps, and swaptions. IPERS’ managers are not permitted to utilize derivatives for
76

STATE OF IOWA
NOTES TO THE FINANCIAL STATEMENTS
speculative purposes, but may use them to efficiently access desired markets and to control and manage portfolio risk. Examples of appropriate applications of derivative strategies include hedging interest rate and currency risk, maintaining exposure to a desired asset class while effecting asset allocation changes, managing duration risk, augmenting index fund performance through index arbitrage, and portable alpha strategies.
The various derivatives utilized by IPERS’ investment managers are described below. Although the notional values associated with these derivative instruments are not recorded in the financial statements, the fair value amounts of exposure (unrealized gains/losses) are reported in the Statement of Net Position. IPERS holds investments in limited partnerships and commingled investment funds, which may utilize derivatives from time to time for hedging purposes, and any derivative held by these types of investment vehicles, are not included in the information describing IPERS’ derivatives. IPERS could be exposed to risk if the counterparties to derivatives contracts are unable to meet the terms of the contracts. IPERS’ investment managers seek to control this risk through counterparty credit evaluations and approvals, counterparty credit limits, exposure monitoring procedures, and in some cases the collateralization of gains or losses. IPERS anticipates that the counterparties will be able to satisfy their obligations under the contracts. Limited partnerships and commingled investment vehicles in which IPERS invests may also have exposure to counterparty risk from the use of derivatives for
hedging purposes.
Futures and Options Contracts: IPERS had investments in various futures and options during the year. These contracts are reported at their fair value in the Statement of Net Position.
Futures and options can potentially offer lower-cost and more efficient alternatives to buying the underlying securities or currency. Futures and options can also serve to minimize certain unwanted risks within the portfolio. The market, currency, and credit risk of the futures were the same as if IPERS had owned the underlying securities or currency.
Schedules of futures and options contracts outstanding at June 30, 2015, follow (expressed in thousands):
Notional
Expiration Date Long/Short Value Fair Value
Amsterdam Index July 2015 Long 22,301$ (375)$
CAC 40 Euro Index July 2015 Long 7,840 (9)
Hang Seng Index July 2015 Long 10,140 (427)
IBEX 35 Index July 2015 Long 1,201 11
10-year Australian bonds September 2015 Short (46,501) (317)
10-year Canadian bonds September 2015 Short (54,612) (147)
DAX Index September 2015 Long 57,306 288
Euro Bonds September 2015 Short (261,659) (1,100)
Euro BTP September 2015 Long 3,772 18
FTSE 100 Index September 2015 Short (76,905) 1,566
10-year Japanese bonds September 2015 Long 67,260 172
10-year Japanese minibonds September 2015 Short (1,321) (3)
E-mini (S&P 500) September 2015 Long 45,915 (898)
S&PMIB Index September 2015 Short (17,983) (324)
SPI 200 Index September 2015 Long 14,519 (186)
S&P/TSE 60 Index September 2015 Short (3,515) 47
E-mini (MSCI Emerging Market) September 2015 Long 1,439 (18)
TOPIX Index September 2015 Long 41,840 (953)
U.K. Long Gilts September 2015 Long 58,971 11
2-year U.S. Treasury notes September 2015 Short (626,161) (687)
5-year U.S. Treasury notes September 2015 Long 136,311 2
10-year U.S. Treasury notes September 2015 Long 167,430 (2,622)
U.S. Treasury bonds September 2015 Long 99,406 950
U.S. Ultra Bonds September 2015 Long 65,630 (954)
90-day Eurodollar September 2015 Short (569,165) (163)
90-day Eurodollar December 2015 Short (102,449) (113)
90-day Eurodollar March 2016 Short (431,372) (250)
90-day Eurodollar June 2016 Short (82,480) (83)
90-day Eurodollar September 2016 Short (18,534) (24)
90-day Eurodollar December 2016 Short (101,095) (87)
90-day Eurodollar March 2017 Short (25,842) (20)
Total (1,618,313)$ (6,695)$
Futures Exposure Summary
77

STATE OF IOWA
NOTES TO THE FINANCIAL STATEMENTS
Expiration Date Long/Short Type Strike Price Fair Value
90-day Eurodollar December 2015 Long Put 98.00$ 2$
90-day Eurodollar December 2015 Long Put 99.00 8
90-day Eurodollar December 2015 Short Put 98.50 (5)
U.S. Treasury bonds August 2015 Short Call 166.00 (36)
U.S. Treasury bonds August 2015 Long Call 154.00 532
U.S. Treasury bonds September 2015 Short Call 157.00 (556)
Total (55)$
Options Exposure Summary
Credit Default Swaps: IPERS had investments in credit default swaps during the year. The credit default swaps held by IPERS are derivative instruments used to hedge or to replicate investments in debt obligations of corporate bond issuers. The risk of the credit default swap is comparable to the credit risk of the reference
security. At June 30, 2015, the net notional value of the credit default swaps held in IPERS’ fixed income portfolio was $(14.7) million. The credit default swaps are reported at a fair value of $993,095 in the Statement of Net Position.
Interest Rate Swaps: Interest rate swaps are transactions between two parties in which interest payments from different indexes are swapped. Interest rate swaps are often used to alter the portfolios’ exposure to interest rate fluctuations by swapping fixed-rate obligations for floating-rate obligations or swapping floating-rate obligations for fixed-rate obligations. By utilizing interest rate swaps, IPERS’ investment managers are able to alter their interest rate exposure and bring it in line with their strategic objectives for interest rate risk. At June 30, 2015, the net notional value of the interest rate swaps held in IPERS’ fixed income portfolio was $(41.2) million. All interest rate swaps held by IPERS are reported at a fair value of $(1.3) million in the Statement of Net Position.
Total Return Swaps: A total return swap is a contract in which two parties swap payments based on the total return of a reference asset. The reference asset may be any asset, index, or basket of assets. At June 30, 2015, the net notional value of the total return swaps held in IPERS’ fixed income portfolio was $(20.0) million. The total return swaps held by IPERS are reported at a fair value of $(236,830) in the Statement of Net Position.
Component Units
Iowa Finance Authority (Authority), a discretely presented component unit of the State, has derivative instruments to manage and reduce exposure to adverse fluctuations in interest rates and to lower the overall cost of financing. All derivative financial instruments are recorded at fair value. The derivatives consist of swap, cap and corridor
agreements entered into in connection with its issuance of variable rate mortgage revenue bonds. These derivative financial instruments are considered hedging derivative instruments and recorded as other assets or other liabilities on the Statement of Net Position.
The Authority’s additional derivative financial instruments are commitments to purchase mortgage-backed pass-through certificates (securitized mortgage loans) backed by pools of single family mortgage loans originated pursuant to the Authority’s FirstHome program. In addition, derivative financial instruments consist of forward sales of mortgage backed securities with the To-Be-Announced market are utilized to hedge changes in fair value of mortgage loan inventory and commitments to purchase. These contracts are considered investment derivative instruments and recorded in other assets on the Statement of Net Position.
The Authority reports hedging derivative instruments’ accumulated change in fair value as either deferred inflows or outflows, and investment derivative instruments’ accumulated changes in fair value as other income (loss) in
the Statement of Revenues, Expenses and Changes in Net Position.
78

STATE OF IOWA
NOTES TO THE FINANCIAL STATEMENTS
Aggregate debt service requirements of the variable-rate debt and net receipts/payments on associated derivative instruments at June 30, 2015, follow (expressed in thousands):
Variable-rate Variable-rate
Year Ending Bonds Bonds Interest Rate
June 30, Principal Interest Swaps, Net Total
2016 1,655$ 141$ 4,465$ 6,261$
2017 2,355 138 3,879 6,372
2018 2,425 135 3,399 5,959
2019 2,600 132 3,103 5,835
2020 2,820 127 2,938 5,885
2021-2025 20,820 574 12,220 33,614
2026-2030 22,665 433 8,468 31,566
2031-2035 34,455 260 5,700 40,415
2036-2040 24,975 53 1,384 26,412
Total 114,770$ 1,993$ 45,556$ 162,319$
The amounts presented in the table above assume that current interest rates on variable-rate bonds and current reference rates of hedging derivative instruments will remain the same for their term. As these rates vary, interest payments on variable-rate bonds and net receipts/payments on hedging derivative instruments will vary.
Swap agreements allow the Authority to raise funds at variable rates and swap them into fixed rates that are lower than those available if fixed rate borrowings were made directly. These contracts involve the exchange of variable rate for fixed rate payments between parties, without the exchange of the underlying debt, based on a common notional amount and maturity date.
The terms of the swap hedging derivative instruments outstanding at June 30, 2015, follow (expressed in thousands):
2015
Bond Notional Effective Termination Counterparty
Series Amount Date Date Pay Receive Rating
SF 2004 B $ - 12/2/2004 7/1/2034 4.028% Enhanced LIBOR A1
SF 2004 D - 2/3/2005 7/1/2020 4.007% SIFMA Swap Index + 0.10% Aa2
or various LIBOR + Spread
SF 2004 G 6,555 6/1/2005 7/1/2034 3.867% Enhanced LIBOR A1
SF 2005 C 1,650 11/1/2005 1/1/2036 4.140% SIFMA Swap Index + 0.10% Aa2
or various LIBOR + Spread
SF 2005 E 8,445 1/1/2011 1/1/2036 3.817% Enhanced LIBOR A1
SF 2005 H 4,080 1/1/2011 7/1/2036 3.843% SIFMA Swap Index + 0.10% Aa2
or various LIBOR + Spread
SF 2006 C 12,000 9/1/2006 1/1/2036 3.760% Enhanced LIBOR A1
SF 2006 F 2,275 11/1/2006 7/1/2036 4.632% SIFMA Swap Index + 0.10% Aa2
SF 2007 C 12,690 3/8/2007 7/1/2025 5.289% LIBOR A1
SF 2007 G 9,835 7/12/2007 1/1/2019 5.493% LIBOR Aa2
SF 2007 M 8,655 12/12/2007 7/1/2021 4.373% LIBOR Aa2
SF 2007 N 4,780 12/12/2007 1/1/2039 4.364% SIFMA Swap Index + 0.06% Aa2
MF 2008 A 3,550 4/17/2008 6/1/2024 3.971% SIFMA Swap Index + 0.08% A1
SF 2008 B 6,345 1/1/2011 1/1/2039 4.470% SIFMA Swap Index + 0.06% A1
SF 2008 C 9,905 4/16/2008 1/1/2026 3.880% LIBOR A1
SF 2008 F 17,330 10/1/2008 1/1/2039 4.529% SIFMA Swap Index + 0.08% A1
SF 2008 G 6,390 10/1/2008 7/1/2018 4.173% LIBOR A1
Term
Interest rate cap derivatives are instruments where payments are received at the end of each period based on a notional amount, when the interest rate exceeds the agreed upon strike rate. A corridor agreement is an interest
79
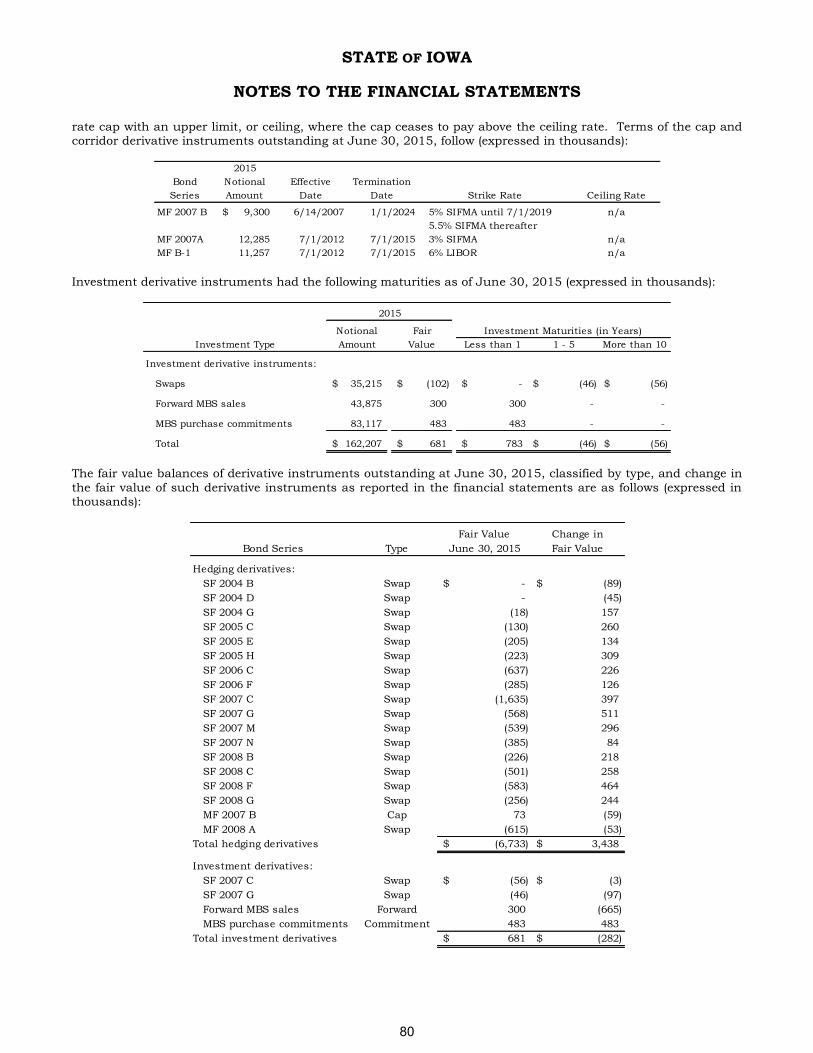
STATE OF IOWA
NOTES TO THE FINANCIAL STATEMENTS
rate cap with an upper limit, or ceiling, where the cap ceases to pay above the ceiling rate. Terms of the cap and corridor derivative instruments outstanding at June 30, 2015, follow (expressed in thousands):
2015
Bond Notional Effective Termination
Series Amount Date Date Strike Rate Ceiling Rate
MF 2007 B 9,300$ 6/14/2007 1/1/2024 5% SIFMA until 7/1/2019 n/a
5.5% SIFMA thereafter
MF 2007A 12,285 7/1/2012 7/1/2015 3% SIFMA n/a
MF B-1 11,257 7/1/2012 7/1/2015 6% LIBOR n/a
Investment derivative instruments had the following maturities as of June 30, 2015 (expressed in thousands):
Notional Fair
Investment Type Amount Value Less than 1 1 - 5 More than 10
Investment derivative instruments:
Swaps 35,215$ (102)$ -$ (46)$ (56)$
Forward MBS sales 43,875 300 300 - -
MBS purchase commitments 83,117 483 483 - -
Total 162,207$ 681$ 783$ (46)$ (56)$
2015
Investment Maturities (in Years)
The fair value balances of derivative instruments outstanding at June 30, 2015, classified by type, and change in
the fair value of such derivative instruments as reported in the financial statements are as follows (expressed in thousands):
Fair Value Change in
Bond Series Type June 30, 2015 Fair Value
Hedging derivatives:
SF 2004 B Swap -$ (89)$
SF 2004 D Swap - (45)
SF 2004 G Swap (18) 157
SF 2005 C Swap (130) 260
SF 2005 E Swap (205) 134
SF 2005 H Swap (223) 309
SF 2006 C Swap (637) 226
SF 2006 F Swap (285) 126
SF 2007 C Swap (1,635) 397
SF 2007 G Swap (568) 511
SF 2007 M Swap (539) 296
SF 2007 N Swap (385) 84
SF 2008 B Swap (226) 218
SF 2008 C Swap (501) 258
SF 2008 F Swap (583) 464
SF 2008 G Swap (256) 244
MF 2007 B Cap 73 (59)
MF 2008 A Swap (615) (53)
Total hedging derivatives (6,733)$ 3,438$
Investment derivatives:
SF 2007 C Swap (56)$ (3)$
SF 2007 G Swap (46) (97)
Forward MBS sales Forward 300 (665)
MBS purchase commitments Commitment 483 483
Total investment derivatives 681$ (282)$
80

STATE OF IOWA
NOTES TO THE FINANCIAL STATEMENTS
The fair value of the interest rate swaps were estimated based on an independent pricing service. The valuations provided were derived from proprietary models based upon well-recognized principles and estimates about relevant future market conditions. The fair values take into consideration the prevailing interest rate environment and the specific terms and conditions of each swap. All fair values were estimated using the zero-coupon discounting method. This method calculates the future payments required by the interest rate swap, assuming the current forward rates implied by the yield curve are the market’s best estimate of future spot interest rates. These payments are then discounted using the spot rates implied by the current yield curve for a hypothetical zero-coupon rate bond due on the date of each future net settlement payment on the interest rate swaps. Fair values of options are based on option pricing models such as the Black-Scholes-Merton model, or any of the short-rate models of interest rate, or other market standard models consistent with accepted practices in the market for interest rate products. The models consider probabilities, volatilities, time, settlement prices, and other variables pertinent to the transactions.
The fair values of the interest rate cap were estimated based on the present value of their estimated future cash flows, and the forward mortgage-backed security sales are estimated based on an internal valuation model, which includes current trade pricing for similar financial instruments in active markets that the Authority has the
ability to access.
The fair value of the mortgage-backed security purchase commitments are estimated using an internal valuation model, which includes grouping the commitments by interest rate and terms, applying an estimated closing ratio, and then multiplying the quoted investor prices determined to be reasonably applicable to the group. The closing ratio, which represents the percentage of commitments that management estimates it will ultimately fund, calculation takes into consideration historical data and loan-level data. The weighted average closing ratio at June 30, 2015, was 87.62%
Risks Associated and Derivative Transactions:
Credit risk. The Authority is exposed to credit risk on hedging derivative instruments that are in asset positions. The aggregate fair value of hedging derivative instruments in asset positions at June 30, 2015, was $73,000. This represents the maximum loss that would be recognized at the reporting date if all counterparties failed to perform as contracted.
Bank of New York Mellon, Goldman Sachs Bank USA and Royal Bank of Canada are currently counterparties under the derivatives agreements with the Authority.
With respect to counterparty risk, the Authority will also manage the agreements and all transactions entered into with its counterparties to ensure that the Authority’s exposure to either of its counterparties does not exceed a proper amount.
Interest rate risk. The Authority is exposed to interest rate risk on its derivatives. On its pay-fixed, receive-variable derivatives, as the LIBOR or SIFMA swap index decreases, the Authority’s net payment on the derivatives increases.
Basis risk. Basis risk refers to a mismatch between the interest rate received from the derivative counterparty
and the interest rate actually owed on the Authority’s bonds. Specifically, the Authority’s basis risk is that the variable interest payment received from the counterparty will be less than the actual variable interest payments owed on the Authority’s variable rate bonds. The mismatch between the Authority’s actual bond rate and the derivative rate is the Authority’s basis risk. As of June 30, 2015, the weighted average interest rate of the Authority’s hedged variable rate debt is 4.32%, while the SIFMA swap index rate is 0.02%. LIBOR is 0.185% at June 30, 2015.
Termination risk. Termination risk is the risk the swap could be terminated as a result of any of several events,
which may include a ratings downgrade of the Authority’s single family mortgage bonds or of a derivative counterparty covenant violation, bankruptcy, swap payment default, and default events as defined in the Authority’s single family mortgage bonds resolution; however, the Authority believes the likelihood of any such termination event is remote.
Rollover risk. Rollover risk is the risk the term of a particular swap contract is not coterminous with the related bonds. If an issuer entered into a swap to hedge for a specified period of time and then decides at swap maturity it wished to maintain the same or similar hedge position, it may incur rehedging costs at that time. The Authority minimizes this risk by matching the term of the swaps with the maturity of the related bonds.
81

STATE OF IOWA
NOTES TO THE FINANCIAL STATEMENTS
NOTE 3 – TRANSFERS
Interfund transfers for the year ended June 30, 2015, consisted of the following (expressed in thousands):
Nonmajor Nonmajor
General Governmental University Enterprise
Transferred Out Fund Funds Funds Funds Total
General Fund -$ 36,997$ 643,274$ 2,353$ 682,624$
Tobacco Collections Fund 14,029 - - - 14,029
Nonmajor Governmental Funds 37,777 283 - - 38,060
Unemployment Benefits Fund 880 - - - 880
Nonmajor Enterprise Funds 110,645 - - - 110,645
Total 163,331$ 37,280$ 643,274$ 2,353$ 846,238$
Transferred In
Transfers are used to move: 1) revenues from the fund that statute requires to collect them to the fund that statute requires to expend them, 2) unrestricted revenues collected in the General Fund to finance various programs accounted for in other funds in accordance with budgetary authorization and 3) profits from the Liquor Control Act fund as required by law.
NOTE 4 – RECEIVABLES
Receivables at June 30, 2015, consisted of the following (expressed in thousands):
Business-type Governmental
Governmental Activities Activities Component
Funds Enterprise Funds Internal Service Funds Units
Accounts receivable:
Taxes 550,899$ 1,284$ -$ -$
Pledges 1,724 - - 222,196
Benefit overpayments - 64,993 - -
Employer contributions - 152,988 - -
Grants & contracts 1,101,035 1,066,114 - -
Other 930,096 158,436 663 62,878
Less allowance for doubtful accounts 623,139 690,577 - 5,532
Less discount to present value - - - 23,805
Accounts receivable (net) 1,960,615$ 753,238$ 663$ 255,737$
Current 1,865,160$ 734,454$ 663$ 91,311$
Noncurrent 95,455 18,784 - 164,426
Total 1,960,615$ 753,238$ 663$ 255,737$
Loans receivable:
Loans receivable 33,447$ 78,158$ -$ 1,795,244$
Less allowance for doubtful accounts 14,181 2,870 - 153,520
Loans receivable (net) 19,266$ 75,288$ -$ 1,641,724$
Current 4,000$ 7,620$ -$ 86,292$
Noncurrent 15,266 67,668 - 1,555,432
Total 19,266$ 75,288$ -$ 1,641,724$
Proprietary Funds
82

STATE OF IOWA
NOTES TO THE FINANCIAL STATEMENTS
NOTE 5 – INTERFUND BALANCES
Interfund balances for the year ended June 30, 2015, consisted of the following (expressed in thousands):
Due To Other Funds/ Tobacco Nonmajor Unemployment Nonmajor Internal
Advances From Other General Settlement Governmental Benefits Enterprise Service
Funds Fund Authority Funds Fund Funds Funds Total
General Fund -$ -$ 3,055$ 570$ 96$ 67,005$ 70,726$
Tobacco Settlement
Authority 141 - - - - - 141
Tobacco Collections
Fund - 156,007 - - - - 156,007
Nonmajor Governmental
Funds 8,988 - 107 - 48 101 9,244
Unemployment Benefits
Fund 182 - - - - - 182
Nonmajor Enterprise
Funds 11,790 - - - 2 71 11,863
Internal Service Funds 418 - 7 - - 12,808 13,233
Total 21,519$ 156,007$ 3,169$ 570$ 146$ 79,985$ 261,396$
Due From Other Funds/Advances To Other Funds
$54.8 million is due from the General Fund to the Workers’ Compensation Fund (an Internal Service Fund) to fund the cost of claims incurred. Remaining interfund balances result mainly from the time lag between the dates (1) interfund goods and services are provided or reimbursable expenditures occur, (2) transactions are recorded in
the accounting system and (3) payments between funds are made.
Not included in the table above, and not expected to be repaid within one year, is an interfund advance of $149.0 million due from the Tobacco Collections Fund (a Special Revenue Fund) to the Tobacco Settlement Authority (a blended component unit classified as a Special Revenue Fund) for repayment of bonds issued by the Authority, the proceeds of which were provided to the State. The interfund advance will be reduced by pledged tobacco settlement moneys received.
(Notes continue on next page.)
83

STATE OF IOWA
NOTES TO THE FINANCIAL STATEMENTS
NOTE 6 – CAPITAL ASSETS
Capital asset activity for the year ended June 30, 2015, was as follows (expressed in thousands):
`
Beginning Reclass- Ending
Balance ifications Increases Decreases Balance
Governmental activities
Capital assets not being depreciated:
Land 794,618$ 555$ 29,501$ 9,383$ 815,291$
Construction in progress 213,366 (53,444) 53,023 - 212,945
Computer software in progress 70,144 (32,422) 25,627 12,496 50,853
Total capital assets not being depreciated 1,078,128 (85,311) 108,151 21,879 1,079,089
Capital assets being depreciated:
Infrastructure 11,911,415 - 818,007 19,435 12,709,987
Works of art and historical treasures 1,415 - - - 1,415
Land improvements 60,587 2,858 1,976 - 65,421
Buildings and improvements 1,561,328 50,499 16,455 18,035 1,610,247
Machinery, equipment and vehicles 548,885 929 35,833 29,180 556,467
Computer software 86,183 31,025 1,184 - 118,392
Total capital assets being depreciated 14,169,813 85,311 873,455 66,650 15,061,929
Less accumulated depreciation for:
Infrastructure 5,932,834 - 460,670 19,428 6,374,076
Works of art and historical treasures 201 - 14 - 215
Land improvements 21,426 - 1,957 - 23,383
Buildings and improvements 658,153 - 37,266 3,252 692,167
Machinery, equipment and vehicles 347,576 - 40,712 26,764 361,524
Computer software 18,766 - 8,191 - 26,957
Total accumulated depreciation 6,978,956 - 548,810 49,444 7,478,322
Total capital assets being depreciated (net) 7,190,857 85,311 324,645 17,206 7,583,607
Governmental activities capital assets (net) 8,268,985$ -$ 432,796$ 39,085$ 8,662,696$
(continued on next page)
84

STATE OF IOWA
NOTES TO THE FINANCIAL STATEMENTS
(continued)
Beginning Reclass- Ending
Balance ifications Increases Decreases Balance
Business-type activities
Capital assets not being depreciated:
Land 85,357$ -$ 3,192$ -$ 88,549$
Land improvements 5,733 - - - 5,733
Construction in progress 701,350 (447,323) 594,016 112 847,931
Computer software in progress 15,600 (17,481) 8,344 - 6,463
Works of art 24,970 - 1,254 - 26,224
Library collections 298,951 - 15,650 370 314,231
Total capital assets not being depreciated 1,131,961 (464,804) 622,456 482 1,289,131
Capital assets being depreciated:
Infrastructure 944,153 32,002 512 - 976,667
Library collections 265,733 - 11,158 9,370 267,521
Land improvements 71,752 2,657 - 1 74,408
Buildings and improvements 4,760,949 411,536 149 7,540 5,165,094
Machinery, equipment and vehicles 1,069,503 1,128 90,606 43,296 1,117,941
Trademarks 107 - - - 107
Goodwill 2,302 - - - 2,302
Computer software 100,154 17,481 964 1,170 117,429
Total capital assets being depreciated 7,214,653 464,804 103,389 61,377 7,721,469
Less accumulated depreciation for:
Infrastructure 545,644 - 29,183 - 574,827
Library collections 215,559 - 10,952 9,370 217,141
Land improvements 42,415 - 2,877 - 45,292
Buildings and improvements 2,181,263 - 154,442 5,632 2,330,073
Machinery, equipment and vehicles 702,162 - 83,015 38,057 747,120
Trademarks 24 - 8 - 32
Goodwill 529 - 154 - 683
Computer software 47,003 - 8,567 1,132 54,438
Total accumulated depreciation 3,734,599 - 289,198 54,191 3,969,606
Total capital assets being depreciated (net) 3,480,054 464,804 (185,809) 7,186 3,751,863
Business-type activities capital assets (net) 4,612,015$ -$ 436,647$ 7,668$ 5,040,994$
85

STATE OF IOWA
NOTES TO THE FINANCIAL STATEMENTS
Depreciation was charged to functions of the primary government as follows (expressed in thousands):
Governmental activities:
Administration & regulation 9,716$
Education 5,429
Health & human rights 4,613
Human services 10,569
Justice & public defense 31,990
Economic development 537
Transportation 462,126
Agriculture & natural resources 8,245
Subtotal 533,225
Depreciation on capital assets held by the State's internal service funds
is allocated to the various functions based on their use of the assets 15,585
Total 548,810$
Business-type activities:
Enterprise 289,198$
Discretely Presented Component Units (expressed in thousands)
Capital assets not being depreciated:
Land 10,862$
Construction in progress 8,273
Total capital assets not being depreciated 19,135
Capital assets being depreciated:
Infrastructure 11,248
Buildings and improvements 125,633
Land improvements 45
Machinery, equipment and vehicles 25,442
Computer software 2,598
Total capital assets being depreciated 164,966
Less accumulated depreciation 73,714
Total capital assets being depreciated (net) 91,252
Discretely presented component units capital assets (net) 110,387$
Impairment of Capital Assets – Governmental Activities
Iowa Department of Human Services (DHS) – Human services expenses include an impairment loss of
$12.5 million due to DHS stopping construction of the Medicaid Information System (MIDAS) and the write-off of the related computer software in progress in accordance with GASB Statement No. 42.
DHS – Iowa Juvenile Home (IJH, Toledo) – Human services expenses include an impairment loss of $12.9 million due to the closure of IJH, Toledo and the write-down of the capital assets in accordance with GASB Statement No. 42. IJH, Toledo has $4.1 million of impaired capital assets considered to be idle as of June 30, 2015.
86
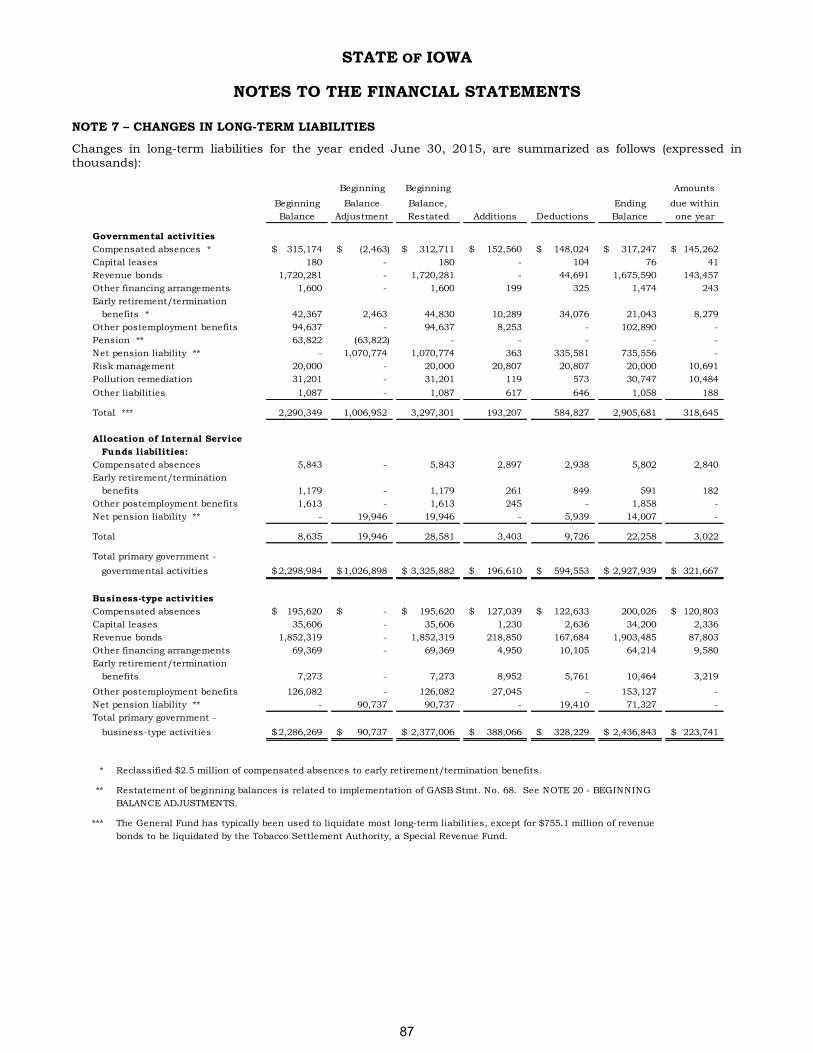
STATE OF IOWA
NOTES TO THE FINANCIAL STATEMENTS
NOTE 7 – CHANGES IN LONG-TERM LIABILITIES
Changes in long-term liabilities for the year ended June 30, 2015, are summarized as follows (expressed in thousands):
Beginning Beginning Amounts
Beginning Balance Balance, Ending due within
Balance Adjustment Restated Additions Deductions Balance one year
Governmental activities
Compensated absences * 315,174$ (2,463)$ 312,711$ 152,560$ 148,024$ 317,247$ 145,262$
Capital leases 180 - 180 - 104 76 41
Revenue bonds 1,720,281 - 1,720,281 - 44,691 1,675,590 143,457
Other financing arrangements 1,600 - 1,600 199 325 1,474 243
Early retirement/termination
benefits * 42,367 2,463 44,830 10,289 34,076 21,043 8,279
Other postemployment benefits 94,637 - 94,637 8,253 - 102,890 -
Pension ** 63,822 (63,822) - - - - -
Net pension liability ** - 1,070,774 1,070,774 363 335,581 735,556 -
Risk management 20,000 - 20,000 20,807 20,807 20,000 10,691
Pollution remediation 31,201 - 31,201 119 573 30,747 10,484
Other liabilities 1,087 - 1,087 617 646 1,058 188
Total *** 2,290,349 1,006,952 3,297,301 193,207 584,827 2,905,681 318,645
Allocation of Internal Service
Funds liabilities:
Compensated absences 5,843 - 5,843 2,897 2,938 5,802 2,840
Early retirement/termination
benefits 1,179 - 1,179 261 849 591 182
Other postemployment benefits 1,613 - 1,613 245 - 1,858 -
Net pension liability ** - 19,946 19,946 - 5,939 14,007 -
Total 8,635 19,946 28,581 3,403 9,726 22,258 3,022
Total primary government -
governmental activities 2,298,984$ 1,026,898$ 3,325,882$ 196,610$ 594,553$ 2,927,939$ 321,667$
Business-type activities
Compensated absences 195,620$ -$ 195,620$ 127,039$ 122,633$ 200,026 120,803$
Capital leases 35,606 - 35,606 1,230 2,636 34,200 2,336
Revenue bonds 1,852,319 - 1,852,319 218,850 167,684 1,903,485 87,803
Other financing arrangements 69,369 - 69,369 4,950 10,105 64,214 9,580
Early retirement/termination
benefits 7,273 - 7,273 8,952 5,761 10,464 3,219
Other postemployment benefits 126,082 - 126,082 27,045 - 153,127 -
Net pension liability ** - 90,737 90,737 - 19,410 71,327 -
Total primary government -
business-type activities 2,286,269$ 90,737$ 2,377,006$ 388,066$ 328,229$ 2,436,843$ 223,741$
*
**
***
Restatement of beginning balances is related to implementation of GASB Stmt. No. 68. See NOTE 20 - BEGINNING
BALANCE ADJUSTMENTS.
The General Fund has typically been used to liquidate most long-term liabilities, except for $755.1 million of revenue
bonds to be liquidated by the Tobacco Settlement Authority, a Special Revenue Fund.
Reclassified $2.5 million of compensated absences to early retirement/termination benefits.
87

STATE OF IOWA
NOTES TO THE FINANCIAL STATEMENTS
NOTE 8 – CAPITAL LEASES
The State has entered into agreements to lease various equipment and property. The agreements have interest rates ranging from 0.00% to 10.49% and expire before June 30, 2035.
The State has also entered into a few installment purchase agreements. Because the amounts involved are not material, and the accounting treatment is similar, such agreements are reported together with capital leases.
A. Primary Government
Governmental Activities
The following is a schedule by year of the future minimum payments required (expressed in thousands):
Year Ending
June 30, Principal Interest
2016 41$ 1$
2017 25 -
2018 8 -
2019 2 -
Total 76$ 1$
The historical cost of assets acquired under capital leases and included in capital assets in the government-wide financial statements at June 30 follows (expressed in thousands):
Equipment 34$
Accumulated depreciation (11)
Net 23$
Business-type Activities
The following is a schedule by year of the future minimum payments required (expressed in thousands):
Year Ending
June 30, Principal Interest
2016 2,336$ 1,158$
2017 2,409 1,069
2018 2,498 977
2019 2,584 882
2020 2,662 783
2021-2025 10,652 3,433
2026-2030 9,197 1,600
Thereafter 1,862 101
Total 34,200$ 10,003$
The historical cost of assets acquired under capital leases and included in capital assets in the financial statements at June 30 follows (expressed in thousands):
Buildings & improvements 41,241$
Equipment 399
Total 41,640
Accumulated depreciation (4,498)
Net 37,142$
88

STATE OF IOWA
NOTES TO THE FINANCIAL STATEMENTS
B. Component Units
The University of Iowa Foundation has entered into a lease agreement with the University of Iowa for a leasehold interest in a building. The following is a schedule by year of the future minimum payments required (expressed in thousands):
Year Ending
June 30, Principal
2016 725$
2017 740
2018 780
2019 825
Total 3,070$
NOTE 9 – OTHER FINANCING ARRANGEMENTS PAYABLE
Loans and Contracts Payable – Primary Government
Governmental Activities
The Iowa Department of Natural Resources has entered into agreements for facilities and land for a total of $4,943,000 with interest rates of 1.75%. The following is a schedule by year of the future minimum payments required (expressed in thousands):
Year Ending
June 30, Principal Interest
2016 243$ 26$
2017 253 22
2018 263 17
2019 263 13
2020 159 8
Thereafter 293 6
Total 1,474$ 92$
Business-type Activities
Iowa State University, the University of Northern Iowa and the University of Iowa have entered into agreements for
buildings and equipment for a total of $89,737,718. The agreements are for periods of 16 to 23 years with interest rates ranging from 0.00% to 5.82%. The following is a schedule by year of future minimum payments required (expressed in thousands):
Year Ending
June 30, Principal Interest
2016 9,580$ 1,667$
2017 9,383 1,391
2018 9,316 1,141
2019 7,450 906
2020 6,466 704
2021-2025 18,274 1,067
Thereafter 3,745 120
Total 64,214$ 6,996$
89
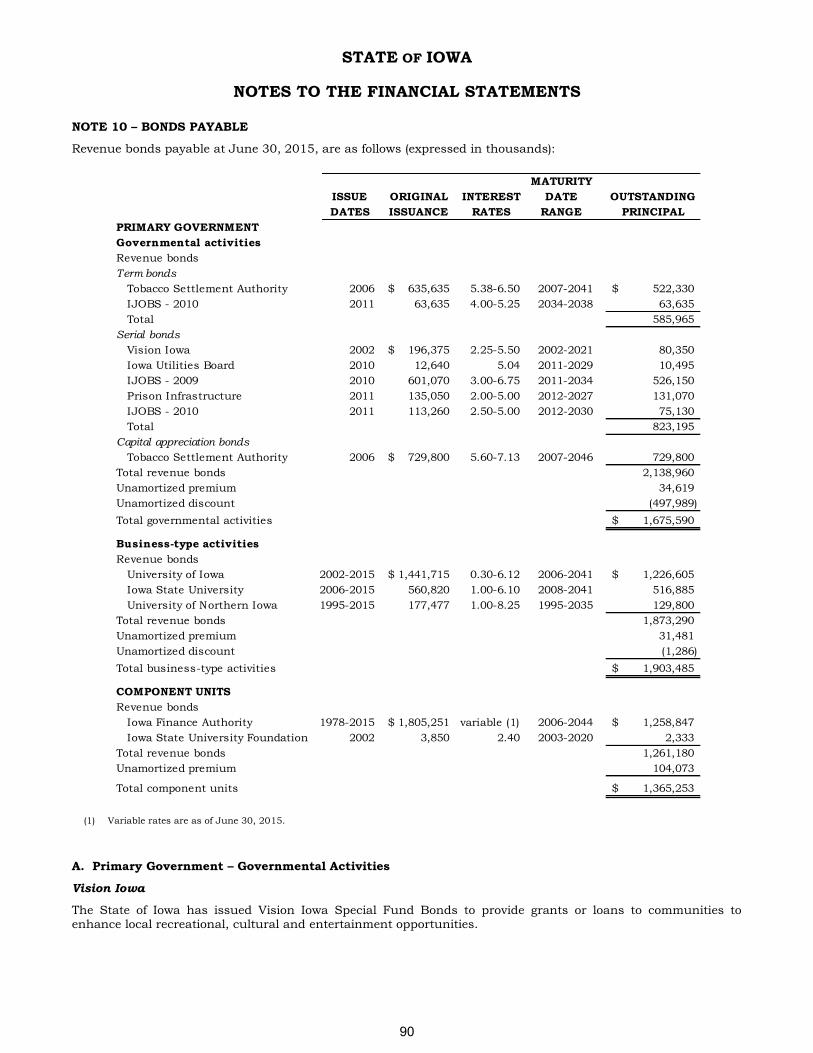
STATE OF IOWA
NOTES TO THE FINANCIAL STATEMENTS
NOTE 10 – BONDS PAYABLE
Revenue bonds payable at June 30, 2015, are as follows (expressed in thousands):
MATURITY
ISSUE ORIGINAL INTEREST DATE OUTSTANDING
DATES ISSUANCE RATES RANGE PRINCIPAL
PRIMARY GOVERNMENT
Governmental activities
Revenue bonds
Term bonds
Tobacco Settlement Authority 2006 635,635$ 5.38-6.50 2007-2041 522,330$
IJOBS - 2010 2011 63,635 4.00-5.25 2034-2038 63,635
Total 585,965
Serial bonds
Vision Iowa 2002 196,375$ 2.25-5.50 2002-2021 80,350
Iowa Utilities Board 2010 12,640 5.04 2011-2029 10,495
IJOBS - 2009 2010 601,070 3.00-6.75 2011-2034 526,150
Prison Infrastructure 2011 135,050 2.00-5.00 2012-2027 131,070
IJOBS - 2010 2011 113,260 2.50-5.00 2012-2030 75,130
Total 823,195
Capital appreciation bonds
Tobacco Settlement Authority 2006 729,800$ 5.60-7.13 2007-2046 729,800
Total revenue bonds 2,138,960
Unamortized premium 34,619
Unamortized discount (497,989)
Total governmental activities 1,675,590$
Business-type activities
Revenue bonds
University of Iowa 2002-2015 1,441,715$ 0.30-6.12 2006-2041 1,226,605$
Iowa State University 2006-2015 560,820 1.00-6.10 2008-2041 516,885
University of Northern Iowa 1995-2015 177,477 1.00-8.25 1995-2035 129,800
Total revenue bonds 1,873,290
Unamortized premium 31,481
Unamortized discount (1,286)
Total business-type activities 1,903,485$
COMPONENT UNITS
Revenue bonds
Iowa Finance Authority 1978-2015 1,805,251$ variable (1) 2006-2044 1,258,847$
Iowa State University Foundation 2002 3,850 2.40 2003-2020 2,333
Total revenue bonds 1,261,180
Unamortized premium 104,073
Total component units 1,365,253$
(1) Variable rates are as of June 30, 2015.
A. Primary Government – Governmental Activities
Vision Iowa
The State of Iowa has issued Vision Iowa Special Fund Bonds to provide grants or loans to communities to enhance local recreational, cultural and entertainment opportunities.
90

STATE OF IOWA
NOTES TO THE FINANCIAL STATEMENTS
The State has pledged a portion of the future revenues to be deposited into the Vision Iowa Fund to repay $196.4 million of bonds issued in November 2001. These revenues include a standing appropriation of $15 million annually from gaming revenues, certain earnings on the Vision Iowa Fund and Bond Reserve Fund (including any amounts appropriated to replenish the Bond Reserve Fund to its required balance) and, to the extent of any shortfall in gaming revenues, Lottery revenues. The bonds are payable solely and only from certain revenues deposited into the Vision Iowa Fund and the Bond Reserve Fund and are payable through fiscal year 2021. Annual principal and interest payments on the bonds are expected to require less than 94% of total deposits into the Vision Iowa Fund. As of June 30, 2015, total principal and interest remaining to be paid on the debt is $95.7 million. Principal and interest paid for the current year and total deposits into the Vision Iowa Fund were $16.0 million and $15.4 million, respectively.
The bonds are not debts of the State or any political subdivision of the State, and do not constitute a pledge of the faith and credit of the State or a charge against the general credit or General Fund of the State.
Tobacco Settlement Authority
The Tobacco Settlement Authority (Authority) has issued Tobacco Settlement Asset-Backed Bonds to advance
refund outstanding tobacco settlement asset-backed bonds and to provide funding to the State for various capital
projects.
Pursuant to a Sales Agreement between the State and the Authority, the State has pledged, as security for bonds issued by the Authority, 78% of the amounts payable to the State under the Master Settlement Agreement (the “MSA”) entered into by participating cigarette manufacturers (the “PMs”), 46 states (including the State) and six other U.S. jurisdictions in November 1998 in the settlement of certain smoking-related litigation, including the State’s right to receive future initial, annual and strategic contribution payments (the “TSRs”), to be made by the PMs under the MSA.
The bonds, issued by the Authority in fiscal year 2006 in the par amount of $1.4 billion are payable through fiscal year 2046. The Authority has pledged, as the sole security for the bonds, 78% of the future TSRs payable under the terms of the Sales Agreement, investment earnings on certain accounts pledged under the bond indenture and amounts held in accounts established under the bond indenture (i.e. collection, debt service reserve, turbo redemption, etc.). As of June 30, 2015, total principal and interest remaining on the debt is $2,078.1 million with annual requirements ranging from $149.5 million in 2016 to $734.9 million in the final year. TSRs received by the State have averaged $60.1 million per year over the last 17 years. For the current year, principal and interest paid by the Authority and the total TSRs recognized by the State were $52.4 million and $63.8 million, respectively.
The bonds are not a general obligation or general indebtedness of the Authority and do not constitute an obligation or indebtedness of the State or any political subdivision of the State. The State has no obligation or intention to satisfy any deficiency or default of any payment on the bonds.
IJOBS – 2009
The State of Iowa has issued IJOBS Program Special Obligation Bonds to finance certain infrastructure projects of the State and certain grant and loan programs of the State. The State has pledged a portion of future revenues to repay $601.1 million ($380.1 million in State of Iowa IJOBS Program Special Obligation Bonds Series 2009A and $221 million in State of Iowa IJOBS Program Special Obligation Bonds Taxable Series 2009B) of bonds issued in July 2009. These revenues include amounts to be deposited in the Revenue Bonds Debt Service Fund including a standing appropriation of $55 million annually from gaming revenues and, to the extent of any shortfall in gaming revenues, beer and liquor revenues. The State has designated the Series 2009B Bonds as Build America Bonds
under the American Recovery and Reinvestment Act of 2009, and as such, elected to receive from the federal
government a subsidy equal to 35% of the amount of each interest payment on the taxable bonds. The bonds are payable from the Bond Reserve Fund including any amounts appropriated to replenish such fund and are payable through fiscal year 2034. Annual principal and interest payments on the bonds are expected to require less than 79% of total deposits into the Revenue Bonds Debt Service Fund. As of June 30, 2015, total principal and interest remaining to be paid on the debt is $893.5 million. Principal and interest paid for the current year and total deposits into the Revenue Bonds Debt Service Fund were $47.0 million and $60.0 million, respectively.
The bonds are limited special obligations of the State and do not constitute a debt or indebtedness of the State, nor any political subdivision of the State, or a pledge of the full faith and credit of the State or a charge against the general credit or General Fund of the State.
91

STATE OF IOWA
NOTES TO THE FINANCIAL STATEMENTS
Iowa Utilities Board and Consumer Advocate State Building
The State of Iowa has issued Iowa Utilities Board and Consumer Advocate State Building Special Obligation Bonds, totaling $12.6 million, to finance the costs of construction of a new building. All amounts collected by the Iowa Utilities Board shall be deposited in accordance with Iowa Code Sections 476.10 and 476.10B as chargeable expenses in each fiscal year until the amount of deposit is equal to the amount of principal and interest on the bonds due in that fiscal year. The bonds are payable from the IUB/OCA Bond Fund and are payable through fiscal year 2029. Annual principal and interest payments on the bonds are expected to require 100% of total deposits into the IUB/OCA Bond Fund. As of June 30, 2015, total principal and interest remaining to be paid on the debt is $14.9 million. Principal and interest paid for the current year and total deposits into the IUB/OCA Bond Fund were $1.1 million and $1.1 million, respectively.
The bonds are not debts of the State or of any political subdivision of the State, and do not constitute a pledge of the faith and credit of the State or a charge against the general credit or General Fund of the State.
Prison Infrastructure
The State of Iowa has issued Special Obligation Bonds (Prison Infrastructure Fund) to finance the costs of the construction of a new Iowa State Penitentiary at Fort Madison, Iowa and to redeem the outstanding Iowa Prison
Infrastructure Fund Revenue Bond Anticipation Notes, Series 2009. The State has pledged all funds deposited in the Prison Infrastructure Fund from fines, fees, costs, and forfeited bail collected by the clerks of the district court in criminal cases, including those collected for both scheduled and nonscheduled violations, but excluding fines and fees attributable to commercial vehicle violation citations issued after July 1, 1998, not reverting to the State’s General Fund at the end of each fiscal year, plus interest earnings on moneys in the Prison Infrastructure Fund to repay $135.0 million in bonds issued in July 2010. The bonds are payable from the Debt Service Reserve Fund and are payable through fiscal year 2027. Annual principal and interest payments on the bonds are expected to require less than 46% of total deposits into the Prison Infrastructure Fund. As of June 30, 2015, total principal and interest remaining to be paid on the debt is $175.9 million. Principal and interest paid in the current year and total deposits into the Prison Infrastructure Fund were $8.7 million and $15.1 million, respectively.
The bonds are limited special obligations of the State. The bonds and interest thereon do not constitute nor give rise to a pecuniary liability, general obligation or a pledge of the full faith and credit of the State or any political subdivision of the State within the meaning of any constitutional or statutory limitation.
IJOBS – 2010
The State of Iowa has issued IJOBS Program Special Obligation Bonds to finance certain infrastructure projects of the State and certain grant and loan programs of the State. The State has pledged a portion of future revenues to repay $151.3 million in State of Iowa IJOBS Program Special Obligation Bonds, Series 2010A issued in October 2010. These revenues include amounts to be deposited in the Revenue Bonds Debt Service Fund including a standing appropriation of $55 million annually from gaming revenues and, to the extent of any shortfall in gaming revenues, beer and liquor revenues. The bonds are payable from the Bond Reserve Fund including any amounts appropriated to replenish such fund and are payable through fiscal year 2038.
Annual principal and interest payments on the Series 2010A bonds are expected to require less than 17% of total deposits into the Revenue Bonds Debt Service Fund. As of June 30, 2015, total principal and interest remaining to be paid on the Series 2010A bonds is $229.7 million. Principal and interest paid on the Series 2010A bonds in the current year and total deposits into the Revenue Bonds Debt Service Fund were $10.1 million and $60.0 million, respectively.
The bonds are limited special obligations of the State and do not constitute a debt or indebtedness of the State
nor any political subdivision of the State, or a pledge of the full faith and credit of the State or a charge against the general credit or General Fund of the State.
Prior Year Bond Defeasances
In a prior year, the State defeased the Iowa Finance Authority Refunding Revenue Bonds (Correctional Facility Program), Series 2002, Honey Creek Authority Destination Park Revenue Bonds, Series 2006, and School Infrastructure Special Fund Refunding Bonds, Series 2012, by placing proceeds from existing resources into irrevocable trusts with escrow agents to provide for all future debt service payments. Accordingly, trust account assets and the liabilities for the defeased bonds are not included in the State’s financial statements. As of June 30, 2015, bonds totaling $48.0 million are considered defeased.
92

STATE OF IOWA
NOTES TO THE FINANCIAL STATEMENTS
Future bond debt service requirements of the Primary Government – Governmental Activities are as follows (expressed in thousands):
Year Ending
June 30, Principal Interest
2016 148,240$ 87,219$
2017 43,460 78,383
2018 45,575 76,283
2019 47,815 74,094
2020 65,420 72,170
2021-2025 206,495 322,956
2026-2030 215,615 268,261
2031-2035 376,395 192,503
2036-2040 128,905 104,808
2041-2045 135,120 63,218
Thereafter 725,920 8,979
Total 2,138,960$ 1,348,874$
B. Primary Government – Business-type Activities
Universities
During the current year, the University of Iowa issued the following revenue bonds:
$24.6 million of Academic Building Revenue Bonds, Series S.U.I. 2014A, with an interest rate range of
2.00-3.20% to defray the cost of constructing various academic buildings, facilities and equipment at the University. The revenues pledged to these bonds are tuition and fees generated by the University.
$25.0 million of Utility System Revenue Bonds, Series S.U.I. 2015, with an interest rate range of 2.00-
4.00% to provide funds to pay the cost of constructing, equipping and furnishing the Utility Facility on the University’s campus. The revenues pledged to these bonds are charges assessed to the users of the utility system.
During the current year, the University of Iowa issued the following revenue refunding bonds:
$20.9 million of Athletic Facilities Revenue Refunding Bonds, Series S.U.I. 2015, with an average interest
rate of 3.00% and accrued interest of $25,000 to advance refund $20.4 million of outstanding Athletic Facilities Revenue Refunding Bonds, Series S.U.I. 2005A with interest rates ranging between 3.85% and 4.30%. Net bond proceeds of $21.2 million were placed in an irrevocable escrow account with the University as trustee. The escrow account is sufficient to fully service all remaining principal and interest due on the bonds. The Series S.U.I. 2005A Bonds will be called on July 1, 2016. The advance refunding permitted the University to realize an economic gain (difference between present values of the old and new debt service payments) of $1.3 million; and reduced the aggregate debt service payments by $1.6 million over the next 16 years.
$18.7 million of University of Iowa Facilities Corp. (UIFC) Revenue Refunding Bonds, Series S.U.I. 2015
(Old Capitol Town Center), with an average interest rate of 2.90% and accrued interest of $21,000 to advance refund $18.0 million of outstanding UIFC Revenue Refunding Bonds, Series S.U.I. 2006 (Old Capitol Town Center) with interest rates ranging between 4.00% and 4.70%. Net bond proceeds of $18.8 million were placed in an irrevocable escrow account with the University as trustee. The escrow account is sufficient to fully service all remaining principal and interest due on the bonds. The Series S.U.I. 2006 Bonds will be called on June 1, 2016. The advance refunding permitted the University to realize an
economic gain of $1.6 million; and reduced the aggregate debt service payments by $2.0 million over the next 16 years.
$19.3 million of Athletic Facilities Revenue Refunding Bonds, Series S.U.I. 2015A, with an average
interest rate of 2.82% and accrued interest of $33,000 to refund $19.1 million of outstanding Athletic Facilities Revenue Refunding Bonds, Series S.U.I. 2005 with interest rates ranging between 3.35% and 4.25%. Net bond proceeds of $19.1 million were placed in an irrevocable escrow account with the University as trustee. The escrow account is sufficient to fully service all remaining principal and interest due on the bonds. The Series S.U.I. 2005 Bonds will be called on August 1, 2015. The current refunding permitted the University to realize an economic gain of $1.6 million; and reduced the aggregate debt service payments by $1.9 million over the next 15 years.
93

STATE OF IOWA
NOTES TO THE FINANCIAL STATEMENTS
In prior years, the University of Iowa defeased certain revenue bonds by placing the proceeds of new bonds in an irrevocable trust to provide for all future debt service payments on the old bonds. Accordingly, the trust account assets and the liability for the defeased bonds are not included in the State’s financial statements. As of June 30, 2015, bonds totaling $83.5 million for the University of Iowa were considered defeased.
During the current year, Iowa State University issued the following revenue bonds:
$32.3 million of Athletic Facilities Revenue Bonds, Series I.S.U. 2015, with an interest rate range of 3.00-
3.25% to pay costs of constructing and equipping improvements at Jack Trice Stadium. The revenues pledged to these bonds are net revenues of the Athletics Facilities System.
$16.5 million of Utility System Revenue Bonds, Series I.S.U. 2015, with an interest rate range of 2.00-
3.25% to pay costs of equipment and facility enhancements to the provision of utilities to the University community. The revenues pledged to these bonds are net revenues of the utility system and any utility system student fees.
$30.0 million of Dormitory System Revenue Bonds, Series I.S.U. 2015, with an interest rate range of 2.00-
3.25% to pay costs of constructing and furnishing dormitory system facilities. The revenues pledged to these bonds are rents, profits and income from the Department of Residence facilities.
During the current year, Iowa State University issued the following revenue refunding bonds:
$11.8 million of Athletic Facilities Revenue Refunding Bonds, Series I.S.U. 2015A. $11.6 million of
proceeds and $1.6 million of University funds were placed in an irrevocable escrow account to refund $10.3 million of Athletic Facilities Revenue Bonds, Series I.S.U. 2007. The advance refunding of these bonds permitted the University to realize an economic gain of $0.8 million; and reduced the aggregate debt service payments by $1.1 million over the next 17 years.
$16.3 million of Academic Building Revenue Refunding Bonds, Series I.S.U. 2014. $17.3 million of proceeds were placed in an irrevocable escrow account to refund $16.5 million of Academic Building Revenue Bonds, Series I.S.U. 2005. The advance refunding of these bonds permitted the University to
realize an economic gain of $1.7 million; and reduced the aggregate debt service payments by $1.9 million over the next 12 years.
During the current year, the University of Northern Iowa issued $3.5 million of Field House Revenue Refunding Bonds, Series U.N.I. 2015, with an average interest rate of 2.05% to refund the July 1, 2016 through July 1, 2022 maturities of Field House Revenue Bonds, Series U.N.I. 2005. Outstanding Series U.N.I. 2005 bonds totaled $4.1 million with interest ranging between 3.75% and 4.20%. Net bond proceeds of $3.1 million and $1.2 million in University funds were deposited in an irrevocable escrow account with the University as trustee. The escrow account is sufficient to fully pay the remaining principal and interest due on the outstanding bonds. The Field House Revenue Bonds, Series U.N.I. 2005 will be called on July 1, 2015. The current refunding permitted the University to realize an economic gain of $0.3 million; and reduced the aggregate debt service payments by $0.6 million over the next 7 years.
Future bond debt service requirements for bonds of the Primary Government – Business-type Activities are as follows (expressed in thousands):
Year Ending
June 30, Principal Interest
2016 87,803$ 68,498$
2017 92,548 64,654
2018 96,743 61,726
2019 99,698 58,581
2020 102,218 55,242
2021-2025 489,984 224,181
2026-2030 450,762 132,808
2031-2035 319,815 56,696
2036-2040 127,795 9,800
Thereafter 5,924 106
Total 1,873,290$ 732,292$
94

STATE OF IOWA
NOTES TO THE FINANCIAL STATEMENTS
C. Component Units
Iowa Finance Authority
The Iowa Finance Authority (Finance Authority) is authorized and has issued bonds to provide affordable mortgage financing and to meet the 20% State match required for federal capitalization grants which are used to provide loans for construction of wastewater and drinking water facilities. The bonds are payable principally from repayments of such loans. The obligations do not constitute a debt of the State of Iowa and the State is not liable for any repayments.
The bonds are secured, as described in the applicable bond resolution, by the revenues, moneys, investments, loans and other assets in the programs and accounts established by the respective bond resolutions.
The Single Family Mortgage Bond Resolutions, the Single Family Housing Bond Resolutions and the Multifamily Bond Indenture contain covenants that require the Finance Authority to make payments of principal and interest from amounts available in the Finance Authority’s General Account should deficiencies occur in the accounts established for such payments by the respective bond resolutions. The Draw Down Bond Indenture under the
Single Family Bond Program and the bond resolutions for the State Revolving Fund (SRF) accounts do not contain these covenants.
In February 2015, the Finance Authority issued SRF bonds with a face value of $321.5 million to provide resources to purchase investment securities that were placed into an irrevocable trust to provide funds for future debt service payments on $298.3 million of SRF bonds. The funds required for this transaction exceeded the net carrying value of the defeased debt by $25.4 million. This refunding was undertaken to take advantage of the low interest rate environment and resulted in an economic gain of $32.9 million. As a result, the irrevocable trust account assets and the liabilities for these defeased bonds are not included in the Finance Authority’s financial statements. As of June 30, 2015, bonds totaling $298.3 million were considered defeased.
During the current fiscal year, the Finance Authority issued one new single-family bond series totaling $11.9 million to refund existing higher cost debt and one SRF bond series with a face value of $321.5 million, which sold at a premium for total proceeds of $381.0 million to purchase SRF loans and to defease prior bonds. In addition to the defeasance of $298.3 million, the Finance Authority made bond payments of $140.3 million during the fiscal year.
Universities Foundations
To finance the purchase and remodeling of the Foundation building, the Iowa State University Foundation issued $3,850,000 of Office Building Revenue Bonds in 2002 under an agreement with the City of Huxley (City). In March 2010, the bonds were refinanced under an amended agreement with the City. The refinanced bonds had varying maturities through 2020 and had an interest rate of 4.75%. In November 2013, the bonds were refinanced under an amended agreement with the City. The refinanced bonds have a maturity date of January 1, 2020 and carry an interest rate of 2.4% through November 2018. The bonds will carry an adjusted interest rate from November 2018 through the maturity date of January 2020. The bonds are collateralized with a mortgage on the building and other real estate owned by the Foundation. The Foundation has no taxing authority and bonds issued do not constitute a debt, liability or obligation of the State of Iowa or any political subdivision thereof.
Future bond debt service requirements for the bonds of the Component Units are as follows (expressed in thousands):
Year Ending
June 30, Principal Interest
2016 56,629$ 44,663$
2017 60,310 43,653
2018 61,205 41,470
2019 63,317 39,025
2020 61,878 36,508
2021-2025 331,392 141,828
2026-2030 269,681 80,158
2031-2035 189,750 31,722
2036-2040 84,752 13,173
Thereafter 82,266 4,478
Total 1,261,180$ 476,678$
95

STATE OF IOWA
NOTES TO THE FINANCIAL STATEMENTS
NOTE 11 – ACCOUNTS PAYABLE AND ACCRUALS
Accounts payable and accruals at June 30, 2015, consisted of the following (expressed in thousands):
Current Noncurrent
PRIMARY GOVERNMENT
Governmental activities
Salaries & fringes 67,914$ -$
Early retirement/termination benefits 8,461 13,173
Other postemployment benefits - 104,748
Risk management 10,691 9,309
Pollution remediation 10,484 20,263
State aid 659,692 -
Trade & other payables 707,221 44,056
Total governmental activities 1,464,463$ 191,549$
Business-type activities
Salaries & fringes 170,872$ -$
Early retirement/termination benefits 3,219 7,245
Other postemployment benefits - 153,127
General claims 38,717 -
Unemployment benefits 20,432 -
Trade & other payables 186,982 68,708
Total business-type activities 420,222$ 229,080$
COMPONENT UNITS
Annuity & life income obligations 365$ 48,167$
Lotto prizes & annuity prizes payable 3,722 1,970
Other 74,424 18,208
Total component units 78,511$ 68,345$
Pollution Remediation Obligations
An estimate for pollution remediation obligations is recorded when the State knows or reasonably believes a site is polluted and when any one of the following events occurs: (1) the State is compelled to take remediation action because pollution creates an imminent endangerment to public health/welfare or the environment, (2) the State is in violation of a pollution prevention-related permit or license, (3) the State is named, or will likely be named, by a regulator as a responsible party or potentially responsible party for remediation, (4) the State is named, or will likely be named, in a lawsuit to compel it to participate in remediation or (5) the State commences or legally obligates itself to commence cleanup activities or monitoring/maintenance of remediation efforts.
For the year ended June 30, 2015, pollution remediation obligations totaled $30.7 million, including $29.3 million for the Iowa Petroleum Underground Storage Tank Program.
Leaking underground storage tanks meeting certain eligibility requirements are covered by the Iowa Petroleum Underground Storage Tank program. Statutory authority for this program is found in Chapter 455G of the Code of Iowa. The program was established to expend funds for remedial action and underground storage tank improvements. Estimated remediation outlays for leaking underground storage tanks are developed by groundwater professionals. The estimations are based on a range of expected outlays, net of expected cost recoveries, if any, for the type and amount of pollution contamination detected. All estimates for pollution
remediation obligations are reviewed and adjusted periodically for price changes, additional contamination and any other changes detected.
The pollution remediation obligation does not include outlays for certain site cleanup activities or operation/maintenance costs because those outlays were not reasonably estimable.
The two matters discussed below were brought pursuant to the Comprehensive Environmental Response, Compensation, and Liability Act (CERCLA), commonly known as “Superfund.” The potential liability is not reasonably estimable at this time.
The LWD Incinerator Site is a hazardous waste disposal site located in Kentucky. The University of Iowa (SUI) received a demand letter regarding this site, alleging that SUI having contributed waste to the site, is a potentially
96
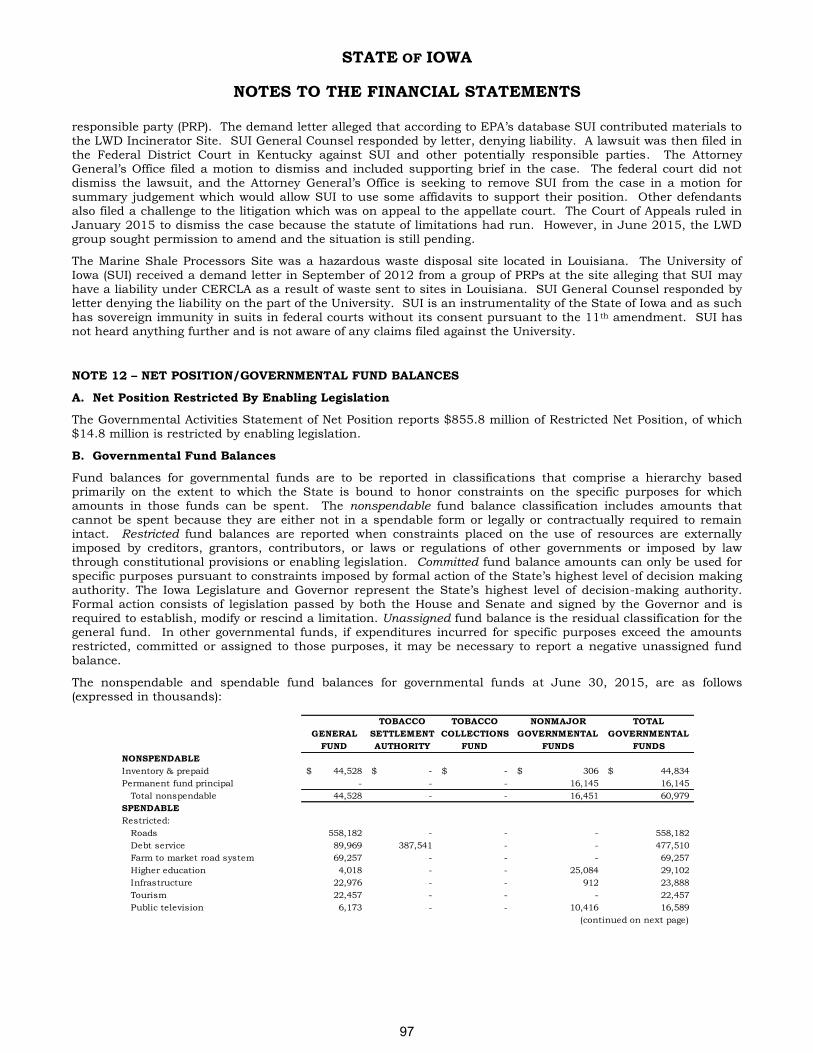
STATE OF IOWA
NOTES TO THE FINANCIAL STATEMENTS
responsible party (PRP). The demand letter alleged that according to EPA’s database SUI contributed materials to the LWD Incinerator Site. SUI General Counsel responded by letter, denying liability. A lawsuit was then filed in the Federal District Court in Kentucky against SUI and other potentially responsible parties. The Attorney General’s Office filed a motion to dismiss and included supporting brief in the case. The federal court did not dismiss the lawsuit, and the Attorney General’s Office is seeking to remove SUI from the case in a motion for summary judgement which would allow SUI to use some affidavits to support their position. Other defendants also filed a challenge to the litigation which was on appeal to the appellate court. The Court of Appeals ruled in January 2015 to dismiss the case because the statute of limitations had run. However, in June 2015, the LWD group sought permission to amend and the situation is still pending.
The Marine Shale Processors Site was a hazardous waste disposal site located in Louisiana. The University of Iowa (SUI) received a demand letter in September of 2012 from a group of PRPs at the site alleging that SUI may have a liability under CERCLA as a result of waste sent to sites in Louisiana. SUI General Counsel responded by letter denying the liability on the part of the University. SUI is an instrumentality of the State of Iowa and as such has sovereign immunity in suits in federal courts without its consent pursuant to the 11th amendment. SUI has not heard anything further and is not aware of any claims filed against the University.
NOTE 12 – NET POSITION/GOVERNMENTAL FUND BALANCES
A. Net Position Restricted By Enabling Legislation
The Governmental Activities Statement of Net Position reports $855.8 million of Restricted Net Position, of which $14.8 million is restricted by enabling legislation.
B. Governmental Fund Balances
Fund balances for governmental funds are to be reported in classifications that comprise a hierarchy based primarily on the extent to which the State is bound to honor constraints on the specific purposes for which amounts in those funds can be spent. The nonspendable fund balance classification includes amounts that cannot be spent because they are either not in a spendable form or legally or contractually required to remain intact. Restricted fund balances are reported when constraints placed on the use of resources are externally imposed by creditors, grantors, contributors, or laws or regulations of other governments or imposed by law through constitutional provisions or enabling legislation. Committed fund balance amounts can only be used for specific purposes pursuant to constraints imposed by formal action of the State’s highest level of decision making authority. The Iowa Legislature and Governor represent the State’s highest level of decision-making authority. Formal action consists of legislation passed by both the House and Senate and signed by the Governor and is required to establish, modify or rescind a limitation. Unassigned fund balance is the residual classification for the general fund. In other governmental funds, if expenditures incurred for specific purposes exceed the amounts restricted, committed or assigned to those purposes, it may be necessary to report a negative unassigned fund
balance.
The nonspendable and spendable fund balances for governmental funds at June 30, 2015, are as follows (expressed in thousands):
`
TOBACCO TOBACCO NONMAJOR TOTAL
GENERAL SETTLEMENT COLLECTIONS GOVERNMENTAL GOVERNMENTAL
FUND AUTHORITY FUND FUNDS FUNDS
NONSPENDABLE
Inventory & prepaid 44,528$ -$ -$ 306$ 44,834$
Permanent fund principal - - - 16,145 16,145
Total nonspendable 44,528 - - 16,451 60,979
SPENDABLE
Restricted:
Roads 558,182 - - - 558,182
Debt service 89,969 387,541 - - 477,510
Farm to market road system 69,257 - - - 69,257
Higher education 4,018 - - 25,084 29,102
Infrastructure 22,976 - - 912 23,888
Tourism 22,457 - - - 22,457
Public television 6,173 - - 10,416 16,589
(continued on next page)
97

STATE OF IOWA
NOTES TO THE FINANCIAL STATEMENTS
TOBACCO TOBACCO NONMAJOR TOTAL
(continued) GENERAL SETTLEMENT COLLECTIONS GOVERNMENTAL GOVERNMENTAL
FUND AUTHORITY FUND FUNDS FUNDS
SPENDABLE
Restricted:
Underground storage tanks 16,207 - - - 16,207
Public health 15,522 - - - 15,522
Bridges 10,741 - - - 10,741
Special schools - - - 9,937 9,937
Information & statistics 7,225 - - - 7,225
Consumer education 6,958 - - - 6,958
Airports 5,155 - - - 5,155
Technology 4,983 - - - 4,983
Passenger rail service 2,947 - - - 2,947
Visually impaired services 2,763 - - - 2,763
Other:
Justice & public defense 3,652 - - 201 3,853
Transportation 3,781 - - - 3,781
Human services 2,919 - - 19 2,938
Education 1,664 - - 1,197 2,861
Health & human rights 1,623 - - 1,227 2,850
Administration & regulation 1,304 - - 909 2,213
Economic development 1,041 - - - 1,041
Agriculture & natural resources 66 - - 44 110
Total restricted 861,583 387,541 - 49,946 1,299,070
Committed:
Cash reserve 523,409 - - - 523,409
Administration & insurance reserves 479,277 - - 1,905 481,182
Economic emergency 174,455 - - - 174,455
Infrastructure 115,279 - - 8,268 123,547
Debt service 42,439 - - - 42,439
Technology 34,158 - - 1,335 35,493
Groundwater, soil & air protection 33,511 - - - 33,511
Tax relief 28,816 - - - 28,816
Medical assistance 28,776 - - - 28,776
Disaster relief 23,213 - - - 23,213
Emergency 911 services 20,500 - - - 20,500
Commerce 18,453 - - - 18,453
Underground storage tanks 16,564 - - - 16,564
Railroads 15,492 - - - 15,492
Natural resources 15,173 - - - 15,173
Workforce 15,139 - - - 15,139
Justice 14,993 - - - 14,993
Recreational facilities 12,173 - - - 12,173
K-12 education 10,627 - - - 10,627
Higher education 6,620 - - 61 6,681
Agriculture - - - 6,193 6,193
Unclaimed property 5,857 - - - 5,857
Fish & wildlife 5,655 - - - 5,655
Water quality 5,462 - - - 5,462
Veterans 5,455 - - - 5,455
Soil conservation 4,322 - - - 4,322
Renewable fuels 3,375 - - - 3,375
Community based corrections 2,740 - - - 2,740
Livestock 2,479 - - - 2,479
Other:
Justice & public defense 2,669 - - 2,028 4,697
Education 4,086 - - 8 4,094
Transportation 1,525 - - 1,421 2,946
Administration & regulation 1,959 - - 832 2,791
Human services 297 - - 1,659 1,956
Agriculture & natural resources 756 - - 328 1,084
Health & human rights 766 - - - 766
Economic development 162 - - - 162
Total committed 1,676,632 - - 24,038 1,700,670
Unassigned (273,102) - (305,002) (13) (578,117)
TOTAL FUND BALANCES 2,309,641$ 387,541$ (305,002)$ 90,422$ 2,482,602$
98

STATE OF IOWA
NOTES TO THE FINANCIAL STATEMENTS
Stabilization Arrangements (Reserve Funds)
The State maintains two reserve funds: the Cash Reserve Fund and the Iowa Economic Emergency Fund. These funds were established by formal action of the highest level of decision making authority as they were created by legislation passed by both the House and Senate of the Legislature and signed by the Governor. The law restricts the use and purpose of each fund. Formal action is required to use resources in the funds, modify their purpose or change the balances of the funds. Fund balances for both funds are included in the committed spendable fund balance classification.
The Cash Reserve Fund is separate from the General Fund of the State and is not to be considered part of the General Fund of the State except in determining the cash position of the State. The moneys in the Cash Reserve Fund cannot be transferred, used, obligated, appropriated or otherwise encumbered except as provided under Iowa Code section 8.56. Interest or earnings on moneys deposited in the Cash Reserve Fund are credited to the Rebuild Iowa Infrastructure Fund. Moneys in this fund may be used for cash flow purposes provided that moneys so allocated are returned to the Cash Reserve Fund by the end of each fiscal year. The maximum balance of the fund is equal to 7.5% of the adjusted revenue estimated for the General Fund of the State for the current fiscal
year. The moneys in this fund may only be appropriated by the General Assembly for nonrecurring emergency
expenditures and shall not be appropriated for payment of any collective bargaining agreement or arbitrator’s decision negotiated or awarded. The balance in the Cash Reserve Fund may be used in determining the cash position of the General Fund of the State for payment of state obligations. An appropriation shall not be made from the Cash Reserve Fund if the appropriation would cause the fund’s balance to be less than 3.75% of the adjusted revenue estimate for the year for which the appropriation is made unless the bill or joint resolution is approved by vote of at least three-fifths of the members of both chambers of the General Assembly and is signed by the Governor. Also, the appropriation must be contained in a bill or joint resolution in which the appropriation is the only subject matter of the bill or joint resolution, and the bill or joint resolution states the reasons the appropriation is necessary.
The Iowa Economic Emergency Fund is separate from the General Fund of the State and the fund is not to be considered part of the balance of the General Fund of the State. The moneys in the fund do not revert to the General Fund. The maximum balance of the fund is equal to 2.5% of the adjusted revenue estimate for the fiscal year. If the amount of moneys in the Iowa Economic Emergency Fund is equal to the maximum balance, moneys in excess of this amount shall be distributed as follows: (1) the first sixty million dollars of the difference between the actual net revenue for the General Fund of the State and the adjusted revenue estimate for the fiscal year shall be transferred to the Taxpayers Trust Fund established in Iowa Code section 8.57E; (2) the remainder of the excess, if any, shall be transferred to the General Fund of the State. The moneys in this fund may be appropriated by the General Assembly for emergency expenditures; and there is appropriated to the Executive Council an amount sufficient to pay expenses authorized by the Executive Council in Iowa Code section 7D.29. However, except as provided in Iowa Code section 8.58, the balance in the Iowa Economic Emergency Fund may be used in determining the cash position of the General Fund of the State for payment of state obligations. Interest or earnings on moneys deposited in the Iowa Economic Emergency Fund are credited to the Rebuild Iowa Infrastructure Fund established in Iowa Code section 8.57.6.
Minimum Fund Balance Requirements
Currently, the State has six governmental funds which are required by statute, federal regulations or bonding requirements to maintain minimum fund balances. However, the State does not have a formally adopted policy regarding minimum fund balances.
99

STATE OF IOWA
NOTES TO THE FINANCIAL STATEMENTS
NOTE 13 – OPERATING LEASES
The State has leased office space and equipment. These leases have been classified as operating leases and expire before June 30, 2043. In most cases, management expects the leases will be renewed or replaced by other leases.
A. Primary Government
Governmental Activities
The future minimum lease payments for these leases are as follows (expressed in thousands):
Year Ending
June 30,
2016 12,178$
2017 9,647
2018 6,393
2019 4,236
2020 2,806
2021-2025 2,541
2026-2030 323
2031-2035 331
2036-2040 357
Thereafter 71
Total 38,883$
All leases contain nonappropriation clauses indicating continuation of the lease is subject to funding by the Legislature. Minimum payments have not been reduced by minimum sublease rentals of $1,838,862.
Rental expense for the year ended June 30, 2015 for all operating leases, except those with terms of a month or less that were not renewed, totaled $15,135,605. Rental expense has not been adjusted for sublease rentals totaling $491,522 for the year ended June 30, 2015.
Business-type Activities
The future minimum lease payments for these leases are as follows (expressed in thousands):
Year Ending
June 30,
2016 21,211$
2017 19,218
2018 11,963
2019 9,255
2020 7,474
2021-2025 30,313
2026-2030 23,837
Thereafter 4,939
Total 128,210$
Minimum payments have not been reduced by minimum sublease rentals of $9,000.
Rental expense for the year ended June 30, 2015 for all operating leases, except those with terms of a month or less that were not renewed, totaled $16,150,767. Rental expense has not been adjusted for sublease rentals totaling $4,000 for the year ended June 30, 2015.
100

STATE OF IOWA
NOTES TO THE FINANCIAL STATEMENTS
B. Component Units
The future minimum lease payments for these leases are as follows (expressed in thousands):
Year Ending
June 30,
2016 3,251$
2017 2,487
2018 2,240
2019 2,056
2020 1,785
Thereafter 1,950
Total 13,769$
Minimum payments have not been reduced by minimum sublease rentals of $77,940.
Rental expense for the year ended June 30, 2015 for all operating leases, except those with terms of a month or less that were not renewed, totaled $2,816,457. Rental expense has not been adjusted for sublease rentals totaling $62,355 for the year ended June 30, 2015.
NOTE 14 – LESSOR OPERATING LEASES
The Iowa Department of Natural Resources leases tracts of land for agricultural purposes valued at $11,433,856. Glenwood Resource Center leases building space valued at $4,622,860. Iowa Public Television leases antenna and building space, the Iowa Department of Workforce Development leases building space, and the Iowa Communications Network leases fiber optic cables, for which no value has been assigned to the leased portions. The Iowa Department of Transportation leases land and office space valued at $2,309,931. Iowa State University leases building space valued at $760,589 (net of accumulated depreciation of $294,720), tower space valued at $381,005 (net of accumulated depreciation of $116,883), equipment with an original value of $616,281 and tracts of land for agricultural purposes valued at $161,676. The University of Northern Iowa leases buildings valued at $803,260 (net of accumulated depreciation of $526,972), tower space and tracts of land for agricultural purposes valued at $523,155. The Iowa Braille & Sight Saving School leases buildings valued at $5,144,162 (net of accumulated depreciation of $1,941,046).
The following is a schedule by year of minimum future rentals on operating leases as of June 30, 2015 (expressed
in thousands):
Year Ending
June 30,
2016 4,573$
2017 3,699
2018 2,511
2019 1,156
2020 790
2021-2025 1,838
2026-2030 630
Thereafter 396
Total 15,593$
101

STATE OF IOWA
NOTES TO THE FINANCIAL STATEMENTS
NOTE 15 – PENSION PLANS
A. Summary of Significant Accounting Policies & Pension Totals
Pensions
The financial statements of the Iowa Public Employees’ Retirement System (IPERS), Peace Officers’ Retirement, Accident and Disability System (PORS) and the Judicial Retirement System (JRS) are prepared using the accrual basis of accounting. Plan member contributions are recognized in the period in which the contributions are due. Employer contributions to each plan are recognized when due and the employer has made a formal commitment to provide contributions. Benefits, refunds and annuities are recognized when due and payable in accordance with the terms of each plan.
Deferred Outflows and Inflows of Resources Related to Pensions
Deferred outflows of resources represent a consumption of net position that applies to a future period(s) and will not be recognized as an outflow of resources (expense/expenditure) until then. Deferred outflows of resources
related to pensions consist of unrecognized items not yet charged to pension expense and contributions from the employer after the measurement date but before the end of the employer’s reporting period. Deferred inflows of resources represent an acquisition of net position that applies to a future period(s) and will not be recognized as
an inflow of resources (revenue) until that time. Deferred inflows of resources related to pensions consist of the unamortized portion of the net difference between projected and actual earnings on pension plan investments.
Method Used to Value Investments
IPERS – All investments are reported at fair value. The determination of fair value is generally based on published market prices and quotations from major investment brokers. Investments not having quoted market prices have been valued based on yields and maturities currently available on comparable securities of similar issue. Fair values for real estate investments are based on periodic assessments or appraisals of the underlying investments. Futures contracts are valued daily with the resulting adjustment recorded as realized gains/losses arising from the daily settlement of the variation margin. Private equities are valued based on March 31 net position values plus or minus purchases, sales and cash flows from April 1 through June 30 of the reporting year.
The System has no investment in any specific stock or bond issues of any commercial or industrial organization, other than the U.S. government and its instrumentalities, whose fair value exceeds 5% of the plan net position available for benefits.
PORS and JRS – Investments are reported at fair value. Short-term investments are reported at cost, which approximates fair value. Securities traded on a national or international exchange are valued at the last reported sales price at current exchange rates. Mortgages are valued on the basis of future principal and interest payments and are discounted at prevailing interest rates for similar instruments. Investments that do not have an established market are reported at estimated fair value. For JRS, the fair value of real estate investments is based on independent appraisals.
PORS’ and JRS’ investments in governmental bonds and treasury notes constitute approximately 4.53% and 5.07%, respectively, of total assets. PORS and JRS are not permitted to invest more than 4.90% and 5.00%, respectively, of their System accounts in any one corporate issuer without written direction and approval of the Treasurer of State of Iowa.
Pension Totals
At June 30, 2015, the State of Iowa recognized the following amounts related to pensions in financial statements prepared using the economic resources measurement focus and accrual basis of accounting (expressed in
thousands):
IPERS - Discretely
IPERS - Primary Presented
Government Component Units PORS JRS TOTAL
Net pension liability 674,583$ 12,972$ 124,028$ 22,279$ 833,862$
Deferred outflows of resources related to pensions 170,251 2,663 7,619 3,346 183,879
Deferred inflows of resources related to pensions 336,457 5,365 5,593 5,331 352,746
Pension expense for the period associated with net
pension liabilities 53,781 873 16,938 5,047 76,639
Cost-sharing, Multiple-employer Single-employer
Defined Benefit
102

STATE OF IOWA
NOTES TO THE FINANCIAL STATEMENTS
B. Pension Plans
Iowa Public Employees’ Retirement System (IPERS)
General Information about the Plan
Plan Description. IPERS, a public employee retirement system, was created in 1953 by the Iowa Legislature. IPERS benefits are established under Chapter 97B of the Iowa Code. IPERS is the administrator of the cost-sharing, multiple-employer, contributory defined benefit public employee retirement system.
Participation in IPERS is mandatory for most state, county and local public employees, employees of school districts and certain elected officials. Membership is optional for some individuals, including the members of the Iowa Legislature. At June 30, 2015, IPERS had 1,845 public employers with 167,367 active members contributing to the system.
Plan Membership.
2015 2014
Inactive employees or beneficiaries currently receiving benefits 111,368 108,233
Inactive employees entitled to but not yet receiving benefits 67,374 72,267
Active employees 167,367 165,913
Total 346,109 346,413
Fiscal Years Ended June 30,
IPERS has three membership classes: (1) regular, (2) sheriffs and deputies, and (3) protection occupation.
Each membership class has different retirement benefits and contribution rates. The regular membership accounts for approximately 95% of all members. The sheriffs and deputies membership and protection occupation membership are classified as special service members as they work in public safety occupations and tend to have shorter careers because of the physical demands of their jobs.
Vested members are entitled to rights under IPERS. Prior to July 1, 2012, a regular member was vested after completing four years of covered service or when they reached the age of 55 while in IPERS-covered employment. Beginning on July 1, 2012, a member is vested after seven years of covered service or they reach the age of 65 while in IPERS-covered employment. Special service members (sheriffs/deputies and protection occupation members) are vested if they have completed four years of covered service or reach the age of 55 while in covered employment.
Benefits Provided. Upon retirement an IPERS member may choose from six benefit options. Each option provides a lifetime benefit for the member. The amount of the member’s benefits and the amount and availability of death benefits vary according to the option selected. Once a benefit option is selected, the member’s monthly benefit is calculated and remains the same for the rest of the member’s lifetime. If a member began receiving benefits before July 1, 1990, a guaranteed dividend is included with the November benefit payment. This dividend was established and defined in Iowa Code section 97B.49F(1)(b).
Regular members receive full benefits when they retire at the normal retirement age, which occurs: (1)
when the member’s years of service plus their age equals or exceeds 88, (2) any time after reaching age 62 with 20 or more years of covered employment, or (3) at age 65. Regular members cannot receive retirement benefits before age 55. If members retire prior to normal retirement age there is a permanent early-retirement reduction applied to the monthly benefit. Members who are age 70 and still working for
an IPERS-covered employer may apply to receive IPERS retirement benefits while still employed.
Monthly benefits are equal to a member’s highest five-year average salary multiplied by a percentage based on years of service, up to a maximum of 65 percent. Members with service before June 30, 2012, the highest three-year average salary as of that date will be used if it is greater than the highest five-year average salary. An early-retirement reduction will be applied if a member receives benefits before normal retirement age. For service earned through June 30, 2012, the early-retirement reduction is 0.25 percent per month (3 percent per year) benefits are received before the earliest normal retirement age. For service earned on or after July 1, 2012, the reduction increases to 0.50 percent per month (6 percent per year) benefits are received before the member reaches age 65.
103

STATE OF IOWA
NOTES TO THE FINANCIAL STATEMENTS
Special service members have different retirement eligibility requirements than regular members.
Sheriffs and deputies are eligible for retirement benefits at age 50 if they have 22 years of qualified service. A protection occupation member is eligible for retirement benefits if they are vested, no longer working for an IPERS-covered employer, and reach age 55. Both special service member classes are eligible for monthly benefits equal to the average of the highest three years’ salary multiplied by a percentage based on years of service, up to a maximum of 72 percent.
Disability Benefits. A vested member that is awarded federal Social Security disability or Railroad Retirement disability benefits is eligible to claim IPERS benefits regardless of age. Disability benefits are not reduced for early retirement. Special service members that retire due to a disability may be eligible for regular member or special service member disability benefits.
Death Benefits. If a member dies before retirement, their designated beneficiary may receive a lump-sum payment based on the greater of two formulas: (1) actuarial present value of the member’s accrued benefit as of the date of death, or (2) actual years of service divided by either 30 years for a regular member/22 years for special service member multiplied by member’s highest annual covered wage multiplied by the member’s
accumulated contributions. If the member’s beneficiary is a sole individual, they will be offered either a lump sum or life time annuity. If a member dies after retirement, the beneficiary is paid according to the benefit option selected by the member at the time of retirement.
Contributions. A valuation of the liabilities and reserves of the IPERS Trust Fund is performed annually by
IPERS’ actuary in accordance with Iowa Code Section 97B.4(4)(d). The actuary also calculates an actuarial contribution rate for each membership group, which is the contribution rate necessary to fully fund the benefits provided under Iowa Code chapter 97B.
IPERS’ Contribution Rate Funding Policy requires that the actuarial contribution rate be determined using the entry age normal actuarial cost method and the actuarial assumptions and methods approved by the IPERS Investment Board. The actuarial contribution rate covers normal cost plus the unfunded actuarial liability payment based on a 30-year closed amortization period. The payment to amortize the unfunded actuarial liability is determined as a level percentage of payroll, based on the actuarial amortization method adopted by the Investment Board.
Although the actuarial contribution rates are calculated each year for all three membership groups, the required contribution rates for the Regular membership were set in law through June 30, 2012. From fiscal year 2002 through fiscal year 2013, the rate required was less than the actuarial rate, in spite of rate increases passed by the Iowa Legislature in 2006 and 2010. Effective July 1, 2012, as a result of a 2010 law change, the contribution rates are established by IPERS following the annual actuarial valuation, which applies IPERS’ Contribution Rate Funding Policy and actuarial amortization method. Iowa Statute limits the amount rates can vary to 1 percentage point each year.
Iowa statute authorizes the required contribution rate for certain members and employers engaged in law enforcement, fire safety and protection occupations to be set to the actuarial contribution rate. Therefore, these groups have consistently paid the rate needed to fully fund their benefits.
In fiscal year 2015, the contribution rates for all members exceeded the actuarial rates.
Employee Employer Total
Regular members 5.95% 8.93% 14.88%
Sheriffs and deputies 9.88% 9.88% 19.76%
Protection occupation members 6.76% 10.14% 16.90%
Fiscal Year 2014 and 2015
Contributions are remitted by participating employers. Wages were covered up to the Internal Revenue Code section 401(a)(17) compensation limit of $260,000 for calendar year 2014 and $265,000 for calendar year 2015. There are no non-employer contributing entities at IPERS.
The State’s employer contributions to IPERS for the years ended June 30, 2015 and 2014 were $121,714,554 and $121,167,983, respectively.
104

STATE OF IOWA
NOTES TO THE FINANCIAL STATEMENTS
Actuarial Methods and Assumptions. The total pension liability was determined by an actuarial valuation as of June 30, 2014, using the following actuarial assumptions and the entry age normal actuarial cost method.
Inflation rate: 3.00%
Assumed investment return: 7.50%
Projected salary increases: 4.00% – 17.00% depending upon years of service
Wage growth: 4.00%
Mortality rates were based on the RP-2000 Generational Mortality Tables, with age setbacks and age set forwards as well as other adjustments based on different membership groups. Future mortality improvements are anticipated using Projection Scale AA. Different adjustments apply to pre-retirement verses post-retirement verses post-disability mortality tables. Pre-retirement mortality rates were based on the RP-2000 Employee Table, post-retirement mortality rates were based on the RP-2000 Healthy Annuitant Table, and post-disability mortality rates were based on the RP-2000 Disabled Mortality Table.
The actuarial assumptions used in the June 30, 2014 valuation are based on the results of the most recent actuarial experience study, which covered the four-year period ending June 30, 2013. That experience study report is dated May 27, 2014.
The long-term actuarial assumed investment return reflects the anticipated returns on current and future plan assets. It provides a discount rate to determine the present value of future benefit payments. The actuarial assumed investment return is reviewed as part of the experience studies prepared for the System by IPERS’ actuary. The most recent analysis, performed for the period covering fiscal years 2010 through 2013, is outlined in a report dated May 24, 2014. Several factors are considered in evaluating the actuarial assumed
investment return including long term historical data, estimates inherent in current market data, and a log-normal distribution analysis in which best-estimate ranges of expected future real rates of return (expected return, net of investment expense and inflation) were developed by the investment consultant for each major asset class. These ranges were combined to produce the actuarial assumed investment return by weighting the expected future real rates of return by the target asset allocation percentage and then adding expected inflation. The capital market assumptions developed by the investment consultant are intended for use over a 10-year horizon and may not be useful in setting the actuarial assumed investment return for funding pension plans, which cover a longer timeframe. The assumption is intended to be a long-term assumption and is not expected to change absent a significant change in the asset allocation, a change in the inflation assumption, or a fundamental change in the market that alters expected returns in future years.
Best estimates of arithmetic real rates of return for each major asset class included in IPERS’ target asset allocation as of June 30, 2014, are shown in the following table:
Asset Class
Core-plus fixed income 28.00% 2.06%
Domestic equity 23.00% 6.31%
International equity 15.00% 6.76%
Private equity/debt 13.00% 11.34%
Credit opportunities 5.00% 3.67%
Real estate 8.00% 3.52%
U.S. TIPS 5.00% 1.92%
Other real assets 2.00% 6.27%
Cash 1.00% -0.69%
Total 100.00%
Target Allocation Real Rate of Return
Long-Term Expected
Discount Rate. The discount rate used to measure the total pension liability was 7.50%. The projection of cash flows used to determine the discount rate assumed plan contributions from members and the State will be
made according to the current Contribution Rate Funding Policy. That policy is currently: (1) employee contributions are 40% of the required contribution rate for regular and protection occupation members and 50% of the required contribution rate for sheriffs and deputies; and (2) employer contributions are 60% of the
105

STATE OF IOWA
NOTES TO THE FINANCIAL STATEMENTS
required contribution rate for regular and protection occupation members and 50% of the required contribution rate for sheriffs and deputies. Based on those assumptions, the pension fiduciary net position was projected to be available to make all projected future benefit payments of current members. Therefore, the long-term expected rate of return on plan assets was applied to all period of projected benefit payments to determine the net pension liability. The municipal bond rate was not used in determining the discount rate, but if it were required, the rate would have been 4.35%. The projected future benefit payments for all current plan members were projected through 2113.
The components of the IPERS’ total net pension liability (NPL) at June 30 are (expressed in thousands):
2015 2014
Total pension liability 33,370,319$ 32,004,456$
Plan fiduciary net position 28,429,835 28,038,550
Employers' net pension liability 4,940,484$ 3,965,906$
Plan fiduciary net position as a
percentage of the total pension
liability 85.19% 87.61%
The NPL increased in 2015 due to lower than expected earnings as of June 30, 2015. The impact to the State of Iowa is unknown at this time.
IPERS issues a publicly available financial report that includes financial statements and required supplementary information. That report may be obtained by writing to IPERS, P.O. Box 9117, Des Moines, IA 50306-9117, at [email protected], or by calling 515-281-0020.
Pension Plan Fiduciary Net Position. Detailed information about the pension plan’s fiduciary net position is
available in the separately issued IPERS financial report, as well as the fiduciary combining statements (see page 180).
State of Iowa Proportionate Share of the Collective Net Pension Liability Assumptions and Inputs
At June 30, 2015, the State reported a total liability of $687.6 million, with $674.6 million in the primary government and $13.0 million in the discretely presented component units, for its proportionate share of the net pension liability. The net pension liability was measured as of June 30, 2014, and the total pension liability as of June 30, 2014, used to calculate the net pension liability was determined based on the June 30, 2014 actuarial valuation for funding, dated October 29, 2014.
The State’s proportion of the net pension liability was based on a projection of the State’s long-term share of contributions to the pension plan relative to the projected contributions of all participating employers, actuarially determined. At June 30, 2014, the State’s total proportion was 17.336588% (17.009515% in the primary government and 0.327073% in the discretely presented component units). This was a decrease of 0.924888% from the State’s total proportion (decrease of 0.926911% in the primary government and 0.002023% in the discretely presented component units), measured as of June 30, 2013.
For the year ended June 30, 2015, the State recognized IPERS pension expense of $53.8 million for the primary government and $0.9 million for the discretely presented component units. The State also reported deferred outflows of resources and deferred inflows of resources related to IPERS pensions from the following sources:
Primary Discretely Presented
Government Component Units Total
Differences between expected and actual experience 7,752$ 141$ 7,893$
Changes in assumptions 31,478 571 32,049
Changes in proportion and differences between
contributions and proportionate share of contributions 9,306 - 9,306
Contributions subsequent to the measurement date 121,715 1,951 123,666
Total 170,251$ 2,663$ 172,914$
Deferred Outflows of Resources (expressed in thousands)
106

STATE OF IOWA
NOTES TO THE FINANCIAL STATEMENTS
Primary Discretely Presented
Government Component Units Total
Differences between expected and actual experience 3,486$ -$ 3,486$
Changes in assumptions 83 - 83
Net difference between projected and actual earnings on
pension plan investments 310,061 4,946 315,007
Changes in proportion and differences between
contributions and proportionate share of contributions 22,827 419 23,246
Total 336,457$ 5,365$ 341,822$
Deferred Inflows of Resources (expressed in thousands)
The primary government and discretely presented component units reported deferred outflows of resources relating to pensions of $121.7 million and $2.0 million, respectively, as a result of employer contributions subsequent to the measurement date which will be recognized as a reduction of net pension liability in the year ended June 30, 2016. Amounts reported as deferred outflows of resources and deferred inflows of resources related to pensions will be recognized in pension expense as follows (expressed in thousands):
Year Ending Primary Discretely Presented
June 30, Government Component Units Total
2016 (72,342)$ (1,168)$ (73,510)$
2017 (72,342) (1,168) (73,510)
2018 (72,342) (1,168) (73,510)
2019 (72,342) (1,168) (73,510)
2020 1,447 19 1,466
Total (287,921)$ (4,653)$ (292,574)$
Sensitivity Analysis. The State’s proportionate share of the net pension liability was calculated using a discount
rate of 7.50%, as well as a discount rate that is 1 percentage point lower (6.50%) or 1 percentage point higher (8.50%) than the current rate. The sensitivity of the State’s proportionate share of the net pension liability to changes in the discount rate is presented below (expressed in thousands):
Current
1% Decrease Discount Rate 1% Increase
(6.50%) (7.50%) (8.50%)
State's proportionate share of the net pension liability:
Primary government 1,388,520$ 674,583$ 72,060$
Discretely presented component units 24,509 12,972 3,232
Total 1,413,029$ 687,555$ 75,292$
Payables to the Pension Plan
At June 30, 2015, the State of Iowa reported payables of $3.6 million for legally required employer contributions and $2.4 million for legally required employee contributions which had been withheld from employee wages but not yet remitted to IPERS.
107
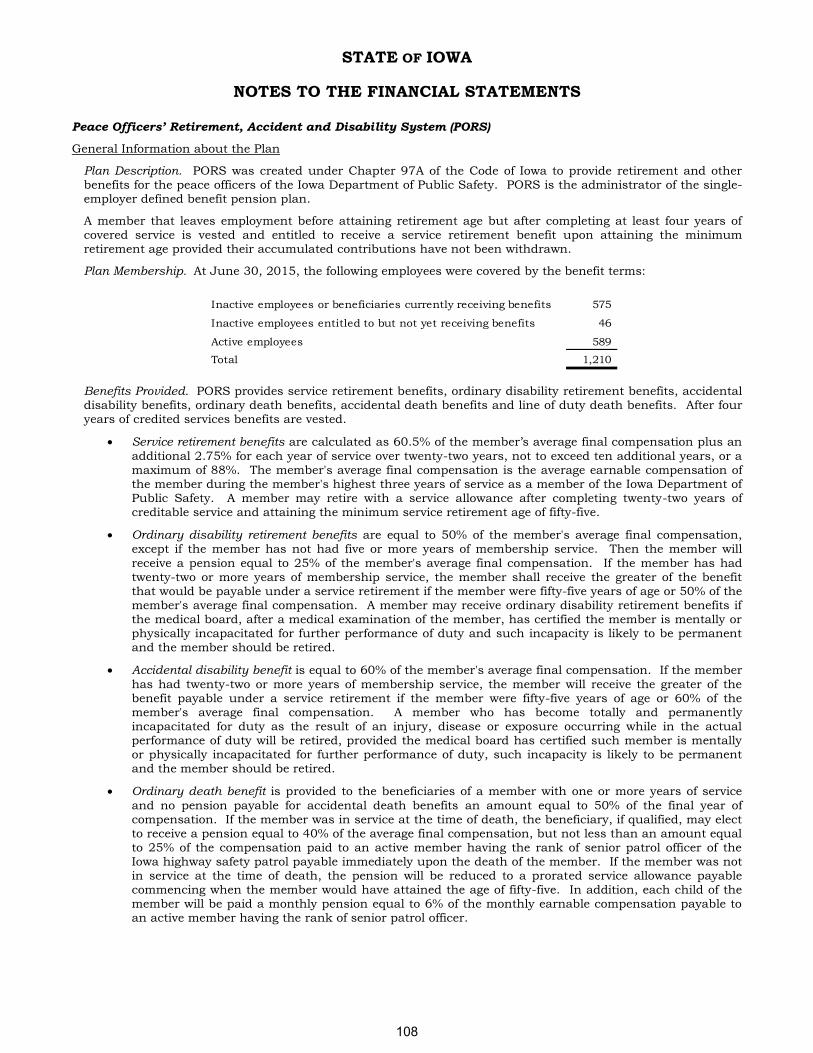
STATE OF IOWA
NOTES TO THE FINANCIAL STATEMENTS
Peace Officers’ Retirement, Accident and Disability System (PORS)
General Information about the Plan
Plan Description. PORS was created under Chapter 97A of the Code of Iowa to provide retirement and other benefits for the peace officers of the Iowa Department of Public Safety. PORS is the administrator of the single-employer defined benefit pension plan.
A member that leaves employment before attaining retirement age but after completing at least four years of covered service is vested and entitled to receive a service retirement benefit upon attaining the minimum retirement age provided their accumulated contributions have not been withdrawn.
Plan Membership. At June 30, 2015, the following employees were covered by the benefit terms:
Inactive employees or beneficiaries currently receiving benefits 575
Inactive employees entitled to but not yet receiving benefits 46
Active employees 589
Total 1,210
Benefits Provided. PORS provides service retirement benefits, ordinary disability retirement benefits, accidental disability benefits, ordinary death benefits, accidental death benefits and line of duty death benefits. After four years of credited services benefits are vested.
Service retirement benefits are calculated as 60.5% of the member’s average final compensation plus an
additional 2.75% for each year of service over twenty-two years, not to exceed ten additional years, or a maximum of 88%. The member's average final compensation is the average earnable compensation of the member during the member's highest three years of service as a member of the Iowa Department of Public Safety. A member may retire with a service allowance after completing twenty-two years of creditable service and attaining the minimum service retirement age of fifty-five.
Ordinary disability retirement benefits are equal to 50% of the member's average final compensation, except if the member has not had five or more years of membership service. Then the member will
receive a pension equal to 25% of the member's average final compensation. If the member has had twenty-two or more years of membership service, the member shall receive the greater of the benefit that would be payable under a service retirement if the member were fifty-five years of age or 50% of the member's average final compensation. A member may receive ordinary disability retirement benefits if the medical board, after a medical examination of the member, has certified the member is mentally or physically incapacitated for further performance of duty and such incapacity is likely to be permanent and the member should be retired.
Accidental disability benefit is equal to 60% of the member's average final compensation. If the member
has had twenty-two or more years of membership service, the member will receive the greater of the benefit payable under a service retirement if the member were fifty-five years of age or 60% of the member's average final compensation. A member who has become totally and permanently incapacitated for duty as the result of an injury, disease or exposure occurring while in the actual performance of duty will be retired, provided the medical board has certified such member is mentally or physically incapacitated for further performance of duty, such incapacity is likely to be permanent and the member should be retired.
Ordinary death benefit is provided to the beneficiaries of a member with one or more years of service
and no pension payable for accidental death benefits an amount equal to 50% of the final year of compensation. If the member was in service at the time of death, the beneficiary, if qualified, may elect to receive a pension equal to 40% of the average final compensation, but not less than an amount equal to 25% of the compensation paid to an active member having the rank of senior patrol officer of the Iowa highway safety patrol payable immediately upon the death of the member. If the member was not in service at the time of death, the pension will be reduced to a prorated service allowance payable commencing when the member would have attained the age of fifty-five. In addition, each child of the member will be paid a monthly pension equal to 6% of the monthly earnable compensation payable to an active member having the rank of senior patrol officer.
108

STATE OF IOWA
NOTES TO THE FINANCIAL STATEMENTS
Accidental death benefit is payable to the member’s surviving spouse, children or dependent parent
upon the death of a member as a result of an accident or exposure occurring in the performance of duty in an amount equal to 50% of the average final compensation of the member. If there is a surviving spouse, each child of a member will be paid a monthly pension equal to 6% of the monthly earnable compensation payable to an active member having the rank of senior patrol officer. If there is no surviving spouse, children or dependent parent, the death will be treated as an ordinary death and the benefit will be payable to the member's estate.
Line of duty death benefit is provided upon the receipt of evidence and proof the death of a member in
service was the direct and proximate result of a traumatic personal injury incurred in the line of duty, the person authorized to receive an accidental death benefit will receive a lump sum payment equal to $100,000.
Adjustments to Benefits. All benefits payable to retired members and to beneficiaries, except children of a deceased member, are adjusted on July 1 and January 1, for changes in salary scales. An amount equal to a percentage of the difference between the monthly earnable compensation payable to an active member of the
same rank and position in the salary scale as was held by the retired or deceased member at the time of the member’s retirement or death, for July of the current year less that of the preceding July will be added to the monthly benefit of each member as follows:
40% for members receiving a service retirement allowance, beneficiaries receiving an accidental death
benefit, members with five or more years of membership who are receiving an ordinary disability benefit, and members receiving an accidental disability benefit.
24% for members with less than five years of membership who are receiving an ordinary disability
benefit and for beneficiaries receiving an ordinary death benefit.
Surviving spouses of retirees receive 50% of the amounts above, as applicable, but the amount shall not be less than 25% of the monthly earnable compensation paid to an active member having the rank of
senior patrol officer.
For each adjustment occurring on July 1, an additional fixed amount is added to the initial monthly pension based on the years since the member retired: 0-4 years $15; 5-9 years $20; 10-14 years $25; 15-19 years $30; and 20 or more years $35.
Surviving children’s pensions are adjusted each July to equal 6% of monthly earnable compensation payable to an active member having the rank of senior patrol officer of the state patrol.
Contributions. Contributions to the System were made pursuant to Chapter 97A of the Code of Iowa and were not based upon actuarial determinations. Therefore, actual contributions differ from the annual required contribution. The member contribution rate increased 0.05% to 11.4% on July 1, 2014 to cover the cost of cancer and infectious disease presumption. Employer contribution rate increased to 31% for plan year 2015 and will increase 2% each year until reaching 37%. In addition, the State of Iowa contributed an additional $5 million and will continue the supplemental contribution until the funded status of the System attains 85%. Contribution provisions are established by State law and may be amended only by the State Legislature. The State of Iowa has historically followed a contribution policy of appropriating funds based upon a percentage of the current salaries for which funds are appropriated.
The member contribution required and contributed was $4,991,460, representing 11.40% of the current year covered payroll. The State contribution required by statute and the amount actually contributed was $18,600,759. $5,000,000 of the State contribution was an annual appropriation, which was in addition to the required employer 31% contribution rate. Costs of administering the plan are financed through employer
contributions and investment income.
An actuarial valuation of the System’s assets and liabilities is required at least once every two years per Chapter 97A of the Code of Iowa.
PORS issues a publicly available financial report that includes financial statements and required supplementary information. That report may be obtained by writing to the Iowa Department of Public Safety Peace Officers’ Retirement System, Public Safety Building, 215 East 7th Street, Des Moines, IA 50319 or at
109

STATE OF IOWA
NOTES TO THE FINANCIAL STATEMENTS
Net Pension Liability
The net pension liability was measured as of June 30, 2015, and the total pension liability used to calculate the net pension liability was determined by an actuarial valuation as of that date.
Actuarial Assumptions. The total pension liability was determined by an actuarial valuation as of July 1, 2015, using the following actuarial assumptions and the entry age normal actuarial cost method, applied to all periods included in the measurement:
Inflation: 3.00%
Salary increases: 4.25% to 7.25%, including inflation
Investment rate of return: 8.00% compounded annually, net of investment expense, and including inflation
Pre-retirement mortality rates were based on the RP-2000 Mortality Table for Employees, Male and Female, with
Generational Projection. Post-retirement mortality rates were based on the RP-2000 Mortality Table for Healthy
Annuitants, Male and Female, with Generational Projection. Disability mortality rates were based on the RP-2000 Mortality Table for Healthy Annuitants, Male and Female, with a 5-year set forward and Generational Projection.
The actuarial assumptions used in the July 1, 2015 valuation are based on the results of the most recent actuarial experience study, which covered the five year period ending June 30, 2011. The experience study report is dated September 10, 2012.
The long-term expected rate of return on pension plan investments is reviewed as part of the experience study. Several factors are considered in evaluating the long term rate of return assumption including the long term historical data, estimates inherent in current market data and a log-normal distribution analysis in which best-estimate ranges of expected future real rates of return (expected returns, net of investment expense and inflation) were developed for each major asset class. These ranges were combined to produce the long-term expected rate of return by weighting the expected future real rates of return by the target asset allocation percentage and then adding expected inflation.
The target allocation and best estimates of arithmetic real rates of return for each major asset class are summarized in the following table:
Asset Class
U.S. stocks (larger capitalization) 25.00% 8.22%
U.S. stocks (small cap growth) 7.50% 10.98%
U.S. stocks (small cap value) 7.50% 10.98%
International equity - developed 18.75% 8.12%
International equity - emerging 6.25% 9.91%
Core-plus fixed income 22.75% 2.76%
High yield fixed income 2.25% 4.82%
Real estate 10.00% 5.80%
Total 100.00%
Target Allocation
Long-Term Expected
Real Rate of Return
Discount Rate. The discount rate used to measure the total pension liability was 8.00%. The projection of cash
flows used to determine the discount rate assumed plan contributions from members and the State will be made at the current contribution rates as set in state statute: (1) employee contribution rate: 11.40%; (2) employer contribution rate: 33.00%, increasing by 2.00% each year until the rate reaches 37.00% in FY 2018; and (3) supplemental state contributions: $5 million until the System is 85% funded. Based on those assumptions, the pension fiduciary net position was projected to be available to make all projected future benefit payments of current members. Therefore, the long-term expected rate of return on plan assets was applied to all period of projected benefit payments to determine the net pension liability. The municipal bond rate was not used in determining the discount rate, but if it were required, the rate would have been 3.82%. The projected future benefit payments for all current plan members were projected through 2114.
110

STATE OF IOWA
NOTES TO THE FINANCIAL STATEMENTS
Sensitivity Analysis. The net pension liability was calculated using a discount rate of 8.00%, as well as a discount rate that is 1 percentage point lower (7.00%) or 1 percentage point higher (9.00%) than the current rate. The sensitivity of the net pension liability to changes in the discount rate is presented below (expressed in thousands):
Current
1% Decrease Discount Rate 1% Increase
(7.00%) (8.00%) (9.00%)
Net pension liability 193,500$ 124,028$ 66,330$
Pension Plan Fiduciary Net Position. Detailed information about the pension plan’s fiduciary net position is available in the separately issued PORS financial report, as well as the fiduciary combining statements (see page 180).
Changes in the Net Pension Liability
Total Plan Fiduciary Net
Pension Liability Net Position Pension Liability
(a) (b) (a) - (b)
Balances at June 30, 2014 515,860$ 392,195$ 123,665$
Changes for the year:
Service cost 11,847 - 11,847
Interest 40,222 - 40,222
Difference between expected and
actual experience (6,609) - (6,609)
Contributions - employer - 18,601 (18,601)
Contributions - employee - 4,991 (4,991)
Net investment income - 21,722 (21,722)
Benefit payments including refunds
of employee contributions (26,693) (26,693) -
Administrative expense - (217) 217
Net changes 18,767 18,404 363
Balances at June 30, 2015 534,627$ 410,599$ 124,028$
Increase (Decrease) Expressed in Thousands
Change in Benefit Terms. The 2014 Legislature passed House File 2450 which provided that cancer and infectious disease, as defined in this bill, would be presumed to have been contracted while the employee was on active duty as a result of that duty. The presumption means that such members will be eligible for an accidental disability benefit rather than ordinary disability benefit. The employee contribution rate increased 0.05% to cover the cost of the benefit change.
Pension Expense and Deferred Outflows of Resources and Deferred Inflows of Resources Related to Pensions
For the year ended June 30, 2015, the State of Iowa recognized pension expense related to the System of $16.9 million. At June 30, 2015, the State reported deferred outflows of resources and deferred inflows of resources
related to pensions for the System from the following sources (expressed in thousands):
Deferred Outflows Deferred Inflows
of Resources of Resources
Differences between expected and actual experience -$ 5,593$
Net difference between projected and actual earnings on
pension plan investments 7,619 -
Total 7,619$ 5,593$
111

STATE OF IOWA
NOTES TO THE FINANCIAL STATEMENTS
Amounts reported as deferred outflows of resources and deferred inflows of resources related to pensions will be recognized in pension expense as follows (expressed in thousands):
Year Ending
June 30,
2016 890$
2017 890
2018 890
2019 890
2020 (1,016)
Thereafter (518)
Total 2,026$
There are no non-employer contributing entities to PORS.
Payables to the Pension Plan
At June 30, 2015, the State of Iowa reported payables of $453,826 for legally required employer contributions and $156,776 for legally required employee contributions which had been withheld from employee wages but not yet remitted to PORS.
Judicial Retirement System (JRS)
General Information about the Plan
Plan Description. JRS was created under Chapter 602 of the Code of Iowa to provide pension benefits to judges
serving on the Supreme Court, District Courts and the Court of Appeals. JRS is the administrator of a single-employer defined benefit pension plan.
Plan Membership. At June 30, 2015, the following employees were covered by the benefit terms:
Inactive employees or beneficiaries currently receiving benefits 195
Inactive employees entitled to but not yet receiving benefits 6
Active employees 202
Total 403
Benefits Provided. JRS provides retirement annuities to judges with at least four years of service as a judge of one or more of the above courts and is at least 65 years of age or has served 20 years of consecutive service as a judge of one or more of the above courts and has attained the age of 50.
The annual annuity benefits available under this System are:
Judge - 3.25% of the average annual basic salary for the highest three years as a judge multiplied by the judge’s years of service, not to exceed an amount equal to a specified percentage of the highest basic annual salary the judge received at the time the judge separated from service.
Senior judge – 3.00% (retirement prior to July 1, 2006) or 3.25% (retirement after July 1, 2006) of the basic senior judge salary multiplied by the judge’s years of service, not to exceed an amount equal to a
specified percentage of the basic senior judge salary as of the time the senior judge separated from service. The basic senior judge salary is equal to the highest salary the judge is receiving or received at the time the judge separated from full time service plus 75% of the difference between that salary and
the basic current salary of the office the judge last served as a judge.
The specified percentages to determine maximum annuity benefit for judges and senior judges are: (1) 50% for judges who retired prior to July 1, 1998, (2) 52% for judges who retired and received an annuity on or after July 1, 1998 but before July 1, 2000, (3) 56% for judges who retired and received an annuity on or after July 1, 2000 but before July 1, 2001, (4) 60% for judges who retire and receive an annuity on or after July 1, 2001 but before July 1, 2006, and (5) 65% for judges who retire and received
an annuity on or after July 1, 2006.
112

STATE OF IOWA
NOTES TO THE FINANCIAL STATEMENTS
Disability - any member who has served as a judge for a total of four years or more and is deemed
permanently incapacitated, mentally or physically, to perform his/her duties shall be entitled to an annuity that would be the same as computed under a retirement annuity.
Survivor - annuity is equal to 50% of the amount the retired judge was receiving or would have received
at the time of their death.
Contributions. The contributions to JRS are made pursuant to Section 602.9104 of the Code of Iowa and are not based upon actuarial determinations. Therefore, actual contributions differ from the annual required contribution.
Beginning July 1, 2010, judges contribute to the system at the rate of 9.35% multiplied by the basic salary of the judge. Beginning July 1, 2008, and for each subsequent fiscal year until the System attains fully funded status, the State contributes an amount equal to 30.6% of the basic salary of all covered judges. Commencing with the first fiscal year in which the System attains fully funded status, and for each subsequent fiscal year, the State contribution shall be equal to 60% of the required contribution rate.
The member contribution required and contributed was $2,665,685, representing 9.35% of the current year covered payroll. The State contribution required by statute and the amount contributed was $8,724,008. The State share is to be based on 30.6% of actual salaries. Costs of administering the plan are financed through State appropriation, member contributions and investment income.
An actuarial valuation of the System’s assets and liabilities is required at least once every four years per section 602.9116 of the Code of Iowa.
JRS issues a publicly available financial report that includes financial statements and required supplementary information. That report may be obtained by writing to Judicial Retirement System, Iowa Judicial Branch, 1111 East Court Avenue, Des Moines, IA 50319 or at [email protected].
Net Pension Liability
The net pension liability was measured as of June 30, 2015, and the total pension liability used to calculate the net pension liability was determined by an actuarial valuation as of that date.
Actuarial Assumptions. The total pension liability was determined by an actuarial valuation as of July 1, 2015,
using the following actuarial assumptions and the entry age normal actuarial cost method, applied to all periods included in the measurement:
Inflation: 3.00%
Salary increases: 4.25%, including inflation
Investment rate of return: 7.50% compounded annually, net of investment expense, and including
inflation
Mortality rates were based on the RP-2000 Healthy Annuitant and Employee Mortality Table with generational improvements and a one year age setback.
The actuarial assumptions used in the July 1, 2015 valuation are based on the results of the most recent actuarial experience analysis. The most recent analysis was performed and results provided on September 17, 2013.
The long-term expected rate of return on pension plan investments is reviewed as part of the experience study. Several factors are considered in evaluating the long term rate of return assumption including the long term
historical data, estimates inherent in current market data, and an analysis in which best-estimate ranges of expected future real rates of return (expected returns, net of investment expense and inflation) along with estimates of variability and correlations were developed for each major asset class. These ranges were combined to produce the long-term expected rate of return by weighting the expected future real rates of return by the target asset allocation percentage and then adding expected inflation. The capital market assumptions developed by investment consultants are often intended for use over a 10-year investment horizon and are not always useful in setting the long-term rate of return for funding pension plans which covers a longer timeframe. The long-term rate of return assumption is intended to be a long-term assumption (30 to 50 years) and is not expected to change absent a significant change in the asset allocation, a change in the inflation assumption, or a fundamental change in the market that alters expected returns in future years.
113

STATE OF IOWA
NOTES TO THE FINANCIAL STATEMENTS
The target allocation and best estimates of arithmetic real rates of return for each major asset class are summarized in the following table:
Asset Class
U.S. stocks (larger capitalization) 25.00% 8.22%
U.S. stocks (small cap growth) 7.50% 10.98%
U.S. stocks (small cap value) 7.50% 10.98%
International equity - developed 18.75% 8.12%
International equity - emerging 6.25% 9.91%
Core-plus fixed income 22.75% 2.76%
High yield fixed income 2.25% 4.82%
Real estate 10.00% 5.80%
Total 100.00%
Long-Term Expected
Target Allocation Real Rate of Return
Discount Rate. The discount rate used to measure the total pension liability was 7.50%. The projection of cash flows used to determine the discount rate assumed plan contributions from members and the State will be made at the current contribution rates as set in state statute: (1) employee contribution rate: 9.35% until the plan is fully funded, after which employees will contribute 40% of the actuarially required contribution rate; and (2) employer contribution rate: 30.6% until the plan is fully funded, after which the employer will contribute 60% of the actuarially required contribution rate. Based on those assumptions, the pension fiduciary net position was projected to be available to make all projected future benefit payments of current members. Therefore, the long-term expected rate of return on plan assets was applied to all period of projected benefit payments to determine the net pension liability. The municipal bond rate was not used in determining the discount rate, but if it were required, the rate would have been 3.82%. The projected future benefit payments
for all current plan members were projected through 2114.
Sensitivity Analysis. The net pension liability was calculated using a discount rate of 7.50%, as well as a discount rate that is 1 percentage point lower (6.50%) or 1 percentage point higher (8.50%) than the current rate. The sensitivity of the net pension liability to changes in the discount rate is presented below (expressed in thousands):
Current
1% Decrease Discount Rate 1% Increase
(6.50%) (7.50%) (8.50%)
Net pension liability 40,647$ 22,279$ 6,387$
Pension Plan Fiduciary Net Position. Detailed information about the pension plan’s fiduciary net position is
available in the separately issued JRS financial report, as well as the fiduciary combining statements (see page 180).
114

STATE OF IOWA
NOTES TO THE FINANCIAL STATEMENTS
Changes in the Net Pension Liability
Total Plan Fiduciary Net
Pension Liability Net Position Pension Liability
(a) (b) (a) - (b)
Balances at June 30, 2014 183,916$ 155,974$ 27,942$
Changes for the year:
Service cost 6,438 - 6,438
Interest 13,392 - 13,392
Difference between expected and
actual experience (6,586) - (6,586)
Contributions - employer - 8,724 (8,724)
Contributions - employee - 2,665 (2,665)
Net investment income - 7,533 (7,533)
Benefit payments including refunds
of employee contributions (10,891) (10,891) -
Administrative expense - (15) 15
Net changes 2,353 8,016 (5,663)
Balances at June 30, 2015 186,269$ 163,990$ 22,279$
Increase (Decrease) Expressed in Thousands
Pension Expense and Deferred Outflows of Resources and Deferred Inflows of Resources Related to Pensions
For the year ended June 30, 2015, the State of Iowa recognized pension expense related to the System of $5.0
million. At June 30, 2015, the State reported deferred outflows of resources and deferred inflows of resources related to pensions for the System from the following sources (expressed in thousands):
Deferred Outflows Deferred Inflows
of Resources of Resources
Differences between expected and actual experience -$ 5,331$
Net difference between projected and actual earnings on
pension plan investments 3,346 -
Total 3,346$ 5,331$
Amounts reported as deferred outflows of resources and deferred inflows of resources related to pensions will be recognized in pension expense as follows (expressed in thousands):
Year Ending
June 30,
2016 (418)$
2017 (418)
2018 (418)
2019 (418)
2020 (313)
Total (1,985)$
There are no non-employer contributing entities to JRS.
115

STATE OF IOWA
NOTES TO THE FINANCIAL STATEMENTS
Payables to the Pension Plan
At June 30, 2015, the State of Iowa reported payables of $266,177 for legally required employer contributions and $81,332 for legally required employee contributions which had been withheld from employee wages but not yet remitted to JRS.
C. Teachers Insurance and Annuity Association – College Retirement Equities Fund (TIAA-CREF) Retirement Program
The Universities, Board of Regents, the Iowa Braille and Sight Saving School and the Iowa School for the Deaf contribute to the Teachers Insurance and Annuity Association – College Retirement Equities Fund (TIAA-CREF) retirement program, which is a defined contribution plan. TIAA-CREF administers the retirement plan for the institutions listed above. The defined contribution retirement plan provides individual annuities for each plan participant. As required by the Board of Regents, State of Iowa policy all eligible employees must participate in a retirement plan from the date they are employed.
Benefit terms, including contribution requirements, are established in accordance with the Board of Regents,
State of Iowa policy and specified by the contract with TIAA-CREF. Contributions made by both employer and employee vest immediately, except at Iowa State University where employer contributions vest after three years.
As specified by the contract agreement with TIAA-CREF, each employee through the fifth year of employment contributes 3.33% of the first $4,800 of earnings and 5.00% on the balance of earnings. The employer through the fifth year of employment contributes 6.67% of the first $4,800 of earnings and 10.00% on the balance of earnings. Upon completion of five years of service, the participant contributes 5.00% and the employer contributes 10.00% on all earnings.
During fiscal years 2015 and 2014, the employers’ required and actual contributions amounted to $156,936,419 and $153,826,096, respectively. During fiscal years 2015 and 2014, the employees’ required and actual contributions amounted to $78,478,632 and $76,755,975, respectively. As of June 30, 2015, all required contributions were remitted to TIAA-CREF.
NOTE 16 – OTHER POSTEMPLOYMENT BENEFITS
A. State Plan
Plan Description
The State of Iowa provides access to postretirement medical benefits to all retirees as required by Chapter 509A.13 of the Code of Iowa. Although the retirees generally must pay 100% of the premium rate, GASB Statement No. 45, Accounting and Financial Reporting by Employers for Postemployment Benefits Other Than Pensions (GASB 45), requires that employers recognize the Implicit Rate Subsidy that exists in postretirement medical plans provided by governmental employers.
The Implicit Rate Subsidy refers to the concept that retirees under the age of 65 (i.e. not eligible for Medicare) generate higher claims on average than active participants. When a medical plan is self-insured or fully insured through a third-party administrator, a premium is usually determined by analyzing the claims of the entire population in the plan and adjusting for administrative costs. The resulting premium is called a blended premium because it blends the claims of active and retired participants. Since individuals generally have more
and higher claims as they get older, the blended premium paid for retirees is lower than their expected claims. Another way of considering this is that if the retirees were removed from the plan, the premium for the active group would be lower; therefore, the retirees’ premiums are being subsidized by the active group. Since the employer generally pays a large portion or all of the premiums for the active group, this subsidy creates a liability
for the employer. The difference between the expected claims for the retiree group and the blended premium is called the Implicit Rate Subsidy.
The State operates a single-employer retiree benefit plan which provides medical insurance benefits for retirees. There are 24,651 active and 3,350 retired participants in the plan. The State currently offers seven plans which are available to participants: BCBS Program 3 Plus, BCBS Deductible 3 Plus, Iowa Select, Wellmark Blue Access, Wellmark Blue Advantage, Gold Preferred and SPOC (Alliance Select).
Funding Policy
The contribution requirements of the plan participants are established and may be amended by the State Legislature. The State currently finances the retiree benefit plan on a pay-as-you-go basis.
116

STATE OF IOWA
NOTES TO THE FINANCIAL STATEMENTS
Annual OPEB Cost and Net OPEB Obligation
The State’s annual OPEB cost is calculated based on the annual required contribution (ARC) of the State, an amount actuarially determined in accordance with GASB 45. The ARC represents a level of funding that, if paid on an ongoing basis, is projected to cover normal cost each year and amortize any unfunded actuarial liabilities over a period not to exceed 30 years.
The following table shows the components of the State’s annual OPEB cost for the year ended June 30, 2015, the amount actually contributed to the plan and changes in the State’s net OPEB obligation as follows (expressed in thousands):
Annual required contribution 24,525$
Interest on net OPEB obligation 5,778
Adjustment to annual required contribution (7,882)
Annual OPEB cost 22,421
Contributions made (10,765)
Increase in net OPEB obligation 11,656
Net OPEB obligation beginning of year 128,389
Net OPEB obligation end of year 140,045$
The State’s plan includes AFSCME employees of the Universities. The portion of the fiscal year 2015 net OPEB obligation related to those employees is $32.2 million. The State plan also includes $1.7 million of the fiscal year 2015 net OPEB obligation allocated to the State’s discretely presented component units and fiduciary funds.
For calculation of the net OPEB obligation, the actuary has set the transition day as July 1, 2007. The end of year net OPEB obligation was calculated by the actuary as the cumulative difference between the actuarially determined funding requirements and the plan’s actual contributions for the year ended June 30, 2015.
For fiscal year 2015, the State contributed $10.8 million to the medical plan. The State’s annual OPEB cost, the percentage of annual OPEB cost contributed to the plan and the net OPEB obligation for fiscal year 2015 and the two preceding fiscal years are summarized as follows (expressed in thousands):
Annual OPEB Percentage of AOC Net OPEB
Year Ended June 30, Cost (AOC) Contributed Obligation
2013 24,405$ 41.56% 114,659$
2014 25,427 46.00% 128,389
2015 22,421 48.01% 140,045
Funded Status and Funding Progress
As of July 1, 2014, the most recent actuarial valuation for the period July 1, 2014 through June 30, 2015, the actuarial accrued liability was $217.9 million, with no actuarial value of assets, resulting in an unfunded actuarial accrued liability (UAAL) of $217.9 million. The covered payroll (annual payroll of active employees covered by the plan) was $1,796.6 million and the ratio of the UAAL to the covered payroll was 12.13%. As of June 30, 2015, there were no trust fund assets.
Actuarial Methods and Assumptions
Actuarial valuations of an ongoing plan involve estimates of the value of reported amounts and assumptions
about the probability of occurrence of events far into the future. Examples include assumptions about future employment, mortality and the healthcare cost trend. Actuarially determined amounts are subject to continual revision as actual results are compared with past expectations and new estimates are made about the future. The Schedule of Funding Progress, presented as Required Supplementary Information in the section following the Notes to the Financial Statements, presents multiyear trend information about whether the actuarial value of plan assets is increasing or decreasing over time relative to the actuarial accrued liabilities for benefits.
Projections of benefits for financial reporting purposes are based on the plan as understood by the employer and the plan members and include the types of benefits provided at the time of each valuation and the historical pattern of sharing of benefit costs between the employer and plan members to that point. The actuarial methods
117

STATE OF IOWA
NOTES TO THE FINANCIAL STATEMENTS
and assumptions used include techniques designed to reduce the effects of short-term volatility in actuarial accrued liabilities and the actuarial value of assets, consistent with the long-term perspective of the calculations.
As of the July 1, 2014, actuarial valuation date, the entry age normal actuarial cost method was used. The actuarial assumptions included a 3.0% inflation rate and a 4.5% discount rate based on the estimated long-term investment yield on the general assets of the State. Medical trend rates were developed using a combination of a trend survey and the SOA-Getzen trend rate model. Initial trend rates start at 7.0% (managed care plans) or 7.5% (non-managed care plans) in 2014 and grade down to an ultimate rate of 5.0% beginning in the year 2037. For the years 2014 through 2016, the rates are based on survey data and client market expectations. The SOA-Getzen model was then used to determine the trend rates beginning in year 2017 and thereafter, based on reasonable macro-economic assumptions for the growth of health care expenditures during this period relative to the general economy.
Pre-retirement mortality rates are from the RP-2000 Employee Table with generational improvements using projection scale AA, set back 3 years for males, and set back 8 years for females. Post-retirement mortality rates are from the RP-2000 Healthy Annuitant Table with generational improvements using projection scale AA for
males, and projection scale AA for females, with a 5.0% increase above age 75. The majority of State of Iowa
employees are participants in the Iowa Public Employees’ Retirement System. For this reason, the mortality rates, withdrawal, retirement and age of spouse assumptions are based on the assumptions used for the Iowa Public Employees’ Retirement System Actuarial Valuation Report as of June 30, 2014. The plan participation assumption is based upon the recent experience of the State of Iowa Postretirement Medical Plan.
The UAAL is being amortized on a level dollar open basis over 30 years.
B. University Funds
Plan Description
The University of Iowa, Iowa State University and the University of Northern Iowa (the Universities) operate single employer benefit plans which provide medical, dental and life insurance benefits for retirees and their spouses. Detailed plan description information is available in the Universities’ separately issued financial reports. These reports may be obtained by writing to the Iowa Department of Administrative Services, Hoover State Office Building, Des Moines, Iowa 50319.
Funding Policy
The contribution requirements of the plan participants are established and may be amended by the Universities. The Universities currently finance the retiree benefit plans on a pay-as-you-go basis. For fiscal year 2015, the Universities contributed $15.5 million to the plan and members receiving benefits contributed $12.4 million of the premium cost.
Annual OPEB Cost and Net OPEB Obligation
The following table shows the components of the Universities’ annual OPEB cost for the year ended June 30, 2015, the amount actually contributed to the plans and changes in the Universities’ net OPEB obligation as follows (expressed in thousands):
Annual required contribution 39,778$
Interest on net OPEB obligation 4,407
Adjustment to annual required contribution (4,516)
Annual OPEB cost 39,669
Contributions made (15,544)
Increase in net OPEB obligation 24,125
Net OPEB obligation beginning of year 95,398
Net OPEB obligation end of year 119,523$
For calculation of the net OPEB obligation, the actuary has set the transition day as July 1, 2007. The end of year net OPEB obligation was calculated by the actuaries as the cumulative difference between the actuarially determined funding requirements and the plans’ actual contributions for the year ended June 30, 2015.
118

STATE OF IOWA
NOTES TO THE FINANCIAL STATEMENTS
The Universities’ annual OPEB cost, the percentage of annual OPEB cost contributed to the plans and the net OPEB obligation for fiscal year 2015 and the preceding two fiscal years are summarized as follows (expressed in thousands):
Annual OPEB Percentage of AOC Net OPEB
Year Ended June 30, Cost (AOC) Contributed Obligation
2013 30,890$ 51.35% 77,054$
2014 32,534 43.62% 95,398
2015 39,669 39.18% 119,523
Funded Status and Funding Progress
As of the most recent actuarial valuation for the period July 1, 2014 through June 30, 2015, the actuarial accrued liability was $412.3 million, with no actuarial value of assets, resulting in an unfunded actuarial accrued liability (UAAL) of $412.3 million. The covered payroll (annual payroll of active employees covered by the plan)
was $1,465.2 million and the ratio of the UAAL to the covered payroll was 28.1%. As of June 30, 2015, there were no trust fund assets.
Actuarial Methods and Assumptions
Actuarial valuations of an ongoing plan involve estimates of the value of reported amounts and assumptions about the probability of occurrence of events far into the future. Examples include assumptions about future employment, mortality and the healthcare cost trend. Actuarially determined amounts are subject to continual revision as actual results are compared with past expectations and new estimates are made about the future. The Schedule of Funding Progress, presented as Required Supplementary Information in the section following the Notes to the Financial Statements, presents multiyear trend information about whether the actuarial value of plan assets is increasing or decreasing over time relative to the actuarial accrued liabilities for benefits.
Projections of benefits for financial reporting purposes are based on the plan as understood by the employer and the plan members and include the types of benefits provided at the time of each valuation and the historical pattern of sharing of benefit costs between the employer and plan members to that point. The actuarial methods and assumptions used include techniques designed to reduce the effects of short-term volatility in actuarial accrued liabilities and the actuarial value of assets, consistent with the long-term perspective of the calculations.
Information from the Universities’ latest actuarial valuations follows:
University of Iowa Iowa State University University of Northern Iowa
Actuarial valuation date July 1, 2014 July 1, 2013 July 1, 2014
Actuarial cost method Projected unit credit Projected unit credit Projected unit credit
Amortization method Level percentage of Level dollar Level percentage of
projected payroll projected payroll
Amortization period Open basis over 30 years Open basis over 30 years Open basis over 30 years
Rate of investment return 4.75% 4.00% 4.50%
Medical trend rate 7.50% (8.50% for post age 65) 8.50% 8.50%
Ultimate medical trend rate Reduced in decrements to an Reduced 0.50% each year Reduced 0.50% each year
ultimate rate of 5.00% after until reaching 5.00% until reaching 5.00%
10 years
Inflation rate 3.00% 2.50% 5.00%
Payroll growth rate 3.00% n/a 3.50%
NOTE 17 – OTHER TERMINATION BENEFITS
A. State Employee Retirement Incentive Program
On February 10, 2010, the Governor signed into law a state employee retirement incentive program (SERIP). Participants in SERIP received (1) a cash payment of the monetary value of the participant’s accrued sick leave balance, not to exceed $2,000 in fiscal year 2010, (2) cash payments, including the entire value of the
119

STATE OF IOWA
NOTES TO THE FINANCIAL STATEMENTS
participant’s accrued but unused vacation leave, and, for participants with at least 10 years of state employment, $1,000 for each year of state employment, up to 25 years of employment, paid in five equal installments from September 2010 through September 2014, and (3) a minimum of 5 years of state contributions toward the premiums of a state-sponsored health insurance plan, either through the Sick Leave Insurance Program (SLIP), SERIP, or a combination of both programs.
Participants in SERIP are not eligible to accept any further employment with the State, other than as an elected official or a member of a board or commission, from the date of termination of employment. Participants may not enter into contracts to provide services to the State as independent contractors or consultants.
SERIP was financed on a pay-as-you-go basis by the department from which the employee retired. SERIP concluded at the end of fiscal year 2015.
For the year ended June 30, 2015, SERIP costs for 2,067 participants totaled $26.9 million.
B. Board of Regents Retirement Incentive Options
At its March 2009 meeting, the Board of Regents approved the first of three Retirement Incentive Option (RIO) programs, RIO1. The second and third programs, RIO2 and RIO3, were subsequently approved at its October 2009 and April 2010 meetings, respectively. Faculty, professional and scientific employees, merit system
employees, and institutional officials who accumulated ten years of service with the Universities and who attained the age of 60 (RIO1), 57 (RIO2), and 55 (RIO3) by the date of retirement were eligible for participation. These programs were one-time programs with retirement required to occur no later than January 31, 2010, July 30, 2010, and December 31, 2010, respectively.
Upon retirement, the participant will be provided health and dental coverage for a period of up to five years with the Universities providing both the employee and employer share of contributions not to exceed the employee and spouse/domestic partner rate for the Universities’ professional plans and not to exceed the employee and family rate for the State of Iowa plans. Eligible employees who elect the incentive and reach Medicare eligibility during the incentive period will be allowed to continue in the incentive with the contributions reduced to integrate with Medicare eligibility. For RIO3, the participant may choose to receive continued annuity (Defined Contribution Plan only) contributions for a period of up to five years in lieu of the continued medical/dental coverage. The annuity benefit is equal to the Universities’ contribution level during active employment of 10% and based on the participant’s full budgeted salary at the time of retirement. Term life insurance benefits are fully insured for eligible retirees and are paid for directly by the life insurance carrier. The Universities pay a stated premium based on the value of the policy (which is $4,000) directly to the carrier. The stated premium rate is the same as the premium rate for the active employer life coverage in effect during the fiscal year.
At its April 2010 meeting, the Board of Regents approved the Phased Plus Retirement Program. Faculty, professional and scientific, merit system employees, and institutional officials who had accumulated ten years of service with Iowa State University who attained the age of 55 at the time of initial reduction of employment were eligible for participation in the Phased Plus Retirement Program. This was a one-time program with the maximum phasing period of two years with full retirement required at the end of the specified phasing period. At no time during the phasing period may an employee hold less than a 50% or greater than a 65% appointment. The phased retirement period was required to occur no later than January 1, 2012. At the end of the appointment, the employee had the option of medical coverage or employer-paid retirement contributions for the balance of five years once phased retirement began, with the same stipulations as the RIO3 program.
At its February 2015 meeting, the Board of Regents approved the University of Iowa 2015 Retirement Incentive Program. Those eligible for participation in the 2015 program were non-University of Iowa Health Care faculty,
professional and scientific employees, merit employees and institutional officials who had attained age 57 and at
least 10 years of continuous benefit eligible employment by January 31, 2015. The employees’ department head and the appropriate administrative officers approved the employee’s participation. Upon retirement, participants will be provided health and dental insurance with the University paying the full cost of the single employee premium or its standard share of any coverage other than single for a period of five years. This contribution shall be equal to the amount contributed for an active employee in the same plan.
The Board of Regents Institutions’ contributions for the fiscal year ended June 30, 2015, totaled $5.3 million for 734 participants in the Board of Regents Retirement Incentive Options.
C. State Police Officers Council
The State Police Officers Council (SPOC) Collective Bargaining Agreement provides upon retirement, including disability retirement, credit for all unused sick leave.
120

STATE OF IOWA
NOTES TO THE FINANCIAL STATEMENTS
Accumulated unused sick leave in both the active and banked sick leave accounts shall be converted at current value and credited to the employee’s account for the purpose of paying the cost of the monthly premiums of a health insurance and/or life insurance policy.
Upon written authority from or upon the death of a retired employee, or upon the death of an active employee, the spouse or the surviving spouse shall be entitled to the value of the sick leave bank in both the active and banked sick leave accounts as converted in the previous paragraph for the purpose of paying the cost of monthly premiums of the health insurance and/or life insurance policy for the employee’s spouse or dependents.
If the carrier of either the health or life insurance policy is not a current contracted carrier with the State of Iowa, SPOC or any of its suborganizations, the employee or spouse shall be eligible for reimbursement of a premium payment to that carrier upon submission of proof of payment. If there is dissolution of marriage or divorce, it is the employee’s responsibility to withdraw their authority.
The benefits are funded on a pay-as-you-go basis for Department of Public Safety retirees and are fully funded for Department of Natural Resources retirees.
For the year ended June 30, 2015, 231 SPOC retirees received benefits totaling $1.1 million.
D. Other Voluntary Termination Benefit Programs
Voluntary termination benefit programs have been established through collective bargaining for Executive branch AFSCME and IUP employees, Judicial branch AFSCME and PPME employees and Community Based Corrections employees. The programs are also offered to Executive branch non-contract employees, Judicial branch non-contract employees, Legislative employees and Community Based Corrections non-contract employees, except for judicial officers. The programs allow employees who are eligible upon a bona fide retirement to use the value of their unused sick leave to pay the employer share of the monthly premium of the State’s group health insurance plan after their retirement.
Upon retirement, employees shall first receive cash payment for accumulated, unused sick leave converted at the employee’s current regular hourly rate of pay, up to $2,000, payable with the final payroll warrant that includes the employee’s retirement date. The value of the remaining balance of the accrued sick leave will be converted based upon the original balance (before the cash payment). The remainder of the sick leave value is calculated as follows, based on the number of sick hours the employee had before the cash payment:
If the sick leave balance is: The conversion rate is:
Zero to 750 hours 60% of the value
Over 750 hours to 1,500 hours 80% of the value
Over 1,500 hours 100% of the value
The final calculated dollar value will be credited to the employee’s Sick Leave Insurance Program (SLIP) account. Each month, the retiree’s former employing department will pay 100% of the employer share of the selected state group health insurance premium from the retiree’s SLIP account. The retiree is responsible for any additional premiums associated with the employee/retiree share.
The employer will continue to pay the employer’s share of the health insurance premium each month until the converted value of the employee’s sick leave balance is exhausted, until the employee is eligible for Medicare, the employee waives the benefit or the employee dies, whichever comes first. The retired employees may stay with the same health insurance program as when employed or switch down at any time without underwriting. The converted value of the sick leave can only be applied to the employer’s share of health insurance premium payments. It has no cash value and it is not transferable to another use or to an heir.
If a retired employee who has utilized this benefit returns to permanent state employment, all remaining balances
in the Sick Leave Insurance Program will be forfeited.
All program benefits are financed on a pay-as-you-go basis by the department from which the employee retired. Amounts due for this program have been recorded as a liability in the government-wide financial statements.
For the year ended June 30, 2015, 1,165 employees from the Executive and Legislative branches have retired and received benefits totaling $8.1 million under SLIP. In addition, 196 employees from the Judicial branch and Community Based Corrections have retired and received benefits totaling $1.6 million under SLIP.
121
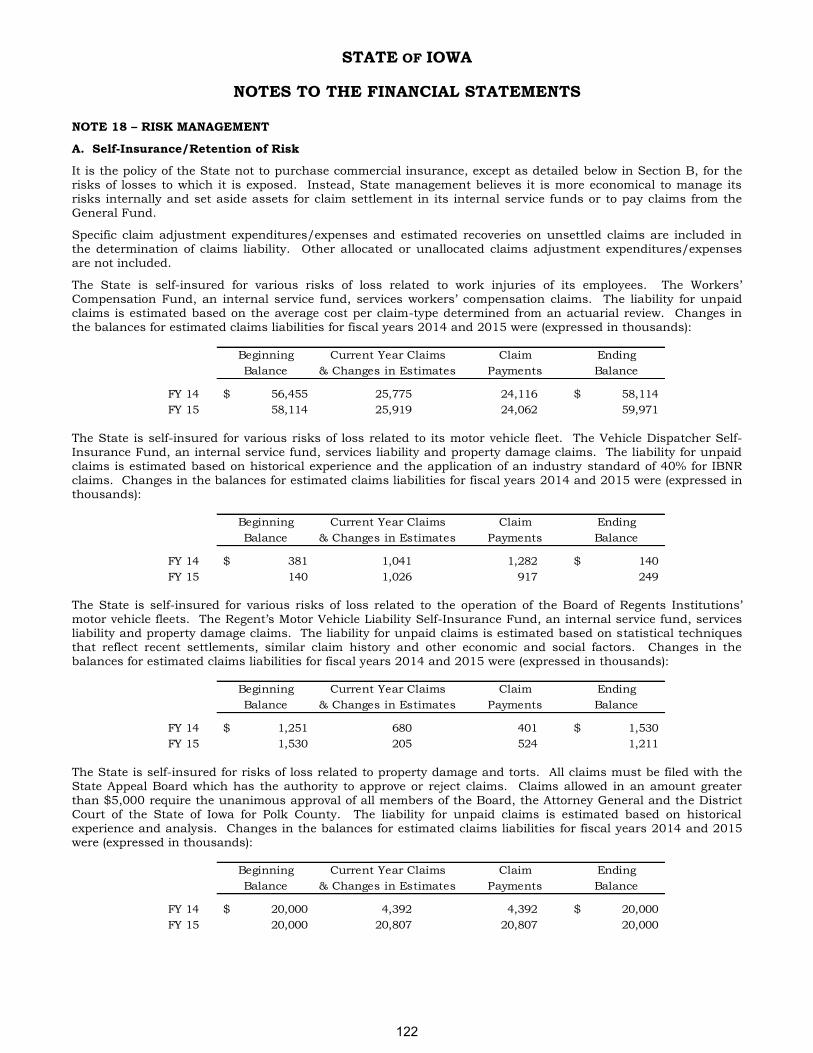
STATE OF IOWA
NOTES TO THE FINANCIAL STATEMENTS
NOTE 18 – RISK MANAGEMENT
A. Self-Insurance/Retention of Risk
It is the policy of the State not to purchase commercial insurance, except as detailed below in Section B, for the risks of losses to which it is exposed. Instead, State management believes it is more economical to manage its risks internally and set aside assets for claim settlement in its internal service funds or to pay claims from the General Fund.
Specific claim adjustment expenditures/expenses and estimated recoveries on unsettled claims are included in the determination of claims liability. Other allocated or unallocated claims adjustment expenditures/expenses are not included.
The State is self-insured for various risks of loss related to work injuries of its employees. The Workers’ Compensation Fund, an internal service fund, services workers’ compensation claims. The liability for unpaid claims is estimated based on the average cost per claim-type determined from an actuarial review. Changes in the balances for estimated claims liabilities for fiscal years 2014 and 2015 were (expressed in thousands):
Beginning Ending
Balance Balance
FY 14 56,455$ 25,775 24,116 58,114$
FY 15 58,114 25,919 24,062 59,971
Current Year Claims
& Changes in Estimates
Claim
Payments
The State is self-insured for various risks of loss related to its motor vehicle fleet. The Vehicle Dispatcher Self-Insurance Fund, an internal service fund, services liability and property damage claims. The liability for unpaid claims is estimated based on historical experience and the application of an industry standard of 40% for IBNR claims. Changes in the balances for estimated claims liabilities for fiscal years 2014 and 2015 were (expressed in thousands):
Beginning Ending
Balance Balance
FY 14 381$ 1,041 1,282 140$
FY 15 140 1,026 917 249
Current Year Claims Claim
& Changes in Estimates Payments
The State is self-insured for various risks of loss related to the operation of the Board of Regents Institutions’ motor vehicle fleets. The Regent’s Motor Vehicle Liability Self-Insurance Fund, an internal service fund, services liability and property damage claims. The liability for unpaid claims is estimated based on statistical techniques that reflect recent settlements, similar claim history and other economic and social factors. Changes in the balances for estimated claims liabilities for fiscal years 2014 and 2015 were (expressed in thousands):
Beginning Ending
Balance Balance
FY 14 1,251$ 680 401 1,530$
FY 15 1,530 205 524 1,211
Current Year Claims Claim
& Changes in Estimates Payments
The State is self-insured for risks of loss related to property damage and torts. All claims must be filed with the State Appeal Board which has the authority to approve or reject claims. Claims allowed in an amount greater
than $5,000 require the unanimous approval of all members of the Board, the Attorney General and the District Court of the State of Iowa for Polk County. The liability for unpaid claims is estimated based on historical experience and analysis. Changes in the balances for estimated claims liabilities for fiscal years 2014 and 2015 were (expressed in thousands):
Beginning Ending
Balance Balance
FY 14 20,000$ 4,392 4,392 20,000$
FY 15 20,000 20,807 20,807 20,000
Current Year Claims Claim
& Changes in Estimates Payments
122

STATE OF IOWA
NOTES TO THE FINANCIAL STATEMENTS
The Universities retain risk liability for medical faculty malpractice; medical, dental, unemployment and workers’ compensation coverage for some employees; and various property damage not covered as described below. The estimates of claim liabilities for faculty medical malpractice and employee medical, dental, unemployment and workers’ compensation are based on actuarial analysis. The estimates of the claims liabilities for various property damage are based on historical analysis. Changes in the balances for estimated claims liabilities for fiscal years 2014 and 2015 were (expressed in thousands):
Beginning Ending
Balance Balance
FY 14 31,308$ 237,682 235,751 33,239$
FY 15 33,239 264,149 258,671 38,717
Current Year Claims Claim
& Changes in Estimates Payments
B. Insurance/Transfer of Risk
The State insures with commercial insurers for certain risks of loss assuming liability for any deductibles and
claims in excess of coverage limitations.
State employee benefits for health, dental, long-term disability and life insurance coverage are fully insured.
The State maintains an employee fidelity bond for up to $2.0 million. The three State public universities
carry additional coverage of $0.5 million to $10.0 million.
The University of Iowa is insured for $2.0 billion for catastrophic property loss for general fund properties
with a $5.0 million deductible on general University buildings. Additional coverage is provided for auxiliary enterprises. The fine art collections are insured for $200.0 million.
Iowa State University is insured for $2.3 billion for catastrophic property loss for general fund properties
with a $2.0 million deductible on general University buildings. Additional coverage is provided for auxiliary enterprises.
The University of Northern Iowa is insured for $650.0 million for catastrophic property loss for general fund properties with a $2.0 million deductible on general University buildings. Additional coverage is provided for auxiliary enterprises.
The Iowa Braille and Sight Saving School is insured for catastrophic loss liabilities for $53.9 million after
a $1.0 million deductible.
The Iowa School for the Deaf is insured for catastrophic loss liabilities for $72.3 million after a $1.0
million deductible.
The eight Judicial Districts individually insure buildings and contents with coverage ranging from $3.6
million to $26.7 million.
The Iowa Lottery Authority is insured for $11.2 million for buildings and contents.
Iowa Workforce Development is insured for $24.5 million for buildings and contents.
Iowa Public Television insures broadcasting trucks and contents for $3.1 million.
The University of Iowa had property insurance claims in excess of commercial coverage due to the 2008 flood. Iowa State University had property insurance claims in excess of commercial coverage due to the flood in August
2010. All other settled claims have not exceeded commercial coverage for the past three fiscal years.
NOTE 19 – LITIGATION, CONTINGENCIES AND COMMITMENTS
The Iowa Department of Revenue has pending litigation regarding income tax cases. The cases could possibly result in refunds estimated at $5.8 million.
The Iowa Public Employees’ Retirement System (IPERS) has commitments to fund an additional $1,999.0 million to various private equity/debt partnerships and $117.7 million to a real estate debt partnership at June 30, 2015.
123

STATE OF IOWA
NOTES TO THE FINANCIAL STATEMENTS
The Iowa Public Employees’ Retirement System (IPERS) monitors, evaluates, and takes the necessary actions related to litigation for or against IPERS. This includes, but is not limited to, federal and state court actions and defending administrative appeals filed against IPERS.
In the fraud action against Westridge Capital Management, IPERS continues to pursue full recovery. In recent years, IPERS recovered $225.7 million, which is nearly 90 percent of its initial investment. However, IPERS did not receive a distribution in fiscal year 2015.
IPERS was notified by one of its investment managers that it has been named as a defendant, along with approximately 500 other investors, in an action before the United States Bankruptcy Court for the Southern District of New York. This action involves the General Motors Corporation bailout of 2006. General Motors filed for bankruptcy protection in 2009. IPERS, along with other investors, provided debtor-in-possession financing of $1.5 billion to allow General Motors to continue operations. Secured investors, such as IPERS and the other 500 investors, received a return on their investment. Unsecured creditors received a minimal return during the bankruptcy proceedings.
The unsecured creditors filed this action in an effort to increase their recovery by requiring secured investors to
return all or a portion of the return on their investment. IPERS cannot estimate its potential losses because the court has sealed the documents related to this action. IPERS is negotiating a contract with the outside legal counsel representing a large number of investor defendants in this action.
IPERS successfully defended several appeals filed under the Iowa Administrative Procedures Act. No administrative appeal resulted in a loss to the Trust Fund.
The Iowa Department of Transportation has contractual obligations for construction and other contracts of $575.1 million (net of $522.8 million in anticipated federal funding) at June 30, 2015.
The University of Iowa has outstanding construction contract commitments of $427.0 million at June 30, 2015.
Iowa State University has outstanding construction contract commitments of $82.7 million at June 30, 2015.
The University of Northern Iowa has outstanding construction contract commitments of $5.4 million at June 30, 2015.
The Iowa Department of Natural Resources has outstanding construction contract commitments of $12.3 million at June 30, 2015.
The Iowa Department of Administrative Services has outstanding construction contract commitments of $23.3
million at June 30, 2015.
The Iowa Department of Corrections has outstanding construction contract commitments of $9.6 million at June 30, 2015.
The Iowa Department of Human Rights has outstanding contractual obligations of $31.5 million at June 30, 2015.
The Iowa Department of Human Services has outstanding contractual obligations of $933.0 million at June 30, 2015.
The Iowa Department of Public Defense has outstanding contractual obligations for construction and other contracts of $9.6 million at June 30, 2015.
The State of Iowa has encumbrances at June 30, 2015, totaling $33.5 million, $28.7 million in the General Fund and $4.8 million in the nonmajor governmental funds.
The Iowa Finance Authority has signed loan agreements under the State Revolving Fund for which $122.0 million
had not been disbursed at June 30, 2015.
The Iowa State Fair Authority has outstanding construction contract commitments of $2.7 million at June 30, 2015.
The Iowa Economic Development Authority has outstanding contractual commitments of $238.5 million at June
30, 2015.
124

STATE OF IOWA
NOTES TO THE FINANCIAL STATEMENTS
NOTE 20 – BEGINNING BALANCE ADJUSTMENTS
GASB 68 and GASB 71 Implementation
The State implemented GASB Statement No. 68, Accounting and Financial Reporting for Pensions – an Amendment of GASB No. 27 in fiscal year 2015. GASB 68 established new accounting and financial reporting requirements for state and local governments which provide their employees with pension benefits through pension plans administered through specific trusts or equivalent arrangements. This Statement requires the governmental employer to recognize a net pension liability, deferred outflows of resources, deferred inflows of resources and pension related expenses/expenditures.
The State also implemented GASB Statement No. 71, Pension Transition for Contributions Made Subsequent to the
Measurement Date. At transition, GASB 68 did not allow for beginning balances for deferred outflows of resources or deferred inflows of resources to be reported unless all balances were reported. GASB 71 modified GASB 68 to require that, at transition, governments recognize a beginning deferred outflow of resources for employer contributions made subsequent to the measurement date of the beginning net pension liability.
The following prior period adjustments were made at July 1, 2014, to comply with the new pension standards (expressed in millions):
Discretely
Governmental Business-type Presented
Activities Activities Component Units
Net position at June 30, 2014, as previously reported 9,438.2$ 6,501.0$ 3,586.6$
Accounts payable for single employer pension plans
measured under previous standards 63.8 - -
Deferred outflows of resources related to contributions
made after the June 30, 2013 measurement date 110.3 10.9 1.9
Net pension liability at June 30, 2014 (1,090.7) (90.7) (18.7)
Net position at July 1, 2014, as restated 8,521.6$ 6,421.2$ 3,569.8$
Governmental Activities:
As shown above, unrestricted net position was reduced for governmental activities by $916.6 million.
Accounts payable was decreased by $63.8 million to remove the net pension obligation calculated under
prior standards and previously reported for the State’s single-employer defined benefit pensions.
Deferred outflows of resources related to pensions were increased by $110.3 million.
Net pension liability was increased by $1,090.7 million.
Governmental Activities – Internal Service Funds accounted for $17.9 million of the above decrease in net
position due to a $2.0 million increase in deferred outflows of resources related to pensions and a $19.9 million increase in net pension liability.
Business-type Activities:
Unrestricted net position was reduced by $79.8 million, for University Funds and Nonmajor Enterprise Funds which decreased $69.4 million and $10.4 million, respectively.
Deferred outflows of resources related to pensions increased $10.9 million, for University Funds and
Nonmajor Enterprise Funds which increased $9.5 million and $1.4 million, respectively.
Net pension liability increased $90.7 million, for University Funds and Nonmajor Enterprise Funds which increased $78.9 million and $11.8 million, respectively.
125

STATE OF IOWA
NOTES TO THE FINANCIAL STATEMENTS
Discretely Presented Component Units:
Unrestricted net position was reduced by $16.8 million, for the Iowa Finance Authority, Iowa Economic Development Authority and Iowa Lottery Authority which decreased by $5.4 million, $6.1 million and $5.3 million, respectively.
Deferred outflows of resources related to pensions increased $1.9 million, for the Iowa Finance Authority,
Iowa Economic Development Authority and Iowa Lottery Authority which increased $0.6 million, $0.7 million and $0.6 million, respectively.
Net pension liability increased $18.7 million, for the Iowa Finance Authority, Iowa Economic Development
Authority and Iowa Lottery Authority which increased $6.1 million, $6.7 million and $5.9 million, respectively.
NOTE 21 – DEFICIT FUND BALANCE
The Tobacco Collections Fund, a major Special Revenue Fund, had a deficit fund balance of $305.0 million at June 30, 2015. In accordance with GASB Statement No. 48, Sales and Pledges of Receivables and Future Revenues and Intra-Entity Transfers of Assets and Future Revenues, in fiscal year 2008, an interfund advance was recorded in the Tobacco Collections Fund, causing a deficit fund balance. As future tobacco collections are received in the Tobacco Collections Fund and remitted to the Tobacco Settlement Authority for repayment of debt, the interfund advance will be reduced and the deficit eliminated.
NOTE 22 – SUBSEQUENT EVENTS
Subsequent to June 30, 2015, Iowa State University received approval from the State Board of Regents for the sale of Dormitory System Revenue Bonds, Series I.S.U. 2015A for $30,000,000 to be issued on October 1, 2015. These bonds will bear interest at varying rates and will mature in varying amounts from July 1, 2016 through July 1, 2035. The proceeds of the bonds will be used to pay a portion of the costs of constructing and equipping a new residence hall for student housing and other improvements to the system, including Friley Dining Renovation, to provide a debt service reserve fund, and to pay the costs of issuing the bonds. The bonds will be payable solely from the net revenues of the Dormitory System of the University.
Subsequent to June 30, 2015, Iowa State University received approval from the State Board of Regents for the
sale of Academic Building Revenue Refunding Bonds, Series I.S.U. 2015 for $12,095,000 to be issued on December 1, 2015. These bonds will bear interest at varying rates and will mature in varying amounts from July 1, 2016 through July 1, 2027. The proceeds of the bonds will be used to provide for the advance refunding of the outstanding principal of the July 1, 2016 through July 1, 2027 maturities of the Academic Building Revenue Bonds, Series I.S.U. 2007, and to pay for the costs of issuing the bonds. The bonds will be payable solely out of gross student fees and charges collected by the University and institutional income received by the University.
In August 2015, the University of Iowa received approval from the State Board of Regents to issue Dormitory Revenue Bonds, Series S.U.I. 2015 in the amount of $34,680,000. These bonds will bear interest at varying rates between 3.00% and 3.75% and will mature in varying amounts from July 1, 2019 through July 1, 2040. The proceeds of the bonds will be used to pay a portion of the costs of constructing and equipping a new residence hall for student housing and related facilities, funding a debt service reserve fund, and to pay the costs of issuing the bonds.
In August 2015, the University of Iowa received approval from the State Board of Regents to issue Athletic
Facilities Revenue Refunding Bonds, Series S.U.I. 2015B in the amount of $12,130,000. These bonds will bear interest at varying rates between 2.00% and 3.70% and will mature in varying amounts from July 1, 2016 through July 1, 2031. The proceeds of the bonds will be used to provide for the advance refunding outstanding principal of the July 1,2016 through July 1, 2031 maturities of the Universities $15,000,000 Athletic Facilities Revenue Bonds, Series S.U.I. 2005B (Taxable), dated September 1, 2005 and to pay the costs of issuing the bonds.
In October 2015, the University of Iowa received approval from the State Board of Regents to issue Academic Building Revenue Bonds, Series S.U.I. 2015 in the amount of $14,545,000. These bonds will bear interest at varying rates between 2.00% and 3.20% and will mature in varying amounts from July 1, 2017 through July 1, 2036. The proceeds of the bonds will be used to pay or reimburse a portion of the costs of building, repairing,
126

STATE OF IOWA
NOTES TO THE FINANCIAL STATEMENTS
replacing, reconstructing and equipping flood damaged buildings and facilities on the campus of the University of Iowa damaged by the flood of 2008; fund a reserve fund, and to pay the costs of issuing the bonds.
In October 2015, the University of Iowa received approval from the State Board of Regents to issue Athletic Facilities Revenue Refunding Bonds, Series S.U.I. 2015C (Taxable) in the amount of $21,765,000. These bonds will bear interest at varying rates between 2.00% and 3.70% and will mature in varying amounts from July 1, 2016 through July 1, 2031. The proceeds of the bonds will be used to provide for the advance refunding of outstanding principal of the July 1,2016 through July 1, 2031 maturities of the University’s $27,500,000 Athletic Facilities Revenue Bonds, Series S.U.I. 2006 dated June 1,2006 and to pay the costs of issuing the bonds.
In October 2015, the University of Iowa received approval from the State Board of Regents to issue Athletic Facilities Revenue Refunding Bonds, Series S.U.I. 2015D (Taxable) in the amount of $19,930,000. These bonds will bear interest at varying rates between 2.00% and 3.70% and will mature in varying amounts from July 1, 2016 through July 1, 2031. The proceeds of the bonds will be used to provide for the advance refunding of outstanding principal of the July 1, 2016 through July 1, 2031 maturities of the University’s $25,000,000 Athletic Facilities Revenue Bonds, Series S.U.I. 2006A dated July 1, 2006 and to pay the costs of issuing the bonds.
The State of Iowa experienced severe storms, tornadoes, straight-line winds and flooding from June 20, 2015
through June 25, 2015. The President declared a major disaster event for Iowa on July 31, 2015, for 19 counties. Current damages are estimated at $7.0 million with the anticipation that $5.3 million will be paid with federal funds, $1.0 million from local governments, and $0.7 million with state funds.
In October 2015, IPERS received a distribution of $20.0 million in the Westridge Capital Management fraud action. IPERS has now recovered 97 percent of its investment principal.
The Department of Human Services completes reviews and cost settlements for federal programs including Medicaid. As the reviews and settlements are finalized, the impact is reflected in the State’s financial statements. Obligations related to reviews and settlements not yet completed, if any, are undeterminable at this time.
As of July 1, 2015, Iowa Economic Development Authority (IEDA) assumed full management of the Energy Loan Program from the Iowa Finance Authority (IFA). The program had previously been jointly managed by IEDA and IFA. In the spring of 2015, a decision was made to transfer all functions (programmatic and fiscal) to IEDA effective with the start of fiscal year 2016. A transfer was completed at the end of July 2015 and included cash of $1.1 million, notes receivable of $17.5 million and notes payable of $0.5 million.
On September 28, 2015, the Iowa Finance Authority issued $122.0 million of Single Family Revenue Bonds to purchase mortgage backed securities under the Iowa Finance Authority’s FirstHome program and refund existing debt.
127

IOWA
128

I N F O R M A T I O N
R E Q U I R E D
S U P P L E M E N T A R Y
129

STATE OF IOWA
Required Supplementary Information
Budgetary Comparison Schedule - General Fund
ORIGINAL
BUDGET
FINAL
BUDGET ACTUAL
FINAL TO
ACTUAL
APPROPRIATED REVENUE
Special taxes:
Personal income tax 4,302,300$ 4,173,000$ 4,224,097$ 51,097$
Sales/use tax 2,745,200 2,754,400 2,749,230 (5,170)
Corporation income tax 603,700 569,500 579,453 9,953
Inheritance tax 104,700 91,000 89,807 (1,193)
Insurance premium tax 107,500 106,900 109,634 2,734
Beer & liquor tax 14,900 14,800 14,483 (317)
Franchise tax 47,600 40,800 47,482 6,682
Miscellaneous tax 1,100 1,200 1,373 173
Total special taxes 7,927,000 7,751,600 7,815,559 63,959
Reimbursements & fees:
Institutional reimbursements 11,100 10,000 14,829 4,829
Liquor transfers 96,000 94,200 109,237 15,037
Interest 4,100 4,000 3,754 (246)
Fees 26,500 27,000 27,399 399
Judicial revenue 103,100 101,500 99,484 (2,016)
Miscellaneous receipts 29,900 42,900 40,248 (2,652)
Total receipts 8,197,700 8,031,200 8,110,510 79,310
Transfers 180,700 123,900 127,638 3,738
Economic Emergency Fund Surplus 745,700 647,142 647,142 -
TOTAL APPROPRIATED REVENUE 9,124,100 8,802,242 8,885,290 83,048
Other taxes 1,167 1,167 1,379 212
Multi suspense 9,599 9,599 12,640 3,041
Federal support 3,589,551 3,602,431 3,611,296 8,865
Local governments 46,484 46,483 48,571 2,088
Internal service transfers 562,466 563,401 602,429 39,028
Reimbursements from other departments 8,892 9,443 8,200 (1,243)
Government fund type transfers-
Attorney General 16,108 16,176 15,942 (234)
Auditor of State 3,884 4,589 3,322 (1,267)
Other agencies 27,917 34,817 32,625 (2,192)
Interest 56 56 12 (44)
Fees, licenses & permits 56,657 58,990 45,552 (13,438)
Refunds & reimbursements 502,440 501,167 548,017 46,850
Sale of equipment & salvage 15 15 10 (5)
Rents & leases 2,629 2,689 2,552 (137)
Agricultural sales 1 1 2 1
Other sales & services 2,979 2,982 3,360 378
Unearned receipts 8,156 8,169 19,929 11,760
Promotional checkoffs 9,229 9,396 10,633 1,237
TOTAL APPROPRIATED RECEIPTS 4,848,230 4,871,571 4,966,471 94,900
TOTAL ALL REVENUE 13,972,330 13,673,813 13,851,761 177,948
SCHOOL INFRASTRUCTURE TRANSFER (440,500) (450,700) (450,532) 168
REFUNDS OF TAXES COLLECTED (974,300) (937,000) (967,888) (30,888)
TOTAL REVENUES AVAILABLE 12,557,530 12,286,113 12,433,341 147,228
(continued on next page)
For the Year Ended June 30, 2015
(Expressed in Thousands)
RECEIPTS CREDITED TO APPROPRIATIONS
130

STATE OF IOWA
(continued)
ORIGINAL
BUDGET
FINAL
BUDGET ACTUAL
FINAL TO
ACTUAL
EXPENDITURES
Administration & regulation 521,547 531,220 576,916 (45,696)
Agriculture & natural resources 170,794 183,581 173,774 9,807
Economic development 57,321 59,237 53,553 5,684
Education 4,109,547 4,112,363 4,101,062 11,301
Health & human services 6,179,476 6,240,678 6,292,552 (51,874)
Justice 587,879 598,381 597,834 547
Judicial 181,269 181,288 181,569 (281)
Legislature 34,029 34,031 35,490 (1,459)
Capitals 11,713 22,989 5,501 17,488
TOTAL EXPENDITURES 11,853,575 11,963,768 12,018,251 (54,483)
REVENUES AVAILABLE OVER
EXPENDITURES AND TRANSFERS 703,955 322,345 415,090 92,745
OTHER FINANCING SOURCES (USES)
Balances credited to appropriations 29,755 76,158 76,158 -
Unexpended appropriations (5,823) (29,279) (80,580) (51,301)
TOTAL OTHER FINANCING
SOURCES (USES) 23,932 46,879 (4,422) (51,301)
REVENUES AVAILABLE OVER
EXPENDITURES AND OTHER ITEMS 727,887 369,224 410,668 41,444
BEGINNING FUND BALANCE (BUDGETARY) - - - -
REMAINING FUND BALANCE (BUDGETARY) 727,887$ 369,224$ 410,668$ 41,444$
ENDING FUND BALANCE (BUDGETARY) 727,887$ 369,224$ 410,668$
AUTHORIZED TRANSFER TO THE:
Cash Reserve Fund (727,887) (369,224) (410,668)
REMAINING FUND BALANCE (BUDGETARY) -$ -$ -$
The notes are an integral part of the financial statements.
131

STATE OF IOWA
Required Supplementary Information
Budgetary Comparison Schedule - Budget to GAAP Reconciliation - General Fund
Fund balance - budgetary/legal 410,668$
Basis of accounting differences:
Balance sheet accounts:
Accounts receivable 324,450
Loans receivable 179
Due from other funds 2,949
Prepaid expenditures 26,661
Accounts payable & accruals (196,395)
Due to other funds (88,042)
Unearned revenue (3,119)
Deferred revenue (200,253)
Budgetary unexpended appropriations 80,580
Timing differences:
Petty cash & inventory expensed in
budgetary accounting 13,261
Perspective differences 1,938,702
Total fund balance - GAAP basis 2,309,641$
The notes are an integral part of the financial statements.
(Expressed in Thousands)
June 30, 2015
132

STATE OF IOWA
Required Supplementary Information
Notes to Required Supplementary Information – Budgetary Reporting
BUDGETARY EXPENDITURES IN EXCESS OF APPROPRIATIONS
During the year ended June 30, 2015, actual expenditures exceeded budgeted expenditures in the General Fund
in the Administration and Regulation, Health and Human Services, Judicial, and Legislature functions.
For the Administration and Regulation function, the Executive Council received additional State funds for expenditures paid to the Department of Homeland Security and Emergency Management for State match on federally approved disaster claims over and above the estimates for the fiscal year. Also, the State Appeal Board received additional State funds for payment of claims against the State over and above the estimates for the fiscal year.
For the Health and Human Services function, the Department of Human Services received additional federal funds and other State funds for the Medical Assistance program over budget and expended those funds for allowable program expenditures. The Iowa Veterans Home received additional federal funds and other State
funds over budget and expended those funds for allowable purposes.
For the Judicial function, the Iowa Courts received additional federal funds over budget and expended those funds for allowable program expenditures.
For the Legislature function, the Iowa Legislature received additional State funds over budget and expended those funds for allowable purposes.
BUDGETARY PRESENTATION
The budget encompasses the General Fund of the State and some Special Revenue Funds (IOWAccess Revolving Fund, Real Estate Education, Medicaid Fraud Fund, Unclaimed Winnings, Vertical Infrastructure Fund, Federal Economic Stimulus and Jobs Holding Fund, Environment First Fund, Technology Reinvestment Fund, Federal Recovery and Reinvestment Fund, Revenue Bonds Capital II Fund, Revenue Bonds Capital Fund, Health Care Trust, Underground Storage Tank Unassigned Revenue, Tobacco Tax Exempt Bond Proceeds Restricted Capital, Endowment for Iowa’s Health Restricted Capitals Fund, Resources Enhancement and Protection Fund, Land Recycling Fund, Fish and Game Trust Fund, Conservation Administration Fund, Forestry Management Enhancement Fund, Water Quality Protection, National Pollutant Discharge Elimination System Permit, Workforce Development Withholding, Local Housing Assistance, Wine and Beer Promotion Board Fund, Grow Iowa Values Fund, Renewable Fuel Infrastructure Fund, State Housing Trust Fund, Special Contingency Fund, School Infrastructure Fund, Stafford Loan Program, Nonparticipating Provider Reimbursement Fund, Department
of Human Services Reinvestment Fund, Pharmaceutical Settlement Fund, Health Care Transformation Fund, Hospital Health Care Access Trust Fund, IowaCare Fund, Quality Assurance Fund, Mortgage Serving Settlement Fund, Primary Road Fund, State Aviation Fund, and Court Technology and Modernization Fund). There is a perspective difference between budget and financial reporting due to the difference in fund structures. The budgetary presentation will vary from the financial presentation for funds displayed in the supplementary information due to this difference. The General Fund is displayed in the Required Supplementary Information (RSI) Budgetary Comparison Schedule. The major Special Revenue Funds, Tobacco Settlement Authority and Tobacco Collections Fund, do not have legally adopted budgets and, therefore, are not displayed. The nonmajor Special Revenue Funds are displayed with the combining financial statements and schedules for nonmajor funds in the Supplementary Information section.
The original budget and related estimated revenues and expenditures represent the spending authority enacted into law by the appropriations bills as of July 1, 2014 and includes estimated approved budgetary carry-forwards
from the prior fiscal year.
The final appropriations budget represents original and supplemental appropriations, actual budgetary carry-forwards, approved transfers, executive order reductions and timing differences.
The State’s budget is prepared annually by the Governor on a modified cash basis and is required to be submitted along with proposed appropriation bills to the General Assembly by the first of February prior to the new fiscal year. When an appropriation bill is passed by both houses of the General Assembly, the bill is enrolled and sent to the Governor. The Governor may sign it into law or veto it in whole or in part on a line item basis. Funds may be disbursed only after appropriations have been allotted by the Department of Management, subject to the review of the Governor, with the exception of standing unlimiteds and certain receipts that the Departments are authorized to expend.
133

STATE OF IOWA
Required Supplementary Information
Notes to Required Supplementary Information – Budgetary Reporting
Departments may request revisions to allotments, appropriations transfers, or supplemental appropriations. The Department of Management approves revised allotments within an appropriation, subject to the Governor’s
review. The Governor and the Department of Management approve all appropriation transfers. The General Assembly and the Governor act on supplemental appropriation bills in a manner similar to original appropriations. Appropriations lapse at the fiscal year-end and all unencumbered or unobligated balances revert to the State treasury, unless otherwise provided.
The State utilizes encumbrance accounting for budgetary control purposes. Obligations incurred for goods or services that have not been received or rendered are recorded to reserve that portion of the applicable fund balance. Section 8.33, unnumbered paragraph 2, of the Code of Iowa, states, “No payment of an obligation for goods or services shall be charged to an appropriation subsequent to the last day of the fiscal year for which the appropriation is made unless the goods or services are received on or before the last day of the fiscal year, except that repair projects, purchase of specialized equipment and furnishings, and other contracts for services and
capital expenditures for the purchase of land or the erection of buildings or new construction or remodeling, which were committed and in progress prior to the end of the fiscal year are excluded from this provision.” That is, except for the above stated exceptions, the State must have received the goods or services on or before June 30, creating an actual liability or the encumbrance is cancelled against that fiscal year. If the encumbrances are still valid after June 30, they become expenditures/expenses of the next fiscal year.
Budgetary control is essentially maintained at the department fund level except for certain grant and aid programs where control is maintained at a program level. Revenues and expenditures are monitored on a continuing basis. State law authorizes the Governor to impose across-the-board pro rata reductions in allotments to ensure revenues and other available funds are sufficient to pay expenses of a given fiscal year.
Separate reports for the General Fund and budgeted Special Revenue Funds presenting detail of the legal level of control and actual expenditures are available from the Department of Management.
GENERAL FUND EXPENDITURE LIMITATION
The Code of Iowa, section 8.54, establishes a state General Fund expenditure limitation of 99.0% of the adjusted revenue estimate. The adjusted revenue estimate is the appropriated revenue estimate for the General Fund for the following fiscal year as determined by the Revenue Estimating Conference, adjusted by subtracting estimated tax refunds payable from that estimated revenue and as determined by the Conference, adding any new revenues
which may be considered to be eligible for deposit into the General Fund. “New revenues” means moneys which are received by the State due to increased tax rates and fees or newly created taxes and fees over and above those moneys which are received due to State taxes and fees which are in effect as of January 1 following the December Revenue Estimating Conference. “New revenues” also includes moneys received by the General Fund of the State due to new transfers over and above those moneys received by the General Fund of the State due to transfers which are in effect as of January 1 following the December Revenue Estimating Conference. The Department of Management shall obtain concurrence from the Revenue Estimating Conference on the eligibility of transfers to the General Fund which are to be considered as new revenue in determining the General Fund expenditure limitation.
This limitation shall be used by the Governor in the preparation of the budget and by the General Assembly in the budget process. If a source for new revenues is proposed, the budget revenue projection used for that new revenue source for the period beginning on the effective date of the new revenue source and ending in the fiscal year in which the source is included in the revenue base shall be an amount determined by subtracting estimated
tax refunds payable from the projected revenue from the new revenue source, multiplied by 95.0%. If a new revenue source is established and implemented, the original General Fund expenditure limitation amount shall be readjusted to include 95.0% of the estimated revenue from the new source.
For fiscal years in which the Iowa Economic Emergency Fund transfers money to the General Fund, the original General Fund expenditure limitation amount provided for shall be readjusted to include the moneys which are so transferred.
The scope of the expenditure limitation shall not encompass federal funds, donations, constitutionally dedicated moneys and moneys in expenditures from State retirement system moneys. The Governor shall submit and the General Assembly shall pass a budget that does not exceed the State General Fund expenditure limitation. The
134

STATE OF IOWA
Required Supplementary Information
Notes to Required Supplementary Information – Budgetary Reporting
Governor shall not submit and the General Assembly shall not pass a budget which in order to balance assumes reversion of a specific amount for the total of the appropriations included in the budget.
RESERVE FUNDS
The Iowa Economic Emergency Fund was created in Iowa Code section 8.55. The fund is separate from the General Fund of the State and the fund is not to be considered part of the balance of the General Fund of the State. The moneys in the fund do not revert to the General Fund. The maximum balance of the fund is equal to 2.5% of the adjusted revenue estimate for the fiscal year. If the amount of moneys in the Iowa Economic Emergency Fund is equal to the maximum balance, moneys in excess of this amount shall be distributed as follows: (1) the first sixty million dollars of the difference between the actual net revenue for the General Fund of the State and the adjusted revenue estimate for the fiscal year shall be transferred to the Taxpayers Trust Fund
established in Iowa Code section 8.57E; (2) the remainder of the excess, if any, shall be transferred to the General Fund of the State. The moneys in this fund may be appropriated by the General Assembly for emergency expenditures; and there is appropriated to the Executive Council an amount sufficient to pay expenses authorized by the Executive Council in Iowa Code section 7D.29. However, except as provided in Iowa Code section 8.58, the balance in the Iowa Economic Emergency Fund may be used in determining the cash position of the General Fund of the State for payment of state obligations. Interest or earnings on moneys deposited in the Iowa Economic Emergency Fund are credited to the Rebuild Iowa Infrastructure Fund established in Iowa Code section 8.57.6.
The Cash Reserve Fund was created in Iowa Code section 8.56. The fund is separate from the General Fund of the State and is not to be considered part of the General Fund of the State except in determining the cash position of the State. The moneys in the Cash Reserve Fund cannot be transferred, used, obligated, appropriated or otherwise encumbered except as provided under Iowa Code section 8.56. Interest or earnings on moneys deposited in the Cash Reserve Fund are credited to the Rebuild Iowa Infrastructure Fund. Moneys in this fund may be used for cash flow purposes provided that any moneys so allocated are returned to the Cash Reserve Fund by the end of each fiscal year. The maximum balance of the fund is equal to 7.5% of the adjusted revenue estimated for the General Fund of the State for the current fiscal year. The moneys in this fund may only be appropriated by the General Assembly for nonrecurring emergency expenditures and shall not be appropriated for payment of any collective bargaining agreement or arbitrator’s decision negotiated or awarded. The balance in the
Cash Reserve Fund may be used in determining the cash position of the General Fund of the State for payment of state obligations. An appropriation shall not be made from the Cash Reserve Fund if the appropriation would cause the fund’s balance to be less than 3.75% of the adjusted revenue estimate for the year for which the appropriation is made unless the bill or joint resolution is approved by vote of at least three-fifths of the members of both chambers of the General Assembly and is signed by the Governor. Also, the appropriation must be contained in a bill or joint resolution in which the appropriation is the only subject matter of the bill or joint resolution, and the bill or joint resolution states the reasons the appropriation is necessary.
135

STATE OF IOWA
Required Supplementary Information
Schedules of Funding Progress
(Expressed in Thousands)
OTHER POSTEMPLOYMENT BENEFITS
Actuarial
Valuation Date
Actuarial
Value Of
Assets
Actuarial
Accrued
Liability
Unfunded
Actuarial
Accrued Liability
(UAAL)
Funded
Ratio
Covered
Payroll
UAAL As A
Percentage Of
Covered
Payroll
State Plan *
July 1, 2012 -$ 233,209$ 233,209$ 0.00% 1,750,968$ 13.32%
July 1, 2012 - 233,209 233,209 0.00% 1,750,968 13.32%
July 1, 2014 - 217,948 217,948 0.00% 1,796,600 12.13%
University Funds **
July 1, 2012 -$ 293,180$ 293,180$ 0.00% 1,349,100$ 21.73%
July 1, 2013 - 383,700 383,700 0.00% 1,394,400 27.52%
July 1, 2014 - 412,300 412,300 0.00% 1,465,200 28.14%
* The entry age actuarial cost method is used to calculate the actuarial accrued liability and the annual required contribution.
** The projected unit credit method is used to calculate the actuarial accrued liability and the annual required contribution.
Other Postemployment Benefits are discussed in detail in the Notes to the Financial Statements
(see NOTE 16 - OTHER POSTEMPLOYMENT BENEFITS).
See accompanying independent auditor's report.
2015
2013
2014
2015
Year Ended
June 30,
2013
2014
136

STATE OF IOWA
Required Supplementary Information
Schedule of the Proportionate Share of the Net Pension Liability
2015
State's proportion of the net pension liability 17.009515%
State's proportionate share of the net pension liability 674,583$
State's covered-employee payroll 1,321,596$
State's proportionate share of the net pension liability
as a percentage of its covered-employee payroll 51.04%
Plan fiduciary net position as a percentage of the total
pension liability 87.61%
* GASB Statement No. 68 requires ten years of information to be presented in this schedule; however, until
a full 10-year trend is compiled, the State will present information for those years for which information is
available.
See accompanying independent auditor's report.
Iowa Public Employees' Retirement System (IPERS)
Last Fiscal Year as of June 30 *
(Expressed in Thousands)
137

STATE OF IOWA
Required Supplementary Information
Schedule of Changes in Net Pension Liability and Related Ratios
2015 2014
Total pension liability
Service cost 11,847$ 11,551$
Interest 40,222 38,880
Changes of benefit terms - (164)
Differences between expected & actual experience (6,609) (7,444)
Benefit payments, including refunds of employee
contributions (26,693) (25,432)
Net change in total pension liability 18,767 17,391
Total pension liability - beginning 515,860 498,469
Total pension liability - ending (a) 534,627$ 515,860$
Plan fiduciary net position
Contributions - employer 18,601$ 17,715$
Contributions - employee 4,991 4,755
Net investment income 21,722 65,436
Benefit payments, including refunds of employee
contributions (26,693) (25,432)
Administrative expense (217) (199)
Net change in fiduciary net position 18,404 62,275
Plan fiduciary net position - beginning 392,195 329,920
Plan fiduciary net position - ending (b) 410,599$ 392,195$
Net pension liability - ending (a) - (b) 124,028$ 123,665$
Plan fiduciary net position as a percentage of the
total pension liability 76.80% 76.03%
Covered-employee payroll 43,873$ 43,845$
Net pension liability as a percentage of covered-
employee payroll 282.70% 282.05%
* GASB Statement No. 68 requires ten years of information to be presented in this schedule; however, until
a full 10-year trend is compiled, the State will present information for those years for which information is
available.
See accompanying independent auditor's report.
Peace Officers' Retirement, Accident and Disability System (PORS)
Last Two Fiscal Years as of June 30 *
(Expressed in Thousands)
138

STATE OF IOWA
Required Supplementary Information
Schedule of Changes in Net Pension Liability and Related Ratios
2015 2014
Total pension liability
Service cost 6,438$ 6,503$
Interest 13,392 13,022
Differences between expected & actual experience (6,586) (3,957)
Benefit payments, including refunds of employee
contributions (10,891) (10,377)
Net change in total pension liability 2,353 5,191
Total pension liability - beginning 183,916 178,725
Total pension liability - ending (a) 186,269$ 183,916$
Plan fiduciary net position
Contributions - employer 8,724$ 8,630$
Contributions - employee 2,665 2,637
Net investment income 7,533 26,172
Benefit payments, including refunds of employee
contributions (10,891) (10,377)
Administrative expense (15) (17)
Net change in fiduciary net position 8,016 27,045
Plan fiduciary net position - beginning 155,974 128,929
Plan fiduciary net position - ending (b) 163,990$ 155,974$
Net pension liability - ending (a) - (b) 22,279$ 27,942$
Plan fiduciary net position as a percentage of the
total pension liability 88.04% 84.81%
Covered-employee payroll 28,510$ 28,203$
Net pension liability as a percentage of covered-
employee payroll 78.14% 99.07%
* GASB Statement No. 68 requires ten years of information to be presented in this schedule; however, until
a full 10-year trend is compiled, the State will present information for those years for which information is
available.
See accompanying independent auditor's report.
Judicial Retirement System (JRS)
Last Two Fiscal Years as of June 30 *
(Expressed in Thousands)
139

STATE OF IOWA
Required Supplementary Information
Schedule of Contributions
2015 2014 2013
Statutorily required contribution 121,715$ 121,168$ 116,592$
Contributions in relation to statutorily
required contributions 121,715 121,168 116,592
Contribution deficiency (excess) -$ -$ -$
State's covered-employee payroll 1,334,798$ 1,321,596$ 1,301,685$
Contributions as a percentage of
covered-employee payroll 9.11% 9.17% 8.96%
* GASB Statement No. 68 requires ten years of information to be presented in this schedule; however, until
a full 10-year trend is compiled, the State will present information for those years for which information is
available.
See Notes to Required Supplementary Information - Schedules of Contributions.
See accompanying independent auditor's report.
Iowa Public Employees' Retirement System (IPERS)
Last Three Fiscal Years *
(Expressed in Thousands)
140

STATE OF IOWA
Required Supplementary Information
Schedule of Contributions
2015 2014 2013 2012 2011
Actuarially determined
contribution 16,957$ 18,187$ 18,665$ 16,623$ 14,967$
Actual employer
contribution 18,601 17,715 11,778 10,741 9,554
Contribution deficiency
(excess) (1,644)$ 472$ 6,887$ 5,882$ 5,413$
Covered-employee payroll 43,873$ 43,845$ 43,621$ 42,965$ 41,539$
Contributions as a
percentage of covered-
employee payroll 42.40% 40.40% 27.00% 25.00% 23.00%
2010 2009 2008 2007 2006
Actuarially determined
contribution 14,237$ 13,356$ 14,374$ 12,592$ 12,231$
Actual employer
contribution 8,499 7,898 6,697 6,263 5,818
Contribution deficiency
(excess) 5,738$ 5,458$ 7,677$ 6,329$ 6,413$
Covered-employee payroll 40,469$ 41,570$ 39,391$ 36,841$ 34,222$
Contributions as a
percentage of covered-
employee payroll 21.00% 19.00% 17.00% 17.00% 17.00%
See Notes to Required Supplementary Information - Schedules of Contributions.
See accompanying independent auditor's report.
Peace Officers' Retirement, Accident and Disability System (PORS)
Last Ten Fiscal Years as of June 30
(Expressed in Thousands)
141

STATE OF IOWA
Required Supplementary Information
Schedule of Contributions
2015 2014 2013 2012 2011
Actuarially determined
contribution 7,709$ 8,376$ 8,445$ 8,364$ 8,308$
Actual employer
contribution 8,724 8,630 8,232 8,216 8,102
Contribution deficiency
(excess) (1,015)$ (254)$ 213$ 148$ 206$
Covered-employee payroll 28,510$ 28,203$ 26,903$ 26,849$ 26,477$
Contributions as a
percentage of covered-
employee payroll 30.60% 30.60% 30.60% 30.60% 30.60%
2010 2009 2008 2007 2006
Actuarially determined
contribution 7,857$ 8,539$ 7,706$ 7,597$ 4,966$
Actual employer
contribution 7,806 7,720 5,451 2,040 2,040
Contribution deficiency
(excess) 51$ 819$ 2,255$ 5,557$ 2,926$
Covered-employee payroll 25,511$ 25,230$ 24,920$ 24,210$ 22,260$
Contributions as a
percentage of covered-
employee payroll 30.60% 30.60% 21.87% 8.43% 9.16%
See Notes to Required Supplementary Information - Schedules of Contributions.
See accompanying independent auditor's report.
Judicial Retirement System (JRS)
Last Ten Fiscal Years as of June 30
(Expressed in Thousands)
142

STATE OF IOWA
Required Supplementary Information
Notes to Required Supplementary Information – Schedules of Contributions
A. Iowa Public Employees’ Retirement System (IPERS)
Changes in Assumptions
The 2014 valuation implemented the following refinements as a result of a quadrennial experience study:
● Decreased the inflation assumption from 3.25% to 3.00%.
● Decreased the assumed rate of interest on member accounts from 4.00% to 3.75% per year.
● Adjusted male mortality rates for retirees in the Regular membership group.
● Reduced retirement rates for sheriffs and deputies between the ages of 55 and 64.
● Moved from an open 30 year amortization period to a closed 30 year amortization period for the UAL
beginning June 30, 2014. Each year thereafter, changes in the UAL from plan experience will be amortized on a separate closed 20 year period.
B. Peace Officers’ Retirement, Accident and Disability System (PORS)
Valuation date: July 1, 2015
PORS is funded with fixed contribution rates for both the employee and employer (State). The actuarially determined contributions are calculated as of the beginning of the fiscal year in which contributions are reported.
The following actuarial methods and assumptions were used to determine the actuarially determined employer contribution reported for the fiscal year ended June 30, 2015:
● Actuarial cost method: Entry age normal
● Amortization method: Level percentage of payroll, closed
● Amortization period: 24 years
● Asset valuation method: 4 year smoothed marked
● Inflation: 3.00%
● Salary increase: 4.25% to 7.25%, including inflation
● Investment rate of return: 8.00% compounded annually, net of investment expense, including inflation
● Mortality: Pre-retirement mortality rates were based on the RP-2000 Mortality Table for Employees, Male and Female, with Generational Projection. Post-retirement mortality rates were based on the RP-2000 Mortality Table for Healthy Annuitants, Male and Female, with Generational Projection. Disability mortality rates were based on the RP-2000 Mortality Table for Healthy Annuitants, Male and Female, with a 5-year set forward and Generational Projection.
Changes of Benefit and Funding Terms
The following changes to the plan provisions were made by the Iowa Legislature and are reflected in the valuation performed as of July 1 listed below:
2015: The State’s contribution rate increased from 31% to 33% of payroll.
2014: The 2014 Legislature passed House File 2450 which provided that cancer and infectious disease, as defined in the bill, will be presumed to have been contracted while the member was on active duty as a result of that duty. The presumption means that such members will be eligible for an accidental disability benefit
rather than an ordinary disability benefit. The member contribution rate increased from 10.85% to 11.35% of payroll. The House File also increased the member contribution rate 0.05% to cover the cost of the benefit change so the total member contribution rate is 11.40%. The State’s contribution rate increases from 29.0% to 31.0% of payroll, as scheduled by law.
143

STATE OF IOWA
Required Supplementary Information
Notes to Required Supplementary Information – Schedules of Contributions
2013: Member contribution rate increased from 10.35% to 10.85% of payroll and the State’s contribution rate increased from 27.00% to 29.00% of payroll.
2012: Member contribution rate increased from 9.85% to 10.35% of payroll and the State’s contribution rate increased from 25.00% to 27.00% of payroll. The first payment of the supplemental state appropriation of $5 million per year until PORS is 85% funded was delayed one year to fiscal year 2014.
2011: Member contribution rate increased from 9.35% to 9.85% of payroll and the State’s contribution rate increased from 23.00% to 25.00% of payroll.
2010: The State’s contribution rate increased from 21.00% to 23.00% of payroll. Legislation passed in the 2012 Session included several provisions that impacted the System:
● The member contribution rate will increase 0.5% each year for four years beginning July 1, 2011. The ultimate member contribution rate is 11.35% in fiscal year 2015.
● The State’s payroll related contributions were scheduled to reach a maximum of 27% in fiscal year 2013. The new law continues the 2% annual increases in the state contribution rate with an ultimate rate of 37% in fiscal year 2018.
● Supplemental State contributions of $5 million annually will be made from the General Fund beginning July 1, 2012 and ending June 30 of the fiscal year in which PORS’ funded ratio reaches 85%.
● Clarifying language changed how the flat dollar escalator is paid. Rather than the payment amount increasing each year after retirement as was done in the past, the flat dollar escalator only increases every five years after retirement. For members and beneficiaries having already received $35 or more, there will be no further adjustments associated with the flat escalator.
2009: The State’s contribution rate increased from 19.00% to 21.00% of payroll.
2008: The 2008 Legislature passed Senate File 2424, which provided for a 2% increase each year in the State’s contribution rate to PORS for five years commencing July 1, 2008. As a result, the State’s contribution rate increased from 17.00% to 19.00% of payroll.
Changes in Assumptions
July 1, 2014 valuation:
● The disability assumption was modified to assume a higher portion of total disabilities will be payable as accidental disabilities as a result of a law passed which provides for a presumption of cancer and infectious diseases are contracted while on active duty.
July 1, 2012 valuation:
● The merit scale component of the salary increase assumption was increased for years of service less than 20 and decreased for years of service more than 20.
● Retirement rates were changed to be age and service based instead of only age based. There are two sets of retirement rates, one if the member has less than 30 years of service and another if the member has 30 or more years of service.
● Wage increase assumption for annual readjustment of pensions was lowered from 4.00% to 3.75%.
● Consumer price inflation was lowered from 3.50% to 3.00%.
● Economic productivity component of the general wage increase assumption was increased from 0.50% to 0.75%.
144

STATE OF IOWA
Required Supplementary Information
Notes to Required Supplementary Information – Schedules of Contributions
July 1, 2007 valuation:
● Change in the mortality assumption to the RP-2000 Mortality Table with general improvements.
● Extend the withdrawal assumption through year 20 and modify rates in years 1 through 5.
● Increase the retirement rates at ages 60 and 61 and decrease the rate at age 59.
● Modify the assumed rate of accidental disability for active members.
● Modify the salary scale, increasing it for shorter years of service and decreasing it for higher years of service.
C. Judicial Retirement System (JRS)
Valuation date: July 1, 2015
JRS is funded with fixed contribution rates for both the employee and employer (State). The actuarially determined contributions are calculated as of the beginning of the fiscal year in which contributions are reported.
The following actuarial methods and assumptions were used to determine the actuarially determined employer contribution reported for the fiscal year ended June 30, 2015 (based on the July 1, 2015 actuarial valuation):
● Actuarial cost method: Entry age normal
● Amortization method: Level dollar, closed
● Amortization period: Initial base established July 1, 2009, over a closed 25 year period. A new base is established in each subsequent year equal to the difference in actual versus expected experience. The new base is amortized over a new, closed 25 year period commencing on the date it is established.
● Asset valuation method: 75% expected value plus 25% market value
● Inflation: 3.00%
● Salary increase: 4.25% including inflation
● Investment rate of return: 7.50% compounded annually, net of investment expense, including inflation
● Mortality: RP-2000 Healthy Annuitant and Employee Mortality Tables with generational improvements and a one year age set back
Changes of Benefit and Funding Terms
The following changes to the plan provisions were made by the Iowa Legislature and are reflected in the valuation performed as of July 1 listed below:
2008: The 2008 Legislature passed a bill which increased both the member and the State contributions. Effective July 1, 2008, the State’s required contribution rate, by statute, is 30.6% until JRS is “fully funded.” The member contribution rate increased from 6.0% to 7.7% for fiscal year 2009, 8.7% for fiscal year 2010 and
9.35% thereafter until JRS is fully funded. Once fully funded, members will pay 40% of the actuarial contribution rate and the employer (State) will pay 60%.
The bill also provided that a Senior Judge could continue beyond age 78, at the discretion of the Supreme
Court. The retirement assumption was not modified so this change in the benefit provisions did not impact the contribution rate.
2006: Changes to the benefit structure passed by the 2006 Legislature increased the benefit multiplier from 3.0% per year of service to 3.25% and the maximum benefit from 60% to 65%. In addition, the eligibility for unreduced benefits was changed to age 50 with 20 years of service. It also provided that the member contribution rate would be reduced if the State contributes less than the statutory contribution rate. As a
145

STATE OF IOWA
Required Supplementary Information
Notes to Required Supplementary Information – Schedules of Contributions
result, in 2006 the judge’s contribution increased to 6% multiplied by a fraction equal to the actual percentage rate contributed by the State divided by 23.7%.
Changes in Assumptions
July 1, 2013 valuation:
● Reduced the salary increase assumption from 4.5% to 4.25%.
● Increased retirement rates to reflect earlier retirement ages.
● The assumption that retiring judges will elect Senior Judge Status was changed from an 80% election,
with 50% relinquishing at age 74 to an 80% election, with 60% relinquishing after 6 years if before 78.
● The adjustment to Senior Judge’s benefit was reduced to reflect the change in the salary increase
assumption.
July 1, 2009 valuation:
● An asset smoothing method to develop the actuarial value of assets was implemented. The actuarial value of assets is equal to the expected value (using the assumed rate of return) plus 25% of the difference between actual market value and expected value.
● The amortization period was reset to a closed 25-year period commencing in 2009. Amortization bases established in subsequent valuations reflect any differences in the actual and expected experience, with that base amortized over a new 25-year period, starting on that valuation date.
July 1, 2008 valuation:
● The Actuarial Cost Method was changed from the Projected Unit Credit (PUC) method to the Entry Age
Normal (EAN) method.
July 1, 2007 valuation:
● Lowered the investment return assumption from 8.0% to 7.5%.
● Changed from the 1983 Group Annuity Mortality Table to the RP-2000 Table with generational mortality improvements with a one year age setback.
● Lowered the salary increase assumption from 5.0% to 4.5%.
● Increased the retirement rates for ages 50-58 and extended the rates from age 68 to age 72.
● Increased the percentage of retiring Judges electing Senior Judge Status from 75% to 80%.
146

S U P P L E M E N T A R Y
I N F O R M A T I O N
147

STATE OF IOWA
Combining Balance Sheet
Nonmajor Governmental Funds - By Fund Type
June 30, 2015
(Expressed in Thousands)
TOTAL
SPECIAL CAPITAL NONMAJOR
REVENUE PROJECTS PERMANENT GOVERNMENTAL
FUNDS FUNDS FUNDS FUNDS
ASSETS
Current assets:
Cash & investments 63,895$ 13,694$ 16,145$ 93,734$
Accounts receivable (net) 15,717 169 - 15,886
Loans receivable (net) 240 - - 240
Due from other funds 428 2,741 - 3,169
Inventory 130 - - 130
Prepaid expenditures 176 - - 176
Total current assets 80,586 16,604 16,145 113,335
Noncurrent assets:
Accounts receivable (net) 7,021 - - 7,021
Loans receivable (net) 1,491 - - 1,491
Total noncurrent assets 8,512 - - 8,512
TOTAL ASSETS 89,098$ 16,604$ 16,145$ 121,847$
LIABILITIES
Current liabilities:
Accounts payable & accruals 2,275$ 6,563$ -$ 8,838$
Due to other funds 8,383 861 - 9,244
Unearned revenue 362 - - 362
TOTAL LIABILITIES 11,020 7,424 - 18,444
DEFERRED INFLOWS OF RESOURCES
Deferred revenue 12,981 - - 12,981
FUND BALANCES
Nonspendable 306 - 16,145 16,451
Spendable:
Restricted 49,034 912 - 49,946
Committed 15,770 8,268 - 24,038
Unassigned (13) - - (13)
TOTAL FUND BALANCES 65,097 9,180 16,145 90,422
TOTAL LIABILITIES, DEFERRED
INFLOWS OF RESOURCES &
FUND BALANCES 89,098$ 16,604$ 16,145$ 121,847$
148

STATE OF IOWA
Combining Statement of Revenues, Expenditures and Changes in Fund Balances
Nonmajor Governmental Funds - By Fund Type
TOTAL
SPECIAL CAPITAL NONMAJOR
REVENUE PROJECTS PERMANENT GOVERNMENTAL
FUNDS FUNDS FUNDS FUNDS
REVENUES
Receipts from other entities 8,215$ 5,145$ -$ 13,360$
Investment income (loss) 422 - (18) 404
Fees, licenses & permits 37,141 - - 37,141
Refunds & reimbursements 4,014 398 - 4,412
Sales, rents & services 4,523 - - 4,523
Miscellaneous 15,784 - 98 15,882
GROSS REVENUES 70,099 5,543 80 75,722
Less revenue refunds 1,945 - - 1,945
NET REVENUES 68,154 5,543 80 73,777
EXPENDITURES
Current:
Administration & regulation 15,131 17 - 15,148
Education 14,956 - - 14,956
Health & human rights 543 14 - 557
Human services 176 - - 176
Justice & public defense 824 81 - 905
Transportation 622 - - 622
Agriculture & natural resources 1,618 6,629 - 8,247
Capital outlay:
Administration & regulation 9 1,590 - 1,599
Education 116 177 - 293
Health & human rights 44 10,526 - 10,570
Human services - 217 - 217
Justice & public defense 68 12,880 - 12,948
Economic development - 329 - 329
Agriculture & natural resources 1 12,439 - 12,440
TOTAL EXPENDITURES 34,108 44,899 - 79,007
EXCESS (DEFICIENCY) OF REVENUES
OVER (UNDER) EXPENDITURES 34,046 (39,356) 80 (5,230)
OTHER FINANCING SOURCES (USES)
Transfers in 772 36,490 18 37,280
Transfers out (37,081) (929) (50) (38,060)
TOTAL OTHER FINANCING SOURCES
(USES) (36,309) 35,561 (32) (780)
NET CHANGE IN FUND BALANCES (2,263) (3,795) 48 (6,010)
FUND BALANCES - JULY 1 67,360 12,975 16,097 96,432
FUND BALANCES - JUNE 30 65,097$ 9,180$ 16,145$ 90,422$
For the Year Ended June 30, 2015
(Expressed in Thousands)
149

IOWA
150
COMBINING FINANCIAL STATEMENTS
Nonmajor Special Revenue Funds
Special Revenue Funds are used to account for specific revenues that are legally restricted to expenditure for particular purposes. Guaranty Agency Operating fund receives collections on defaulted student loans, default aversion fees, account maintenance fees and interest to pay for the operating of the Iowa guaranteed loan program. Second Injury Fund accounts for payments from employers and insurance carriers in each case of compensable injury causing death and annual surcharges as determined by the Commissioner of Insurance per Chapter 85.65A of the Code of Iowa. Except for reimbursements to the Attorney General provided for in Chapter 85.67, payments from the fund are paid only upon the written order of the Workers' Compensation Commissioner to employees who become permanently disabled by a compensable injury, as defined in Chapter 85.64. Quality Assurance Trust Fund receives nursing facility quality assurance assessments imposed by Chapter 249L of the Code of Iowa. These funds are to be used for reimbursement of services for which federal financial participation under the medical assistance program is available to match state funds. Iowa Public Television Foundation is a non-profit corporation that solicits and manages gifts of money and property for Iowa Public Television. Other Special Revenue Funds are aggregated for reporting purposes and
account for various other revenues which must be used for specific purposes.
151

STATE OF IOWA
Combining Balance Sheet
Nonmajor Special Revenue Funds
June 30, 2015
(Expressed in Thousands)
QUALITY IOWA
GUARANTY SECOND ASSURANCE PUBLIC
AGENCY INJURY TRUST TELEVISION OTHER
OPERATING FUND FUND FOUNDATION FUNDS TOTAL
ASSETS
Current assets:
Cash & investments 23,094$ 1,086$ 1,001$ 11,537$ 27,177$ 63,895$
Accounts receivable (net) 3,276 3 9,545 1,468 1,425 15,717
Loans receivable (net) 240 - - - - 240
Due from other funds 75 4 16 10 323 428
Inventory - - - 36 94 130
Prepaid expenditures 79 - - 53 44 176
Total current assets 26,764 1,093 10,562 13,104 29,063 80,586
Noncurrent assets:
Accounts receivable (net) 6,628 - 249 141 3 7,021
Loans receivable (net) 1,491 - - - - 1,491
Total noncurrent assets 8,119 - 249 141 3 8,512
TOTAL ASSETS 34,883$ 1,093$ 10,811$ 13,245$ 29,066$ 89,098$
LIABILITIES
Current liabilities:
Accounts payable & accruals 796$ 189$ -$ 360$ 930$ 2,275$
Due to other funds 16 215 7,256 748 148 8,383
Unearned revenue - - - 348 14 362
TOTAL LIABILITIES 812 404 7,256 1,456 1,092 11,020
DEFERRED INFLOWS OF RESOURCES
Deferred revenue 8,909 - 2,755 1,284 33 12,981
FUND BALANCES
Nonspendable 79 - - 89 138 306
Spendable:
Restricted 25,083 689 - 10,416 12,846 49,034
Committed - - 800 - 14,970 15,770
Unassigned - - - - (13) (13)
TOTAL FUND BALANCES 25,162 689 800 10,505 27,941 65,097
TOTAL LIABILITIES, DEFERRED
INFLOWS OF RESOURCES &
FUND BALANCES 34,883$ 1,093$ 10,811$ 13,245$ 29,066$ 89,098$
152

STATE OF IOWA
Combining Statement of Revenues, Expenditures and Changes in Fund Balances
Nonmajor Special Revenue Funds
QUALITY IOWA
GUARANTY SECOND ASSURANCE PUBLIC
AGENCY INJURY TRUST TELEVISION OTHER
OPERATING FUND FUND FOUNDATION FUNDS TOTAL
REVENUES
Receipts from other entities 7,632$ -$ -$ -$ 583$ 8,215$
Investment income (loss) 112 15 31 (56) 320 422
Fees, licenses & permits - - 28,020 - 9,121 37,141
Refunds & reimbursements 3,540 - - - 474 4,014
Sales, rents & services 13 - - - 4,510 4,523
Miscellaneous - 5,704 - 8,511 1,569 15,784
GROSS REVENUES 11,297 5,719 28,051 8,455 16,577 70,099
Less revenue refunds 5 - - - 1,940 1,945
NET REVENUES 11,292 5,719 28,051 8,455 14,637 68,154
EXPENDITURES
Current:
Administration & regulation - 7,516 - - 7,615 15,131
Education 11,254 - - 3,445 257 14,956
Health & human rights - - - - 543 543
Human services - - - - 176 176
Justice & public defense - - - - 824 824
Transportation - - - - 622 622
Agriculture & natural resources - - - - 1,618 1,618
Capital outlay:
Administration & regulation - - - - 9 9
Education 113 - - - 3 116
Health & human rights - - - - 44 44
Justice & public defense - - - - 68 68
Agriculture & natural resources - - - - 1 1
TOTAL EXPENDITURES 11,367 7,516 - 3,445 11,780 34,108
EXCESS (DEFICIENCY) OF REVENUES
OVER (UNDER) EXPENDITURES (75) (1,797) 28,051 5,010 2,857 34,046
OTHER FINANCING SOURCES (USES)
Transfers in 87 - - - 685 772
Transfers out (58) (215) (29,196) (4,381) (3,231) (37,081)
TOTAL OTHER FINANCING SOURCES
(USES) 29 (215) (29,196) (4,381) (2,546) (36,309)
NET CHANGE IN FUND BALANCES (46) (2,012) (1,145) 629 311 (2,263)
FUND BALANCES - JULY 1 25,208 2,701 1,945 9,876 27,630 67,360
FUND BALANCES - JUNE 30 25,162$ 689$ 800$ 10,505$ 27,941$ 65,097$
For the Year Ended June 30, 2015
(Expressed in Thousands)
153

IOWA
154

STATE OF IOWACombining Schedule of Revenues, Expenditures and Changes in Fund Balances
Budget and Actual - Budgetary Basis
Nonmajor Special Revenue Funds
ORIGINAL FINAL FINAL TO ORIGINAL FINAL FINAL TO
BUDGET BUDGET ACTUAL ACTUAL BUDGET BUDGET ACTUAL ACTUAL
APPROPRIATED REVENUE:
Transfers 617,200$ 617,200$ 604,093$ (13,107)$ 203$ 203$ 647$ 444$
RECEIPTS CREDITED TO APPROPRIATIONS:
Beer tax - - - - - - - -
Cigarette tax - - - - - - - -
Tobacco products tax - - - - - - - -
Liquor tax - - - - - - - -
Other taxes - - - - - - - -
Wagering tax receipts - - - - - - - -
Individual income tax quarterly - - - - - - - -
Sales tax - DOT 5 5 - (5) - - - -
Federal support 338,012 338,012 339,801 1,789 11,000 11,000 15,857 4,857
Local governments 4,600 4,600 7,630 3,030 - - - -
Other states 3,000 3,000 9,154 6,154 - - - -
Reimbursements from other agencies 160 159 5,966 5,807 - - - -
Governmental fund type transfers from other agencies - 1 103,056 103,055 100 100 28 (72)
Interest 1 1 - (1) 200 200 29 (171)
Bonds & loans - 1 119 118 - - - -
Fees, licenses & permits 860 860 2,058 1,198 31,520 31,520 28,515 (3,005)
Refunds & reimbursements - (1) 54 55 200 200 298 98
Sale of real estate 1,710 1,710 6,865 5,155 - - - -
Sale of equipment & salvage - - - - 20 20 2 (18)
Rents & leases 16 16 17 1 5 5 341 336
Agricultural sales - - - - 10 10 18 8
Other sales & services - - - - 502 502 1,361 859
Unearned receipts - - - - 5 5 264 259
Income tax checkoffs - - - - 150 150 129 (21)
Other 2,750 2,750 5,596 2,846 540 540 355 (185)
TOTAL APPROPRIATED RECEIPTS 351,114 351,114 480,316 129,202 44,252 44,252 47,197 2,945
TOTAL REVENUES AVAILABLE 968,314 968,314 1,084,409 116,095 44,455 44,455 47,844 3,389
EXPENDITURES:
Administration & regulation - - - - - - - -
Agriculture & natural resources - - - - - - - -
Economic development - - - - - - - -
Education - - - - - - - -
Health & human services - - - - - - - -
Justice - - - - - - - -
Transportation 517,673 904,759 1,223,638 (318,879) * - - - -
Judicial - - - - - - - -
TOTAL EXPENDITURES 517,673 904,759 1,223,638 (318,879) - - - -
TRANSFERS 297,774 290,221 66,204 224,017 48,223 48,223 52,792 (4,569)
TOTAL EXPENDITURES & TRANSFERS 815,447 1,194,980 1,289,842 (94,862) 48,223 48,223 52,792 (4,569)
REVENUES AVAILABLE OVER (UNDER)
EXPENDITURES & TRANSFERS 152,867 (226,666) (205,433) 21,233 (3,768) (3,768) (4,948) (1,180)
FUND BALANCES - JULY 1 (BUDGETARY) 582,867 505,703 505,703 - 8,777 10,531 10,531 -
FUND BALANCES - JUNE 30 (BUDGETARY) 735,734$ 279,037$ 300,270$ 21,233$ 5,009$ 6,763$ 5,583$ (1,180)$
(continued on next page)
PRIMARY ROAD FUND FISH AND GAME TRUST FUND
For the Year Ended June 30, 2015
(Expressed in Thousands)
155

STATE OF IOWACombining Schedule of Revenues, Expenditures and Changes in Fund Balances
Budget and Actual - Budgetary Basis
Nonmajor Special Revenue Funds
ORIGINAL FINAL FINAL TO ORIGINAL FINAL FINAL TO
BUDGET BUDGET ACTUAL ACTUAL BUDGET BUDGET ACTUAL ACTUAL
APPROPRIATED REVENUE:
Transfers 42,000$ 42,000$ 42,095$ 95$ -$ -$ -$ -$
RECEIPTS CREDITED TO APPROPRIATIONS:
Beer tax - - - - - - - -
Cigarette tax - - - - - - - -
Tobacco products tax - - - - - - - -
Liquor tax - - - - - - - -
Other taxes - - - - - - - -
Wagering tax receipts - - - - - - - -
Individual income tax quarterly - - - - - - - -
Sales tax - DOT - - - - - - - -
Federal support - - 187 187 8,781 7,653 6,276 (1,377)
Local governments - - - - - - - -
Other states - - - - - - - -
Reimbursements from other agencies - - - - - - - -
Governmental fund type transfers from other agencies - - - - - - - -
Interest - - - - 10 10 2 (8)
Bonds & loans - - - - - - - -
Fees, licenses & permits - - - - - - - -
Refunds & reimbursements - - 482 482 - - 34 34
Sale of real estate - - - - - - - -
Sale of equipment & salvage - - - - - - - -
Rents & leases - - - - - - - -
Agricultural sales - - - - - - - -
Other sales & services - - - - - - - -
Unearned receipts - - - - - - - -
Income tax checkoffs - - - - - - - -
Other - - - - - - - -
TOTAL APPROPRIATED RECEIPTS - - 669 669 8,791 7,663 6,312 (1,351)
TOTAL REVENUES AVAILABLE 42,000 42,000 42,764 764 8,791 7,663 6,312 (1,351)
EXPENDITURES:
Administration & regulation 11,994 12,625 14,192 (1,567) * 20,460 20,723 16,667 4,056
Agriculture & natural resources - - - - - - - -
Economic development - - - - - - - -
Education - - - - - - - -
Health & human services - - - - - - - -
Justice - - - - - - - -
Transportation - - - - - - - -
Judicial - - - - - - - -
TOTAL EXPENDITURES 11,994 12,625 14,192 (1,567) 20,460 20,723 16,667 4,056
TRANSFERS 30,180 30,082 29,342 740 - 552 - 552
TOTAL EXPENDITURES & TRANSFERS 42,174 42,707 43,534 (827) 20,460 21,275 16,667 4,608
REVENUES AVAILABLE OVER (UNDER)
EXPENDITURES & TRANSFERS (174) (707) (770) (63) (11,669) (13,612) (10,355) 3,257
FUND BALANCES - JULY 1 (BUDGETARY) 256 10,905 10,905 - 20,325 26,469 26,469 -
FUND BALANCES - JUNE 30 (BUDGETARY) 82$ 10,198$ 10,135$ (63)$ 8,656$ 12,857$ 16,114$ 3,257$
(continued on next page)
For the Year Ended June 30, 2015
(Expressed in Thousands)(continued)
ENVIRONMENT FIRST FUND REVENUE BONDS CAPITAL FUND
156

STATE OF IOWACombining Schedule of Revenues, Expenditures and Changes in Fund Balances
Budget and Actual - Budgetary Basis
Nonmajor Special Revenue Funds
ORIGINAL FINAL FINAL TO ORIGINAL FINAL FINAL TO
BUDGET BUDGET ACTUAL ACTUAL BUDGET BUDGET ACTUAL ACTUAL
APPROPRIATED REVENUE:
Transfers 83,034$ 83,005$ 39,554$ (43,451)$ 742,437$ 742,408$ 686,389$ (56,019)$
RECEIPTS CREDITED TO APPROPRIATIONS:
Beer tax 35 35 65 30 35 35 65 30
Cigarette tax 218,317 218,316 194,364 (23,952) 218,317 218,316 194,364 (23,952)
Tobacco products tax 6,000 6,000 28,711 22,711 6,000 6,000 28,711 22,711
Liquor tax 215 215 248 33 215 215 248 33
Other taxes 1,600 1,600 - (1,600) 1,600 1,600 - (1,600)
Wagering tax receipts 4,996 4,996 - (4,996) 4,996 4,996 - (4,996)
Individual income tax quarterly 5,750 5,750 5,750 - 5,750 5,750 5,750 -
Sales tax - DOT - - - - 5 5 - (5)
Federal support 92,497 72,577 21,557 (51,020) 450,290 429,242 383,678 (45,564)
Local governments 1,461 1,461 1,474 13 6,061 6,061 9,104 3,043
Other states - - - - 3,000 3,000 9,154 6,154
Reimbursements from other agencies 4,031 4,031 5,498 1,467 4,191 4,190 11,464 7,274
Governmental fund type transfers from other agencies 100 200 7,036 6,836 200 301 110,120 109,819
Interest 976 957 1,005 48 1,187 1,168 1,036 (132)
Bonds & loans 6,955 6,935 3,773 (3,162) 6,955 6,936 3,892 (3,044)
Fees, licenses & permits 73,907 74,061 72,638 (1,423) 106,287 106,441 103,211 (3,230)
Refunds & reimbursements 2,639 2,661 5,531 2,870 2,839 2,860 6,399 3,539
Sale of real estate - - - - 1,710 1,710 6,865 5,155
Sale of equipment & salvage - - - - 20 20 2 (18)
Rents & leases - - - - 21 21 358 337
Agricultural sales - - - - 10 10 18 8
Other sales & services 365 365 443 78 867 867 1,804 937
Unearned receipts 306 306 204 (102) 311 311 468 157
Income tax checkoffs - - - - 150 150 129 (21)
Other 2,585 2,586 610 (1,976) 5,875 5,876 6,561 685 - - -
TOTAL APPROPRIATED RECEIPTS 422,735 403,052 348,907 (54,145) 826,892 806,081 883,401 77,320
TOTAL REVENUES AVAILABLE 505,769 486,057 388,461 (97,596) 1,569,329 1,548,489 1,569,790 21,301
EXPENDITURES:
Administration & regulation 139,533 112,547 46,812 65,735 171,987 145,895 77,671 68,224
Agriculture & natural resources 20,141 20,141 15,713 4,428 20,141 20,141 15,713 4,428
Economic development 55,755 60,152 18,316 41,836 55,755 60,152 18,316 41,836
Education 20,609 21,416 11,297 10,119 20,609 21,416 11,297 10,119
Health & human services 4,460 4,255 (237) ^ 4,492 4,460 4,255 (237) 4,492
Justice 2,791 2,451 1,748 703 2,791 2,451 1,748 703
Transportation 4 4 2,508 (2,504) * 517,677 904,763 1,226,146 (321,383) *
Judicial 2,483 2,483 2,004 479 2,483 2,483 2,004 479
TOTAL EXPENDITURES 245,776 223,449 98,161 125,288 795,903 1,161,556 1,352,658 (191,102)
TRANSFERS 330,984 324,965 311,280 13,685 707,161 694,043 459,618 234,425
TOTAL EXPENDITURES & TRANSFERS 576,760 548,414 409,441 138,973 1,503,064 1,855,599 1,812,276 43,323
REVENUES AVAILABLE OVER (UNDER)
EXPENDITURES & TRANSFERS (70,991) (62,357) (20,980) 41,377 66,265 (307,110) (242,486) 64,624
FUND BALANCES - JULY 1 (BUDGETARY) 157,104 172,123 173,119 996 769,329 725,731 726,727 996
FUND BALANCES - JUNE 30 (BUDGETARY) 86,113$ 109,766$ 152,139$ 42,373$ 835,594$ 418,621$ 484,241$ 65,620$
* Actual expenditures exceeded budgeted expenditures as a result of the receipt and legal expenditure of other non-state funds which have been received for restricted purposes. In the Special Revenue Funds this occurred
in the Primary Road Fund and State Aviation Fund in the Transportation function; and the Environment First Fund in the Administration & Regulation function.
^ Actual expenditures are negative in the IowaCare Account Fund in the Health and Human Services function as a result of claim adjustments made for cost settlement activities due to the conclusion of the program.
For the Year Ended June 30, 2015
(Expressed in Thousands)(continued)
OTHER FUNDS TOTAL
157

IOWA
158
COMBINING FINANCIAL STATEMENTS
Nonmajor Capital Projects Funds
Capital Projects Funds are used to account for the construction of major capital facilities other than those financed by proprietary funds and trust funds. General Services Capitals Fund is used to account for various building projects. Endowment for Iowa's Health Restricted Capitals Fund receives the tax-exempt portion of the Tobacco Settlement Authority's refunding of the tobacco bonds for capital project expenditures as allowed in the tax certificate of the refinancing. Marine Fuel Tax Capitals Fund is used to account for the acquisition of water access, development projects, water safety stations, marinas and any other project which improves water recreation. Fish & Game Capitals Fund is used to account for land acquisition and capital projects related to fish and wildlife. Other Capital Projects Funds are aggregated for reporting purposes and account for land acquisition and capital projects related to fish and wildlife, construction of various armories, prison expansion programs and other specific projects.
159

STATE OF IOWA
Combining Balance Sheet
Nonmajor Capital Projects Funds
June 30, 2015
(Expressed in Thousands)
GENERAL ENDOWMENT FOR MARINE FISH
SERVICES IOWA'S HEALTH FUEL TAX GAME &
CAPITALS RESTRICTED CAPITALS CAPITALS OTHER
FUND CAPITALS FUND FUND FUND FUNDS TOTAL
ASSETS
Current assets:
Cash & investments 8,097$ 1,215$ 3,673$ 546$ 163$ 13,694$
Accounts receivable - - 169 - - 169
Due from other funds 1,187 - 517 1,037 - 2,741
TOTAL ASSETS 9,284$ 1,215$ 4,359$ 1,583$ 163$ 16,604$
LIABILITIES
Current liabilities:
Accounts payable & accruals 4,631$ 466$ 346$ 1,120$ -$ 6,563$
Due to other funds 532 - 118 211 - 861
TOTAL LIABILITIES 5,163 466 464 1,331 - 7,424
FUND BALANCES
Spendable:
Restricted - 749 - - 163 912
Committed 4,121 - 3,895 252 - 8,268
TOTAL FUND BALANCES 4,121 749 3,895 252 163 9,180
TOTAL LIABILITIES
& FUND BALANCES 9,284$ 1,215$ 4,359$ 1,583$ 163$ 16,604$
160

STATE OF IOWA
Combining Statement of Revenues, Expenditures and Changes in Fund Balances
Nonmajor Capital Projects Funds
GENERAL ENDOWMENT FOR MARINE FISH
SERVICES IOWA'S HEALTH FUEL TAX GAME &
CAPITALS RESTRICTED CAPITALS CAPITALS OTHER
FUND CAPITALS FUND FUND FUND FUNDS TOTAL
REVENUES
Receipts from other entities 3,953$ -$ 1,192$ -$ -$ 5,145$
Refunds & reimbursements 258 - 140 - - 398
TOTAL REVENUES 4,211 - 1,332 - - 5,543
EXPENDITURES
Current:
Administration & regulation 17 - - - - 17
Health & human rights - 14 - - - 14
Justice & public defense - - - - 81 81
Agriculture & natural resources - - 394 6,235 - 6,629
Capital outlay:
Administration & regulation 1,590 - - - - 1,590
Education 177 - - - - 177
Health & human rights 9,905 621 - - - 10,526
Human services 217 - - - - 217
Justice & public defense 12,825 55 - - - 12,880
Economic development 329 - - - - 329
Agriculture & natural resources 160 - 4,403 7,876 - 12,439
TOTAL EXPENDITURES 25,220 690 4,797 14,111 81 44,899
DEFICIENCY OF REVENUES UNDER
EXPENDITURES (21,009) (690) (3,465) (14,111) (81) (39,356)
OTHER FINANCING SOURCES (USES)
Transfers in 19,767 - 3,223 13,500 - 36,490
Transfers out - (283) (646) - - (929)
TOTAL OTHER FINANCING SOURCES
(USES) 19,767 (283) 2,577 13,500 - 35,561
NET CHANGE IN FUND BALANCES (1,242) (973) (888) (611) (81) (3,795)
FUND BALANCES - JULY 1 5,363 1,722 4,783 863 244 12,975
FUND BALANCES - JUNE 30 4,121$ 749$ 3,895$ 252$ 163$ 9,180$
For the Year Ended June 30, 2015
(Expressed in Thousands)
161

IOWA
162

COMBINING FINANCIAL STATEMENTS
Nonmajor Permanent Funds
Permanent Funds report resources that are legally restricted to the extent that only earnings, and not principal, may be used for the benefit of the government or its citizens.
Permanent School Principal Fund accounts for the principal derived from the sale of specific land. The interest is to be used for educational purposes.
Iowa Cultural Trust Fund accounts for assets held for the Iowa Cultural Trust. The principal is preserved and applicable interest is transferred to the Cultural Grant Fund to be used for purposes consistent with the Trust. Iowa Public Television Foundation Endowment is used to hold a restricted gift made to Iowa Pubic Television. While the corpus of the gift is not available to spend, the earnings of the gift are restricted for the acquisition and/or production of quality family programming. Earnings are transferred to the Iowa Public Television Foundation. Pilot Grove Trust Fund accounts for a $10,000 donation in support and maintenance of the Pilot Grove area. Interest is credited to the Pilot Grove Maintenance Fund, a Special Revenue Fund. Henry Albert Trust Fund accounts for a bequest to the State of Iowa. Interest is credited to the Department of Public Health.
163

STATE OF IOWA
Combining Balance Sheet
Nonmajor Permanent Funds
June 30, 2015
(Expressed in Thousands)
PERMANENT IOWA IOWA PUBLIC PILOT HENERY
SCHOOL CULTURAL TELEVISION GROVE ALBERT
PRINCIPAL TRUST FOUNDATION TRUST TRUST
FUND FUND ENDOWMENT FUND FUND TOTAL
ASSETS
Current assets:
Cash & investments 8,033$ 6,136$ 1,965$ 10$ 1$ 16,145$
TOTAL ASSETS 8,033$ 6,136$ 1,965$ 10$ 1$ 16,145$
FUND BALANCES
Nonspendable 8,033 6,136 1,965 10 1 16,145
TOTAL FUND BALANCES 8,033$ 6,136$ 1,965$ 10$ 1$ 16,145$
164

STATE OF IOWA
Combining Statement of Revenues, Expenditures and Changes in Fund Balances
Nonmajor Permanent Funds
PERMANENT IOWA IOWA PUBLIC PILOT HENERY
SCHOOL CULTURAL TELEVISION GROVE ALBERT
PRINCIPAL TRUST FOUNDATION TRUST TRUST
FUND FUND ENDOWMENT FUND FUND TOTAL
REVENUES
Investment income (loss) -$ -$ (18)$ -$ -$ (18)$
Miscellaneous - - 98 - - 98
TOTAL REVENUES - - 80 - - 80
OTHER FINANCING SOURCES (USES)
Transfers in - - 18 - - 18
Transfers out - (50) - - - (50)
TOTAL OTHER FINANCING SOURCES
(USES) - (50) 18 - - (32)
NET CHANGE IN FUND BALANCES - (50) 98 - - 48
FUND BALANCES - JULY 1 8,033 6,186 1,867 10 1 16,097
FUND BALANCES - JUNE 30 8,033$ 6,136$ 1,965$ 10$ 1$ 16,145$
For the Year Ended June 30, 2015
(Expressed in Thousands)
165

IOWA
166

COMBINING FINANCIAL STATEMENTS
Nonmajor Enterprise Funds
Enterprise Funds account for activities for which fees are charged to external users for goods and services. This fund type is also used when the activity is financed with debt that is secured with fees and charges, as well as when the pricing policy of the activity is designated to recover its costs. Iowa Communications Network accounts for a statewide telecommunications system and its related revenues and expenses. Honey Creek Park is used to account for development of the destination park and park operations. Liquor Control Act is used to account for the revenues and expenses related to the sale of alcoholic beverages. Iowa State Prison Industries accounts for the revenues and expenses related to the sale of products made by prison industries. Other Enterprise Funds are aggregated for reporting purposes and account for other miscellaneous activities that meet the definition of Enterprise Funds.
167

STATE OF IOWA
Combining Statement of Net Position
Nonmajor Enterprise Funds
June 30, 2015
(Expressed in Thousands)
IOWA HONEY LIQUOR IOWA STATE
COMMUNICATIONS CREEK CONTROL PRISON OTHER
NETWORK PARK ACT INDUSTRIES FUNDS TOTAL
ASSETS
Current assets:
Cash & investments 15,267$ 992$ 17,061$ 4,781$ 4,259$ 42,360$
Accounts receivable (net) 11,404 139 6,245 3,593 378 21,759
Due from other funds 23 - 47 3 73 146
Inventory 2,505 189 500 7,651 1,461 12,306
Prepaid expenses 439 166 2,449 39 327 3,420
Total current assets 29,638 1,486 26,302 16,067 6,498 79,991
Noncurrent assets:
Capital assets - nondepreciable 15 - 1,961 4,203 502 6,681
Capital assets - depreciable (net) 16,251 46,650 1,346 5,004 1,335 70,586
Total noncurrent assets 16,266 46,650 3,307 9,207 1,837 77,267
TOTAL ASSETS 45,904 48,136 29,609 25,274 8,335 157,258
DEFERRED OUTFLOWS OF RESOURCES
Related to pensions 792 - 369 536 273 1,970
LIABILITIES
Current liabilities:
Accounts payable & accruals 4,306 438 10,544 1,242 218 16,748
Due to other funds/advances
from other funds - - 11,773 - 90 11,863
Unearned revenue 2,176 815 - 2 - 2,993
Compensated absences 833 - 245 536 193 1,807
Total current liabilities 7,315 1,253 22,562 1,780 501 33,411
Noncurrent liabilities:
Accounts payable & accruals 448 - 364 523 249 1,584
Compensated absences 628 - 142 1,021 168 1,959
Net pension liability 3,812 - 1,804 572 922 7,110
Total noncurrent liabilities 4,888 - 2,310 2,116 1,339 10,653
TOTAL LIABILITIES 12,203 1,253 24,872 3,896 1,840 44,064
DEFERRED INFLOWS OF RESOURCES
Related to pensions 1,801 - 688 1,294 561 4,344
NET POSITION
Net investment in capital assets 16,266 46,650 3,307 9,207 1,837 77,267
Unrestricted 16,426 233 1,111 11,413 4,370 33,553
TOTAL NET POSITION 32,692$ 46,883$ 4,418$ 20,620$ 6,207$ 110,820$
168

STATE OF IOWA
Combining Statement of Revenues, Expenses and Changes in Fund Net Position
Nonmajor Enterprise Funds
IOWA HONEY LIQUOR IOWA STATE
COMMUNICATIONS CREEK CONTROL PRISON OTHER
NETWORK PARK ACT INDUSTRIES FUNDS TOTAL
OPERATING REVENUES
Fees, licenses & permits -$ -$ 16,938$ -$ 4,487$ 21,425$
Refunds & reimbursements - - 37 - 251 288
Sales, rents & services 31,466 6,157 277,825 24,173 1,468 341,089
Miscellaneous - - 2,402 106 819 3,327
TOTAL OPERATING REVENUES 31,466 6,157 297,202 24,279 7,025 366,129
OPERATING EXPENSES
General & administrative 10,026 5,814 - 26 - 15,866
Depreciation 3,186 1,760 94 579 251 5,870
Direct & other 8,317 - - 18,562 569 27,448
Personal services - - 4,004 1,394 2,646 8,044
Travel & subsistence - - 634 16 90 740
Supplies & materials - - 181 26 174 381
Contractual services - 47 3,178 2,093 1,392 6,710
Equipment & repairs - - 144 1 77 222
Claims & miscellaneous 11,600 - 181,775 887 99 194,361
Licenses, permits & refunds - - 695 - 7 702
State aid & credits - - 3,718 - - 3,718
TOTAL OPERATING EXPENSES 33,129 7,621 194,423 23,584 5,305 264,062
OPERATING INCOME (LOSS) (1,663) (1,464) 102,779 695 1,720 102,067
NONOPERATING REVENUES
(EXPENSES)
Taxes - - 7,765 - - 7,765
Investment income 69 1 - 36 12 118
Gain (loss) on sale of capital assets - - (26) (5) 20 (11)
NET NONOPERATING REVENUES 69 1 7,739 31 32 7,872
INCOME (LOSS) BEFORE
TRANSFERS (1,594) (1,463) 110,518 726 1,752 109,939
Transfers in 2,251 102 - - - 2,353
Transfers out - - (110,645) - - (110,645)
CHANGE IN NET POSITION 657 (1,361) (127) 726 1,752 1,647
TOTAL NET POSITION -
JULY 1, RESTATED 32,035 48,244 4,545 19,894 4,455 109,173
TOTAL NET POSITION - JUNE 30 32,692$ 46,883$ 4,418$ 20,620$ 6,207$ 110,820$
For the Year Ended June 30, 2015
(Expressed in Thousands)
169

IOWA
170

STATE OF IOWA
Combining Statement of Cash Flows
Nonmajor Enterprise Funds
For the Year Ended June 30, 2015
(Expressed in Thousands)
IOWA HONEY LIQUOR IOWA STATE
COMMUNICATIONS CREEK CONTROL PRISON OTHER
NETWORK PARK ACT INDUSTRIES FUNDS TOTAL
CASH FLOWS FROM OPERATING ACTIVITIES
Cash received from customers 30,986$ 6,376$ 296,102$ 22,740$ 6,042$ 362,246$
Cash received from miscellaneous - - 2,439 106 819 3,364
Cash payments to suppliers for goods & services (21,759) (5,732) (191,887) (22,896) (2,443) (244,717)
Cash payments to employees for services (8,894) - (4,108) (1,737) (2,835) (17,574)
NET CASH PROVIDED (USED) BY OPERATING ACTIVITIES 333 644 102,546 (1,787) 1,583 103,319
CASH FLOWS FROM NONCAPITAL FINANCING ACTIVITIES
Transfers in from other funds 2,251 102 - - - 2,353
Transfers out to other funds - - (109,661) - - (109,661)
Tax receipts - - 7,765 - - 7,765
NET CASH PROVIDED (USED) BY NONCAPITAL FINANCING ACTIVITIES 2,251 102 (101,896) - - (99,543)
CASH FLOWS FROM CAPITAL & RELATED FINANCING ACTIVITIES
Acquisition & construction of capital assets (1,037) (350) 392 (1,042) (341) (2,378)
Proceeds from sale of capital assets - - (26) (5) 20 (11)
NET CASH PROVIDED (USED) BY CAPITAL & RELATED FINANCING ACTIVITIES (1,037) (350) 366 (1,047) (321) (2,389)
CASH FLOWS FROM INVESTING ACTIVITIES
Interest & dividends on investments 69 1 - 36 12 118
NET CASH PROVIDED BY INVESTING ACTIVITIES 69 1 - 36 12 118
NET INCREASE (DECREASE) IN CASH & CASH EQUIVALENTS 1,616 397 1,016 (2,798) 1,274 1,505 - - - - - -
CASH & CASH EQUIVALENTS - JULY 1 13,651 595 16,045 7,579 2,985 40,855
CASH & CASH EQUIVALENTS - JUNE 30 15,267$ 992$ 17,061$ 4,781$ 4,259$ 42,360$
RECONCILIATION OF OPERATING INCOME (LOSS) TO NET CASH PROVIDED
(USED) BY OPERATING ACTIVITIES
Operating income (loss) (1,663)$ (1,464)$ 102,779$ 695$ 1,720$ 102,067$
Adjustments to reconcile operating income (loss) to net cash
provided (used) by operating activities:
Depreciation 3,186 1,760 94 579 251 5,870
(Increase) decrease in accounts receivable (138) 114 1,385 (1,424) (27) (90)
(Increase) decrease in due from (17) - (46) - (34) (97)
(Increase) decrease in inventory (216) 36 284 (280) (37) (213)
(Increase) decrease in prepaid expenses (248) 48 (2,446) (39) (6) (2,691)
(Increase) decrease in deferred outflows of resources (230) - (103) (56) (106) (495)
Increase (decrease) in accounts payable 18 45 600 8 66 737
Increase (decrease) in due to - - - (1,000) (58) (1,058)
Increase (decrease) in unearned revenue (325) 105 - (9) (103) (332)
Increase (decrease) in compensated absences 113 - 11 (4) (90) 30
Increase (decrease) in net pension liability (1,948) - (700) (1,551) (554) (4,753)
Increase (decrease) in deferred inflows of resources 1,801 - 688 1,294 561 4,344
NET CASH PROVIDED (USED) BY OPERATING ACTIVITIES 333$ 644$ 102,546$ (1,787)$ 1,583$ 103,319$
171

IOWA
172

COMBINING FINANCIAL STATEMENTS
Internal Service Funds
Internal Service Funds account for State activities that provide goods and services to other State departments or agencies on a cost reimbursement basis. Workers' Compensation Fund receives funds associated with the workers' compensation program to pay claims and administrative support costs. Materials & Equipment Revolving Fund accounts for the purchase, repair, maintenance and replacement of equipment, machinery and supplies used by the Department of Transportation. Depreciation Revolving Fund receives monthly depreciation payments from State departments owning vehicles. The money is used to purchase replacement vehicles for the departments. Office of Chief Information Officer Fund provides data processing services to other State departments and agencies. This fund was formerly the Information Technology Revolving Fund. Other Internal Service Funds are aggregated for reporting purposes and account for other miscellaneous activities that meet the definition of Internal Service Funds.
173

STATE OF IOWA
Combining Statement of Net Position
Internal Service Funds
June 30, 2015
(Expressed in Thousands)
MATERIALS OFFICE OF CHIEF
WORKERS' & EQUIPMENT DEPRECIATION INFORMATION
COMPENSATION REVOLVING REVOLVING OFFICER OTHER
FUND FUND FUND FUND FUNDS TOTAL
ASSETS
Current assets:
Cash & investments 4,174$ 22,432$ 22,474$ 4,673$ 16,863$ 70,616$
Accounts receivable (net) 2 49 27 41 544 663
Due from other funds/advances
to other funds 55,856 240 3,278 5,763 14,848 79,985
Inventory - 6,755 - 74 1,340 8,169
Prepaid expenses - - - 1,022 1,398 2,420
Total current assets 60,032 29,476 25,779 11,573 34,993 161,853
Noncurrent assets:
Due from other funds/
advances to other funds - - 259 - - 259
Capital assets - depreciable (net) - 98,670 - 1,667 3,444 103,781
Total noncurrent assets - 98,670 259 1,667 3,444 104,040
TOTAL ASSETS 60,032 128,146 26,038 13,240 38,437 265,893
DEFERRED OUTFLOWS OF RESOURCES
Related to pensions - 440 - 1,141 1,564 3,145
LIABILITIES
Current liabilities:
Accounts payable & accruals 17,778 8,098 31 2,320 4,060 32,287
Due to other funds/advances
from other funds 33 25 - 1,607 11,568 13,233
Unearned revenue - - 22,550 4 84 22,638
Compensated absences - 443 - 1,235 1,162 2,840
Total current liabilities 17,811 8,566 22,581 5,166 16,874 70,998
Noncurrent liabilities:
Accounts payable & accruals 42,204 534 - 710 1,011 44,459
Due to other funds/advances
from other funds - - - - 259 259
Compensated absences 17 752 - 1,282 911 2,962
Net pension liability - 2,185 - 5,044 6,778 14,007
Total noncurrent liabilities 42,221 3,471 - 7,036 8,959 61,687
TOTAL LIABILITIES 60,032 12,037 22,581 12,202 25,833 132,685
DEFERRED INFLOWS OF RESOURCES
Related to pensions - 967 - 2,191 2,844 6,002
NET POSITION
Net investment in capital assets - 98,670 - 1,667 3,444 103,781
Unrestricted - 16,912 3,457 (1,679) 7,880 26,570
TOTAL NET POSITION -$ 115,582$ 3,457$ (12)$ 11,324$ 130,351$
174

STATE OF IOWA
Combining Statement of Revenues, Expenses and Changes in Fund Net Position
Internal Service Funds
MATERIALS OFFICE OF CHIEF
WORKERS' & EQUIPMENT DEPRECIATION INFORMATION
COMPENSATION REVOLVING REVOLVING OFFICER OTHER
FUND FUND FUND FUND FUNDS TOTAL
OPERATING REVENUES
Receipts from other entities 27,968$ 6,131$ 7,916$ 50,412$ 52,443$ 144,870$
Fees, licenses & permits - - - 2 - 2
Refunds & reimbursements 145 63,061 138 209 1,761 65,314
Sales, rents & services - - 1,695 45 286 2,026
Miscellaneous - 4,875 - - 167 5,042
TOTAL OPERATING REVENUES 28,113 74,067 9,749 50,668 54,657 217,254
OPERATING EXPENSES
Depreciation - 14,129 - 670 786 15,585
Personal services 28 5,244 - 13,770 14,275 33,317
Travel & subsistence - 10,142 - 76 8,245 18,463
Supplies & materials - 30,810 - 905 17,815 49,530
Contractual services 2,128 1,494 31 27,064 7,930 38,647
Equipment & repairs - 6,190 10,252 7,987 2,145 26,574
Claims & miscellaneous 25,957 17 - 190 1,296 27,460
Licenses, permits & refunds - 9 7 - 162 178
TOTAL OPERATING EXPENSES 28,113 68,035 10,290 50,662 52,654 209,754
OPERATING INCOME (LOSS) - 6,032 (541) 6 2,003 7,500
NONOPERATING REVENUES
(EXPENSES)
Investment income - - - 21 32 53
Gain on sale of capital assets - - - - 60 60
Loss on sale of capital assets - (4) - - (63) (67)
NET NONOPERATING REVENUES
(EXPENSES) - (4) - 21 29 46
CHANGE IN NET POSITION - 6,028 (541) 27 2,032 7,546
TOTAL NET POSITION -
JULY 1, RESTATED - 109,554 3,998 (39) 9,292 122,805
TOTAL NET POSITION - JUNE 30 -$ 115,582$ 3,457$ (12)$ 11,324$ 130,351$
For the Year Ended June 30, 2015
(Expressed in Thousands)
175

IOWA
176

STATE OF IOWA
Combining Statement of Cash Flows
Internal Service Funds
For the Year Ended June 30, 2015
(Expressed in Thousands)
MATERIALS OFFICE OF CHIEF
WORKERS' & EQUIPMENT DEPRECIATION INFORMATION
COMPENSATION REVOLVING REVOLVING OFFICER OTHER
FUND FUND FUND FUND FUNDS TOTAL
CASH FLOWS FROM OPERATING ACTIVITIES
Cash received from other entities 145$ 12,301$ 1,668$ 416$ 2,617$ 17,147$
Cash received from reciprocal interfund activity 27,113 63,179 11,819 49,775 52,515 204,401
Cash payments to suppliers for goods & services (26,480) (50,645) (10,520) (36,761) (37,787) (162,193)
Cash payments to employees for services - (5,370) - (13,603) (15,130) (34,103)
NET CASH PROVIDED (USED) BY OPERATING ACTIVITIES 778 19,465 2,967 (173) 2,215 25,252
CASH FLOWS FROM CAPITAL & RELATED FINANCING ACTIVITIES
Acquisition & construction of capital assets - (12,039) - (551) (425) (13,015)
NET CASH USED BY CAPITAL & RELATED FINANCING ACTIVITIES - (12,039) - (551) (425) (13,015)
CASH FLOWS FROM INVESTING ACTIVITIES
Interest & dividends on investments - - - 21 32 53
NET CASH PROVIDED BY INVESTING ACTIVITIES - - - 21 32 53
NET INCREASE (DECREASE) IN CASH & CASH EQUIVALENTS 778 7,426 2,967 (703) 1,822 12,290 - - - - - -
CASH & CASH EQUIVALENTS - JULY 1 3,396 15,006 19,507 5,376 15,041 58,326
CASH & CASH EQUIVALENTS - JUNE 30 4,174$ 22,432$ 22,474$ 4,673$ 16,863$ 70,616$
RECONCILIATION OF OPERATING INCOME (LOSS) TO NET CASH
PROVIDED (USED) BY OPERATING ACTIVITIES
Operating income (loss) -$ 6,032$ (541)$ 6$ 2,003$ 7,500$
Adjustments to reconcile operating income (loss) to net cash
provided (used) by operating activities:
Depreciation - 14,129 - 670 786 15,585
(Increase) decrease in accounts receivable 13 1,295 (27) 160 403 1,844
(Increase) decrease in due from (868) 129 844 (375) (1,728) (1,998)
(Increase) decrease in inventory - (622) 359 1 887 625
(Increase) decrease in prepaid expenses - - - 124 (392) (268)
(Increase) decrease in deferred outflows of resources - (118) - (398) (565) (1,081)
Increase (decrease) in accounts payable 1,605 (1,361) (589) (664) (689) (1,698)
Increase (decrease) in due to - (11) (11) (266) 1,762 1,474
Increase (decrease) in unearned revenue - - 2,932 4 38 2,974
Increase (decrease) in compensated absences 28 62 - 715 (572) 233
Increase (decrease) in net pension liability - (1,037) - (2,341) (2,562) (5,940)
Increase (decrease) in deferred inflows of resources - 967 - 2,191 2,844 6,002
NET CASH PROVIDED (USED) BY OPERATING ACTIVITIES 778$ 19,465$ 2,967$ (173)$ 2,215$ 25,252$
177

IOWA
178

COMBINING FINANCIAL STATEMENTS
Pension and Other Employee Benefit Funds
Pension Funds account for transactions, assets, liabilities and net position available for plan benefits of the various State employee retirement systems. See NOTE 15 - PENSION PLANS.
Insurance Fund receives converted sick leave dollars of Department of Public Safety retirees under the Peace Officers contract to pay health and/or life benefits.
SPOC Insurance Fund receives converted sick leave dollars of Department of Natural Resources retirees under the Peace Officers contract to pay health and/or life benefits.
179
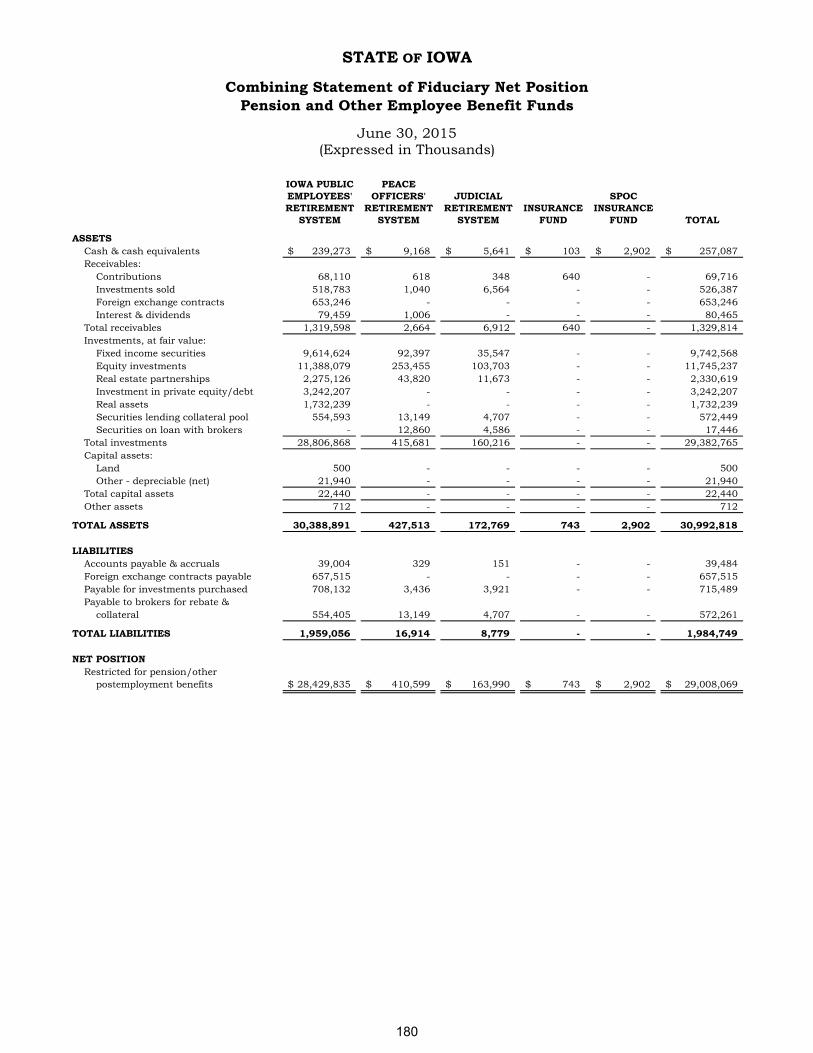
STATE OF IOWA
Combining Statement of Fiduciary Net Position
Pension and Other Employee Benefit Funds
IOWA PUBLIC PEACE
EMPLOYEES' OFFICERS' JUDICIAL SPOC
RETIREMENT RETIREMENT RETIREMENT INSURANCE INSURANCE
SYSTEM SYSTEM SYSTEM FUND FUND TOTAL
ASSETS
Cash & cash equivalents 239,273$ 9,168$ 5,641$ 103$ 2,902$ 257,087$
Receivables:
Contributions 68,110 618 348 640 - 69,716
Investments sold 518,783 1,040 6,564 - - 526,387
Foreign exchange contracts 653,246 - - - - 653,246
Interest & dividends 79,459 1,006 - - - 80,465
Total receivables 1,319,598 2,664 6,912 640 - 1,329,814
Investments, at fair value:
Fixed income securities 9,614,624 92,397 35,547 - - 9,742,568
Equity investments 11,388,079 253,455 103,703 - - 11,745,237
Real estate partnerships 2,275,126 43,820 11,673 - - 2,330,619
Investment in private equity/debt 3,242,207 - - - - 3,242,207
Real assets 1,732,239 - - - - 1,732,239
Securities lending collateral pool 554,593 13,149 4,707 - - 572,449
Securities on loan with brokers - 12,860 4,586 - - 17,446
Total investments 28,806,868 415,681 160,216 - - 29,382,765
Capital assets:
Land 500 - - - - 500
Other - depreciable (net) 21,940 - - - - 21,940
Total capital assets 22,440 - - - - 22,440
Other assets 712 - - - - 712
TOTAL ASSETS 30,388,891 427,513 172,769 743 2,902 30,992,818
LIABILITIES
Accounts payable & accruals 39,004 329 151 - - 39,484
Foreign exchange contracts payable 657,515 - - - - 657,515
Payable for investments purchased 708,132 3,436 3,921 - - 715,489
Payable to brokers for rebate &
collateral 554,405 13,149 4,707 - - 572,261
TOTAL LIABILITIES 1,959,056 16,914 8,779 - - 1,984,749
NET POSITION
Restricted for pension/other
postemployment benefits 28,429,835$ 410,599$ 163,990$ 743$ 2,902$ 29,008,069$
June 30, 2015
(Expressed in Thousands)
180

STATE OF IOWA
Combining Statement of Changes in Fiduciary Net Position
Pension and Other Employee Benefit Funds
IOWA PUBLIC PEACE
EMPLOYEES' OFFICERS' JUDICIAL SPOC
RETIREMENT RETIREMENT RETIREMENT INSURANCE INSURANCE
SYSTEM SYSTEM SYSTEM FUND FUND TOTAL
ADDITIONS
Contributions:
Member contributions 441,213$ 4,991$ 2,665$ 1,024$ 843$ 450,736$
Employer contributions 656,911 18,601 8,724 - - 684,236
Buy-back/buy-in contributions 17,476 - - - - 17,476
Total contributions 1,115,600 23,592 11,389 1,024 843 1,152,448
Investment income:
Net increase in fair value of
investments 622,196 12,577 2,568 - - 637,341
Interest 314,701 3,679 1,586 2 - 319,968
Dividends 109,805 5,141 1,610 - - 116,556
Other 111,321 32 - - - 111,353
Total investment income 1,158,023 21,429 5,764 2 - 1,185,218
Less investment expense 77,978 2,207 731 - - 80,916
Net investment income 1,080,045 19,222 5,033 2 - 1,104,302
Miscellaneous non-investment
income - 2,500 2,500 - - 5,000
TOTAL ADDITIONS 2,195,645 45,314 18,922 1,026 843 2,261,750
DEDUCTIONS
Pension & annuity benefits 1,744,601 26,693 10,891 - - 1,782,185
Payments in accordance with
agreements - - - 831 398 1,229
Administrative expense 12,592 217 15 - - 12,824
Refunds 47,167 - - - - 47,167
TOTAL DEDUCTIONS 1,804,360 26,910 10,906 831 398 1,843,405
CHANGE IN NET POSITION 391,285 18,404 8,016 195 445 418,345
NET POSITION - JULY 1 28,038,550 392,195 155,974 548 2,457 28,589,724
NET POSITION - JUNE 30 28,429,835$ 410,599$ 163,990$ 743$ 2,902$ 29,008,069$
For the Year Ended June 30, 2015
(Expressed in Thousands)
181

IOWA
182

COMBINING FINANCIAL STATEMENTS
Private Purpose Trust Funds
Private Purpose Trust Funds are used to report trust arrangements under which principal and income benefit individuals, private organizations or other governments. Iowa Educational Savings Plan Trust receives contributions from participants for investment for future application towards payment of higher education costs for designated beneficiaries. Iowa Veterans Trust Fund accounts for assets held for the benefit of veterans. The principal is maintained and the applicable interest is transferred to the Veterans Affairs Commission to be used for purposes consistent with the Trust. New legislation amended the fund to allow a portion of the principal to be transferred out of the fund to establish the Iowa Veterans Cemetery. Braille & Sight Saving School Fund receives donations and contributions to be spent for the benefit of the students. Gaining Early Awareness & Readiness for Undergraduate Programs (GEAR-UP) Fund accounts for receipts that are set aside for a scholarship program for students who were in the 7th grade in 2009. Other Private Purpose Trust Funds aggregates the Health Organization Insolvency Fund that received a nonrefundable remittance to cover administration costs if a Health Maintenance Organization (HMO) or Limited Service Organization (LSO) declares bankruptcy, donations and
fund raising receipts for the benefit of veteran residents and the Wagner Award Fund that received a bequest by Ruth Wagner to present an annual recognition to the outstanding soil district commissioner who is 40 years or younger to be presented each year at the annual state conference.
183

STATE OF IOWA
Combining Statement of Fiduciary Net Position
Private Purpose Trust Funds
June 30, 2015
(Expressed in Thousands)
IOWA IOWA
EDUCATIONAL VETERANS BRAILLE &
SAVINGS TRUST SIGHT SAVING GEAR-UP OTHER
PLAN TRUST FUND SCHOOL FUND FUND FUNDS TOTAL
ASSETS
Cash 1,416$ 21,737$ -$ 4,044$ 1,272$ 28,469$
Accounts receivable (net) - 133 602 - - 735
Investments 4,363,485 - - 7,443 - 4,370,928
Capital assets - depreciable (net) 3 - - - 45 48
Other assets 9 - - - 6 15
TOTAL ASSETS 4,364,913 21,870 602 11,487 1,323 4,400,195
LIABILITIES
Accounts payable & accruals 30 43 - - 243 316
NET POSITION
Restricted for individuals, organizations
& other entities 4,364,883$ 21,827$ 602$ 11,487$ 1,080$ 4,399,879$
184

STATE OF IOWA
Combining Statement of Changes in Fiduciary Net Position
Private Purpose Trust Funds
IOWA IOWA
EDUCATIONAL VETERANS BRAILLE &
SAVINGS TRUST SIGHT SAVING GEAR-UP OTHER
PLAN TRUST FUND SCHOOL FUND FUND FUNDS TOTAL
ADDITIONS
Contributions:
Participant contributions 372,404$ -$ -$ -$ 75$ 372,479$
Other contributions 856 26 - - 90 972
Gifts, bequests & endowments - 2,485 - - 133 2,618
Total contributions 373,260 2,511 - - 298 376,069
Investment income (loss):
Net increase (decrease) in fair
value of investments 118,542 5 - (99) - 118,448
Interest - 96 14 232 2 344
Total investment income 118,542 101 14 133 2 118,792
TOTAL ADDITIONS 491,802 2,612 14 133 300 494,861
DEDUCTIONS
Distributions to participants 301,692 691 81 5,897 - 308,361
Other 857 - - 12 307 1,176
TOTAL DEDUCTIONS 302,549 691 81 5,909 307 309,537
CHANGE IN NET POSITION 189,253 1,921 (67) (5,776) (7) 185,324
NET POSITION - JULY 1 4,175,630 19,906 669 17,263 1,087 4,214,555
NET POSITION - JUNE 30 4,364,883$ 21,827$ 602$ 11,487$ 1,080$ 4,399,879$
For the Year Ended June 30, 2015
(Expressed in Thousands)
185

IOWA
186

COMBINING FINANCIAL STATEMENTS
Agency Funds
Agency Funds account for the receipt and disbursement of various taxes, deposits, deductions and property collected by the State, acting in the capacity of an agent, for distribution to other governmental units or organizations. Local Sales & Services Tax Fund is used to account for local option sales taxes collected by retailers and deposited with the State. The taxes are then distributed back to the counties which have jurisdictions imposing local option sales tax. Centralized Payroll Trustee Fund is used to account for accumulation of all voluntary and discretionary payroll deductions from the centralized payroll process. Judicial - Clerks of District Court act as a collecting agency for many fees and taxes that are then distributed to the proper local government or recipient. School District Surtax Clearing Fund collects and distributes surtax to the school districts according to the surtax formula set by the districts. Other Agency Funds are aggregated for reporting purposes and represent amounts held for inmates and residents of State institutions, miscellaneous clearing accounts and other deposits.
187

STATE OF IOWA
Combining Statement of Fiduciary Net Position
Agency Funds
June 30, 2015
(Expressed in Thousands)
SCHOOL
LOCAL CENTRALIZED JUDICIAL - DISTRICT
SALES & PAYROLL CLERKS OF SURTAX
SERVICES TRUSTEE DISTRICT CLEARING OTHER
TAX FUND FUND COURT FUND FUNDS TOTAL
ASSETS
Cash 24,742$ 2,274$ 46,838$ 90,375$ 72,983$ 237,212$
Accounts receivable (net) 113,685 1,644 - 3,693 79,702 198,724
TOTAL ASSETS 138,427$ 3,918$ 46,838$ 94,068$ 152,685$ 435,936$
LIABILITIES
Accounts payable & accruals 138,427$ 3,918$ 46,838$ 94,068$ 152,685$ 435,936$
TOTAL LIABILITIES 138,427$ 3,918$ 46,838$ 94,068$ 152,685$ 435,936$
188

STATE OF IOWA
Combining Statement of Changes in Assets and Liabilities
Agency Funds
BEGINNING ENDING
BALANCE ADDITIONS DEDUCTIONS BALANCE
LOCAL SALES & SERVICES TAX FUND
ASSETS
Cash 65,410$ 830,347$ 871,015$ 24,742$
Accounts receivable 136,457 113,685 136,457 113,685
TOTAL ASSETS 201,867$ 944,032$ 1,007,472$ 138,427$
LIABILITIES
Accounts payable & accruals 201,867$ 944,032$ 1,007,472$ 138,427$
CENTRALIZED PAYROLL TRUSTEE FUND
ASSETS
Cash 2,650$ 882,103$ 882,479$ 2,274$
Accounts receivable 1,388 1,644 1,388 1,644
TOTAL ASSETS 4,038$ 883,747$ 883,867$ 3,918$
LIABILITIES
Accounts payable & accruals 4,038$ 883,747$ 883,867$ 3,918$
JUDICIAL - CLERKS OF DISTRICT COURT
ASSETS
Cash 20,768$ 312,574$ 286,504$ 46,838$
LIABILITIES
Accounts payable & accruals 20,768$ 312,574$ 286,504$ 46,838$
SCHOOL DISTRICT SURTAX CLEARING FUND
ASSETS
Cash 92,795$ 101,818$ 104,238$ 90,375$
Accounts receivable 4,900 3,693 4,900 3,693
TOTAL ASSETS 97,695$ 105,511$ 109,138$ 94,068$
LIABILITIES
Accounts payable & accruals 97,695$ 105,511$ 109,138$ 94,068$
OTHER FUNDS
ASSETS
Cash 105,644$ 1,378,461$ 1,411,122$ 72,983$
Accounts receivable 57,965 79,702 57,965 79,702
TOTAL ASSETS 163,609$ 1,458,163$ 1,469,087$ 152,685$
LIABILITIES
Accounts payable & accruals 163,609$ 1,458,163$ 1,469,087$ 152,685$
TOTAL
ASSETS
Cash 287,267$ 3,505,303$ 3,555,358$ 237,212$
Accounts receivable 200,710 198,724 200,710 198,724
TOTAL ASSETS 487,977$ 3,704,027$ 3,756,068$ 435,936$
LIABILITIES
Accounts payable & accruals 487,977$ 3,704,027$ 3,756,068$ 435,936$
For the Year Ended June 30, 2015
(Expressed in Thousands)
189

IOWA
190

S T A T I S T I C A L
S E C T I O N
191

IOWA
192

Schedule
Financial Trends 1 - 4
Revenue Capacity 5 - 7
Debt Capacity 8 - 9
Demographic and Economic Information 10 - 11
Operating Information 12 - 15
Sources: Unless otherwise noted, the information in these schedules is derived from the
Comprehensive Annual Financial Reports for the relevant year.
STATE OF IOWA
STATISTICAL SECTION
TABLE OF CONTENTS
This part of the State of Iowa's comprehensive annual financial report presents detailed information as
a context for understanding what the information in the financial statements, note disclosures and
required supplementary information says about the State's overall financial health.
These schedules contain trend information to help the reader understand how the
State's financial performance and well-being have changed over time.
These schedules contain information to help the reader assess the State's most
significant revenue source, individual income tax.
These schedules present information to help the reader assess the affordability of
the State's current levels of outstanding debt and the State's ability to issue
additional debt in the future.
These schedules offer demographic and economic indicators to help the reader
understand the environment within which the State's financial activities take
place.
These schedules contain service and infrastructure data to help the reader
understand how the information in the State's financial report relates to the
services the State provides and the activities it performs. A schedule of current
expenditures is also included.
193

STATE OF IOWA
Net Position by Component Schedule 1
2006 2007 2008 (1)
2009 (2)
2010 (3)
2011 (4)
2012 (5)
2013 (6)
2014 2015 (7)
Governmental activities
Net investment in capital assets 5,878,568$ 6,071,498$ 6,193,796$ 6,489,500$ 6,880,376$ 7,042,318$ 7,297,964$ 7,579,657$ 7,960,096$ 8,360,410$
Restricted 1,190,851 954,614 1,096,738 981,399 1,190,535 1,217,229 1,066,451 1,085,008 1,064,266 855,856
Unrestricted 282,317 612,506 490,372 145,222 (86,726) (226,038) 90,401 525,989 413,880 (515,129)
Total governmental activities net position 7,351,736$ 7,638,618$ 7,780,906$ 7,616,121$ 7,984,185$ 8,033,509$ 8,454,816$ 9,190,654$ 9,438,242$ 8,701,137$
Business-type activities
Net investment in capital assets 1,874,011$ 1,962,371$ 1,997,070$ 2,234,564$ 2,268,065$ 2,364,752$ 2,534,247$ 2,700,019$ 2,916,998$ 3,224,968$
Restricted 1,353,063 1,377,602 1,490,766 1,286,727 991,124 1,127,606 1,368,589 1,538,055 1,662,891 1,713,840
Unrestricted 785,313 965,010 1,073,688 968,103 1,347,744 1,593,616 1,687,242 1,734,657 1,921,118 1,861,341
Total business-type activities net position 4,012,387$ 4,304,983$ 4,561,524$ 4,489,394$ 4,606,933$ 5,085,974$ 5,590,078$ 5,972,731$ 6,501,007$ 6,800,149$
Primary government
Net investment in capital assets 7,752,579$ 8,033,869$ 8,190,866$ 8,724,064$ 9,148,441$ 9,407,070$ 9,832,211$ 10,279,676$ 10,877,094$ 11,585,378$
Restricted 2,543,914 2,332,216 2,587,504 2,268,126 2,181,659 2,344,835 2,435,040 2,623,063 2,727,157 2,569,696
Unrestricted 1,067,630 1,577,516 1,564,060 1,113,325 1,261,018 1,367,578 1,777,643 2,260,646 2,334,998 1,346,212
Total primary government net position 11,364,123$ 11,943,601$ 12,342,430$ 12,105,515$ 12,591,118$ 13,119,483$ 14,044,894$ 15,163,385$ 15,939,249$ 15,501,286$
(5) - Fiscal Year 2012 amounts reported include prior period adjustments made in 2013 to reflect the effect of implementation of GASB No. 61 and the inclusion of new component units at the University of Iowa.
(6) - Fiscal Year 2013 amounts reported include prior period adjustments made in 2014 to reflect the effect of implementation of GASB No. 65.
(7) - Fiscal Year 2015 was the first year of implementation of GASB No. 68 and GASB No. 71; therefore, recognized the net pension liability and related deferred amounts.
(4) - Due to changes in legislation, Fiscal Year 2011 amounts reflect a prior period adjustment made in 2012 to reclassify the Department of Economic Development, previously reported in the primary government, to
the Iowa Economic Development Authority, a discretely presented component unit. In addition, during Fiscal Year 2012, the Iowa College Student Aid Commission revalued student loan receivables and related
allowances for doubtful accounts.
(2) - Fiscal Year 2009 amounts reported include prior period adjustments made in 2010 to reflect the effect of implementation of GASB No. 51 for intangible assets and reclassifications of investments at the Iowa Braille
and Sight Saving School from a governmental activity to a fiduciary fund.
(3) - Fiscal Year 2010 amounts reported include prior period adjustments made in 2011 to reflect the effect of implementation of GASB No. 54 and the reclassification of the Iowa Lottery Authority from a blended
component unit to a discretely presented component unit.
For the Last Ten Fiscal Years
(Accrual Basis of Accounting Expressed in Thousands)
Fiscal Year
(1) - Fiscal Year 2008 amounts reported include prior period adjustments made in 2009 to reflect the effect of reclassifications and misstatements of the Department of Natural Resources' capital assets totaling $9.9
million.
194

STATE OF IOWA
Changes in Net Position Schedule 2
2006 2007 2008 (1)
2009 (2)
2010 (3)
2011 (4)
2012 (5)
2013 (6)
2014 2015
Expenses
Governmental activities:
Administration & regulation 924,171$ 881,865$ 900,181$ 1,259,465$ 1,289,713$ 1,383,161$ 1,411,797$ 1,385,398$ 1,436,485$ 1,595,922$
Education 2,948,579 3,071,601 3,352,331 3,502,472 3,447,890 3,601,899 3,551,294 3,582,770 3,749,195 3,909,866
Heath & human rights 367,579 368,342 405,459 450,955 488,380 458,702 423,202 420,844 423,723 422,677
Human services 3,927,888 3,882,041 4,283,160 4,651,972 4,953,873 5,182,496 5,466,172 5,509,926 5,757,061 6,463,802
Justice & public defense 756,968 822,676 945,438 1,209,839 1,178,089 1,098,041 1,082,774 1,095,300 1,255,597 1,202,362
Economic development 223,153 227,266 234,579 329,936 351,635 273,377 254,902 186,948 159,964 158,632
Transportation 930,333 954,278 959,598 1,084,299 1,239,669 1,139,321 1,206,924 1,149,919 1,236,035 1,340,548
Agriculture & natural resources 180,539 193,327 220,995 210,984 212,590 217,783 214,526 219,948 219,159 223,916
Interest expense 77,392 74,053 73,065 62,387 91,432 101,867 101,849 99,311 95,312 92,011
Total governmental activities expenses 10,336,602 10,475,449 11,374,806 12,762,309 13,253,271 13,456,647 13,713,440 13,650,364 14,332,531 15,409,736
Business-type activities:
University Funds 2,850,291 2,942,220 3,155,027 3,401,126 3,341,877 3,465,390 3,842,314 3,960,727 4,156,145 4,339,376
Unemployment Benefits Fund 304,143 342,499 356,261 872,030 1,258,041 928,379 718,611 554,883 439,937 396,842
Other 432,037 363,508 391,077 396,668 213,185 222,239 246,673 257,011 260,564 264,092
Total business-type activities expenses 3,586,471 3,648,227 3,902,365 4,669,824 4,813,103 4,616,008 4,807,598 4,772,621 4,856,646 5,000,310
Total primary government expenses 13,923,073$ 14,123,676$ 15,277,171$ 17,432,133$ 18,066,374$ 18,072,655$ 18,521,038$ 18,422,985$ 19,189,177$ 20,410,046$
Program revenues
Governmental activities:
Charges for services:
Administration & regulation 804,217$ 765,932$ 808,206$ 1,069,214$ 957,591$ 1,063,106$ 1,060,902$ 1,099,289$ 1,061,265$ 1,064,230$
Education 23,117 39,402 47,201 45,794 54,219 61,920 52,686 21,787 18,057 20,656
Health & human rights 45,324 55,086 83,700 71,849 60,885 70,702 66,922 68,865 69,159 80,767
Human services 418,391 448,255 417,733 437,131 465,890 575,377 666,496 438,915 519,909 544,631
Justice & public defense 83,256 60,529 177,293 83,868 102,600 110,215 104,969 89,888 106,730 95,952
Economic development 2,715 2,519 7,125 5,012 3,423 13,795 3,672 3,864 3,374 1,749
Transportation 13,922 30,106 17,695 84,511 84,291 76,404 93,908 106,081 122,683 100,322
Agriculture & natural resources 60,128 78,306 72,564 78,697 86,086 74,295 84,912 78,476 79,777 72,634
Operating grants & contributions 3,699,313 3,247,773 3,471,494 4,345,320 5,309,310 4,921,994 4,489,138 4,619,136 4,905,617 5,349,944
Capital grants & contributions 4,245 283,759 230,585 385,478 590,926 420,006 494,715 426,350 472,885 501,378
Total governmental activities program revenues 5,154,628 5,011,667 5,333,596 6,606,874 7,715,221 7,387,814 7,118,320 6,952,651 7,359,456 7,832,263
Business-type activities:
Charges for services:
University Funds 1,786,355 1,690,465 1,800,897 1,993,932 2,064,853 2,223,527 2,590,308 2,687,569 2,845,788 3,037,054
Unemployment Benefits Fund 348,246 352,067 368,202 358,198 474,465 619,455 643,970 543,535 471,738 410,209
Other 567,966 478,850 506,995 521,913 284,931 297,750 325,699 342,596 355,988 366,129
Operating grants & contributions 458,271 633,957 670,859 987,715 1,333,041 1,200,118 1,044,159 848,672 783,036 746,633
Capital grants & contributions 18,039 30,943 35,225 45,432 8,801 36,197 61,339 61,948 90,263 173,150
Total business-type activities program revenues 3,178,877 3,186,282 3,382,178 3,907,190 4,166,091 4,377,047 4,665,475 4,484,320 4,546,813 4,733,175
Total primary government program revenues 8,333,505$ 8,197,949$ 8,715,774$ 10,514,064$ 11,881,312$ 11,764,861$ 11,783,795$ 11,436,971$ 11,906,269$ 12,565,438$
Net expense
Governmental activities (5,181,974)$ (5,463,782)$ (6,041,210)$ (6,155,435)$ (5,538,050)$ (6,068,833)$ (6,595,120)$ (6,697,713)$ (6,973,075)$ (7,577,473)$
Business-type activities (407,594) (461,945) (520,187) (762,634) (647,012) (238,961) (142,123) (288,301) (309,833) (267,135)
Total primary government net expense (5,589,568)$ (5,925,727)$ (6,561,397)$ (6,918,069)$ (6,185,062)$ (6,307,794)$ (6,737,243)$ (6,986,014)$ (7,282,908)$ (7,844,608)$
(continued on next page)
Fiscal Year
(Accrual Basis of Accounting Expressed in Thousands)
For the Last Ten Fiscal Years
195

STATE OF IOWA
Changes in Net Position Schedule 2
2006 2007 2008 (1)
2009 (2)
2010 (3)
2011 (4)
2012 (5)
2013 (6)
2014 2015
General revenues and other changes in net
position
Governmental activities:
Personal income tax 2,430,981$ 2,673,861$ 2,866,774$ 2,716,655$ 2,637,753$ 2,856,474$ 3,040,391$ 3,446,857$ 3,206,504$ 3,456,503$
Corporate income tax 283,112 322,315 347,833 258,115 196,723 254,761 430,395 428,991 387,232 464,121
Sales & use tax 1,866,864 1,878,500 1,966,871 2,094,893 2,232,711 2,336,298 2,454,156 2,509,817 2,625,302 2,670,084
Other tax 592,888 641,206 783,814 743,231 710,946 685,454 756,713 759,681 756,237 771,702
Motor fuel tax restricted for transportation
purposes 440,652 446,607 443,997 436,732 436,567 445,580 438,953 438,009 446,449 524,569
Road use tax restricted for transportation
purposes 247,125 248,959 257,523 256,554 254,016 281,998 303,368 307,821 322,470 346,901
Unrestricted investment earnings 98,269 146,669 114,987 66,159 25,729 30,696 21,155 6,240 21,406 19,175
Other 29,810 25,807 32,492 30,476 31,571 28,317 27,504 29,746 35,357 36,680
Gain/(loss) on sale of assets - - 571 804 842 51 732 871 1,011 1,401
Loss on extinguishment of debt - - - - - - - - (5,679) -
Contribution to Permanent Fund principal 262 55 4,031 - - - - - - -
Special items - disposal of operations - - - - - - - 5,728 - -
Extraordinary items - impairment of assets
and other - - - - - (4,394) - - - -
Transfers (480,654) (549,206) (598,789) (612,520) (612,563) (503,494) (456,940) (500,210) (575,626) (534,103)
Total governmental activities 5,509,309$ 5,834,773$ 6,220,104$ 5,991,099$ 5,914,295$ 6,411,741$ 7,016,427$ 7,433,551$ 7,220,663$ 7,757,033$
Business-type activities:
Other tax 7,300$ 5,909$ 6,551$ 5,688$ 6,459$ 6,803$ 7,031$ 7,463$ 7,527$ 7,765$
Unrestricted investment earnings 93,651 159,246 69,378 (25,411) 115,200 154,176 90,891 109,987 186,857 46,888
Other 68,209 40,162 46,919 94,068 50,678 47,610 76,091 67,096 68,072 57,303
Gain/(loss) on sale of assets 4,169 18 7 75 101 16 688 78 27 20
Contribution to University Endowments - - - 404 (250) - - - - -
Extraordinary items - impairment of assets
and other - - 55,084 3,160 (15,785) 5,900 991 (2,580) - -
Transfers 480,654 549,206 598,789 612,520 612,563 503,494 456,940 500,210 575,626 534,103
Total business-type activities 653,983$ 754,541$ 776,728$ 690,504$ 768,966$ 717,999$ 632,632$ 682,254$ 838,109$ 646,079$
Change in net position
Governmental activities 327,335$ 370,991$ 178,894$ (164,336)$ 376,245$ 342,908$ 421,307$ 735,838$ 247,588$ 179,560$
Business-type activities 246,389 292,596 256,541 (72,130) 121,954 479,038 490,509 393,953 528,276 378,944
Total primary government 573,724$ 663,587$ 435,435$ (236,466)$ 498,199$ 821,946$ 911,816$ 1,129,791$ 775,864$ 558,504$
(1) - Fiscal Year 2008 amounts reported include prior period adjustments made in 2009 to reflect the effect of reclassifications and misstatements of the Department of Natural Resources' capital assets totaling $9.9 million.
(5) - Fiscal Year 2012 amounts reported include prior period adjustments made in 2013 to reflect the effect of implementation of GASB No. 61 and the inclusion of new component units at the Univesity of Iowa.
(6) - Fiscal Year 2013 amounts reported include prior period adjustments made in 2014 to reflect the effect of implementation of GASB No. 65.
(4) - Due to changes in legislation, 2011 amounts reflect a prior period adjustment made in 2012 to reclassify the Department of Economic Development, previously reported in the primary government, to the Iowa Economic
Development Authority, a discretely presented component unit. In addition, during 2012, the Iowa College Student Aid Commission revalued student loan receivables and related allowances for doubtful accounts.
(3) - Fiscal Year 2010 amounts reported include prior period adjustments made in 2011 to reflect the effect of implementation of GASB No. 54 and the reclassification of the Iowa Lottery Authority from a blended component
unit to a discretely presented component unit.
For the Last Ten Fiscal Years
(2) - Fiscal Year 2009 amounts reported include prior period adjustments made in 2010 to reflect the effect of the implementation of GASB No. 51 for intangible assets and reclassifications of investments at the Iowa Braille
and Sight Saving School from a governmental activity to a fiduciary fund.
Fiscal Year
(continued)
(Accrual Basis of Accounting Expressed in Thousands)
196

STATE OF IOWAFund Balances of Governmental Funds Schedule 3
2006 2007 2008 2009 (2)
2010 (3)
2011 (4)
2012 2013 2014 2015
General Fund
Reserved 1,202,023$ 1,000,811$ 1,178,178$ 1,121,132$ -$ -$ -$ -$ -$ -$
Unreserved 897,708 1,052,537 1,118,497 802,767 - - - - - -
Nonspendable - - - - 31,950 31,364 41,382 43,138 41,248 44,528
Spendable:
Restricted - - - - 1,219,215 1,236,111 1,062,771 1,017,927 1,045,227 861,583
Committed - - - - 1,385,901 1,486,404 1,732,552 2,145,980 1,912,518 1,676,632
Unassigned - - - - (201,720) (250,589) (210,684) (156,800) (214,660) (273,102)
Total General Fund 2,099,731$ 2,053,348$ 2,296,675$ 1,923,899$ 2,435,346$ 2,503,290$ 2,626,021$ 3,050,245$ 2,784,333$ 2,309,641$
All other governmental funds
Reserved 419,404$ 305,336$ 927,732$ (1)
820,497$ (1)
-$ -$ -$ -$ -$ -$
Unreserved, reported in:
Special revenue funds 62,224 48,907 (633,676) (1)
(584,829) (1)
- - - - - -
Capital projects funds 2,056 98,015 82,668 52,417 - - - - - -
Nonspendable - - - - 14,857 15,692 16,192 16,376 16,327 16,451
Spendable:
Restricted - - - - 779,220 (1)
789,149 (1)
667,541 (1)
570,702 (1)
489,259 (1)
437,487 (1)
Committed - - - - 25,347 27,348 26,453 28,346 29,124 24,038
Unassigned - - - - (572,626) (1)
(513,010) (1)
(461,801) (1)
(410,619) (1)
(354,758) (1)
(305,015) (1)
Total all other governmental funds 483,684$ 452,258$ 376,724$ 288,085$ 246,798$ 319,179$ 248,385$ 204,805$ 179,952$ 172,961$
(1) - Due to the implementation of GASB No. 48, interfund advances were recorded in the Tobacco Settlement Authority and Tobacco Collections funds.
(3) - Fiscal Year 2010 amounts reported include prior period adjustments made in 2011 to reflect the effect of implementation of GASB No. 54.
(4) - Due to changes in legislation, Fiscal Year 2011 amounts reflect a prior period adjustment made in 2012 to reclassify the Department of Economic Development, previously reported in the primary government, to the
Iowa Economic Development Authority, a discretely presented component unit. In addition, during Fiscal Year 2012, the Iowa College Student Aid Commission revalued student loan receivables and related allowances for
doubtful accounts.
For the Last Ten Fiscal Years
(2) - Fiscal Year 2009 amounts reported include prior period adjustments made in 2010 to reflect the effect of reclassifications of investments at the Iowa Braille and Sight Saving School from a governmental activity to a
fiduciary fund.
Fiscal Year
(Modified Accrual Basis of Accounting Expressed in Thousands)
197

STATE OF IOWA
Changes in Fund Balances of Governmental Funds Schedule 4
2006 2007 2008 2009 2010 (1)
2011 (2)
2012 2013 2014 2015
Revenues
Taxes 6,491,259$ 6,867,216$ 7,386,422$ 7,333,205$ 7,089,985$ 7,484,244$ 7,985,697$ 8,456,345$ 8,414,849$ 8,917,337$
Receipts from other entities 3,973,158 3,522,809 4,193,259 5,126,503 6,131,238 5,855,250 5,626,029 5,400,502 5,655,703 5,943,765
Investment income 97,418 145,561 118,360 66,294 26,431 29,931 21,766 6,244 21,370 19,141
Fees, licenses & permits 651,726 680,615 690,211 978,396 1,077,664 1,195,283 1,226,093 1,268,880 1,324,029 1,358,661
Refunds & reimbursements 466,900 411,734 431,503 474,081 465,278 539,796 537,219 527,456 576,484 601,812
Sales, rents & services 27,714 28,589 29,143 29,925 34,620 31,400 33,225 32,639 35,827 39,765
Miscellaneous 119,906 120,677 117,568 93,961 118,521 147,736 141,461 150,035 158,048 177,710
Contributions 265 156 48 1,008 - - - - - -
Gross revenues 11,828,346 11,777,357 12,966,514 14,103,373 14,943,737 15,283,640 15,571,490 15,842,101 16,186,310 17,058,191
Less revenue refunds 675,709 686,423 762,926 883,633 954,852 918,313 918,524 909,631 1,039,704 1,066,067
Net revenues 11,152,637 11,090,934 12,203,588 13,219,740 13,988,885 14,365,327 14,652,966 14,932,470 15,146,606 15,992,124
Expenditures
Administration & regulation 909,321 863,429 889,445 1,244,250 1,272,714 1,370,396 1,403,974 1,364,608 1,419,879 1,596,272
Education 2,940,726 3,068,629 3,341,479 3,492,860 3,434,673 3,593,313 3,544,428 3,575,186 3,731,639 3,908,485
Health & human rights 360,180 357,830 389,209 443,841 472,053 451,393 417,306 414,981 418,906 420,907
Human services 3,919,831 3,864,673 4,240,263 4,626,097 4,897,794 5,172,053 5,461,157 5,540,912 5,783,311 6,454,924
Justice & public defense 700,362 771,562 870,244 1,144,444 1,107,809 1,065,068 1,027,435 1,035,912 1,199,871 1,173,037
Economic development 217,701 221,567 220,313 335,429 343,857 270,192 255,299 184,877 159,626 158,282
Transportation 382,576 458,950 416,388 471,563 550,192 542,490 548,629 552,228 580,831 646,481
Agriculture & natural resources 161,172 172,948 181,518 199,639 189,349 198,876 201,838 200,439 201,194 207,823
Capital outlay 878,185 800,188 769,202 1,029,341 1,161,197 962,834 1,136,378 1,012,032 1,128,589 1,238,409
Debt service:
Payment to escrow agent - - - - - - - - 73,940 -
Principal 23,435 28,025 69,575 36,335 29,090 40,495 72,555 49,815 69,215 45,625
Interest & fiscal charges 54,867 53,194 58,621 59,146 86,108 100,122 101,327 98,242 94,875 89,659
Total expenditures 10,548,356 10,660,995 11,446,257 13,082,945 13,544,836 13,767,232 14,170,326 14,029,232 14,861,876 15,939,904
Excess of revenues over
expenditures 604,281 429,939 757,331 136,795 444,049 598,095 482,640 903,238 284,730 52,220
Other financing sources (uses)
Transfers in 453,815 323,251 533,885 538,129 395,422 197,540 197,567 215,291 229,136 200,611
Transfers out (936,073) (869,369) (1,124,271) (1,136,203) (1,004,206) (696,832) (651,385) (713,290) (804,762) (734,713)
Leases, installment purchases & other 530 4,730 848 313 2,340 93 562 9 131 199
Debt issued - 33,370 - - 613,710 311,945 - - - -
Premium (discount) on bonds (555,554) 270 - - 27,027 26,043 1,643 - - -
Refunding debt issued 1,365,435 - - - - - 20,910 - - -
Payments to refund debt - - - - - - - - - -
Payment to refunding escrow agent (666,845) - - - - - - - - -
Total other financing sources (uses) (338,692) (507,748) (589,538) (597,761) 34,293 (161,211) (430,703) (497,990) (575,495) (533,903)
Special items - disposal of operations - - - - - - - (24,604) - -
Net change in fund balances 265,589$ (77,809)$ 167,793$ (460,966)$ 478,342$ 436,884$ 51,937$ 380,644$ (290,765)$ (481,683)$
Debt service as a percentage of
noncapital expenditures <1% <1% 1.2% <1% 0.9% 1.1% 1.3% 1.1% 1.7% 0.9%
(Modified Accrual Basis of Accounting Expressed in Thousands)
Fiscal Year
For the Last Ten Fiscal Years
(1) - Fiscal Year 2010 amounts reported include prior period adjustments made in 2011 to reflect the effect of implementation of GASB No. 54 and the reclassification of the Iowa Lottery Authority from a blended component unit
to a discretely presented component unit.
(2) - Due to changes in legislation, Fiscal Year 2011 amounts reflect a prior period adjustment made in 2012 to reclassify the Department of Economic Development, previously reported in the primary government, to the Iowa
Economic Development Authority, a discretely presented component unit. In addition, during Fiscal Year 2012, the Iowa College Student Aid Commission revalued student loan receivables and related allowances for doubtful
accounts.
198

STATE OF IOWA
Tax Revenue by Source - Governmental Funds Schedule 5
2006 2007 2008 2009 2010 2011 (1)
2012 2013 2014 2015
Individual income tax 2,876,413$ 3,109,609$ 3,366,344$ 3,320,295$ 3,236,054$ 3,476,658$ 3,677,240$ 4,080,794$ 3,984,543$ 4,224,097$
Sales tax 1,600,799 1,590,238 1,639,885 2,002,262 1,910,962 1,983,187 2,066,024 2,097,466 2,171,915 2,251,636
Use tax 557,841 587,009 630,184 374,686 371,195 404,151 439,772 464,126 489,764 501,073
Fuel tax 490,470 500,531 497,613 487,265 482,417 496,486 490,377 481,120 493,999 575,844
Corporate tax 370,333 436,060 464,907 408,578 373,416 401,628 550,343 563,016 507,522 579,881
Inheritance tax 71,640 77,750 79,783 72,562 68,358 65,535 79,670 86,785 90,791 89,807
Insurance premium tax 121,428 105,223 111,647 90,035 88,571 97,098 101,406 104,885 105,532 109,634
Cigarette & tobacco tax 98,936 135,207 251,584 238,153 232,573 226,692 225,499 226,300 225,375 223,069
Wagering tax 249,183 272,210 287,247 282,545 272,361 269,842 287,680 283,168 275,659 280,706
Franchise tax 35,007 33,601 36,813 33,271 31,564 39,423 41,121 43,860 40,330 47,482
Beer tax 14,277 14,264 14,454 14,717 14,503 14,272 14,726 13,865 14,187 14,489
Other 4,932 5,514 5,961 8,835 8,011 9,272 11,839 10,960 15,232 19,619
Gross taxes 6,491,259 6,867,216 7,386,422 7,333,204 7,089,985 7,484,244 7,985,697 8,456,345 8,414,849 8,917,337
Less refunds 576,733 588,552 663,997 786,757 858,281 822,634 820,178 871,332 1,000,031 1,028,612
Net taxes 5,914,526$ 6,278,664$ 6,722,425$ 6,546,447$ 6,231,704$ 6,661,610$ 7,165,519$ 7,585,013$ 7,414,818$ 7,888,725$
Source: State Accounting System and adjusting journal entries from GAAP packages.
Fiscal Year
For the Last Ten Fiscal Years
(Modified Accrual Basis of Accounting Expressed in Thousands)
(1) - Due to changes in legislation, Fiscal Year 2011 amounts reflect a prior period adjustment made in 2012 to reclassify the Department of Economic Development, previously reported in the primary government, to the
Iowa Economic Development Authority, a discretely presented component unit.
199

STATE OF IOWAIndividual Income Tax Returns Filed and Tax Rates Schedule 6
Tax Year 2005 Tax Year 2006 Tax Year 2007 Tax Year 2008 Tax Year 2009
Net Taxable Income Number of Returns Net Taxable Income Number of Returns Net Taxable Income Number of Returns Net Taxable Income Number of Returns Net Taxable Income Number of Returns
No AGI 39,556 No AGI 39,558 No AGI 42,488 No AGI 45,574 No AGI 51,620
$1 - 9,999 372,761 $1 - 9,999 362,337 $1 - 9,999 368,519 $1 - 9,999 356,260 $1 - 9,999 336,423
$10,000 - 19,999 350,536 $10,000 - 19,999 343,506 $10,000 - 19,999 344,833 $10,000 - 19,999 335,220 $10,000 - 19,999 332,440
$20,000 - 29,999 338,342 $20,000 - 29,999 337,101 $20,000 - 29,999 337,340 $20,000 - 29,999 329,579 $20,000 - 29,999 330,853
$30,000 - 39,999 270,292 $30,000 - 39,999 277,113 $30,000 - 39,999 282,702 $30,000 - 39,999 281,286 $30,000 - 39,999 273,662
$40,000 - 49,999 176,395 $40,000 - 49,999 185,575 $40,000 - 49,999 196,874 $40,000 - 49,999 199,752 $40,000 - 49,999 194,025
$50,000 - 74,999 179,890 $50,000 - 74,999 199,518 $50,000 - 74,999 221,027 $50,000 - 74,999 234,607 $50,000 - 74,999 233,380
$75,000 - 99,999 57,841 $75,000 - 99,999 66,119 $75,000 - 99,999 74,841 $75,000 - 99,999 79,374 $75,000 - 99,999 77,882
$100,000 & above 79,060 $100,000 & above 90,788 $100,000 & above 103,651 $100,000 & above 105,736 $100,000 & above 99,179
1,864,673 1,901,615 1,972,275 1,967,388 1,929,464
Net Taxable Income Tax Rate* Net Taxable Income Tax Rate* Net Taxable Income Tax Rate* Net Taxable Income Tax Rate* Net Taxable Income Tax Rate*
$0 - $1,269 0.36% $0 - $1,300 0.36% $0 - $1,343 0.36% $0 - $1,379 0.36% $0 - $1,407 0.36%
$1,269 - 2,538 0.72% $1,300 - 2,600 0.72% $1,343 - 2,686 0.72% $1,379 - 2,758 0.72% $1,407 - 2,814 0.72%
$2,538 - 5,076 2.43% $2,600 - 5,200 2.43% $2,686 - 5,372 2.43% $2,758 - 5,516 2.43% $2,814 - 5,628 2.43%
$5,076 - 11,421 4.50% $5,200 - 11,700 4.50% $5,372 - 12,087 4.50% $5,516 - 12,411 4.50% $5,628 - 12,663 4.50%
$11,421 - 19,035 6.12% $11,700 - 19,500 6.12% $12,087 - 20,145 6.12% $12,411 - 20,685 6.12% $12,663 - 21,105 6.12%
$19,035 - 25,380 6.48% $19,500 - 26,000 6.48% $20,145 - 26,860 6.48% $20,685 - 27,580 6.48% $21,105 - 28,140 6.48%
$25,380 - 38,070 6.80% $26,000 - 39,000 6.80% $26,860 - 40,290 6.80% $27,580 - 41,370 6.80% $28,140 - 42,210 6.80%
$38,070 - 57,105 7.92% $39,000 - 58,500 7.92% $40,290 - 60,435 7.92% $41,370 - 62,055 7.92% $42,210 - 63,315 7.92%
$57,105 & above 8.98% $58,500 & above 8.98% $60,435 & above 8.98% $62,055 & above 8.98% $63,315 & above 8.98%
Tax Year 2010 Tax Year 2011 Tax Year 2012
Net Taxable Income Number of Returns Net Taxable Income Number of Returns Net Taxable Income Number of Returns Net Taxable Income Number of Returns Net Taxable Income Number of Returns
No AGI 49,110 No AGI 52,101 No AGI 52,301 No AGI 53,992
$1 - 9,999 333,307 $1 - 9,999 337,187 $1 - 9,999 326,822 $1 - 9,999 315,190
$10,000 - 19,999 338,049 $10,000 - 19,999 332,596 $10,000 - 19,999 324,978 $10,000 - 19,999 320,585
$20,000 - 29,999 323,039 $20,000 - 29,999 314,841 $20,000 - 29,999 309,181 $20,000 - 29,999 303,974
$30,000 - 39,999 274,706 $30,000 - 39,999 272,314 $30,000 - 39,999 272,654 $30,000 - 39,999 273,340
$40,000 - 49,999 198,580 $40,000 - 49,999 202,716 $40,000 - 49,999 207,046 $40,000 - 49,999 210,320
$50,000 - 74,999 242,170 $50,000 - 74,999 253,213 $50,000 - 74,999 268,326 $50,000 - 74,999 278,264
$75,000 - 99,999 82,412 $75,000 - 99,999 89,113 $75,000 - 99,999 96,439 $75,000 - 99,999 103,702
$100,000 & above 107,941 $100,000 & above 121,578 $100,000 & above 138,830 $100,000 & above 144,703
1,949,314 1,975,659 1,996,577 2,004,070
Net Taxable Income Tax Rate* Net Taxable Income Tax Rate* Net Taxable Income Tax Rate* Net Taxable Income Tax Rate* Net Taxable Income Tax Rate*
$0 - $1,428 0.36% $0-1,439 0.36% $0-1,469 0.36% $0-1,494 0.36% $0-1,515 0.36%
$1,428 - 2,856 0.72% $1,439-2,878 0.72% $1,469-2,938 0.72% $1,494-2,988 0.72% $1,515-3,030 0.72%
$2,856 - 5,712 2.43% $2,878-5,756 2.43% $2,938-5,876 2.43% $2,988-5,976 2.43% $3,030-6,060 2.43%
$5,712 - 12,852 4.50% $5,756-12,951 4.50% $5,876-13,221 4.50% $5,976-13,446 4.50% $6,060-13,635 4.50%
$12,852 - 21,420 6.12% $12,951-21,585 6.12% $13,221-22,035 6.12% $13,446-22,410 6.12% $13,635-22,725 6.12%
$21,420 - 28,560 6.48% $21,585-28,780 6.48% $22,035-29,380 6.48% $22,410-29,880 6.48% $22,725-30,300 6.48%
$28,560 - 42,840 6.80% $28,780-43,170 6.80% $29,380-44,070 6.80% $29,880-44,820 6.80% $30,300-45,450 6.80%
$42,840 - 64,260 7.92% $43,170-64,755 7.92% $44,070-66,105 7.92% $44,820-67,230 7.92% $45,450-68,175 7.92%
$64,260 & above 8.98% $64,755 & above 8.98% $66,105 & above 8.98% $67,230 & above 8.98% $68,175 & above 8.98%
* Iowa is one of three states that allow all taxpayers full deductibility of net federal tax payments.
Source: Iowa Individual Income Tax Annual Statistical Report, compiled by the Iowa Department of Revenue, Tax Research and Program Analysis Section
For the Last Ten Calendar Years
Tax Year 2014
Information not available.
Tax Year 2013
200

STATE OF IOWA
Retail Sales by Business Classification Schedule 7
2006 2007 2008
Number of Taxable Number of Taxable Number of Taxable Number of Taxable Number of Taxable
Classification Businesses Sales Businesses Sales Businesses Sales Businesses Sales Businesses Sales
(in thousands) (in thousands) (in thousands) (in thousands) (in thousands)
Utilities & transportation 13,608 3,480,731$ 14,409 3,253,006$ 14,628 3,385,552$ 14,876 3,517,073$ 14,570 3,416,539$
Building materials 6,744 2,496,945 6,965 2,502,180 6,985 2,470,307 6,981 2,561,077 6,821 2,437,841
General merchandise 6,645 4,851,712 6,862 5,159,008 6,678 5,218,644 6,666 5,428,309 6,478 5,366,827
Food dealers 6,325 1,415,821 6,796 1,503,246 6,833 1,564,199 6,817 1,634,570 6,770 1,713,971
Motor vehicles 14,251 1,686,072 14,843 1,737,850 14,707 1,827,036 15,177 1,926,927 14,210 1,852,142
Apparel 5,786 793,065 6,162 825,421 6,147 841,572 6,326 855,151 6,383 866,270
Home furnishings & appliances 7,509 1,440,372 7,582 1,435,783 7,621 1,469,497 7,960 1,456,128 7,914 1,202,096
Eating & drinking places 27,439 2,895,134 29,893 3,084,773 30,518 3,274,850 30,936 3,359,230 30,435 3,305,611
Specialty retail stores 56,820 2,349,683 60,925 2,418,715 60,964 2,456,805 61,037 2,510,639 60,568 2,496,150
Services 105,712 4,021,968 114,755 4,277,480 116,970 4,476,801 122,863 4,729,859 127,591 4,511,003
Wholesale goods 18,759 2,486,270 19,280 2,469,117 18,788 2,499,040 18,611 2,507,198 18,148 2,227,656
All other 71,340 3,190,615 57,075 2,979,140 59,196 3,604,722 54,838 3,218,496 50,982 2,547,487
Total 340,938 31,108,388$ 345,547 31,645,719$ 350,035 33,089,025$ 353,088 33,704,657$ 350,870 31,943,593$
2011 2012 2013
Number of Taxable Number of Taxable Number of Taxable Number of Taxable Number of Taxable
Businesses Sales Businesses Sales Businesses Sales Businesses Sales Businesses Sales
(in thousands) (in thousands) (in thousands) (in thousands) (in thousands)
Utilities & transportation 14,489 3,428,950$ 14,737 3,405,479$ 15,053 3,335,512$ 14,701 3,483,048$ 14,357 3,632,047$
Building materials 6,636 2,507,236 6,530 2,704,879 6,504 2,712,261 6,059 2,538,244 6,118 2,706,767
General merchandise 6,296 5,408,118 6,211 5,530,952 6,151 5,475,235 3,156 4,650,592 3,093 4,711,009
Food dealers 6,766 1,732,752 6,776 1,772,985 6,729 1,782,829 12,807 3,156,659 12,790 3,297,011
Motor vehicles 13,867 1,967,946 13,723 2,108,205 13,612 2,124,416 9,534 1,704,501 9,428 1,793,580
Apparel 6,312 907,046 6,224 972,815 6,316 1,011,028 6,256 1,044,542 6,221 1,063,320
Home furnishings & appliances 7,615 1,195,401 7,474 1,205,592 7,398 1,202,792 6,246 1,208,754 6,169 1,216,924
Eating & drinking places 30,191 3,434,699 30,248 3,635,252 30,430 3,732,685 30,035 3,827,209 29,889 4,056,025
Specialty retail stores 59,166 2,615,424 58,914 2,759,729 59,103 2,909,350 56,330 2,771,512 55,786 2,911,596
Services 123,085 4,661,026 125,225 4,877,162 126,867 4,945,765 125,773 4,889,626 126,249 5,188,730
Wholesale goods 17,385 2,354,819 16,945 2,568,014 16,659 2,552,248 18,059 3,772,090 17,698 3,929,422
All other 50,573 2,690,600 50,937 2,996,903 50,965 3,016,466 48,831 2,800,836 49,219 3,019,888
Total 342,381 32,904,017$ 343,944 34,537,967$ 345,787 34,800,587$ 337,787 35,847,613$ 337,017 37,526,319$
The sales tax rate had remained at 5% since 1992. In September 2008 the rate increased from 5% to 6%.
In 2014 the Iowa Department of Revenue reclassified the business group and classification of gas stations/convenience stores selling gas from motor vehicles to food dealers.
Source: Iowa Retail Sales and Use Tax Report, compiled by the Iowa Department of Revenue, Tax Research and Fiscal Analysis Section
2009
2014 2015
Sales Tax Annual Period April 1 through March 31 of the following year 2006 through 2015
2010
201

STATE OF IOWARatios of Outstanding Debt by Type Schedule 8
Percentage
Fiscal Revenue Capital Loans & Certificates of Revenue Capital Loans & Total Primary of Personal
Year Bonds Leases Contracts Participation Bonds Leases Contracts Government Income Per Capita
2006 1,091,841$ 3,587$ 2,569$ 1,560$ 837,368$ 137,169$ 4,158$ 2,078,252$ 2.17 701
2007 1,110,582 6,293 2,854 1,020 921,938 157,665 3,431 2,203,783 2.22 739
2008 1,049,536 5,403 2,705 580 1,069,239 149,062 2,570 2,279,095 2.18 763
2009 1,017,620 4,438 2,526 395 1,150,222 145,930 21,283 2,342,414 2.12 780
2010 (1) 1,631,945 5,534 2,339 200 1,280,588 139,407 24,002 3,084,015 2.80 1,025
2011 1,930,626 3,664 2,145 - 1,336,824 143,111 28,119 3,444,489 2.95 1,131
2012 (2) 1,881,714 2,884 2,141 - 1,549,938 173,504 19,021 3,629,202 2.92 1,185
2013 (3) 1,858,333 206 1,834 - 1,787,778 39,323 35,195 3,722,669 2.87 1,211
2014 1,720,281 180 1,600 - 1,852,319 35,606 69,369 3,679,355 2.64 1,191
2015 1,675,590 76 1,474 - 1,903,485 34,200 64,214 3,679,039 2.62 1,184
For the Last Ten Fiscal Years
Personal income and population are based on the calendar year that ends within the fiscal year (See Schedule 10).
Governmental Activities Business-type Activities
(Expressed in Thousands Except Per Capita)
(1) - Fiscal Year 2010 amounts reported reflect the effect of the reclassification of the Iowa Lottery Authority from a blended component unit to a discretely presented component unit.
(2) - Fiscal Year 2012 amounts reflect the prior period adjustments made in 2013 due to the implementation of GASB No. 61 and the inclusion of new component units at the
University of Iowa.
(3) - Fiscal Year 2013 amounts reported include prior period adjustments made in 2014 to reflect the effect of implementation of GASB No. 65.
202

STATE OF IOWARevenue Bond Coverage
For the Last Ten Fiscal Years
Schedule 9
IJOBS-2009
Less: Net Available
Gross Revenues Operating Expenses Revenues Principal Interest Total Coverage
2011 60,220$ -$ 60,220$ 13,750$ 33,273$ 47,023$ 1.28
2012 47,750 9 47,741 14,335 32,686 47,021 1.02
2013 47,523 1 47,522 14,955 32,069 47,024 1.01
2014 49,394 - 49,394 15,580 31,443 47,023 1.05
2015 49,339 3 49,336 16,330 30,720 47,050 1.05
IJOBS-2010
Less: Net Available
Gross Revenues Operating Expenses Revenues Principal Interest Total Coverage
2011 5,121$ -$ 5,121$ -$ 5,121$ 5,121$ 1.00
2012 12,470 3 12,467 4,370 7,878 12,248 1.02
2013 12,470 - 12,470 4,470 7,792 12,262 1.02
2014 10,450 - 10,450 3,160 6,866 10,026 1.04
2015 10,636 1 10,635 3,395 6,741 10,136 1.05
Vision Iowa
Less: Net Available
Gross Revenues Operating Expenses Revenues Principal Interest Total Coverage
2011 15,895$ 3$ 15,892$ 8,925$ 6,967$ 15,892$ 1.00
2012 15,910 8 15,902 9,390 6,512 15,902 1.00
2013 15,934 3 15,931 9,890 6,041 15,931 1.00
2014 15,958 3 15,955 10,445 5,510 15,955 1.00
2015 15,980 3 15,977 11,025 4,939 15,964 1.00
All General Fund pledged revenues consist of casino and racetrack gaming revenues.
Tobacco Settlement Authority
Less: Net Available
Gross Revenues Operating Expenses Revenues Principal Interest Total Coverage
2006 43,189$ 2,929$ 40,260$ 2,555$ 38,681$ 41,236$ 0.98
2007 45,473 260 45,213 6,755 37,111 43,866 1.03
2008 62,302 * 1,253 61,049 14,700 41,656 56,356 1.08
2009 66,576 * 863 65,713 20,540 45,685 66,225 0.99
2010 71,327 * 1,097 70,230 12,510 44,350 56,860 1.24
2011 67,034 * 1,172 65,862 8,720 43,537 52,257 1.26
2012 68,283 * 1,437 66,846 9,590 42,970 52,560 1.27
2013 68,265 * 1,477 66,788 9,835 42,347 52,182 1.28
2014 74,226 * 786 73,440 16,365 41,708 58,073 1.26
2015 66,405 * 702 65,703 11,735 40,644 52,379 1.25
*
(continued on next page)
(Expressed in Thousands)
Governmental Activities - Special Revenue Funds
Debt Service
Due to implementation of GASB Statement No. 48, the Tobacco Settlement Authority no longer reports tobacco settlement
revenues. All tobacco settlement revenues are reported in the Tobacco Collections Fund and funds are then advanced to the
Tobacco Settlement Authority for debt repayment. The amount shown represents the amount advanced and interest income.
Governmental Activities - General Fund
(Expressed in Thousands)
Debt Service
Debt Service
Debt Service
203

STATE OF IOWARevenue Bond Coverage
For the Last Ten Fiscal Years(continued)
Schedule 9
Iowa Utilities Board and Consumer Advocate State Building
Less: Net Available
Gross Revenues Operating Expenses Revenues Principal Interest Total Coverage
2011 887$ -$ 887$ 250$ 637$ 887$ 1.00
2012 1,064 - 1,064 440 624 1,064 1.00
2013 1,062 - 1,062 460 602 1,062 1.00
2014 1,064 - 1,064 485 579 1,064 1.00
2015 1,065 - 1,065 510 555 1,065 1.00
Pledged revenues are from utility company assessments.
Prison Infrastructure 2010
Less: Net Available
Gross Revenues Operating Expenses Revenues Principal Interest Total Coverage
2011 6,612$ -$ 6,612$ -$ 5,698$ 5,698$ 1.16
2012 6,522 - 6,522 435 6,087 6,522 1.00
2013 6,518 - 6,518 440 6,078 6,518 1.00
2014 6,514 - 6,514 445 6,069 6,514 1.00
2015 8,728 9 8,719 2,660 6,060 8,720 1.00
Pledged revenues are from fines, fees and forfeited bail receipts.
Residence/Dormitory Building Revenue Bonds
Less: Net Available
Gross Revenues Operating Expenses* Revenues Principal Interest Total Coverage
2006 127,116$ 93,318$ 33,798$ 9,982$ 8,828$ 18,810$ 1.80
2007 136,767 99,554 37,213 10,672 8,626 19,298 1.93
2008 144,557 103,401 41,156 10,147 8,427 18,574 2.22
2009 154,572 111,814 42,758 10,877 8,269 19,146 2.23
2010 158,830 110,914 47,916 11,273 7,812 19,085 2.51
2011 166,881 116,908 49,973 12,948 7,015 19,963 2.50
2012 185,808 133,069 52,739 15,884 6,095 21,979 2.40
2013 189,843 135,514 54,329 16,394 6,284 22,678 2.40
2014 200,450 144,756 55,694 19,099 7,141 26,240 2.12
2015 211,730 150,381 61,349 20,844 7,032 27,876 2.20
Athletic/Multipurpose/Academic Facilities Revenue Bonds
Less: Net Available
Gross Revenues* Operating Expenses* Revenues Principal Interest Total Coverage
2006 24,760$ 8,505$ 16,255$ 2,175$ 3,498$ 5,673$ 2.87
2007 36,014 13,482 22,532 4,060 6,109 10,169 2.22
2008 42,095 16,754 25,341 3,600 6,586 10,186 2.49
2009 51,506 18,518 32,988 4,180 6,817 10,997 3.00
2010 51,833 19,809 32,024 4,570 7,352 11,922 2.69
2011 53,076 15,970 37,106 5,186 8,041 13,227 2.81
2012 49,198 18,106 31,092 5,480 7,776 13,256 2.35
2013 49,793 17,638 32,155 6,530 8,550 15,080 2.13
2014 50,729 17,683 33,046 7,225 8,015 15,240 2.17
2015 54,397 18,755 35,642 7,485 7,849 15,334 2.32
(continued on next page)
Debt Service*
Business-type Activities - University Funds
Debt Service*
(Expressed in Thousands)
Governmental Activities - Capital Projects Funds
(Expressed in Thousands)
Debt Service
Debt Service
204

STATE OF IOWARevenue Bond Coverage
For the Last Ten Fiscal Years(continued)
Schedule 9
Telecommunications Revenue Bonds
Less: Net Available
Gross Revenues Operating Expenses Revenues Principal Interest Total Coverage
2006 18,124$ 11,809$ 6,315$ 2,495$ 918$ 3,413$ 1.85
2007 19,574 13,452 6,122 2,575 842 3,417 1.79
2008 20,190 13,683 6,507 2,655 759 3,414 1.91
2009 23,323 15,653 7,670 2,825 435 3,260 2.35
2010 21,114 15,317 5,797 2,925 911 3,836 1.51
2011 23,164 15,555 7,609 3,015 1,219 4,234 1.80
2012 24,317 18,027 6,290 2,440 1,649 4,089 1.54
2013 24,789 17,920 6,869 2,945 1,467 4,412 1.56
2014 23,615 17,260 6,355 2,470 1,378 3,848 1.65
2015 27,136 21,667 5,469 1,835 1,305 3,140 1.74
Student Health Facility Revenue Bonds
Less: Net Available
Gross Revenues Operating Expenses* Revenues Principal Interest Total Coverage
2006 10,057$ 7,550$ 2,507$ 675$ 399$ 1,074$ 2.33
2007 10,684 8,177 2,507 700 369 1,069 2.35
2008 11,374 8,684 2,690 735 339 1,074 2.50
2009 11,521 9,340 2,181 770 305 1,075 2.03
2010 11,914 8,897 3,017 800 269 1,069 2.82
2011 12,041 9,148 2,893 840 233 1,073 2.70
2012 10,811 9,311 1,500 515 128 643 2.33
2013 3,440 3,200 240 175 106 281 0.85
2014 3,751 3,205 546 195 58 253 2.16
2015 3,616 3,238 378 205 46 251 1.51
Utility System Revenue Bonds
Less: Net Available
Gross Revenues Operating Expenses* Revenues Principal Interest Total Coverage
2006 89,162$ 66,673$ 22,489$ 6,955$ 4,339$ 11,294$ 1.99
2007 96,416 67,840 28,576 7,240 6,062 13,302 2.15
2008 104,481 72,871 31,610 8,610 7,841 16,451 1.92
2009 106,149 78,194 27,955 9,820 7,967 17,787 1.57
2010 109,638 77,000 32,638 11,810 7,484 19,294 1.69
2011 117,663 80,882 36,781 11,230 7,642 18,872 1.95
2012 122,367 83,958 38,409 12,540 7,221 19,761 1.94
2013 126,495 87,043 39,452 14,845 7,949 22,794 1.73
2014 131,716 93,079 38,637 13,845 7,539 21,384 1.81
2015 130,696 89,181 41,515 8,915 7,100 16,015 2.59
Parking System Revenue Bonds
Less: Net Available
Gross Revenues Operating Expenses Revenues Principal Interest Total Coverage
2006 16,825$ 10,732$ 6,093$ 1,320$ 1,440$ 2,760$ 2.21
2007 18,048 10,760 7,288 1,365 1,395 2,760 2.64
2008 18,412 12,234 6,178 1,410 1,346 2,756 2.24
2009 19,354 12,261 7,093 1,455 1,294 2,749 2.58
2010 18,562 13,459 5,103 1,490 1,195 2,685 1.90
2011 18,876 12,145 6,731 1,550 1,136 2,686 2.51
2012 19,984 12,655 7,329 1,605 1,068 2,673 2.74
2013 21,076 13,108 7,968 1,680 930 2,610 3.05
2014 22,574 13,679 8,895 1,750 1,677 3,427 2.60
2015 24,214 14,266 9,948 1,970 2,049 4,019 2.48
(continued on next page)
Debt Service*
Debt Service*
Debt Service*
Debt Service*
Business-type Activities - University Funds
(Expressed in Thousands)
205

STATE OF IOWARevenue Bond Coverage
For the Last Ten Fiscal Years(continued)
Schedule 9
Recreational/Regulated Materials Facility Revenue Bonds
Less: Net Available
Gross Revenues Operating Expenses Revenues Principal Interest Total Coverage
2006 3,938$ 154$ 3,784$ 1,465$ 442$ 1,907$ 1.98
2007 4,110 74 4,036 1,525 393 1,918 2.10
2008 5,228 2,108 3,120 1,560 1,372 2,932 1.06
2009 5,080 1,726 3,354 395 2,360 2,755 1.22
2010 16,451 4,243 12,208 955 4,985 5,940 2.06
2011 24,151 8,815 15,336 1,845 5,593 7,438 2.06
2012 28,573 10,573 18,000 2,260 5,529 7,789 2.31
2013 34,787 11,649 23,138 4,005 5,449 9,454 2.45
2014 38,799 12,880 25,919 4,380 5,244 9,624 2.69
2015 42,613 12,921 29,692 3,635 5,094 8,729 3.40
Memorial/Maucker Union Revenue Bonds
Less: Net Available
Gross Revenues* Operating Expenses* Revenues Principal Interest Total Coverage
2006 38,367$ 30,729$ 7,638$ 2,065$ 2,100$ 4,165$ 1.83
2007 41,138 32,165 8,973 2,215 1,967 4,182 2.15
2008 41,428 32,933 8,495 2,290 1,897 4,187 2.03
2009 39,803 32,187 7,616 2,005 1,819 3,824 1.99
2010 44,138 36,262 7,876 1,655 1,749 3,404 2.31
2011 45,722 37,319 8,403 1,720 1,691 3,411 2.46
2012 34,367 26,657 7,710 1,950 1,427 3,377 2.28
2013 32,567 24,820 7,747 1,925 1,362 3,287 2.36
2014 31,881 23,760 8,121 2,130 1,033 3,163 2.57
2015 31,259 22,579 8,680 2,210 894 3,104 2.80
Hospital Revenue Bonds
Less: Net Available
Gross Revenues* Operating Expenses* Revenues Principal Interest Total Coverage
2006 773,841$ 683,260$ 90,581$ 580$ 1,119$ 1,699$ 53.31
2007 814,693 708,788 105,905 610 1,094 1,704 62.15
2008 871,173 784,225 86,948 635 2,326 2,961 29.36
2009 928,193 863,979 64,214 2,065 3,314 5,379 11.94
2010 943,458 842,556 100,902 3,615 5,458 9,073 11.12
2011 1,033,448 903,039 130,409 3,500 4,959 8,459 15.42
2012 1,098,292 981,872 116,420 3,680 5,891 9,571 12.16
2013 1,125,336 1,013,711 111,625 4,870 10,159 15,029 7.43
2014 1,189,532 1,061,304 128,228 5,905 13,797 19,702 6.51
2015 1,314,267 1,155,470 158,797 11,205 13,469 24,674 6.44
Center For University Advancement Revenue Bonds
Less: Net Available
Gross Revenues* Operating Expenses Revenues Principal Interest Total Coverage
2006 897$ -$ 897$ 510$ 387$ 897$ 1.00
2007 870 - 870 535 367 902 0.96
2008 905 - 905 560 347 907 1.00
2009 945 - 945 575 337 912 1.04
2010 915 - 915 590 303 893 1.02
2011 890 - 890 610 280 890 1.00
2012 865 - 865 610 255 865 1.00
2013 876 - 876 645 231 876 1.00
2014 874 - 874 670 204 874 1.00
2015 865 - 865 690 175 865 1.00
All University Funds pledged revenues consist of charges for services which include room and board fees.
* - Certain amounts have been revised to reflect changes made by the Universities.
Source: Information provided by the Treasurer of State, Tobacco Settlement Authority and Universities.
Debt Service
Debt Service*
Debt Service*
Debt Service*
Business-type Activities - University Funds
(Expressed in Thousands)
206

STATE OF IOWA
Demographic and Economic Statistics
For the Last Ten Calendar Years
Schedule 10
2005 2006 2007 2008 2009 2010 2011 2012 2013 2014
Population (in thousands ) 2,966 2,982 2,988 3,003 3,008 3,046 3,062 3,074 3,090 3,107
Personal income (in millions ) 95,858$ 99,112$ 104,651$ 110,135$ 110,541$ 116,616$ 123,933$ 129,503$ 139,422$ 140,177$
Per capita personal income 32,315$ 33,236$ 35,023$ 36,680$ 36,751$ 38,281$ 40,470$ 42,126$ 45,114$ 45,115$
Resident civilian labor force and employment (annual averages )
Civilian labor force (in thousands ) 1,659.8 1,664.3 1,661.0 1,676.0 1,673.9 1,670.3 1,663.6 1,638.8 1,671.3 1,704.4
Resident employment (in thousands ) 1,584.1 1,602.8 1,598.3 1,607.0 1,574.3 1,567.7 1,565.5 1,553.1 1,593.7 1,630.4
Resident unemployed (in thousands ) 75.7 61.5 62.7 69.0 99.7 102.6 98.0 85.7 77.6 74.0
Percent unemployed 4.6 3.7 3.8 4.1 6.0 6.1 5.9 5.2 4.6 4.3
Employment by industry, non-agricultural (in thousands)
Construction 71.2 74.8 72.5 73.0 64.8 61.6 62.5 64.6 67.4 74.4
Manufacturing 229.5 230.9 229.4 227.8 203.7 200.1 207.4 210.4 214.5 216.8
Trade, transportation and utilities 306.8 308.6 308.8 309.2 302.0 300.0 301.9 306.8 311.4 312.9
Information 33.3 32.8 33.5 33.3 30.4 28.5 27.9 27.1 26.1 25.6
Financial activities 98.3 100.6 102.6 102.9 101.8 101.2 100.3 101.6 103.4 104.2
Professional and business 112.6 117.0 120.9 121.5 117.6 121.7 123.5 129.5 131.9 136.1
Education and health 195.3 199.0 202.3 206.7 211.0 213.5 215.9 220.6 223.2 223.2
Leisure and hospitality 129.6 132.7 136.7 135.3 132.4 129.7 130.6 134.2 136.7 137.9
Other services 56.2 56.6 57.7 57.7 57.6 57.0 56.5 57.7 60.2 61.3
Government 245.5 247.3 249.7 252.7 254.7 253.6 249.8 254.0 255.4 255.5
Total non-agricultural employment 1,478.3 1,500.3 1,514.1 1,520.1 1,476.0 1,466.9 1,476.3 1,506.5 1,530.2 1,547.9
Source: U.S. Department of Commerce, Bureau of Economic Analysis and Iowa Workforce Development, Labor Market Information Unit in cooperation with the U.S. Department of
Labor, Bureau of Labor Statistics.
207
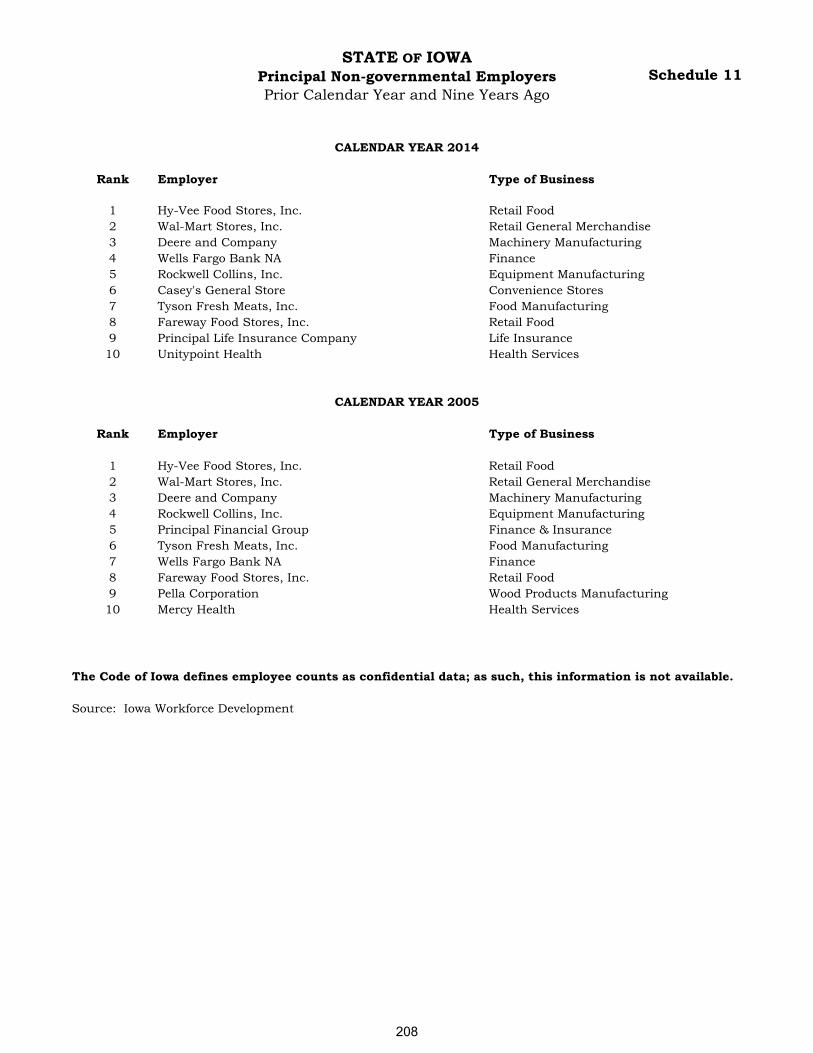
STATE OF IOWAPrincipal Non-governmental Employers
Prior Calendar Year and Nine Years Ago
Schedule 11
Rank Employer Type of Business
1 Hy-Vee Food Stores, Inc. Retail Food
2 Wal-Mart Stores, Inc. Retail General Merchandise
3 Deere and Company Machinery Manufacturing
4 Wells Fargo Bank NA Finance
5 Rockwell Collins, Inc. Equipment Manufacturing
6 Casey's General Store Convenience Stores
7 Tyson Fresh Meats, Inc. Food Manufacturing
8 Fareway Food Stores, Inc. Retail Food
9 Principal Life Insurance Company Life Insurance
10 Unitypoint Health Health Services
Rank Employer Type of Business
1 Hy-Vee Food Stores, Inc. Retail Food
2 Wal-Mart Stores, Inc. Retail General Merchandise
3 Deere and Company Machinery Manufacturing
4 Rockwell Collins, Inc. Equipment Manufacturing
5 Principal Financial Group Finance & Insurance
6 Tyson Fresh Meats, Inc. Food Manufacturing
7 Wells Fargo Bank NA Finance
8 Fareway Food Stores, Inc. Retail Food
9 Pella Corporation Wood Products Manufacturing
10 Mercy Health Health Services
Source: Iowa Workforce Development
CALENDAR YEAR 2014
CALENDAR YEAR 2005
The Code of Iowa defines employee counts as confidential data; as such, this information is not available.
208

STATE OF IOWASignificant Classes of Capital Assets by Function Schedule 12
2006 2007 2008 2009 2010 2011 2012 2013 2014 2015
ADMINISTRATION & REGULATION
Department of Administrative Services
Land (acres) 133 133 133 133 138 138 138 138 138 138
Buildings & improvements (square footage) 1,210,406 1,433,865 1,443,917 1,472,729 1,766,069 1,810,569 1,810,569 2,708,428 2,454,890 2,454,890
Machinery & equipment 580 574 594 576 613 962 985 594 627 341
Alcoholic Beverages Division
Land (acres) 15 15 15 15 15 15 15 15 15 15
Buildings & improvements (square footage) 181,996 181,996 181,996 181,996 181,996 181,996 181,966 181,966 181,966 181,966
EDUCATION
Iowa Public Television
Land (acres) 131 131 211 211 211 208 208 208 208 208
Buildings & improvements (square footage) 119,800 119,800 119,800 62,000 62,000 62,000 75,500 75,500 75,500 75,000
Machinery & equipment 572 580 578 983 977 908 927 876 873 801
Iowa Braille and Sight Saving School
Buildings & improvements (square footage) 190,612 190,612 190,612 190,612 190,612 190,612 190,612 190,612 190,612 190,612
Iowa School for the Deaf
Buildings & improvements (square footage) 407,426 407,426 407,426 407,426 407,426 407,426 407,426 407,426 407,426 407,426
HEALTH & HUMAN RIGHTS
Department for the Blind
Buildings & improvements (square footage) 98,606 98,606 98,606 98,606 98,606 98,606 100,000 100,000 100,000 100,000
Machinery & equipment 221 211 229 264 262 200 199 198 194 182
Veterans Home
Land (acres) 258 258 158 158 158 158 158 158 158 158
Buildings & improvements (square footage) 742,041 742,041 736,534 736,534 736,534 736,534 886,711 886,711 891,811 891,811
Machinery & equipment 218 239 241 250 262 266 298 373 509 561
Department of Public Health
Machinery & equipment 335 368 358 336 422 417 466 471 478 504
HUMAN SERVICES
Department of Human Services & Institutions
Land (acres) 2,825 2,825 2,872 2,872 2,872 1,965 1,965 1,965 1,965 1,965
Buildings & improvements (square footage) 4,215,068 4,215,068 4,189,372 4,187,685 4,243,059 4,247,383 4,243,591 4,243,591 4,243,591 4,222,668
Machinery & equipment 1,424 1,562 1,617 1,734 1,754 1,793 1,807 1,900 1,946 1,930
(continued on next page)
Capital Intensive Departments Only
For the Last Ten Fiscal Years
209

STATE OF IOWASignificant Classes of Capital Assets by Function Schedule 12
2006 2007 2008 2009 2010 2011 2012 2013 2014 2015
JUSTICE & PUBLIC DEFENSE
Department of Corrections & Correctional
Facilities
Land (acres) 1,872 2,112 2,112 2,112 2,122 2,136 1,984 1,976 1,976 1,738
Buildings & improvements (square footage) 3,101,404 3,786,838 3,922,016 3,930,180 3,930,180 4,057,021 3,958,161 3,978,657 4,213,108 4,213,108
Machinery & equipment 1,111 1,304 1,387 1,434 1,398 1,450 1,500 1,610 1,793 1,895
Judicial Districts
Land (acres) 54 54 55 71 71 71 66 66 66 68
Buildings & improvements (square footage) 477,591 525,638 525,638 525,638 525,638 568,765 568,765 645,656 663,644 663,203
Machinery & equipment 294 296 298 297 283 292 310 305 320 334
Department of Public Defense
Land (acres) 2,694 2,688 2,688 2,688 2,688 2,688 2,688 2,688 2,688 2,769
Buildings & improvements (square footage) 2,432,404 2,453,389 2,484,110 2,494,278 2,609,806 2,679,159 2,702,403 2,909,624 2,887,427 2,857,147
Machinery & equipment 323 327 350 330 391 417 401 466 486 490
Department of Public Safety
Land (acres) 79 87 59 60 60 60 60 60 60 60
Buildings & improvements (square footage) 132,162 132,162 149,303 153,660 153,660 151,160 151,160 151,160 151,160 151,160
Machinery & equipment 1,471 1,420 1,416 1,495 1,477 1,623 1,806 1,904 1,929 1,950
ECONOMIC DEVELOPMENT
Iowa Workforce Development
Buildings & improvements (square footage) 129,822 129,822 129,822 129,822 129,822 129,822 129,822 129,822 129,822 129,822
Machinery & equipment 328 331 289 297 267 254 262 282 262 241
TRANSPORTATION
Department of Transportation
Land (acres) 8,161 8,256 7,568 7,199 7,404 7,071 7,069 7,138 6,943 5,245
Buildings & improvements (square footage) 2,279,725 2,293,725 2,311,895 2,320,784 2,360,453 2,388,154 2,413,888 2,474,076 2,494,219 2,560,921
Highway lane miles 234,451 235,471 235,821 235,999 236,426 236,428 237,115 237,394 237,391 237,588
Heavy equipment 5,114 5,326 5,385 5,550 5,803 5,779 6,101 6,238 6,416 6,463
Machinery & equipment 2,972 2,951 3,083 3,275 3,392 3,275 3,313 3,276 3,621 3,532
AGRICULTURE & NATURAL RESOURCES
Department of Natural Resources
Land (acres) 331,198 335,735 339,541 162,859 165,711 169,881 173,921 174,632 176,972 180,710
Buildings & improvements (square footage) 578,906 582,401 603,161 634,149 625,649 634,268 662,577 784,815 810,633 584,218
State parks 71 71 71 71 71 71 71 71 71 71
Wildlife management areas 20 20 20 20 20 20 16 16 16 16
Machinery & equipment 2,111 2,124 2,355 2,472 2,535 2,632 2,343 2,186 2,083 2,065
Source: Information provided by the Departments.
Capital Intensive Departments Only
For the Last Ten Fiscal Years
(continued)
210

STATE OF IOWAOperating Indicators by Function
For the Last Ten Fiscal Years or as Identified
Schedule 13
2006 2007 2008 2009 2010 2011 (1)
2012 2013 2014 2015
ADMINISTRATION & REGULATION
Department of Administrative Services
State employees covered by benefit plans 19,382 19,747 20,299 20,630 20,140 18,951 19,315 18,421 18,145 17,966
Number of State payroll warrants processed* 524,984 534,237 549,932 558,438 541,636 509,232 502,198 495,234 485,222 461,371
EDUCATION
Department of Education
Enrollment:
Public schools 483,105 482,584 480,609 477,019 474,227 473,493 473,504 476,245 478,921 480,772
Universities 67,896 67,701 69,178 70,325 71,353 72,708 73,948 74,811 76,465 78,047
Community colleges 82,499 84,961 87,072 88,104 100,736 106,597 105,975 100,519 94,234 93,722
HEALTH & HUMAN RIGHTS
Department for the Blind
Number of clients served 8,006 8,204 7,204 8,239 8,093 7,197 6,971 6,617 9,158 7,024
HUMAN SERVICES
Department of Human Services
Average number of residents/patients 1,168 1,136 1,105 1,070 1,024 957 911 872 834 690
Average number of Medicaid recipients 297,000 317,169 306,000 330,286 361,385 380,749 393,664 401,129 405,704 406,155
JUSTICE & PUBLIC DEFENSE
Department of Corrections
Average number of inmates 8,721 8,752 8,765 8,712 8,384 10,301 10,022 9,635 9,622 9,731
ECONOMIC DEVELOPMENT
Department of Economic Development
Number of community development block
grants/home projects funded 110 117 104 61 84 - - - - -
Iowa Workforce Development
Number of unemployment claims
accepted (calendar year) 92,610 91,367 126,309 165,030 125,564 107,937 99,107 94,474 93,158 INA
Unemployment insurance regular benefits
paid (in millions, calendar year) 312.9 329.6 421.5 788.1 586.9 463.4 417.0 418.8 402.6 INA
TRANSPORTATION
Department of Transportation
Automobile driver licenses issued 864,514 709,590 938,192 1,153,422 1,016,493 919,844 810,494 1,052,641 1,122,199 981,512
Vehicles weighed (in thousands, federal fiscal year) 921 595 534 441 492 587 793 1,043 812 837
AGRICULTURE & NATURAL RESOURCES
Department of Natural Resources
Hunting & fishing licenses issued 1,378,487 1,372,423 1,305,779 1,374,122 1,418,625 1,356,740 1,413,309 1,559,955 1,330,709 1,443,919
* - Centralized State Payroll system only - excludes the Universities, Department of Transportation, Judicial Districts and certain other departments.
INA - Information not available.
Source: Information provided by Departments.
(1) - Due to changes in legislation, Fiscal Year 2011 amounts reflect a prior period adjustment made in 2012 to reclassify the Department of Economic Development, previously reported in the primary government, to the Iowa
Economic Development Authority, a discretely presented component unit.
211
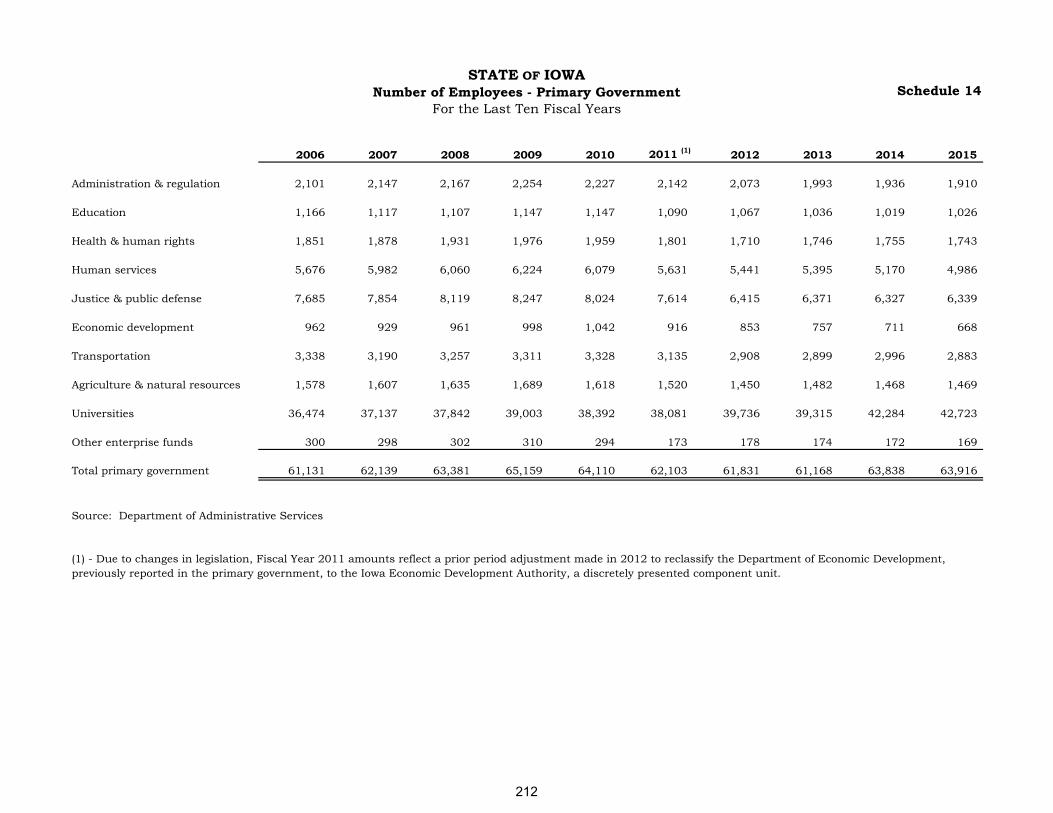
STATE OF IOWA
Number of Employees - Primary Government
For the Last Ten Fiscal Years
Schedule 14
2006 2007 2008 2009 2010 2011 (1)
2012 2013 2014 2015
Administration & regulation 2,101 2,147 2,167 2,254 2,227 2,142 2,073 1,993 1,936 1,910
Education 1,166 1,117 1,107 1,147 1,147 1,090 1,067 1,036 1,019 1,026
Health & human rights 1,851 1,878 1,931 1,976 1,959 1,801 1,710 1,746 1,755 1,743
Human services 5,676 5,982 6,060 6,224 6,079 5,631 5,441 5,395 5,170 4,986
Justice & public defense 7,685 7,854 8,119 8,247 8,024 7,614 6,415 6,371 6,327 6,339
Economic development 962 929 961 998 1,042 916 853 757 711 668
Transportation 3,338 3,190 3,257 3,311 3,328 3,135 2,908 2,899 2,996 2,883
Agriculture & natural resources 1,578 1,607 1,635 1,689 1,618 1,520 1,450 1,482 1,468 1,469
Universities 36,474 37,137 37,842 39,003 38,392 38,081 39,736 39,315 42,284 42,723
Other enterprise funds 300 298 302 310 294 173 178 174 172 169
Total primary government 61,131 62,139 63,381 65,159 64,110 62,103 61,831 61,168 63,838 63,916
Source: Department of Administrative Services
(1) - Due to changes in legislation, Fiscal Year 2011 amounts reflect a prior period adjustment made in 2012 to reclassify the Department of Economic Development,
previously reported in the primary government, to the Iowa Economic Development Authority, a discretely presented component unit.
212

STATE OF IOWASchedule of Current Expenditures - General Fund
Year Ended June 30, 2015
(Expressed in Thousands)
Schedule 15
Licenses Total
Personal Travel & Contractual Equipment Claims & Permits Plant Current
Services Subsistence Supplies Services & Repairs Miscellaneous & Refunds State Aid Improvement Adjustments Expenditures
Administration &
regulation 139,778$ 6,587$ 4,952$ 54,204$ 5,671$ 570,722$ 611$ 704,217$ 11,199$ 82,205$ 1,580,146$
Education 79,777 2,387 4,566 38,785 2,416 1,300 746 3,723,968 - 39,584 3,893,529
Health & human rights 123,464 1,942 9,674 228,231 4,560 503 8 57,139 - (5,171) 420,350
Human services 395,389 4,116 18,662 190,047 9,823 2,985 7 5,926,771 - (93,052) 6,454,748
Justice & public defense 572,216 15,987 34,652 139,345 14,011 6,071 56 278,645 23,709 87,440 1,172,132
Economic development 65,428 1,274 2,194 48,909 3,122 2,728 3 35,884 - (1,260) 158,282
Transportation 236,031 32,305 58,129 163,286 14,405 137,156 117 150,091 1,078,225 (1,223,886) 645,859
Agriculture &
natural resources 113,897 5,619 6,748 47,277 4,713 1,251 9 27,274 17,460 (24,672) 199,576
Total primary government 1,725,980$ 70,217$ 139,577$ 910,084$ 58,721$ 722,716$ 1,557$ 10,903,989$ 1,130,593$ (1,138,812)$ 14,524,622$
Source: State Financial Accounting System, Judicial Districts financial statements, Iowa School for the Deaf and Iowa Braille and Sight Saving School financials and adjusting journal entries from GAAP packages.
213
Department of Administrative Services - Janet Phipps, Director
State Accounting Enterprise - Calvin McKelvogue, Chief Operating Officer
Julie Marasco
GAAP Implementation Section - Lisa Dooly, CPA
Marilyn Hanson, CPA
Kimberly Knight, CPA
Richard Schoeppner, CPA
Department of Management - Joel Lunde
Mike Hahn
ADDITIONAL ASSISTANCE PROVIDED BY
A C K N O W L E D G M E N T S
REPORT PREPARED BY
214


Iowa Department of Administrative ServicesState Accounting EnterpriseHoover State Office BuildingDes Moines, IA 50319Phone: 515-281-4840https://das.iowa.gov/state-accounting
Printed on Recycled Paper