iot smart athletics boxing glove sensors implementing
TRANSCRIPT

Independent project (degree project), 15 credits, for the degree of Bachelor of Science in Engineering in Computer Science, specialization in Internet of Things Spring Semester 2021 Faculty of Natural Sciences
IoT Smart Athletics Boxing glove sensors implementing Machine Learning for an integrated training solution
Michael Woldu Konstantinos Sosopoulos

Authors Michael Woldu, Konstantinos Sosopoulos
Title IoT Smart Athletics: Boxing glove sensors implementing Machine Learning for an integrated training solution
Supervisor Fredrik Frisk
Examiner Kamilla Klonowska
Abstract It is very common in everyday life for people to use data generated by sensors like accelerometers and gyroscopes, whether they are on the mobile phone, smartwatch or other smart devices, for analysis of their movement or tracking their habits. This study is focused on boxing, and proposes a test where the generated data are put through machine learning algorithms in order to output information on the type of punch thrown by the user. Furthermore, the possibility of implementing ML on Android is examined. This thesis was performed by conducting a literature study, and an experimental study. For the literature study, researches similar to this were examined to gather information and insight on what the most common practices are, regarding the setup of the device used to collect the data, both in terms of sensor placement on the body and sensor setup like the optimal data output rates. The experimental part was conducted using custom hardware implementing an accelerometer and a gyroscope in which the wearer of this device would proceed to throw 6 types of punches (jab, cross, left & right uppercut, and left & right hook) to generate the data to be analyzed. It was technically possible to use Android for ML, but it was the least optimum way to execute the algorithms, so a PC was used instead. After putting the data through multiple ML algorithms, the results show that with our current hardware set up it was not possible for the ML algorithms to adequately classify the type of punches with mediocre accuracy scores ranging from 37.37% - 59.16% depending on the algorithm.
Keywords IoT, sensors, accelerometer, machine learning, gyroscope, Android, Bluetooth Low Energy

Contents
1. Introduction 5
1.1 Background 5
1.2 Aim and Purpose 6
1.3 Research Questions 6
1.4 Limitations 7
1.5 Method - Thesis Structure 7
2. Methods 8
2.1 Literature study criteria 8
2.2 Data acquisition method 9
3. Related Work 11
3.1 Literature study 11
3.2 Researches on ML algorithms 12
3.3 ML algorithm choice 12
3.4 Researches on sensor sampling rates 14
3.5 Sensor sampling rate choice 14
4. Theoretical background 15
4.1 Supervised ML algorithm outputs interpretations 15
4.2 Machine Learning (ML) 16
5. Results 17
5.1 ML classification 17
5.2 Machine Learning implemented on our microcontroller 21
5.3 Machine Learning implemented on an Android phone 22
6. Discussion 23
6.1 Results discussion 23
6.1.1 Machine Learning predictions 23

6.1.2 Machine Learning on a microcontroller 25
6.1.3 Machine Learning on Android 25
6.1.4 Real-time Machine Learning predictions 26
6.1.5 Machine Learning parameters 26
6.2 Future Work 27
6.3 Social and Ethical aspects 27
7. Conclusion 28
8. References 29
Appendix 32
Appendix A - Software 32
A.1 Mobile applications and ML code 32
A.1.1 Machine Learning Execution on Android 32
A.1.2 Device software 33
Appendix B - Hardware 34
B.1 Hardware choice 34
Appendix C - Machine Learning results additional screenshots 35
Appendix D – Dataset screenshots 37

5
1. Introduction
1.1 Background
Many people engage in sports activities that involve wearing gloves on one or both hands,
with sports like boxing, MMA, karate, and kickboxing being at the top of the list [1]. The
technique and many times the speed and/or rate that the athlete executes his or her
punches can prove to be crucial in a fight. People in their everyday lives choose to use
some kind of health tracking/monitoring application that can be standalone or used as a
supplement to an electronic device taking measurements (ex. activity trackers measuring
heart rate, oxygen levels, blood pressure etc.). This is also true for athletes as with modern
technology, having such tools can be extremely informative and provides the users with
valuable information and performance stats as well as data about their overall health
which is vital to their training [2]. While there are many options available on the market
for people interested in activity trackers (or even smart watches that have activity tracking
sensors as well), the market is somewhat limited in terms of specialized equipment for
specific sports. This leaves an opportunity for research to be done in order to develop
products and solutions that are more targeted towards narrower demographic groups, with
the aim of helping people that want something tailored to their athletic needs.
Microelectromechanical systems (MEMS) are devices that measure change in movement,
they can also log and transmit that data. The most common examples are accelerometers
and gyroscopes, which are also most common in smart wearable devices that measure
body movement data. There are even studies that experiment with IoT solutions, that is,
using wrist-mounted accelerometers while also wearing athletic equipment on the hands,
similar to our research [3].
Data gathered from various sensors through real-world implementations as well as
multiple scientific studies, are put through Machine Learning (ML) algorithms so that the
user can see more accurate results like for example see the number of steps taken a day,
or the number of flights of stairs climbed. In essence ML can be used to change data into
information.

6
1.2 Aim and Purpose
The purpose of this study is to collect data which will then be used to train multiple
supervised machine learning algorithms in order to see how accurately the system would
identify which punching technique was used, as a way of checking the form and/or
technique of the user and ultimately create a smart IoT training solution.
1.3 Research Questions
The focus of this thesis paper is divided into the two research questions that follow.
Research question 1: Is it possible to create a smart boxing training system, with
accurate user movement recognition using Machine Learning to create an
integrated IoT training solution?
How people use their bodies and how they perform varies greatly, as well as each one’s
attributes (height, weight distribution, etc). This can be a lead factor in if the system will
recognise the same type of punches correctly, if different people were to be recorded
practising. We aim to see how accurate such a system would be, and if it could provide
any useful information and knowledge to the user.
Research question 2: Is it possible to implement machine learning algorithms using
a microprocessor or a mobile device in order to predict movement and respond in
real time?
We know that microprocessors are very limited in terms of processing power and
capabilities. As such, we would like to explore the possibility of implementing ML
algorithms on one, if that would be possible and if not, if it would be able to handle
transmitting information from multiple sensors simultaneously at a high frequency to an
Android phone and let the phone handle the ML.

7
1.4 Limitations
The punches that were recorded were performed without the use of equipment like
punching bags or boxing pads, meaning that our sensor data does not include values that
would have been generated from the gloves impacting on an object. Our data only
includes arm movement values from both sensors and thus may not accurately classify
punches when used while punching a bag, pads or anything other equipment that creates
impact.
Additionally, we were only able to gather so much data from the sensors, enough so that
we could get respectable and sufficient results. It goes without saying that since the
chosen machine learning algorithms were supervised, the more data they had to train with,
the better accuracy scores they would have been able to achieve.
1.5 Method - Thesis Structure
Our thesis paper is based on a literature and an experimental study. More specifically, we
have done some literature research which we based our hypothesis on and took some
valuable information for our implementation, and then we studied the results from our
practical implementation in order to interpret the data and get some insight from the
output. Combining those two, we arrived at our results.
This thesis paper consists of the following:
• An introduction that includes some discussion on the background, our aim and
purpose, our research questions, and the limitations we will face.
• A methods chapter, where we explain how we achieved to formulate this thesis,
both in terms of the theoretical (literature) study as well as our practical
experiment.
• A literature study section where we explore and present previous work that is
related to ours, choose the Machine Learning algorithms for this experiment, and
the most appropriate sensor sampling rate.
• A theoretical background literature study where we present and explain some
basic concepts regarding machine learning.
• Results of the experiment after the collected data is put through the ML
algorithm and we have reviewed evidence from our literature study.
• A discussion of the results, how we could further improve our study (further
work).
• A summary and conclusion to the thesis.

8
2. Methods
This thesis consists of both a literature study (theoretical part) and a practical experiment
as well to answer our research questions. The literature study was conducted to find out
whether ML algorithms can be carried out on a microcontroller as well as gather
information on similar work by other researchers. The practical experiment was
conducted to test our hypothesis on if punch types can be clearly identified using machine
learning algorithms.
2.1 Literature study criteria
For our literature study, the main sources that we used to obtain publications from, were
Google Scholar, ACM Digital Library and Summon@HKR. Furthermore, Google was
used for general-purpose searches like for example looking at the advantages and
disadvantages of a specific ML algorithm. Below in Table 1 are some of the terms used
for querying the digital libraries and Google. Results of the literature study are presented
in Chapter 3 Related Work.
We performed searches using the same keywords on all databases. However, the
keywords shown below in Table 1 are different for each publication database because
they are the ones that we got the most relevant hits with.
Table 1 – Literature study sources & keywords
Source Keywords
Google Scholar Accelerometer
Accelerometer AND sports
SVM OR body movement
ACM Digital Library Machine Learning
Sensors AND sports
Boxing AND sensors
Machine learning AND sensors
Summon@HKR Accelerometer OR gyroscope
Inertial Measurement Units
Google KNN ML
CART ML
Best ML for body sensor data

9
2.2 Data acquisition method
Below follows the methodology that was used for the practical study. The data collection
was made possible by implementing an accelerometer and a gyroscope, which can be
seen in Figure 1 below. The datasets were generated by the two Inertial Measurement
Units (IMUs) embedded into custom hardware of our design which was worn over the
boxing glove at the wrist.
To gather the dataset, the device was strapped to the wrist of the user (see Figure 1), and
then the user proceeded to throw each of the 6 punching techniques (see Figure 2) one at
a time, while the sensors recorded all hand movement data.
Each punch type was performed 30 times, using a data sample rate of 300 Hz. When the
desired number of repetitions was achieved, data transmission would stop, and the process
would be repeated for the next type of punch. As soon as each session was stopped, all
the data was uploaded to an online database for storing and retrieval for the ML
algorithms to use. The device was placed on one hand at a time. Once all of the punches
for the right hand were recorded (cross, right hook, right uppercut), the device was placed
on the other hand to record the punches thrown by the left hand (jab, left hook, left
uppercut). The punches were performed by a single amateur boxer in order to gather a
uniform and consistent dataset in order to train the ML algorithms with.
Furthermore, before running the data values through the ML algorithms, in terms of pre-
processing techniques applied, feature scaling was performed, which essentially
normalizes the entire dataset, so each data point is proportionally far or close to the rest.
This helped the algorithms produce more efficient results.

10
Figure 1 – Boxing glove implementing our device
[4]
Figure 2 - Six Basic Boxing Punches

11
3. Related Work
3.1 Literature study
The authors of the study [3] have done some research on the hand speed while boxing.
Similar to our implementation, they have used one accelerometer mounted at the wrist
and recorder data from sixteen amateur boxers performing 20 jabs and 20 crosses (see
Figure 2) each. It was concluded that the accelerometer alone as a sensor shows some
promising results when it comes to assessing the speed of the hand. Using Spearman’s
correlation coefficient, it was determined that the speed of a cross is somewhat dependent
on the reach of the boxer, while the speed of a jab on the experience.
In a different study [5], the authors recorded data from seven Olympic boxers from five
different weight classes who delivered 18 punches to a dummy. An accelerometer was
used as well, and the translational and rotational head acceleration were measured, along
with neck response and jaw pressure distribution. Using that data, they later determined
the punch force, energy transfer and power of each punch, arriving at the conclusion that
the bigger the weight class is, the more severe the punch will be in terms of force and
speed.
There is also another research [6] where the authors used an accelerometer with the aim
of recognizing different hand gestures. They gathered and analysed data from five
subjects, where each one would draw 3 different shapes and 10 different numbers in the
air. Following that, the SPRING algorithm proposed by [7] was used, resulting in an
average F-measure of 0.78 for the shapes and 0.79 for the numbers, respectively.
Furthermore, apart from researches, there is also [8], which is a product from UFC that is
able to measure the force and speed of one’s punch and/or kick. Instead of it being placed
on the athlete’s wrist, it is instead placed at the top or the bottom of the punching bag,
recording the acceleration of the bag after it is struck, with the help of integrated
accelerometers. Like our implementation, it also has Bluetooth support for use with a
smartphone to view the results of the training session.

12
3.2 Researches on ML algorithms
The related work usually tends to converge on the ML algorithms that they use. However,
most of them use more than one algorithm to obtain their results, so some more research
had to be done to see how each one functions before we chose one for our experiment.
Initially, a Classification And Regression Tree (CART) algorithm was considered, but
decision trees can get too complex due to overfitting, and they can also sometimes
become unstable due to small variations of the data values [9]. With that in mind, it was
decided that CART should not be used. Linear regression algorithms operate on the
condition that the predicted output is continuous and has a constant slope [10], so that
would not work either, as logistic regression algorithms would not also work since having
a multinomial dependent variable can get too complicated without necessarily giving
back proportionally better results.
3.3 ML algorithm choice
The algorithms that were chosen for this experiment were the K-Nearest Neighbours
(KNN) algorithm, Support Vector Machine (SVM), and the Random Forest algorithms,
as there was no evidence found indicating that any of them would be a bad choice for this
type of experiment.
The decision to use KNN is supported by the fact that it works by scanning for similar
data points, based on distance/proximity, and it is also extremely versatile and does not
need extreme parameter tuning to function properly. Furthermore, it has the advantage
that it is able to produce results even for multiclass classification problems, and since this
study was conducted with 6 classes (see Figure 2) that was a big factor to consider [11],
[12].
Regarding SVM, it is commonly used where movement classification is the goal, much
like in our experiment. The objective of the SVM algorithm is to find a plane in a n-
dimensional space (where n is the number of classes, 6 in our case) which clearly
classifies the data points in the data set. Ideally, the chosen plane has the maximum
margin between the data points of all classes. That way, it can classify any future data
points with higher accuracy [13]. SVM however does not support natively multiclass
classification problems. What it does instead, is takes the problem and breaks it into
smaller binary classification problems and outputs the results, so it is possible to use it

13
even for multiclass problems. Evidence supporting the choice behind using SVM can be
also found in this study [14] where the author proves that SVM can distinguish between
each class with high accuracy.
SVM however, is like a tree with smaller branches, called kernels. Each kernel operates
in a different way and thus the classification method and consequently accuracy varies
between each kernel. For this experiment, the following kernels were chosen based on
evidence gathered from a literature study.
1. The Sigmoid kernel (SIG) has roots from the Neural Networks field, where the
sigmoid function is commonly used as an activation function for artificial
neurons. It is equivalent to a two-layer neural network.
2. Since in the pre-processing step, there was some data standardization performed,
the Polynomial kernel (Poly) was chosen as well, as it is well suited for problems
where the training data is standardized. [15]
3. Finally, the RBF kernel is one of the most widely used kernels since it is similar
to the Gaussian distribution, which is a probability distribution that is symmetric
around the mean. It works by taking two points and calculates their similarity or
the distance between them.
Lastly, the choice behind using Random Forest was that decision trees is a popular
classification method in general, but like mentioned before in section 3.2, it could yield
bad results for our case due to potential small variations in data. However, the Random
Forest algorithm, while it may have decision trees as its basic building blocks, it operates
by using many individual decision trees. Each tree outputs in the end the predictions for
all classes and the one with the most common results among them becomes the model’s
prediction percentage. [16]

14
3.4 Researches on sensor sampling rates
Since we wanted to obtain some concrete data on why we should or should not choose a
specific sampling frequency, we had to look into previous researches and what sampling
rates they chose to use to obtain their results.
Dinu et al. [17] used 17 inertial measurement units consisting of a 3D gyroscope, a 3D
accelerometer, and a 3D magnetometer, strapped onto the body, with each IMU set at a
sampling rate of 240 Hz. It was concluded that there are consistent differences between
the two groups measured with the senior boxers producing more force with each punch.
In another study, Worsey et al. [18] suggested that the ideal sampling frequency for
boxing when using a ±200g accelerometer and two devices, much similar to our case, is
at 250 Hz.
3.5 Sensor sampling rate choice
Based on the results obtained from the literature research studies in section 3.4 ( [17],
[18]) they seem to converge on the sensor sampling rate used. As such, we believe that a
data sampling rate of 300 Hz for both the accelerometer and gyroscope would be
sufficient for our experiment and that it would be possible to gain the required results,
since that seems to be an acceptable sampling rate among researchers using inertial
measurement sensors.
15
4. Theoretical background
4.1 Supervised ML algorithm outputs interpretations
When a machine learning algorithm finishes training and outputs the results, they are
usually displayed in the form of confusion matrices and classification reports. Below are
those terms explained, along with explanations for the terms that are presented by them.
“A confusion matrix is a specific table layout that allows visualization of the
performance of an algorithm, typically a supervised learning one (in unsupervised
learning it is usually called a matching matrix). Each row of the matrix represents the
instances in a predicted class, while each column represents the instances in an actual
class (or vice versa).” [19]
A classification report presents the user with the metrics for precision, recall, and
support score of the ML model.
True Negative (TN) is when data is negative and is classified as negative.
True Positive (TP) is when data is positive and is classified as positive.
False Negative (FN) is when data is positive and is classified as negative.
False Positive (FP) is when data is negative and is classified as positive.
Precision is the percentage of the predictions that were correct. It is calculated with the
formula 𝑃𝑟𝑒𝑐𝑖𝑠𝑖𝑜𝑛 = 𝑇𝑃
𝑇𝑃+𝐹𝑃.
Recall is the percentage of the positive cases that were predicted as positive. It is
calculated with the formula 𝑅𝑒𝑐𝑎𝑙𝑙 = 𝑇𝑃
𝑇𝑃+𝐹𝑁.
F1 Score is the percentage of the positive predictions that were correct. Somewhat similar
to recall, but the difference here is that it is essentially a mean of precision and recall
scores and it takes values between 0.00 and 1.0, with 1.0 being the best and 0.00 being
the worst. It is calculated with the formula 𝐹1 𝑆𝑐𝑜𝑟𝑒 = 2∗(𝑅𝑒𝑐𝑎𝑙𝑙∗𝑃𝑟𝑒𝑐𝑖𝑠𝑖𝑜𝑛)
𝑅𝑒𝑐𝑎𝑙𝑙+𝑃𝑟𝑒𝑐𝑖𝑠𝑖𝑜𝑛.
Support is the number of occurrences of a class from the specified dataset. It is best if it
is balanced, as an imbalanced support of the training data may indicate result weakness
of the ML output from the trained data. [20]

16
A Receiver Operating Characteristic (ROC) curve is a graph that shows the
performance of a classification model at every threshold it passes. It plots the True
Positive Rate against the False Positive Rate. The closer the curve is to the top-left corner
of the graph, the better performance the classifier has at that threshold.
The Area Under Curve (AUC) of ROC graphs can be used as a measurement of
performance for each classifier. It is essentially the probability of a positive instance
chosen at random will be ranked higher than a randomly chosen negative instance.
Generally, the AUC performs well as a measure of predictions and accuracy. [21]
4.2 Machine Learning (ML)
Machine Learning is a form of Artificial Intelligence (AI). It has the ability of providing
the system with capabilities such as learning automatically and improving from
experience without the need of explicit programming input. The main area of focus of
machine learning is to develop computer programs that are able to access data and use it
to improve themselves.
This process essentially begins by observing data or by instruction, so that the algorithm
can look for patterns that tend to emerge in the data they handle with the purpose of
making better decisions in the future. The primary goal is to allow the algorithm to learn
on its own and adjust accordingly, without the need of human intervention.
Supervised ML algorithms can apply information that they have learned before to new
inputted data using labels so that they can predict future events. They operate with train
and test sets, using the train sets to infer a function in order to be able to make predictions
about the output values. It has also the ability to compare the output with the intended
output and find errors to modify the function accordingly. [22]

17
5. Results
In section 5.1, results for the first research question are presented, concerning whether a
punch type classification through Machine Learning is possible or not. Section 5.2
contains findings regarding the first part of the second research question, that is, if it
would be possible to implement a machine learning algorithm on the microcontroller that
was used. In section 5.3, results are presented about the second half of the second research
question which concerns ML implementation on an Android phone.
5.1 ML classification
The data collected from our sensors was put through the three chosen machine learning
algorithms, KNN, Random Forest and 4 different kernels of SVM. Below are the results
as can be seen in Table 2 & Table 3. The confusion matrices for all algorithms can be
found in the Appendix C.
Table 2 – Machine Learning on our dataset results
ML algorithm Accuracy Highest F1 score - Class
KNN 59.16% 0.78 - Jab
SIG SVM 37.37% 0.51 - Cross
RBF SVM 56.57% 0.73 – Right Uppercut
Poly SVM 55.12% 0.68 - Cross
Linear SVM 52.24% 0.66 – Cross
Random Forest 39.68% 0.88 - Jab
Table 3 – ROC graphs curve areas (AUC) for every class & every algorithm tested
Class KNN SIG SVM RBF SVM Poly SVM Linear SVM Random
Forest
Jab NaN 0.51 0.99 0.96 0.77 NaN
Cross 0.23 0.45 0.80 0.77 0.69 0.30
L Hook 0.51 0.46 0.77 0.69 0.62 0.59
R Hook 0.37 0.65 0.88 0.79 0.84 0.30
L Upp 0.13 0.56 0.67 0.63 0.46 0.09
R Upp 0.33 0.73 0.95 0.91 0.92 0.31

18
Below follow the ROC curve graphs for all the Machine Learning algorithms:
As mentioned in Chapter 4.1, ROC graphs show the performance of the algorithm for
each class. The closer the curve gets to 1.0 of the True Positive Rate axis, the better the
classification for that class.
Figure 3 – KNN ROC curve graph
Figure 4 – SVM Sigmoid kernel ROC curve graph

19
Figure 5 – SVM RBF kernel ROC curve graph
Figure 6 – SVM Polynomial kernel ROC curve graph

20
Figure 7 – SVM Linear kernel ROC curve graph
Figure 8 – Random Forest ROC curve graph

21
5.2 Machine Learning implemented on our microcontroller
Regarding machine learning implemented using microcontrollers, study [23] was found
that was done by Sakr et al. which suggests that it is possible, and the hardware
specifications of the microcontroller they used to accomplish that were even listed.
However, the way that they managed to implement the ML was by using a software called
X-Cube-AI which is an AI expansion pack developed for specific boards produced by ST
Electronics. So, with this evidence in mind, while their research could potentially serve
as a guideline for us to implement the ML model on the ATMega328P microcontroller,
in the end it was deemed not possible to use that software as it is not compatible with the
microcontroller model that was used for this experiment.
While conducting some further investigation on the matter of machine learning on
microcontrollers, we came across this article [24]. A team of researchers at Fraunhofer
IMS have developed AIfES (Artificial Intelligence for Embedded Systems) which is a
machine learning library programmed in C that can run on microcontrollers. One needs
to keep in mind that it is still very limited as to what it can do due to the lack of processing
power, but it still is a form of ML on microcontrollers. AIfES is not currently available
to the public however, with the company only giving opportunities for manufacturers
to license the software. Consequently, it would not be possible to use that software for
this research either.
Lastly, there is also TensorFlow Lite for Microcontrollers, which is a software that helps
bring ML to IoT devices. It requires however a 32-bit platform and has been mainly tested
using processors based on the Arm Cortex-M Series, while the chosen model for this
research, the ATMega328P, is an 8-bit microcontroller based on the AVR enhanced RISC
architecture.

22
5.3 Machine Learning implemented on an Android phone
Concerning the second half of our second research question, if the microcontroller would
be able to handle transmitting data over Bluetooth to an Android phone and perform the
Machine Learning on the phone, we found out that it is possible to do so, as we were able
to successfully transmit data to an Android phone to collect the data to put through ML
as shown above in section 5.1 as well as execute Machine Learning algorithms through
an Android phone. For more information on how Machine Learning was implemented on
Android see Appendix A.1.1. How results were outputted on Android can be seen in
Figure 9 below. Here, KNN has been run and the classification report for it has been
outputted.
Figure 9 – KNN classification report executed on Android

23
6. Discussion
6.1 Results discussion
6.1.1 Machine Learning predictions
Regarding our first research question, as can be seen in section 5.1, the results were
somewhat promising. While looking at Table 2 we can derive the following conclusions.
Interpreting the ROC curve graphs and Table 3, we begin with the KNN algorithm.
Looking at the KNN ROC curve graph (Figure 3), we can derive that the AUC values
ranged from 0.13 – 0.51 with the class with the most correctly classified occurrences
being the “Left Hook” class. Furthermore, class “Jab” gave a NaN AUC result, which
means Not a Number. It is most likely that this occurred because when calculating the
ROC curve for the “Jab” class there was a division by zero. This could have happened if
there were no True Positives for that class, which caused the program to output NaN.
Next, by evaluating the SVM algorithm kernels we can verify that the Sigmoid kernel
(Figure 4) performed the worst from the rest of the SVM kernels. Some AUCs were
below 0.5, meaning essentially that the classifier had extremely little discrimination
capacity when distinguishing between the positive and negative classes, while for the
“Right Uppercut” it performed extremely well when comparing to the rest of the classes.
The Linear (Figure 7) and Polynomial (Figure 6) kernels however, showed more
promising numbers, with AUC values ranging from 0.46 – 0.92 and 0.63 – 0.96
respectively, which roughly translates into a 46% - 92% chance that the Linear model is
able to distinguish between the positive and negative occurrences depending on the class,
and a 63% - 96% chance for the Polynomial model. Lastly, the RBF SVM kernel (Figure
5) may had the second highest accuracy among all algorithms (56.57% compared to
KNN’s 59.16%), but it had the highest AUC numbers, with classification scores ranging
from 67% - 99% depending on the class it predicted.

24
Finally, looking at the Random Forest ROC graph (Figure 8) it is shown that the AUC
values range from 0.09 – 0.59 with “Left Hook” class being the most successful in terms
of most correctly classified. Like with the KNN, here class “Jab” also gave NaN as AUC
result, most probably due to the same reason as the KNN, that is, division by zero due to
lack of True Positive samples in the predicted set.
Looking at the percentage of correct classifications (F1 score) for each class across all
ML algorithms that were tested from Table 2, it can be noteworthy that the Random Forest
had the highest classification score for any punch among all algorithms, with a score of
0.88 for the “Jab”. Furthermore, we can see that across all algorithms, the “Cross” was
the punch type that was most correctly classified (by the Sigmoid, Polynomial and Linear
SVM kernels). Second most correctly classified was the “Jab” (by KNN and Random
Forest). Finally, for the RBF SVM, the most correctly classified punch was the “Right
Uppercut”.
Comparing the results of this thesis with other works, our results do not deviate extremely
from other experiments that were reviewed in the literature study. There are some
differences however when looking at the final results, which we believe can be due to the
fact that all the other experiments that were reviewed, were conducted by people with
much more experience and consequently more expertise on the field, and as such, there
was a much bigger knowledge on both the subject of setting up the equipment that was
used as well as what was the best way to approach the problem software-wise. For us,
this can serve as a starting point to better improve this experiment in the future.

25
6.1.2 Machine Learning on a microcontroller
Taking all findings from section 5.2 into consideration, it was decided that implementing
machine learning algorithms on the model of microcontroller that was utilized for this
experiment would not be possible, especially given the time limitations which was also a
big deciding factor.
6.1.3 Machine Learning on Android
While it may have been technically possible to execute Machine Learning algorithms
using an Android phone, it was decided that it would be best if the final results were
shown using a computer to execute the algorithms. The reason behind this choice was
based on the fact that since Machine Learning is primarily done using Python as a
programming language and Android applications are built using Java or Kotlin, a
translator program was necessary in order to execute Python code from within Java. As
such, it was noticed that the translator software was very limited in terms of interacting
with the rest of the Android application and the way it could show the results to the user.
Furthermore, seeing as there is little to no documentation available for software like this,
performing the complex operations needed to complete this thesis would be extremely
hard and we would possibly have run out of time even. It was not even possible to output
results for all the algorithms, since the application could only output results for one
algorithm at a time. Additionally, even if we put everything else aside, it is known that
phones have less processing powers than computers and consequently even simple
processes took a long time to finish executing on the phone. Thus, for all the reasons
discussed, it was decided that it would be most beneficial if a computer was used for
Machine Learning instead of a phone, as with a computer it was possible to output more
detailed results and gain more insight on the data collected and how well they could be
classified.

26
6.1.4 Real-time Machine Learning predictions
The last part of our second research question poses the question of whether a real time
prediction would be possible or not. Through literature research we know that something
like this is technically possible if the ML algorithm is implemented on the
microcontroller. However, since we did not implement any ML on our microcontroller
due to the reasons discussed above in section 6.1.2, it was not possible for this experiment
to predict the punches thrown in real time.
6.1.5 Machine Learning parameters
Based on our literature research, here are some of the parameters used for our ML
algorithms. For example, the Sigmoid SVM kernel, is known to produce better results
when the variable of the slope, alpha, is set to 1/N, where N is the number of classes. For
the Random Forest algorithm there were 100 trees used for. Finally, for the KNN, when
choosing the value for K, the most common and good choice is to use the square root of
N, where N is again, the number of classes, in our case since we have 6 classes that would
be √6 = 2.45, so we had originally used K = 2. However, we decided to try out other
values for K as the convention of taking the square root of the number of classes might
not apply to every situation. A simple trial and error was used in order to choose 18 as
the value for K for the KNN, as can be seen in Table 4 below.
Table 4 – Number of Neighbours for KNN tests
N Accuracy
10 53.83%
15 57.87%
16 58.01%
18 59.16%
20 58.58%
25 57.72%
30 58.58%

27
6.2 Future Work
There is the possibility of implementing a Neural Network, since it is a series of
algorithms that try to recognize patterns in data just how a human brain would. It is a
form of Artificial Intelligence (AI), so it is possible that it gives better results and accuracy
considering the complexity of it.
Based on our results from section 5.2, this could serve as grounds for formulating a
research question based on implementing ML on the ATMega328P that was the
microcontroller of choice for this experiment and explore the possibility of using other
microcontroller models as well for performing basic or more advanced machine learning
classifications in future researches, since it is already known that it is technically feasible
to implement a pre-trained Recurring Neural Network (RNN) using 8-bit
microcontrollers, as suggested by Frisk and Mengistu [25]. Furthermore, if one were to
implement ML on the microcontroller, it could also be possible to enable real-time punch
type prediction which was not possible to achieve for this experiment.
We would also like to better streamline the mobile app so it can be used as a supplement
to the devices. The app would show the ML classified punching techniques in real time
to the user as well as have an option that would instruct the user to throw pre-recorded
punching combinations to make the whole system a truly “integrated training solution”.
6.3 Social and Ethical aspects
We do not believe that this work has any ethical aspects related to it. However, one could
say that there are some social aspects in respect to the way people view data logged from
sensors, whether they are generated from their phone (ex. step counter), from their
smartwatch (ex. sport activity detection) or from a standalone device, similar to ours. Data
can be generated from everything around us, and having systems implementing machine
learning algorithms means that data can be transformed into information. Information
derived from training data can always be considered useful to athletes seeking more
insight into their training, so we could argue that the social aspect of our thesis could
potentially be the information gained from using systems much similar to ours.

28
7. Conclusion
This thesis was conducted by performing a theoretical study as well as a practical
experiment. Data collection from inertial measurement units is commonly performed for
various reasons, and we set out to find if it is possible to utilize data generated from IMUs
while boxing in order to get information on the type of punch thrown.
Having completed this experiment, we proved that it is possible for the ATMega328P to
send sensor data from two sensors, an accelerometer and a gyroscope, to an Android
phone over a Bluetooth connection. While it was not possible to implement machine
learning on the microcontroller used, it was however possible to do so on Android.
However, due to various limitations that the ML implementation on Android posed, it
was decided that it was best implemented on the PC instead.
The results of the Machine Learning were quite promising, with one could say relatively
high accuracy scores for almost all the chosen algorithms. While for some classes the
predictions were consistently correct, there were also consistently wrong for others,
leading us to believe that the equipment used may potentially be insufficient for this type
of experiment and thus could not adequately track and log some specific arm movements
for the algorithms to be able to classify correctly.
In the future, it could be possible with some fine tuning of the software and potentially a
more advanced hardware setup to achieve some higher accuracy scores and thus larger
AUC areas for all the algorithms, so that one could have a system that can confidently
and accurately identify the type of movement it analyses from the user.

29
8. References
1. Fight Gear Geeks. [Online]. [cited 2021 February 14]. Available from:
https://fightgeargeeks.com/ultimate-martial-arts-glove-guide/.
2. Joines N. Health Tech Zone. [Online]. [cited 2021 February 14]. Available from:
https://www.healthtechzone.com/topics/healthcare/articles/2020/02/12/444439-
great-reasons-use-fitness-tracker.htm.
3. Kimm D, Thiel DV. Hand Speed Measurements in Boxing. Procedia Engineering.
2015 December; 112(502-506).
4. Balloo C. Boxing Punches One through Six. 2020 May 21..
5. Walilko TJ, Viano DC, Bir CA. Biomechanics of the head for Olympic boxer
punches to the face. British Journal of Sports Medicine. 2005 January 31; 39(10).
6. Hikaru W, Mochizuki M, Murao K, Nishio N. A Recognition Method for Continuous
Gestures with an Accelerometer. In 2016 ACM International Joint Conference on
Pervasive and Ubiquitous Computing; 2016; Heidelberg, Germany. p. 813-822.
7. Sakurai Y, Faloutsos C, Yamamuro M. Stream Monitoring under the Time Warping
Distance. In 2007 IEEE 23rd International Conference on Data Engineering; 2007;
Istanbul, Turkey.
8. Roninwear. [Online]. [cited 2021 February 26]. Available from:
https://www.roninwear.se/ufc-force-tracker-for-heavy-bag-svart-p-
12556.html?utm_source=website&utm_medium=info-se-
11774&utm_campaign=related-products-se-
11774&utm_term=related&utm_content=se-11774&referal=related-products-se-
11774.
9. Gupta P. [Online].; 2017 [cited 2021 March 2]. Available from:
https://towardsdatascience.com/decision-trees-in-machine-learning-641b9c4e8052.
10. ML Glossary. [Online].; 2017 [cited 2021 March 2]. Available from: https://ml-
cheatsheet.readthedocs.io/en/latest/linear_regression.html.

30
11. Harrison O. towards data science. [Online].; 2018 [cited 2021 March 2]. Available
from: https://towardsdatascience.com/machine-learning-basics-with-the-k-nearest-
neighbors-algorithm-6a6e71d01761.
12. Vatsal S. towards data science. [Online].; 2020 [cited 2021 March 2]. Available
from: https://towardsdatascience.com/multiclass-classification-using-k-nearest-
neighbours-ca5281a9ef76.
13. Gandhi R. Towards Data Science. [Online].; 2018 [cited 2021 April 27]. Available
from: https://towardsdatascience.com/support-vector-machine-introduction-to-
machine-learning-algorithms-934a444fca47.
14. Samuel M. Classification Of Body Postures/Movements Using Support Vector
Machines. San Diego: University of California, Computer Science.
15. Souza C. Cesar Souza. [Online].; 2010 [cited 2021 April 30]. Available from:
http://crsouza.com/2010/03/17/kernel-functions-for-machine-learning-
applications/#sigmoid.
16. Yiu T. towards data science. [Online].; 2019 [cited 2021 April 26]. Available from:
https://towardsdatascience.com/understanding-random-forest-58381e0602d2.
17. Dinu D, Millot B, Slawinski J, Louis J. An Examination of the Biomechanics of the
Cross, Hook and Uppercut between Two Elite Boxing Groups. In 13th conference of
the International Sports Engineering Association; 22-26 June 2020; Online.
18. Worsey MT, Espinosa HG, Shepherd JB, Thiel DV. Inertial Sensors for
Performance Analysis in Combat Sports: A Systematic Review. Brisbane, Australia:
Griffith University, School of Engineering and Built Environment; 2019 January.
19. Wikipedia. [Online]. [cited 2021 February 15]. Available from:
https://en.wikipedia.org/wiki/Confusion_matrix.
20. Kohli S. Medium. [Online]. [cited 2021 February 15]. Available from:
https://medium.com/@kohlishivam5522/understanding-a-classification-report-for-
your-machine-learning-model-88815e2ce397.

31
21. Chan K. Displayr. [Online]. [cited 2021 April 30]. Available from:
https://www.displayr.com/what-is-a-roc-curve-how-to-interpret-it/.
22. Expert.ai T. expert.ai. [Online]. [cited 2021 February 15]. Available from:
https://www.expert.ai/blog/machine-learning-definition/.
23. Sakr F, Bellotti F, Berta R, De Gloria A. Machine Learning on Mainstream
Microcontrollers. In International Conference on Applications in Electronics
Pervading Industry; 2019; Pisa, Italy.
24. Fraunhofer-Gesellschaft. phys.org. [Online].; 2019 [cited 2021 March 9]. Available
from: https://phys.org/news/2019-06-machine-sensors.html.
25. Frisk F, Mengistu D. Edge Machine Learning for Energy Efficiency of Resource
Constrained IoT Devices. In The Fifth International Conference on Smart Portable,
Wearable, Implantable and Disability-oriented Devices and Systems; 2019; Nice,
France.
26. Umer F. Medium. [Online].; 2018 [cited 2021 March]. Available from:
https://medium.com/@umerfarooq_26378/tools-to-run-python-on-android-
9060663972b4.
27. Chaquopy - Python SDK for Android. [Online].]. Available from:
https://chaquo.com/chaquopy/.
28. Boxing Science. [Online]. [cited 2021 February 22]. Available from:
https://boxingscience.co.uk/science-behind-punch/.

32
Appendix
Appendix A - Software
A.1 Mobile applications and ML code
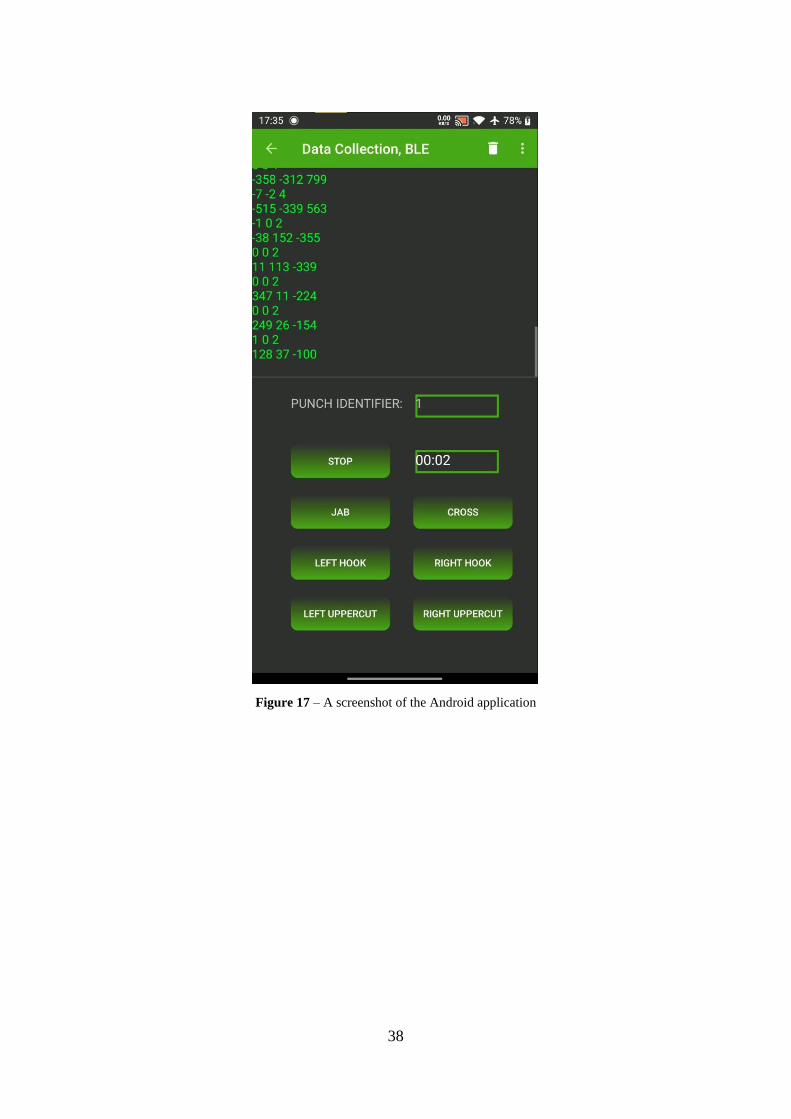
A mobile application was developed as a way to visualize the sensor data that was being
recorded from our device and the app was also used as a medium for communicating with
the database. It was developed using Java as a programming language and Android Studio
was the chosen integrated development environment (IDE). The application implements
several functionalities, such as the ability to see the sensor data in graphs over time,
uploading and downloading data from the database and starting and stopping data
transmission which consequently pauses data transmission from the sensors side (the
device).
The machine learning algorithms were implemented with the help of the Scikit-learn
library using Python as a programming language and Jupyter Notebook as the chosen
IDE.
A.1.1 Machine Learning Execution on Android
Through some research, we found that it is possible to execute Python code from Android
using various tools [26]. The one we thought was most suited for this experiment was
Chaquopy [27]. Chaquopy is essentially a translator program that enables Android to use
Python code by just downloading the add-on using the Gradle file of the Android
application. There is not much documentation however for Chaquopy or similar software,
so that was a big limiting factor. Furthermore, since Python cannot be natively run using
Android Studio, which is the IDE to develop Android applications, we found out later,
that using Chaquopy to do all the Machine Learning for this thesis meant that the results
we would get, would limit us extremely as it was very hard to interact with them (save a
confusion matrix to a file for example).

33
A.1.2 Device software
For the device application, since it is an embedded system design, the software was
created using embedded C as the programming language and Atmel Studio as the IDE.
Here is where the functions required for the accelerometer, gyroscope, and Bluetooth
Low Energy (BLE) modules were programmed to be able to work as intended.
All software was created and tested (where applicable) using a Dell Latitude 5490
computer, with an Intel Core i5 processor and 8GB of RAM memory.

34
Appendix B - Hardware
B.1 Hardware choice
The hardware used to record and capture hand movement data consisted of a 3-axis
accelerometer operating together with a 3-axis gyroscope. The accelerometer module is
capable of measuring acceleration force of up to ±200g and data output rate of up to 1
kHz while the gyroscope module can measure up to ±2000 degrees per second with a data
output rate of up to 8 kHz. The accelerometer and gyroscope data were transmitted
through Bluetooth to a Samsung Galaxy S8+ where our applications were installed.
The reasons behind the choice of the hardware mentioned above were based on the
following criteria:
Regarding the accelerometer, Walilko et al. [5] suggest that the peak acceleration of a
professional boxer’s punch was recorded to be 58g. Regarding the gyroscope, estimating
the time it takes to land a punch, it is in the tenths of a second range. The author of [28]
suggests that the time it takes to land a punch is around 60 to 100 milliseconds which is
similar to the range that we originally had in mind. In our case, in the gyroscope’s
datasheet, rotational velocity is measured in degrees/second. It was also estimated that
the hand turns approximately 100 degrees max during a punch. Taking 100 deg / 0.06 sec
= 1666 degrees per second, which is below the max capabilities of the chosen gyroscope
module, making it suitable for this experiment.

35
Appendix C - Machine Learning results additional screenshots
Each row contains the True Positives and False Positives for each class. The True
Positives are highlighted in green, and the rest are the False Positives.
Figure 9 – KNN confusion matrix
Figure 10 – Random Forest confusion matrix
Figure 11 – Sigmoid SVM confusion matrix

36
Figure 12 – RBF SVM confusion matrix
Figure 13 – Polynomial SVM confusion matrix
Figure 14 – Linear SVM confusion matrix

37
Appendix D – Dataset screenshots
Figure 15 – A sample of accelerometer data from the database
Figure 16 – A sample of gyroscope data from the database
38
Figure 17 – A screenshot of the Android application