ionic liquids in micro extractions and gas chromatographic
TRANSCRIPT
Seton Hall UniversityeRepository @ Seton HallSeton Hall University Dissertations and Theses(ETDs) Seton Hall University Dissertations and Theses
Spring 5-17-2014
Ionic Liquids in Micro Extractions and GasChromatographic Stationary PhasesRamkumar [email protected]
Follow this and additional works at: https://scholarship.shu.edu/dissertations
Part of the Analytical Chemistry Commons
Recommended CitationDhandapani, Ramkumar, "Ionic Liquids in Micro Extractions and Gas Chromatographic Stationary Phases" (2014). Seton HallUniversity Dissertations and Theses (ETDs). 1958.https://scholarship.shu.edu/dissertations/1958


3
Acknowledgement
First and foremost, I thank God for guiding my life and giving me the strength needed to
persevere. My sincere thanks to my father Late. Dhandapani who always wished that I should go
abroad to do my research. I am happy that I was able to fulfill his dreams.
One google search in February 2010 “Snow + New Jersey” brought me all the way from my
home town in India to the United States of America to pursue my research. My true and heart felt
thank to my mentor Dr. Nicholas Snow for all his guidance, suggestions, and continuous support.
The knowledge that he shares with his students is inexpressible by words. I thank Dr. Yuri
Kazakevich for all his input on my dissertation as well as his suggestions with my research. I
would also like to thank Dr. Sergiu Gorun for the knowledge I gained while working in his
group. A special thanks for the time my dissertation committee members have spent for me.
My thanks to Dr. Wyatt Murphy and Dr. David Sabatino for giving valuable suggestions during
my matriculate exam and for being the committee members for my exam.
I would also like to thank Dr. Cosimo Antonacci for his advice on my future career paths. I
would like to extend a special thanks to Dr. Alexander Fadeev and Dr. Rosario LoBrutto for
inspiring lectures in their areas of specialization.
I thank Supelco- Sigma Aldrich for providing ionic liquid columns free of cost for my research
work. I thank Shimadzu Scientific for all their assistance and support with the GC- MS/MS.
My thanks is due to Johnson & Johnson for providing the GC-MS used during this research. I
thank Sanofi-Aventis for providing funding necessary to perform this research. My thanks to the

4
Center for Functional Materials and Center for Academic Industry Partnership for the financial
support provided for the research.
I want to thank the Separation Science Group at Seton Hall University especially Shilpi Chopra,
Michelle Schmidt, and Atsu Apedo for their friendship and general help in the lab. I would like
to extend a special thanks to Hemanthbai Patel for his coordination and knowledge sharing while
working for Dr. Sergiu Gorun.
I am truly grateful to my family. A special thanks to my mother Mrs. Revathi Dhandapani, as
this would not have been possible without her. My heartfelt thanks to my wife Lakshmi
Ramkumar and my daughter Tejashwini Ramkumar for their unconditional love. Thanks to my
sister Mrs Agilandeshwari Dhandapani Mate and my brother in law Abhijeet Mate for their
affection and valuable suggestions during the course of my research.

5
Table of Content
Acknowledgement ......................................................................................................................... 3
List of Figures ................................................................................................................................ 9
List of Tables ............................................................................................................................... 13
Abstract ........................................................................................................................................ 15
Chapter 1: Introduction ............................................................................................................... 18
Gas Chromatography................................................................................................................. 19
Process type in chromatography ............................................................................................ 19
Thermodynamics of gas chromatographic retention ............................................................ 20
Kinetics of gas chromatographic retention ............................................................................ 23
Gas chromatographic inlet systems for capillary columns .................................................... 28
Detectors in gas chromatography .......................................................................................... 37
Ionic Liquids ............................................................................................................................. 42
History of ionic liquids .......................................................................................................... 43
Physical properties of ionic liquid ......................................................................................... 44
Ionic liquids as gas chromatographic stationary phase ......................................................... 46
Ionic liquid in microextraction .............................................................................................. 58
Other Analytical Applications: .............................................................................................. 59
Chapter 2: Retention of alkanes and aromatic hydrocarbons on ionic liquid stationary phases . 63
Introduction ............................................................................................................................... 64
Objective of the experiment ...................................................................................................... 66
Experimental ............................................................................................................................. 68
Materials and Chemicals ....................................................................................................... 68

6
GC-FID and GC-MS parameters ........................................................................................... 68
Standard preparation .............................................................................................................. 69
Experimental .......................................................................................................................... 69
Results and Discussion .............................................................................................................. 71
Retention of alkanes on ionic liquid stationary phase ........................................................... 71
Retention of aromatic hydrocarbons on ionic liquid stationary phase .................................. 75
Comparison of Ionic liquid stationary phase with polyethyleneglycol stationary phase ...... 82
Conclusions ............................................................................................................................... 86
Chapter 3: Air as carrier gas using ionic liquid stationary phase ................................................ 87
Introduction ............................................................................................................................... 88
Objective ................................................................................................................................... 90
Experimental ............................................................................................................................. 91
Materials and Chemicals ....................................................................................................... 91
GC-FID parameters ............................................................................................................... 91
Standard preparation .............................................................................................................. 92
Experiments performed ......................................................................................................... 93
Results and Discussion .............................................................................................................. 93
Air vs Helium comparison based on thermodynamic parameters for the retention of
aromatic hydrocarbons .......................................................................................................... 93
Kinetics of retention of Aromatic hydrocarbons using ionic liquid stationary phase: .......... 97
Separation of xylene isomers using air as carrier gas and ionic liquid stationary phase ....... 99
Conclusion ............................................................................................................................... 101
7
Chapter 4: Partition coefficient by depletion study for ionic liquid single drop microextraction
of aromatic hydrocarbons from water and quantitative estimation by no Interface gas
chromatography mass spectrometry ........................................................................................... 102
Introduction ............................................................................................................................. 103
Objective of the analysis ......................................................................................................... 108
Theory ..................................................................................................................................... 109
Experimental ........................................................................................................................... 113
Materials used ...................................................................................................................... 113
Standard and sample preparation ......................................................................................... 114
IL-SHS SDME procedure ................................................................................................... 114
GC/MS Parameters .............................................................................................................. 119
Depletion study .................................................................................................................... 119
Results and Discussion ............................................................................................................ 120
Sample introduction ............................................................................................................. 120
Challenges faced during method optimization .................................................................... 122
Method optimization............................................................................................................ 127
Apparent partition coefficient by depletion study in IL-SHS SDME: ................................ 131
Validation of IL-SHS SDME method ................................................................................. 139
Conclusion ............................................................................................................................... 145
Chapter 5: Ionic Liquid Static Headspace Single Drop Micro Extraction (IL-SHS SDME) and
Submerged Single Drop Microextraction (IL-SSDME) of Aromatic Hydrocarbons from Water
..................................................................................................................................................... 146
Introduction ............................................................................................................................. 147
Objective ................................................................................................................................. 150
Experimental ........................................................................................................................... 151
8
Materials used ...................................................................................................................... 151
Standard and sample preparation ......................................................................................... 151
IL- SSDME procedure ......................................................................................................... 152
GC/MS Parameters .............................................................................................................. 153
Depletion study .................................................................................................................... 154
Results and Discussion ............................................................................................................ 154
Method Optimization ........................................................................................................... 154
Apparent partition coefficient by depletion study in IL-SSDME: ...................................... 157
Conclusion ............................................................................................................................... 169
Chapter 6: Merits, demerits and future of the applications of ionic liquids in analytical
separation science ....................................................................................................................... 170
Special features of the IL-SDME ............................................................................................ 171
Draw backs of ionic liquid based extractions........................................................................ 173
Conclusion ............................................................................................................................... 173
List of Publications.................................................................................................................. 177
In preparation ....................................................................................................................... 177
Future work ............................................................................................................................. 178

9
List of Figures
Figure 1: Van’t Hoff plot for the exothermic process................................................................... 23
Figure 2: Typical example of Van Deemter plot. ........................................................................ 27
Figure 3: Schematic of Split inlet ................................................................................................. 29
Figure 4: Diagrams of splitless inlet with purge off. ................................................................... 32
Figure 5: Diagrams of splitless inlet with purge on ..................................................................... 33
Figure 6: Schematic representation of solvent focusing occurs in two stages. ............................. 35
Figure 7: Schematic of flame ionization detector. ........................................................................ 38
Figure 8: Schematic of GCMS ...................................................................................................... 39
Figure 9: Schematic of quadrupole mass analyzer ....................................................................... 41
Figure 10: Structure of ionic liquid 1-Butyl-3-methylimidazolium bis (trifluoromethylsulfonyl)
imide ...................................................................................................................................... 42
Figure 11 : Structure of ionic liquid used in commercially available gas chromatographic
stationary phase SLB-IL 100 ................................................................................................. 48
Figure 12: Comparison of commercially available ionic liquid stationary phases with polymeric
stationary phases based on Mc Reynold's number ................................................................ 49
Figure 13: Plot of VN/VL with 1/VL for n-alkanes ......................................................................... 51
Figure 14: Kovats retention index plot. ....................................................................................... 52
Figure 15: Polarity index calculation for commercial ionic liquid columns by Supelco- Sigma
Aldrich. .................................................................................................................................. 55
Figure 16 : The schematic representation of the objective of the experiment. ............................. 67
Figure 17 : Van’t Hoff’s plot for alkanes on SLB-IL100, 30m x 0.25 mm x 0.20 µm. ............... 71
Figure 18: Comparison of ΔG vs T for alkanes on SLB-IL100 : 30 m and 15 m column. .......... 73

10
Figure 19: Structure of ionic liquid stationary phase SLB-IL 100, SLB-L 111, SLB-IL 82 ........ 79
Figure 20 : Comparison of –ΔH0 for alkanes on SUPELCOWAX, SLB-IL 59 and SLB-IL 60 82
Figure 21: Comparison of –ΔS0 for alkanes on SUPELCOWAX, SLB-IL 59 and SLB-IL 60 ... 83
Figure 22: Structure of a polyethyleneglycol phase ..................................................................... 85
Figure 23: Stability of SLB_IL 59 while using air as carrier gas ................................................. 89
Figure 24: Objective of the analysis ............................................................................................. 90
Figure 25:Van't Hoff plot for aromatic hydrocarbons using air, helium as carrier gas ................ 95
Figure 26: HETP vs linear velocity for analytes using air as carrier gas and ionic liquid
stationary phase SLB IL-100 ................................................................................................ 98
Figure 27: Chromatogram of aromatic hydrocarbons on SLB IL 100 using air as career gas. ... 99
Figure 28: Time spent during various activities while performing analysis. ............................. 103
Figure 29: Interface used for sample introduction in IL-SDME................................................. 106
Figure 30: IL SHS SDME, the objective of the analysis ............................................................ 109
Figure 31: Phases involved in IL SHS SDME ............................................................................ 110
Figure 32: Schematic representation of IL-SHS SDME ............................................................ 117
Figure 33: No interface introduction of ionic liquid containing the extracted analyte . ............ 118
Figure 34: A typical chromatogram of 60 ng mL-1 aromatic hydrocarbons extracted by IL-SHS
SDME…………………………………………………………………………………….. 120
Figure 35:Chromatogram of liquid injection of 12 aromatic hydrocarbons using Stabile Wax-10
column. ................................................................................................................................ 121
Figure 36: Chromatogram obtained by the first injection of IL-SHS SDME ............................. 122
Figure 37: Chromatogram obtained by the third injection of IL-SHS SDME ............................ 123
Figure 38: Figure 40: Chromatogram obtained by the eighth injection of IL-SHS SDME ........ 124

11
Figure 39: Optimization of sonication time ................................................................................ 129
Figure 40: Optimization of extraction time ................................................................................ 129
Figure 41: Optimization of NaCl concentration ......................................................................... 130
Figure 42: Optimization of injection time .................................................................................. 130
Figure 43: Comparison of IL-SHS SDME of 1-Butyl-1-methylpyrrolidinium
bis(trifluoromethylsulfonyl) imide and 1-Butyl-3-methylimidazolium
bis(trifluoromethylsulfonyl)imide in terms of peak area. .................................................... 131
Figure 44: Depletion of analytes during consecutive extraction in IL-SHS SDME using 1-Butyl-
1-methylpyrrolidinium bis(trifluoromethylsulfonyl)imide as extracting ionic liquid. ........ 133
Figure 45: Depletion of analytes during consecutive extraction of bicyclic aromatic hydrocarbons
in IL-SHS SDME using 1-Butyl-1-methylpyrrolidinium bis(trifluoromethylsulfonyl)imide
as extracting ionic liquid. ..................................................................................................... 134
Figure 46: shows the depletion of aromatic hydrocarbons upon consecutive extraction in IL-SHS
SDME using IL2 . ............................................................................................................... 136
Figure 47: Comparison of IL2 and IL1 in terms of partition coefficient and the study of the effect
of alkyl chain of the analyte on KIL/S. .................................................................................. 139
Figure 48: Chromatogram of 60 pg L-1 of aromatic hydrocarbons in aqueous solution extracted
by IL-SHS SDME by using IL2. ......................................................................................... 143
Figure 49: Chromatogram of blank injection performed using milliQ water by IL-SHS SDME by
using IL2. ............................................................................................................................. 144
Figure 50: Comparison of three phase and two phase ionic liquid microextraction .................. 148
Figure 51: Objectives of the experiment ..................................................................................... 150
Figure 52: Schematic representation of IL-SHS SDME ............................................................. 152

12
Figure 53: Optimization of method parameters of IL-SSDME using IL2 as extracting solvent.
............................................................................................................................................. 155
Figure 54: Optimization of sonication time in IL-SSDME ........................................................ 156
Figure 55: Effect of salt concentration on IL-SSDME ............................................................... 157
Figure 56: Depletion of analytes during consecutive extraction of aromatic hydrocarbons in IL-
SSDME using 1-Butyl-1-methylpyrrolidinium bis(trifluoromethylsulfonyl)imide as
extracting ionic liquid. ......................................................................................................... 159
Figure 57: Depletion of analytes during consecutive extraction of bicyclic aromatic hydrocarbons
in IL-SSDME using 1-Butyl-1-methylpyrrolidinium bis(trifluoromethylsulfonyl)imide as
extracting ionic liquid. ......................................................................................................... 160
Figure 58: Study of the effect of the alkyl chain on the partition coefficient in IL-SSDME using
IL2 as the extracting medium. ............................................................................................. 162
Figure 59: Comparison of IL-SHS SDME and IL-SSDME in terms of the partition coefficient of
aromatic hydrocarbons using IL2 as the extracting medium. .............................................. 163
Figure 60: Comparison of IL-SHS SDME and IL-SSDME in terms of –ΔGIL/S of aromatic
hydrocarbons using IL2 as the extracting medium. ............................................................. 164
Figure 61: Comparison of IL-SHS SDME against IL-SSDME in terms of the partition coefficient
of benzene, naphthalene and biphenyl using IL2 as the extracting medium. ...................... 166
Figure 62: Comparison of IL-SHS SDME against IL-SSDME in terms of –ΔGIL/S coefficient
of benzene, naphthalene and biphenyl using IL2 as the extracting medium. ...................... 167
Figure 63: Special features of the developed single drop micro extraction method ................... 172

13
List of Tables
Table 1: Comparison of polymeric and Ionic liquid GC stationary phases .................................. 47
Table 2: Probe analytes used for calculating retention index ....................................................... 54
Table 3: Columns choosen for the study and experiments performed .......................................... 70
Table 4: Comparison of ΔΔG value for alkanes at different temperature. ................................... 74
Table 5: Difference in Kc for alkanes between 15m and 30 m SLB-IL 100 stationary phase ... 75
Table 6: Difference in Kc for aromatic hydrocarbons between 15m and 30 m SLB-IL 100
stationary phase ..................................................................................................................... 76
Table 7: Comparison of ΔΔG of aromatic hydrocarbons at different temperature...................... 77
Table 8:Correlation between ΔG of alkanes and the number of carbons in the IL....................... 80
Table 9: Comparison of Ionic liquid stationary phase with polyethyleneglycol stationary phase in
terms of thermodynamic parameters. .................................................................................... 84
Table 10: Comparison of Kc of aromatic hydrocarbons using helium and air as carrier gas on
SLB-IL 100 stationary phase ................................................................................................. 94
Table 11: Comparison of ΔH0 and ΔS0 for aromatic hydrocarbons using helium and air as
carrier gas on SLB-IL 100 stationary phase ......................................................................... 96
Table 17: Precision of IL-SSDME at 150 0C inlet temperature before complete method
optimization using IL1......................................................................................................... 125
Table 18: Precision of IL-SSDME at 150 0C inlet temperature before complete method
optimization using IL1......................................................................................................... 126
Table 12: Calculation of apparent coefficient in IL-SHS SDME using 1-Butyl-1-
methylpyrrolidinium bis(trifluoromethylsulfonyl)imide at 22 °C ....................................... 135

14
Table 13: Apparent coefficient in IL-SHS SDME using 1-Butyl-3-methylimidazolium
bis(trifluoromethylsulfonyl)imide at 22 °C ......................................................................... 137
Table 14: Analytical figures of merit for IL-SHS SDME ........................................................... 140
Table 15: Apparent coefficient in IL-SSDME using 1-Butyl-3-methylimidazolium
bis(trifluoromethylsulfonyl)imide at 22 °C ......................................................................... 161
Table 16: Comparison of IL-SHS SDME and IL-SSDME in terms of its practical usage ......... 168

15
Abstract
The interest of using ionic liquids as gas chromatographic stationary phase has increased in
recent years. The low volatility, tailorable physico-chemical property and high thermal stability
of ionic liquids make them an ideal choice for gas chromatographic stationary phase. For the
present research, commercially available ionic liquid capillary columns were investigate for
thermodynamics and kinetics of the retention of alkanes and aromatic hydrocarbons. Van’t Hoff
plot was made and the thermodynamic parameters ΔG, ΔH, ΔS were determined. The
thermodynamic parameters of SLB-IL 59 and SLB-IL 61 were compared with a conventional
polyethylene glycol based stationary phase Stabile Wax -10 having similar Rohrschneider-
McReynolds constants. A plot of ΔH, ΔS were made against claimed polarity of the ionic
liquid columns. Though the polarity numbers were similar for all the three, the trend in ΔS was
different. This shows that Rohrschneider-McReynolds constants by themselves do not predict
the actual polarity of these columns and the five probe molecules used for ascertaining the
McReynolds constant does not account for all the possible interactions.
The thermodynamics of retention of aromatic hydrocarbons on ionic liquid stationary phase SLB
IL-100 using air as carrier gas was studied. This was compared with the thermodynamic
parameters using helium as the carrier gas. A Van Deemter plot was made for SLB-IL 100 using
aromatic hydrocarbons as probe analyte and air as career gas. Air when used as carrier gas
showed lower optimum value in the Van’ Deemter curve and showed a steeper rise in the slope
to the right of the optimum value. The kinetic study revealed the possibility of using ionic liquid
stationary phase with air as career gas. The stability of ionic liquid stationary phases in the
presence of oxygen in air escalates its commercial usage to new horizon of applications.

16
Ionic liquid–static headspace single drop micro extraction (IL-SHS SDME) involving three
phase equilibrium was performed to extract aromatic hydrocarbons from water. A quick
extraction was performed by taking the analyte in a 2 ml vial with 0.5 ml headspace volume.
Two ionic liquids, 1-Butyl-1-methylpyrrolidinium bis (trifluoromethylsulfonyl)imide and 1-
Butyl-3-methylimidazolium bis(trifluoromethylsulfonyl)imide, both having same anion were
individually used for the extraction. A direct , no interface introduction of ionic liquid into the
gas chromatographic inlet was performed. Ionic liquid stationary phase was used for the
chromatographic separation and GC MS for instrumental analysis. The partition coefficient of
the aromatic hydrocarbons between the ionic liquid and water were determined by depletion
study. The partition coefficient was higher for the aromatic hydrocarbons when 1-Butyl-3-
methylimidazolium bis(trifluoromethylsulfonyl)imide was used as the extracting micro droplet.
The extraction method was then extended for quantitative analysis. The method presented a
precision lower than 6.5 % , recovery of 88.9% to 98.1% and the limit of quantitation were 60
pg L-1 for aromatic hydrocarbons. Real samples of drinking water were collected from different
source and aromatic hydrocarbons were not detected in any of them.
Ionic liquid–submerged single drop micro extraction (IL-SSDME) involving two phase
equilibrium and ionic liquid–static headspace single drop micro extraction (IL-SHS SDME)
involving three phase equilibrium were compared in terms of their partition coefficient. Ideally
both the extractions were expected to give close values for the partition coefficient . But in actual
IL-SHS SDME showed superior extraction when compared to IL-SSDME

17
Ionic liquid based microextractions not only served as ‘green’ alternative to traditional
extraction but also proved to be selective, efficient and time saving sample preparation and pre-
concentration technique.

18
Chapter 1: Introduction

19
Gas Chromatography
The beginning of chromatography was with Ramsey1 as he separated mixture of gases on
charcoal and Michael Tswett2 separated pigments by liquid chromatography. Tswett coined the
word chromatography which meant color writing and is considered as the founder of
chromatography. In the present world most separations are done on complex mixtures that are
not colored and the term chromatography is not related to the literal meaning. Gas
chromatography is a form of chromatography where the mobile phase is a gas. Modern gas
chromatography employs stationary phases which are liquid films supported on the walls of thin
capillary tubes. Gas chromatography has been used for the analysis of gases, liquids and solids.
The volatile analyte once injected in the hot inlet, enters along with the carrier gas into the gas
chromatographic column, where it gets partitioned between the liquid stationary phase and the
gaseous mobilephase. Volatile samples are preferred for gas chromatographic analysis. If a
compound is not volatile, it can be derevatized, converting it to a volatile form. Gas
chromatography can be a fast analytical technique, requires small sample volume (µL) and is
relatively inexpensive and reliable for quantitative analysis. To understand the basic concepts
behind chromatographic separation, the basic thermodynamics and kinetics of gas
chromatography are discussed in the following section.
Process type in chromatography
Ideal chromatography infers that the exchange between the two phase is thermodynamically
reversible. The mass transfer is very high and the longitudinal and other diffusion process are
small enough to be ignored. In nonideal chromatography, these assumptions cannot be made.
The distribution isotherms may be either linear or non linear in and the chromatographic system
may be either ideal or non ideal.
20
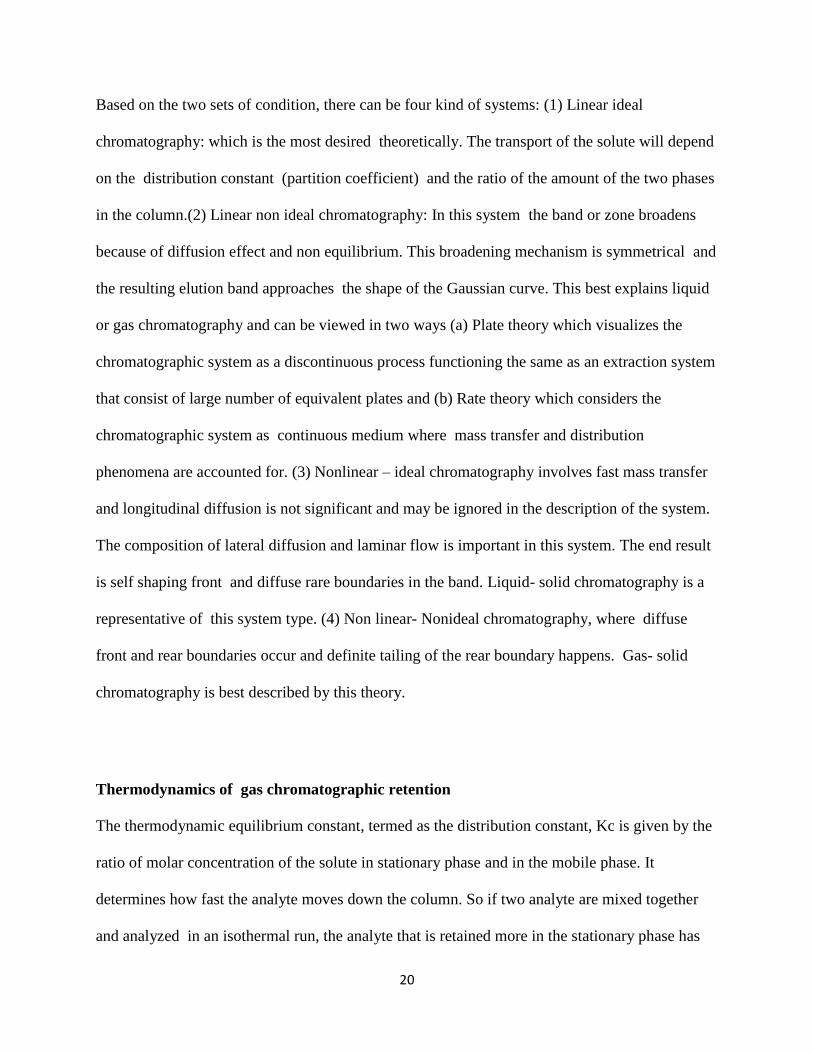
Based on the two sets of condition, there can be four kind of systems: (1) Linear ideal
chromatography: which is the most desired theoretically. The transport of the solute will depend
on the distribution constant (partition coefficient) and the ratio of the amount of the two phases
in the column.(2) Linear non ideal chromatography: In this system the band or zone broadens
because of diffusion effect and non equilibrium. This broadening mechanism is symmetrical and
the resulting elution band approaches the shape of the Gaussian curve. This best explains liquid
or gas chromatography and can be viewed in two ways (a) Plate theory which visualizes the
chromatographic system as a discontinuous process functioning the same as an extraction system
that consist of large number of equivalent plates and (b) Rate theory which considers the
chromatographic system as continuous medium where mass transfer and distribution
phenomena are accounted for. (3) Nonlinear – ideal chromatography involves fast mass transfer
and longitudinal diffusion is not significant and may be ignored in the description of the system.
The composition of lateral diffusion and laminar flow is important in this system. The end result
is self shaping front and diffuse rare boundaries in the band. Liquid- solid chromatography is a
representative of this system type. (4) Non linear- Nonideal chromatography, where diffuse
front and rear boundaries occur and definite tailing of the rear boundary happens. Gas- solid
chromatography is best described by this theory.
Thermodynamics of gas chromatographic retention
The thermodynamic equilibrium constant, termed as the distribution constant, Kc is given by the
ratio of molar concentration of the solute in stationary phase and in the mobile phase. It
determines how fast the analyte moves down the column. So if two analyte are mixed together
and analyzed in an isothermal run, the analyte that is retained more in the stationary phase has

21
higher Kc and the other analyte, that elutes faster, would have a lower Kc value. In gas
chromatographic analysis, Kc can be determined using the following expression
Kc = β x k Equation (1)
Where β is the phase volume ratio and k is the retention factor
β = = rc/2df Equation (2)
Where rc is the radius of the capillary column and df is the film thickness of the capillary
column.
The retention factor is given by
k =(tr-t0)/t0 Equation (3)
Where tr is the retention time of the analyte and t0 is the holdup time.
Thus from the retention time of the analyte at particular isothermal run and the holdup time of
the column, one can calculate the distribution constant.3
The distribution constant is related to the free energy change for the chromatographic process by
the following expression
ΔG = -RT ln(Kc) Equation (4)

22
Where ΔG is the free energy change associated with the chromatographic process, R is the gas
constant and T is the temperature in kelvin.
The free energy change ΔG is related to the enthalpy change ΔH and entropy change ΔS by the
equation:
ΔG = ΔH – TΔS Equation (5)
Equating equation (4) and (5), we get
-RT ln (Kc) = ΔH – TΔS Equation (6)
ln (Kc) = -ΔH/RT + ΔS/R Equation (7)
Thus a plot of ln Kc against 1/T should be linear as shown in Figure 1 if the chromatographic
retention follows only partition process and the plot is called as Van’t Hoff plot.4 Since
Equation.(7) is in the form of the general equation for straight line, the thermodynamic
parameters ΔH can be found from (-slope*R) and ΔS can be determined from the (intercept*R)
of the linear plot.

23
Figure 1: Van’t Hoff plot for the exothermic process, adopted from reference 4
Kinetics of gas chromatographic retention
The most popular research of the kinetics of chromatography was first published by van
Deemter, Zuiderweg and Klinkenberg in 19565. Band broadening can be represented in terms of
height equivalent to a theoretical plate HETP, as a function of average linear velocity u.
The simple form of the equation is represented as follows:
HETP = A+ B/ u + C * u Equation (8)
Where A term represents the eddy diffusion, the B term represents longitudinal molecular
diffusion and the C term represents mass transfer. From Equation (8) , the HETP is inversely
ln K
c

24
related to the plate number N or the number of theoretical plates. N represents the efficiency of
the column. N is represented by Equation (9)
N= 16(tr/Wb)2 Equation (9)
Where tr is the retention time of the analyte peak and Wb is the width of the analyte peak at the
base. For a chromatographic separation, smaller the value of HETP, narrower the peaks are.
Thus each of the three terms should be minimized to lower thre HETP and to increase the
efficiency (number of theoretical plates, N) of the column.
Since capillary gas chromatographyuses open tubular capillarycolumns and donot have any
packing, one would expect that the rate equation would not have the A term. The B can be
represented in terms of diffusion coefficient DG as follows:
B = 2DG Equation (10)
A smaller value of diffusion coefficient DG in the gas phase leads to a smaller B term. In general,
a low diffusion coefficient can be obtained by using carrier gas with large molecular weight. If
we consider Equation (8), the B term is divided by the linear velocity. This implies that higher
linear velocity would also minimize the contribution of B term to the overall peak broadening.
The C term in Equation(8) relates to the mass transfer of the solute either in the stationary phase
Cs or in the mobile phase CM. .Fast solute sorption and desorption will keep the solute molecules

25
close together and keep the band broadening to a minimum.is the aditive of the mass transfer of
the solute in the mobile phase CM and mass transfer of the solute in the stationary phase.CS. So
the Equation (8) can be re written for gas chromatography as follows:
HETP = B/ u + (CS + CM) u Equation (11)
The Equation (11) is the simplified form of Golay equation.
The Cs term in Equation (11) is given by:
Cs= 2kdf2 / (3(1+k)2 Ds ) Equation (12)
Where df is the average film thickness of the liquid stationary phase. And Ds is the diffusion
coefficient of the solute in the stationary phase. To minimize the contribution of this term, the
film thickness of the stationary phase should be small and the diffusion coefficient should be
large. Rapid diffusion through thin films allows the solute molecules to stay close together. Thin
film coated stationary phases are made by coating small amount of liquid on the capillary walls.
However, the diffusion coefficient is controlled by selecting low viscous stationary phase. The
Cs minimizes when the mass transfer into and out of the stationary phase is very fast. The other
part of the Equation (12) is k/(1+k). Larger the k value, greater the solubility of the analyte in the
stationary phase. The ratio k/(1+k) is minimized by large value of k but to a small extent beyond
a k value of 20.
The mass transfer in the mobile phase is given by Equation (13)
26
CM = (1+6k+11k2)rc2 / (24 DG(1+k)2) Equation (13)
Where rc is the radius of the column.
The mass transfer in mobile phase can be visualized as the profile of a solute zone as a
consequence of nonturbulant flow through the capillary tube. Inadequate mixing in the gas phase
results in band broadening because the solute molecule in the center of the column moves ahead
of those at the wall. Small diameter column minimizes the broadening because the mass transfer
distance is made relatively small.
Thus the relative importance of the two C terms in the rate equation depends mainly on the film
thickness and column radius. In general, for thin film column (<0.2 µm), the C term is controlled
by mass transfer in the mobile phase, for thick film column( 2-5 µm), it is controlled by mass
transfer in the stationary phase and for intermediate film thickness (0.2 to 2 µm) both CM and CS
need to be considered.
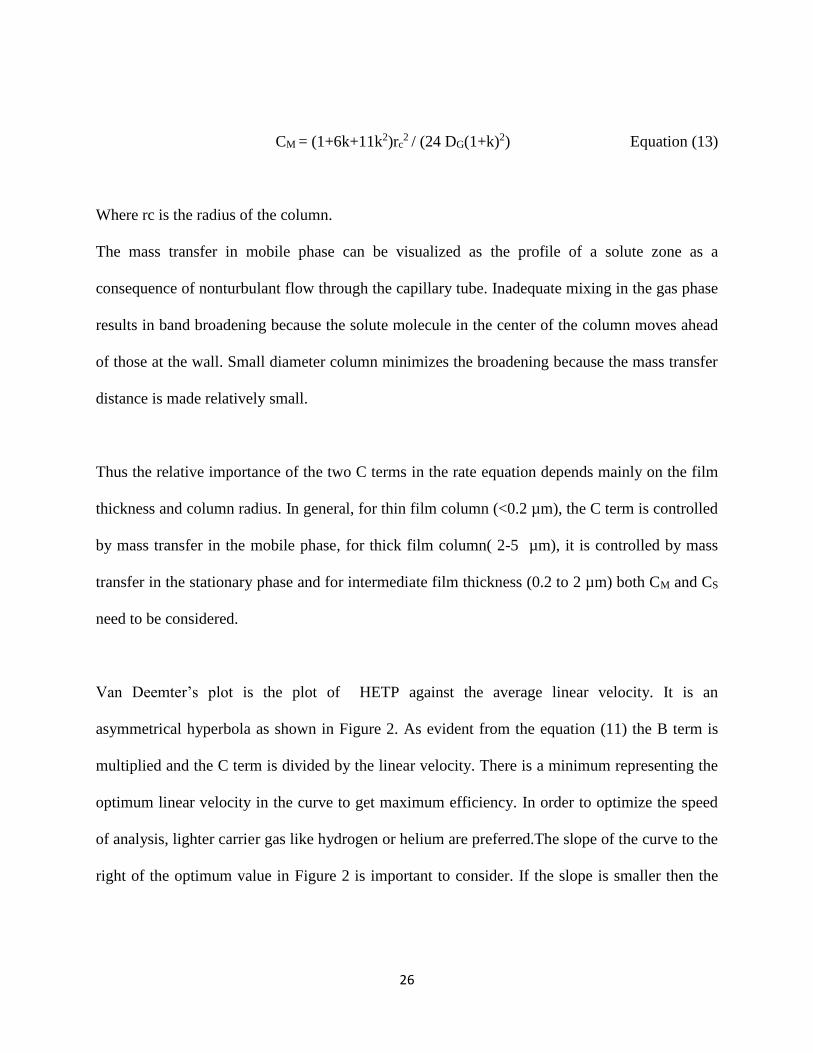
Van Deemter’s plot is the plot of HETP against the average linear velocity. It is an
asymmetrical hyperbola as shown in Figure 2. As evident from the equation (11) the B term is
multiplied and the C term is divided by the linear velocity. There is a minimum representing the
optimum linear velocity in the curve to get maximum efficiency. In order to optimize the speed
of analysis, lighter carrier gas like hydrogen or helium are preferred.The slope of the curve to the
right of the optimum value in Figure 2 is important to consider. If the slope is smaller then the

27
compramise in the efficiency with speed of analysis is minimum. The commonly used carrier
gases for GC analysis are Helium, Nitrogen, Hydrogen. However the choise is also subjective to
Figure 2: Typical example of Van Deemter plot, adopted from reference 3.
the type of detector used, speed of analysis, thick or thin film column used for analysis. Since air
is composed of 70% Nitrogen, it is a worth while trial to use air as carrier gas to reduce the cost
of analysis. However the need for stable stationary phases that can withstand air oxidation is
desired. The other drawback is the narrow range of analytes that are stable to air oxidation.

28
Gas chromatographic inlet systems for capillary columns
Capillary columns have stringent requesite for sample injection systems. A very fast injection
involving very narrow profile, very small quantity usually less than 1 µg. The capillary peaks
are very narrow with a peak width of few seconds. Thus very fast injections are required to
reduce band broadening due to slow injection.
Split Injection
This is one of the simplest and easiest injection mode to use. A schematic diagram of a typical
split inlet is shown in Figure 3. First, the carrier-gas flows in to the top of the inlet, just below the
septum. Here, the carrier-gas flow splits between a septum purge vent and the glass liner. The
septum purge is at slow flow, typically a few milliliters per minute, that passes underneath the
septum and is vented, to prevent any carry over from the septum from entering

29
Figure 3: Schematic of Split inlet , adopted from reference 104.
the inlet and the capillary column. The other flow path goes into the glass liner, where the
syringe needle deposits the sample. In a split injection, there is usually a large (typically 50–100
mL/min) flow of carrier gas through the glass liner. Ideally, the injected sample will be
vaporized and mixed with the carrier gas. At the end of the inlet liner, there are two possible
exits: the capillary column and the purge vent. A capillary column typically has a relatively low
volumetric flow rate (about 1 mL/min), which is determined by the column head pressure setting
and the column dimensions, and the purge vent has a higher flow (typically 50–100 mL/min),
which is controlled by a needle valve. The ratio of the volumetric flow rate out of the purge vent
to the volumetric flow rate in the capillary column is termed the split ratio and provides a
control over the actual volume of sample entering the column. Care should be taken when using
the split ratio to estimate actual injected sample volume, or when using it in comparisons
between methods on different instruments. There are differences between instruments and
30
measurement techniques that may affect the measured flows. For example, the column
volumetric flow rate measured by injecting a nonretained substance is the average column flow
rate, not the flow rate at the inlet, while a flow meter connected to the split purge vent measures
the volumetric flow rate at the vent, not in the inlet. With newer, electronically
controlled systems, the flows are measured directly at the inlet, or are calculated from the entered
inlet conditions and column dimensions.
The problems faced by analysts using the split inlet relate to sample discrimination and nonlinear
splitting, both of which cause split injection to produce confusing results. Discrimination results
from sample heating that occurs in several locations and results from the inlet temperature and
liner geometry and may occur in the high or low end of sample volatility. Nonlinear splitting is
the loss of some components, relative to others that may have similar volatility, and is an
indication of sample chemistry or reactivity problems. To an extent, discrimination occurs in all
heated inlets, due to heating of the syringe needle. Making the injection as rapid as possible, by
using a fast autosampler, mitigates this problem. Further, as part of method development, the
choice of glass sleeve geometry and the inlet temperature should be optimized. Nonlinear
splitting occurs as a result of adsorption of sample components on inlet surfaces or contaminants.
Ensuring the cleanliness of the liner including column and septum pieces prevents this. If
adsorption is suspected, then inlet components such as the glass sleeve and metal components
should be deactivated.
A typical example where split injection is used is when finding the chromatographic purity of a
volatile solvent. If 1µL of the solvent is injected into the injector, the vapor volume would be

31
1000 times the original volume. So if the entire quantity entering the inlet passes into the
column, it would over load the column as well as saturate the detector.For example, a split ratio
of 1:50 is set during the split injection. This mode of injection is a fast injection resulting in high
resolution separation and does not need dilution of samples. The disadvantage includes
discrimination of high molecular weight sample in the solute such that the sample entering the
column is not the representative of the sample injected as mentioned in the previous paragraph.
This mode of injection is not suitable for trace level analysis of analytes.
Splitless injection
Almost all capillary gas chromatographs, the split/splitless inlet combines the capabilities of
both and can operate in either “split mode,” to perform a split injection, or “splitless mode,” to
perform a splitless injection. A schematic diagram of a splitless inlet, in both the “purge on” and
“purge off” configurations is shown in Figure 4 and Figure 5 respectively. In the “purge on”
configuration (Figure 4), the inlet operates as a split inlet. To perform a splitless injection,
the purge valve is switched to the OFF position, as shown in the top figure. Since the inlet is
backpressure-regulated, the flow is redirected so that the inlet pressure is maintained, which
maintains flow through the column, but the volumetric flow through the glass sleeve is greatly
reduced. While the purge valve remains off, an injected sample has no place to go from the glass
sleeve, but into the column. As in the split inlet, the splitless inlet is heated to ensure sample
vaporization and mixing with the carrier gas.

32
Figure 4: Diagrams of splitless inlet with purge off, adopted from reference 104.

33
Figure 5: Diagrams of splitless inlet with purge on , adopted from reference 104.
After a period of time, typically 30–45 sec, the purge valve is turned to the ON state. In order to
maintain the pressure in the inlet, a large flow of carrier gas is passed through the glass sleeve
and through the purge vent. There are several factors that contribute to the surprising result that
splitless injection, which requires a long time to complete, results in sharp peaks. These require
that instrumental conditions, such as the glass sleeve, the inlet temperature, the column
temperature and dimensions, injection solvent, and volume and flow rates, be carefully
optimized.
Usually, for splitless injection, the sample to be analyzed is diluted in a volatile solvent. The
sample when injected vaporizes and slowly enters the cold column where both sample and

34
solvent condenses . The split valve is opened and the residual vapors left in the inlet are sent out
of the system. The preferred mode of oven operation in this case would be a temperature
program. Initially only the volatile solvent is vaporized and carried through the column. While
this is process is going on, the samples are refocused into a narrow band. After some times, the
analytes are vaporized at the hot column and chromatographed. Thus high resolution of the high
boiling analytes are observed. This injection mode is ideal for trace analysis . The Splitless
mode is 20 to 50 folds more sensitive than split mode because more sample enters the column.
The splitless injection suffers from few disadvantages like , slow injection, starting with cold
column. Temperature programmed GC analysis is required. The optimization of temperature
programme, vent opening time or the injection time is very much required while operating in
splitless mode. It is not suitable for very volatile samples and a minimum of 300 C difference in
the boiling point of the diluting solvent and the analyte is requires.
Unlike split injection, which is very rapid, a splitless injection may require up to 1 min for the
injection process to complete. It is obvious that splitless injection would be useless if the injected
bands were one minute wide when eluted. Therefore, there must be several mechanisms involved
in band broadening and band focusing in splitless injection. There are four major processes that
contribute to the eventual sharp bands seen in splitless injection:
1. Band broadening in time which arises simply from the time required for the injected material
to eject from the inlet and to enter the column.
2. Band broadening in space which occurs from the spreading of dissolved analyte in the solvent,
as it condenses inside the initial length of the capillary column. To mitigate these
35
two causes of band broadening, two band-focusing processes occur .
3. Cold trapping which occurs for low-volatility analytes. If the initial column temperature is low
enough, lower volatility analytes will be frozen in a narrow band at the column head.
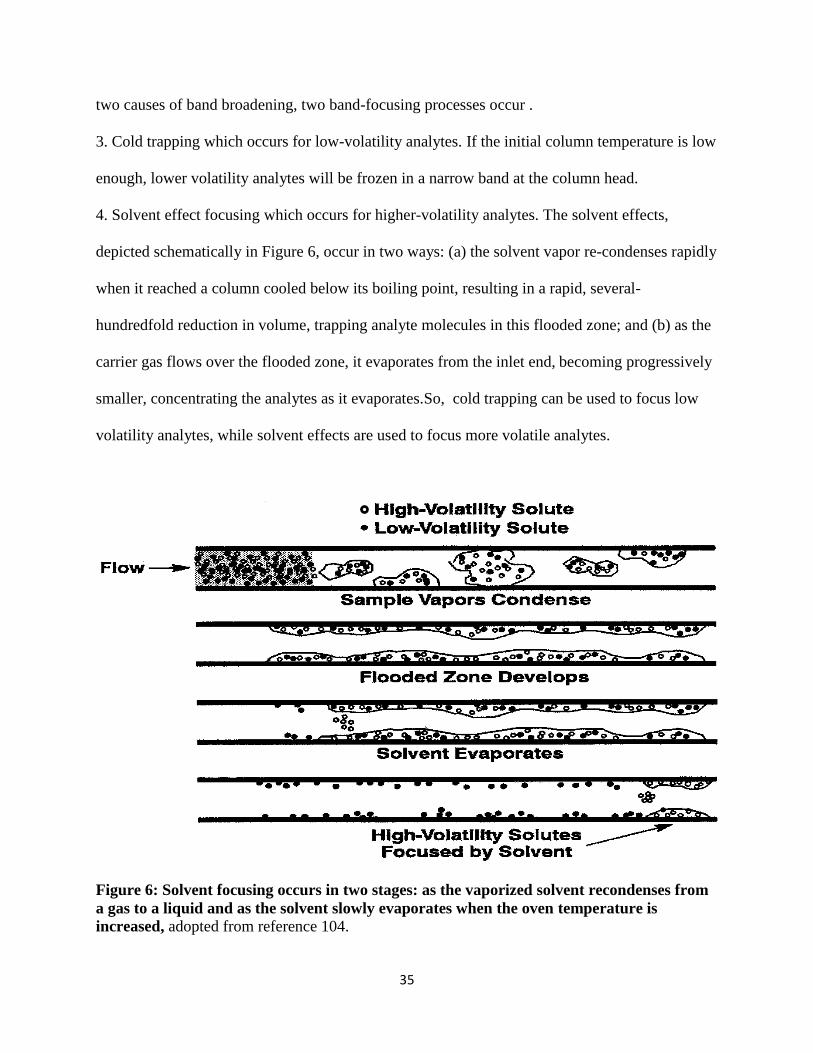
4. Solvent effect focusing which occurs for higher-volatility analytes. The solvent effects,
depicted schematically in Figure 6, occur in two ways: (a) the solvent vapor re-condenses rapidly
when it reached a column cooled below its boiling point, resulting in a rapid, several-
hundredfold reduction in volume, trapping analyte molecules in this flooded zone; and (b) as the
carrier gas flows over the flooded zone, it evaporates from the inlet end, becoming progressively
smaller, concentrating the analytes as it evaporates.So, cold trapping can be used to focus low
volatility analytes, while solvent effects are used to focus more volatile analytes.
Figure 6: Solvent focusing occurs in two stages: as the vaporized solvent recondenses from
a gas to a liquid and as the solvent slowly evaporates when the oven temperature is
increased, adopted from reference 104.

36
Other type of capillary inlets
Other type of capillary inlets are direct injection, on column, cold on column, programmed
temperature vaporization (PTV) inlet. In a direct injection the vaporized sample directly enters
the column. On column as the name signifies, employes the injection of sample directly on to the
column. This requires precise alignement of the needle into the capillary column. Both these
techniques require thin film and wide diameter capillary column. This resultsis better thace
analysis and good quantitation though there is a compramise in resolution. While both high
resolution and good quantitation are possible with cold on-column injection.Here the liquid
sample is injected either to the cold liner or the cold column. The cold injector is rapidly heated
and the vaporized sample is carried through the column. This mode produces minimal
decomposition of thermally labile samples. The PTV on the other hand is heated rapidly at a
programmed rate. Usually the liner employed is smaller in diameter than those of other injection
modes. The sample is injected into the PTV inlet port while it is relatively cold followed by a
rapid temperature programme. In this injection, thermal discrimination is eliminated. This mode
of injection is suitable for large volume injection which is desirable for trace level analysis.
Inlet requirement for the present research
Having understood the advantages and disadvantages of various injection modes for capillary gas
chromatography, the type of injection mode to be adopted for the analysis purely depends on
the purpose of the analysis. The experiments conducted in the research which are explained in
Chapter 2 and 3 involved liquid samples containing analytes at higher concentration. So Split
mode of injections was used. The experiments in Chapter 4 and 5 involved introduction of ionic
liquid containing the extracted analyte into the inlet. The intention of the analysis was trace level

37
analysis of aromatic hydrocarbons. These experiments also needed the desorption of analytes
from the ionic liquid into the inlet. So splitless injection mode was used for these experiments.
The precautions taken while performing the sample introduction in ionic liquid microextraction
will be explained in Chapter 4.
Detectors in gas chromatography
There are aover 60 different detectors that can be used in Gas chromatographic analysis. Flame
ionization detector, thermal conductivity detector, electron capture detector, flame photometric
detector, mass spectrometer are few examples. In this research we have used flame ionization
detector and mass spectrometer.
Flame Ionization Detector
The flame ionization detector is a non selective detector. It can also be classified under the mass
flow type detector. Several factors contribute to the popularity of the FID. First, the FID
responds to virtually all organic compounds that burn in the oxygen- hydrogen flameand gives
favorable sensitivity. The detector response is not affected by modest changes in flow, pressure,
or temperature. It does not respond to common carrier gas impurities such as CO2 and water
under normal operation, although trace hydrocarbon levels in the detector gases will affect
baseline stability. The linear range extends to about 107 orders of magnitude.
The schematic of flame ionization detector is shown in Figure 7. The column effluent is mixed
with hydrogen and led to a small burner tip which is surrounded by high flow of air to support

38
combustion. An igniter is provided for lighting the flame. The collector electrode is biased about
+300 V relative to the flame tip and the collector current is amplified as high impedance circuit.
Figure 7: Schematic of flame ionization detector , adopted from reference 104.

39
Mass spectrometry
The schematic diagram showing the major components of a typical capillary GCMS system is
presented in Figure 8. The gaseous effluent from the chromatographic system is directed through
the transfer line into the ion source. The vaporized analytes are then ionized, producing
molecular and/or fragment ions, which are then mass resolved utilizing a mass filter and
Figure 8: Schematic of GCMS , adopted from reference 104
detected. The resulting mass spectrum is a plot of the relative intensity of these ions versus their
mass-to-charge ratio (m/z). Since most ions produced are singly charged, their m/z values are
indicative of their masses. The source, mass analyzer and mass detector are maintained under
vacuum.
40
The analyte should be ionized in the source in order to be propelled further by electric and
magnetic field. There are various ionization techniques. Electron ionization is the most common
ionization for GC MS . Here the effluent from the column passes through a heated ionization
source at low vacuum. The electrons are drawn out from the tungsten filament by the collector
voltage of 70 eV. The voltage applied to the filament defines the energy of the electron. These
high energy electron excites the neutral molecule, causing ionization. This ionization technique
mostly produces positive ions with single charge as shown below
M+ + e- --------> M+ + 2e- Equation (14)
Since 70 eV is strong enough to cause the M+ ion to fragment further, EI produces the most
stable ions instead of the parent ion. Another convenience of using the EI source is that the
library spectrum are always using EI source and can be used to match the mass spectrum of the
compound of interest during the analysis. For the present work EI source is used as the ion
source. Ther are other alternate means of ionization which includes chemical ionization (CI),
negative chemical ionization (NCI) and fast atomic bombardment (FAB).
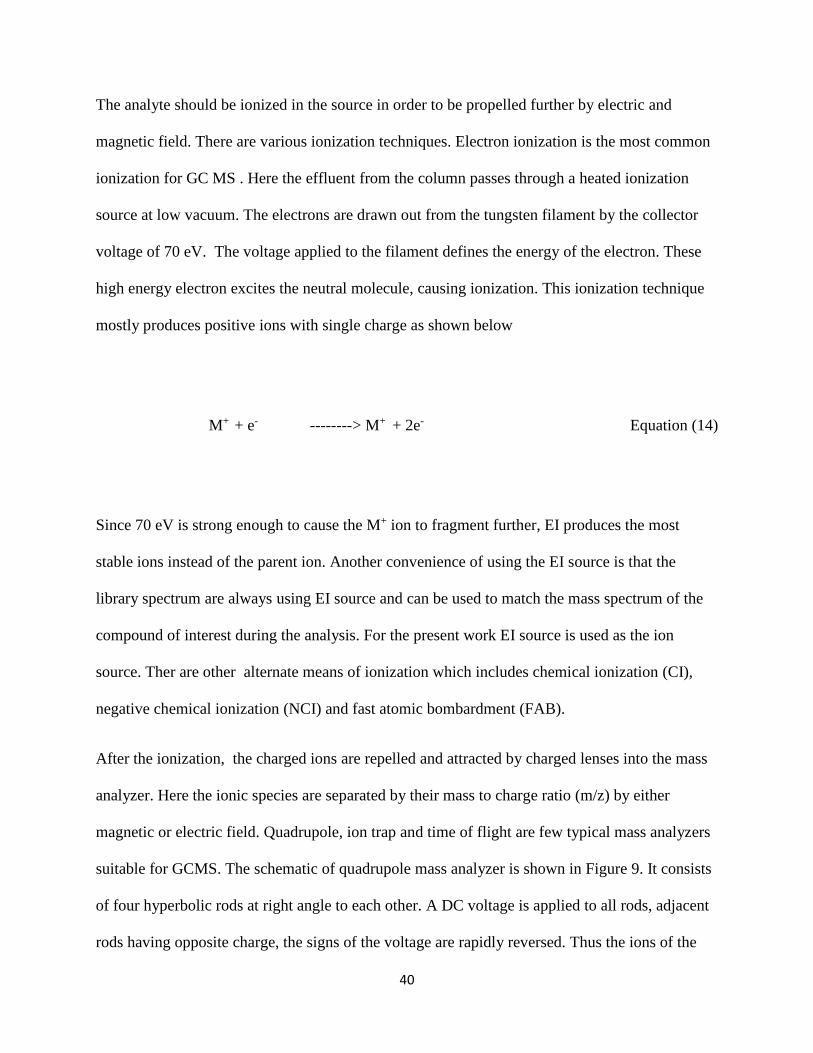
After the ionization, the charged ions are repelled and attracted by charged lenses into the mass
analyzer. Here the ionic species are separated by their mass to charge ratio (m/z) by either
magnetic or electric field. Quadrupole, ion trap and time of flight are few typical mass analyzers
suitable for GCMS. The schematic of quadrupole mass analyzer is shown in Figure 9. It consists
of four hyperbolic rods at right angle to each other. A DC voltage is applied to all rods, adjacent
rods having opposite charge, the signs of the voltage are rapidly reversed. Thus the ions of the

41
analyte molecules are rapidly attracted and then repelled. Radio frequency is also applied to the
four rods. Based on the radio frequency and the DC potential applied, ions of only one mass to
charge ratio will pass through the rod and reach the detector. The RF/DC ratio is ramped up
rapidly to allow a sequential range of m/z to pass through the mass filter.
After the separation of ions in the mass analyzer, the detector which is a continuous dynode
version of an electron multiplier, is used to count the ions and generate the mass spectra.
Figure 9: Schematic of quadrupole mass analyzer, adopted from reference 104.
During the analysis the mass analyzer can be run in scan mode where in a range of masses 50
m/z to 500 m/z can be scanned or in selected ion monitoring (SIM) the mass analyzer is asked to
selectively see only small number of ions with particular m/z. For the present research we have

42
used scan mode for experiments which are explained in Chapter 2 and SIM mode for
experiments that are explained in Chapter 4 and Chapter 5.
Ionic Liquids
Room temperature Ionic liquids (RTILs) are salts that are liquid at room temperature and exist
entirely as ionic species. Metallic salts like sodium chloride are ionic solids with high melting
point. Ionic liquids on the other hand, are liquid at concurrent temperature. Due to the stearic
nature of the anion and/or cation, the ionic liquid has the inability to sit in order in a crystal
lattice6, causing them to remain as liquid. They are also termed as non molecular ionic solvents.
The low vapor pressure of ionic liquids makes them green substitutes to conventional organic
solvents7, 8, 9, 10, 11. They are very versatile as a solvent. The structure of a typical ionic liquid is
shown in Figure 10. There are three distinct parts of the ionic liquid, namely cation (represented
in green color), anion (represented in red color) and the side chain (represented in blue color) or
the linkage group.
Figure 10: Structure of ionic liquid 1-Butyl-3-methylimidazolium bis
(trifluoromethylsulfonyl) imide
43
The cation is usually organic (e.g., imidazolium, pyridinium,pyrrolidinium, phosphonium,
ammonium), the anions can be either organic (e.g., trifluoromethylsulfonate [CF3SO3]−,
bis[(trifluoromethyl)sulfonyl]imide [(CF3SO2)2N]− ) or inorganic (e.g., Cl−, PF6−, BF4
−) and the
linkage group can be either a nonpolar chain (alkane chain), polar chain(polyethylene glycol
back bone) or a nonpolar chain with pendent groups. Based on the different combination of the
cation, anion and the side chain there exists 1018 ionic liquids.12
Due to the possibility of different combination of cation anion and the side chain, the physico-
chemical properties of the ionic liquid can be tailored based on the analytical needs. Therefore
they are called as designer solvents. The ease of synthesis and commercial availability of ionic
liquids, facilitates it application in various fields. The characteristic features of ionic liquids are
the low volatility, negligible vapor pressure, thermal stability, high viscosity, polarizablity,
unique selectivity, surface tension and wetting properties. These features of ILs, combined with
their ease of preparation, have resulted in a remarkable increase in their use.
History of ionic liquids
Ionic liquids (ILs) have a very long history. Gabriel and Weiner found ethanolammonium nitrate
(m.p. 52–550C) in 1888. 13 The “first” RTIL ethylammonium nitrate [EtNH3][NO3] with melting
point 1200 C was reported in 1914 14. A new class of RTILs that consist of dialkylimidazolium
chloroaluminate, were reported by Wilkes et al. in 1982 15. These chloroaluminate ILs did not
receive considerable interest due to their reactivity to moisture and many chemicals. The true
emergence of ILs as broadly useful solvents occurred with the first development of air and
44
moisture-stable imidazolium salts in 1992. Wilkes and Zaworotko synthesized stable RTILs
containing weakly complexing anions, such as BF4 − 16. In addition to their extensive use as
solvents in organic synthesis, ILs have been used more recently in analytical chemistry.
Since the late 1990s, a plethora of papers have been published, which have demonstrated the
enormous potential of ILs for chemical analysis17, 18, 19.
Physical properties of ionic liquid
A fundamental understanding of the physical properties of ionic liquid should be known before
applying it to the intended purpose. Physical properties including liquid range, thermal stability,
heat capacity and heat transfer, vapor pressure, surface tension are to be considered while
selecting the ionic liquid for specific application .
Liquid range and thermal stability
The liquid range is defined as the temperature range between the melting point or glass transition
temperature and the boiling point or the thermal decomposition temperature. Ionic liquids have
fairly wide liquid range than molecular solvents. For example 1-alkyl-3-methyl imidazolium
salts usually have a glass transition temperature of -700 C to -900 C and thermal decomposition
temperature ranges from 3200 C to 5400 C . To give an analogy of how big the liquid range is,
one can compare it with water which exists as liquid between 00 C and 1000 C. The high thermal
decomposition temperature means high thermal stability which extends the use of ionic liquids at
higher temperature. It has been observed that the poly cationic and poly anionic ionic liquids
show higher thermal stability and find application in preparing gas chromatographic stationary
phases.20

45
Heat capacity and heat transfer
The specific heat capacity is defined as the energy required to rise the temperature of unit mass
of the substance by one kelvin. In 2003 Holbrey and coworkers reported the heat capacity of five
ionic liquids with imidazolium cation21. They ranged from 1.17 to 1.80 J g-1K-1 at 1000 C and
increased linearly with temperature. Wilkes and coworkers suggested that ionic liquids might be
used as heat transfer fluids. They also concluded the superiority of ionic liquids to the existing
heat transfer fluids.
Vapor pressure
Ionic liquids have strong coulombic interactions which results in lack of measurable vapor
pressure at temperature up to their decomposition temperature22. In general the vapor pressure of
the ionic liquids especially the imidazolium based ionic liquids with short alkyl chain, is
negligible at room temperature (22 0C) and show no evidence of distillation below their thermal
decomposition temperature.
Surface tension
There are very few reported data about the surface tension of ionic liquids. The surface tension of
ILs is related to the structure of the cations and anions that comprise them. It has been reported
that the surface tension of imidazolium-based monocationic ionic liquids decreases significantly
with an increasing length of the alkyl chain23. For example, the surface tension for 1-butyl-3-
methylimidazolium hexafluorophosphate (BMIM-PF6), 1-hexyl-3 methylimidazolium
46
hexafluorophosphate and 1-octyl-3methylimidazolium hexafluorophosphate varies from 44.81,
39.02, and 35.16 dyne/cm, respectively 24. Similar trends have been observed for ammonium and
phosphonium-based ILs 25. However, the trend for dicationic imidazolium-based ILs is not as
obvious 21. Their surface tension decreases by 1.6 dyne/cm when the linkage chain is varied
from 3 to 9 carbon chains for dicationic Ionic liquids with the 1- methylimidazolium cation and
paired with the NTf2 − anion. The increasing length of the alkyl chain in the three position of the
imidazolium ring has more effect on the resulting surface tension than the linkage chain
separating the two cations. Ionic liquids containing halide anions exhibit higher values of surface
tension compared to lower surface tension values for larger anions. In addition, the surface
tension tends to decrease with increasing size of the anion following the sequence:
tetrafluoroborate (BF4 −) > hexafluorophosphate (PF6
−) > trifluoromethanesulfonate
(TfO−) > bis(trifluoromethylsulfonyl)imide (NTf2−). Ionic liquids possessing surface tension
values ranging from 30 to 50 dyne/cm typically exhibit superior wetting ability on the wall of
untreated capillary columns 26 thus making them the ideal candidate for gas chromatographic
stationary phases. If poor wetting of the walls of the capillary column occurs, the stationary
phase appears as droplets and exhibits poor separation efficiency.
Ionic liquids as gas chromatographic stationary phase
Gas chromatographic stationary phases in general are polymeric and can be broadly classified
into one containing polysiloxane back bone and the other containing a polyethylene glycol
backbone. The former is used to make nonpolar to mid polar columns while the later to make
polar columns. The column manufacturers produce variation in polarity of these columns by
providing structural modifications such as introducing pendent groups to the polymeric chain.

47
For example, DB-5 is the brand name for the GC stationary phase containing 5% phenyl, 95%
methyl polysiloxane and DB-FFAP is the brand name for the stationary phase polyethylene
glycol modified with nitroterephthalic acid. In a way the number of possible combination of
pendent group to produce desired physic chemical property is restricted. In both the cases there
are active hydroxyl groups which are susceptible to degradation. Especially for
polyethyleneglycol based stationary phases, the active hydroxyl groups at the polymer terminal
limits its use at high temperature operation and causes phase degradation and results in column
bleeding.
Table 1: Comparison of polymeric and Ionic liquid GC stationary phases
Properties Stationary phases
Ionic liquid Stationary
phases Methyl polysiloxane
back bone
Polyethyleneglycol
backbone
Nature Polymeric Polymeric Ionic species
Polarity Non polar to mid polar Polar Highly polar
Active hydroxyl
groups
Yes Yes No
Structural
modifications
Limited Limited Various combination of
cation, anion and
linkage group are
possible
Thermal stability Stable(>260 0C) Stable(< 260 0C) Stable(>260 0C)
Stability to air and
moisture
Not stable Not Stable Stable
Type of analysis Non polar analytes Polar analytes Unique selectivity for
polar and nonpolar
analytes
From the analyst’s perspective, the general rule of thumb is to select nonpolar columns for non
polar analytes and polar columns for polar analytes. So if there is a mixture of compound( both
48
polar and nonpolar) given for the analysis, the analyst is forced to compromise good
chromatographic figures of merit for one set of compound. In such cases a gas chromatographic
stationary phase with versatility in selectivity is desirable.
Ionic liquids have unique and tailorable physico-chemical properties such as high viscosity, low
vapor pressure, wide liquid range, thermal stability, surface tension and wetting ability, dual
selectivity for polar and nonpolar analytes, no active hydroxyl group and so they are the ideal
candidate for making gas chromatographic stationary phase. A comparison of polymeric GC
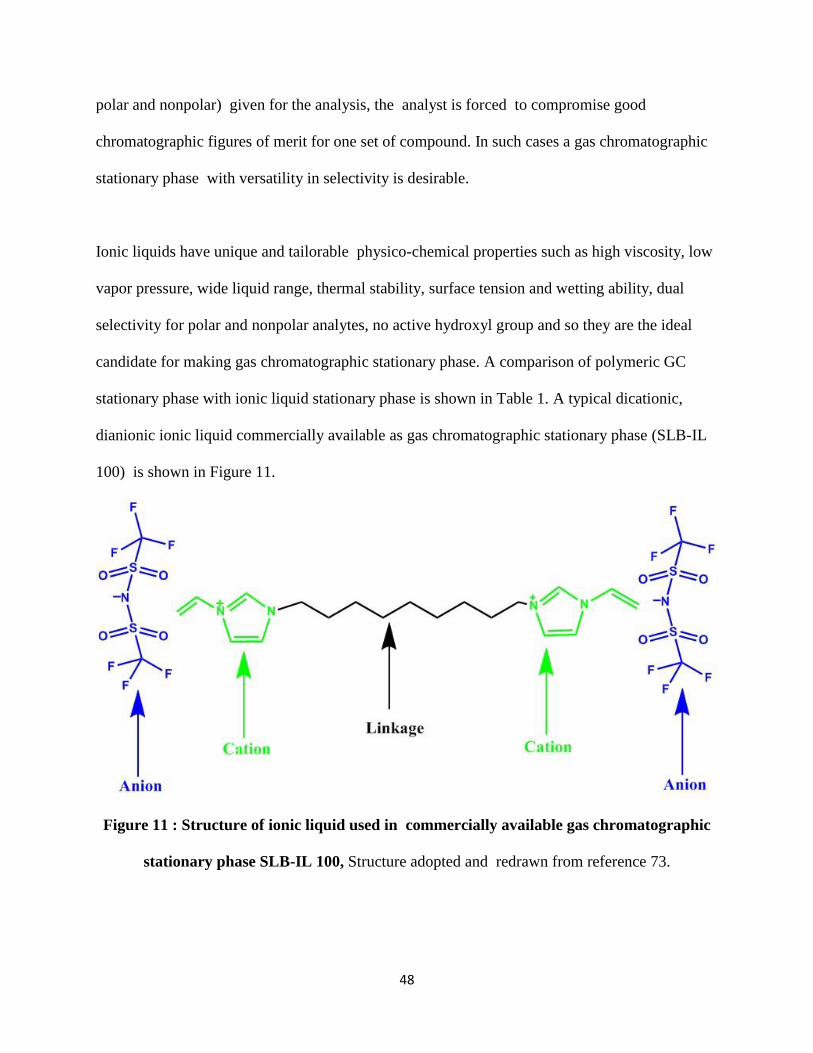
stationary phase with ionic liquid stationary phase is shown in Table 1. A typical dicationic,
dianionic ionic liquid commercially available as gas chromatographic stationary phase (SLB-IL
100) is shown in Figure 11.
Figure 11 : Structure of ionic liquid used in commercially available gas chromatographic
stationary phase SLB-IL 100, Structure adopted and redrawn from reference 73.

49
The dual polar and non polar nature27 of the ionic liquid results in unique selectivity and
separation of mixture of polar and nonpolar analytes simultaneously. Also the poly cationic and
anionic ionic liquids exhibit high thermal stability and improved liquid range. Figure 12 shows
the comparison of commercially available ionic liquid stationary phases with polymeric
stationary phases based on Mc Reynold's number
Figure 12: Comparison of commercially available ionic liquid stationary phases with
polymeric stationary phases based on Mc Reynold's number, adopted from reference 73 and
105.
The commercially available ionic liquids are arranged on the right side and ranked in ascending
order of the Mc Reynold’s number while on the left side, conventional polymeric stationary
phases are arranged. There are commercially available ionic liquid stationary phases in market
50
that promises polarity similar to and higher than the conventional polymeric polyethyleneglycol
column and yet can withstand higher temperature.
Characterization of Ionic liquids stationary phase
The general retention mechanisms related with packed or capillary GC columns as well as
common solvation models used to illustrate the retention behavior and to characterize various
solvation interactions are summarized below.
Adsorption-Partition mechanism
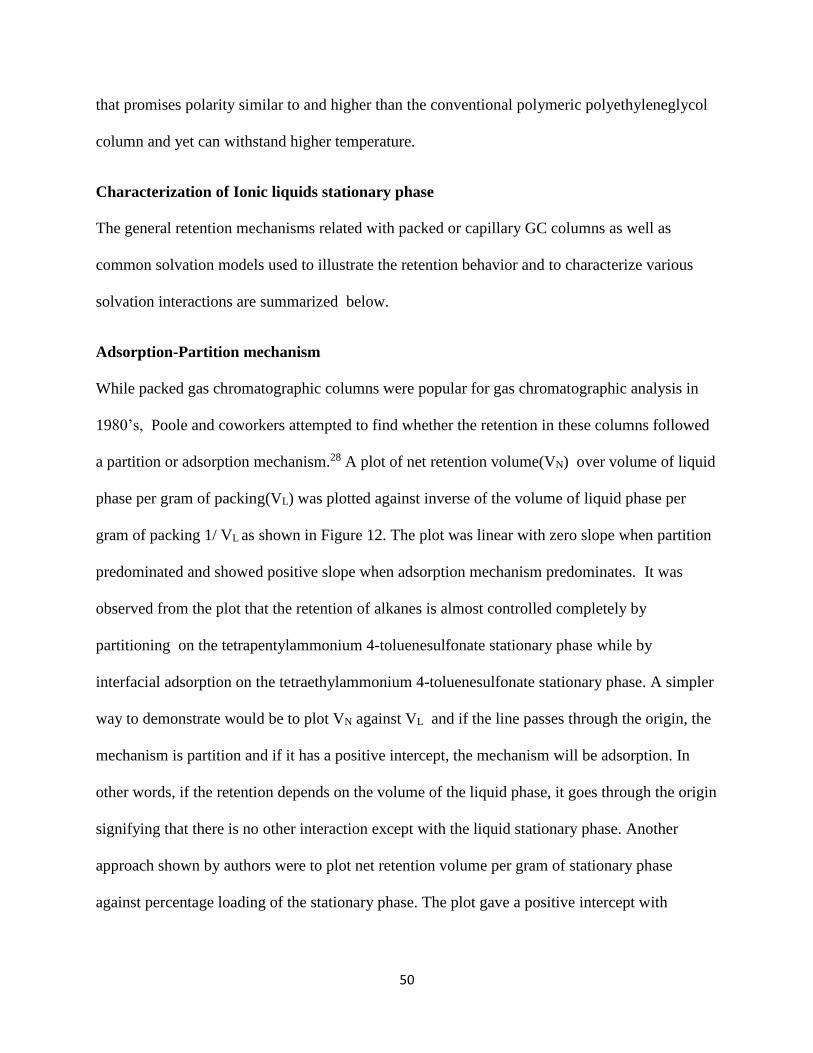
While packed gas chromatographic columns were popular for gas chromatographic analysis in
1980’s, Poole and coworkers attempted to find whether the retention in these columns followed
a partition or adsorption mechanism.28 A plot of net retention volume(VN) over volume of liquid
phase per gram of packing(VL) was plotted against inverse of the volume of liquid phase per
gram of packing 1/ VL as shown in Figure 12. The plot was linear with zero slope when partition
predominated and showed positive slope when adsorption mechanism predominates. It was
observed from the plot that the retention of alkanes is almost controlled completely by
partitioning on the tetrapentylammonium 4-toluenesulfonate stationary phase while by
interfacial adsorption on the tetraethylammonium 4-toluenesulfonate stationary phase. A simpler
way to demonstrate would be to plot VN against VL and if the line passes through the origin, the
mechanism is partition and if it has a positive intercept, the mechanism will be adsorption. In
other words, if the retention depends on the volume of the liquid phase, it goes through the origin
signifying that there is no other interaction except with the liquid stationary phase. Another
approach shown by authors were to plot net retention volume per gram of stationary phase
against percentage loading of the stationary phase. The plot gave a positive intercept with

51
negligible change in retention volume when extrapolated to zero, when adsorption mechanism
was followed. However if there was a linear increase in net retention with increase of the phase
Figure 13: Plot of VN/VL with 1/VL for n-alkanes with 9–15 carbon numbers on
(a) tetrapentylammonium 4-toluenesulfonate and (b) tetraethylammonium 4-
Toluenesulfonate, adopted from reference 28.
loading, partition would predominate28, 29. Thus they were able to conclude if a particular column
separated the analyte of interest by partition or adsorption.

52
Kovats retention index
In order to estimate the polarity of the stationary phase, one needs to depend on the retention
behavior of the solute on the particular stationary phase. Retention volume and retention factor
gives a good estimate of the retention behavior of analytes. However they are subjected to too
many variables. A simpler approach was adopted by Kovats30. The adjusted retention volume VN
of homologous series of n-alkanes were determined. The kovalt’s retention index, I, was
assigned 100 times the number of carbons in the aliphatic chain. For example propane was given
I value of 300 and butane was given I value of 400. A plot of natural log of retention volume
was made against the I value which followed a linear pattern as shown in Figure 14. For the
unknown solute, this plot was used as the calibration plot, the experimental value of adjusted
retention time or adjusted retention volume were determined by injecting the unknown solute
Figure 14: Kovats retention index plot, adopted from reference 30.
53
and the retention index I was calculated using the following Equation (14):
I = 100*[((log(VN)u-log(VN)x)/()log(VN)x+1-log(VN)x)]+100x Equation (14)
Where the subscript u stands for the solute with unknown I value and x, (x+1) stands for the
number of carbons present in the alkanes present in the alkane just before and just after the solute
with unknown I value. Alkanes were a set of universal standards for establishing I values, other
homologous series were also used by industries based on the analyte or solute of particular
interest. Thus Kovalts retention index became popular method, replacing absolute retention
parameters which were adopted before.
Rohrschnider- McReynolds constants
This method adopted the determination of Kovalts retention index of analyte on non polar
stationary phase squalane and then on the stationary phase whose polarity has to be determined.
Then ΔI, the difference in the I value between the nonpolar squalane column and the column of
interest was determined. Rohrschnider used 5 probe analytes to compare the retention index on
squalane and any other liquid phase. They were benzene, Ethanol, 2-butanone and pyridine.
Then the ΔI value was determined for all the five probe analytes. Each of the probe analyte
measured characteristic intermolecular interaction as shown in Table 2. The ∑ΔI or the sum of
the ΔI values were determined and normalized with respect to the non polar column to predict

54
the polarity number of the stationary phase for which polarity has to be determined. 31, 32 In 1970
McReynolds33 went ahead and proposed ten probe analytes including, benzene, n-butanol, 2-
pentanone, nitropropane, pyridine, 2-methyl-2-pentanone, iodobutane, 2-octyne, 1,4-dioxane,
cis-hydrindane to replace the five probe analytes used before.
Table 2: Probe analytes used for calculating retention index
Rohrschnider Mc Reynolds
Benzene Benzene
Ethanol n-Butanol
2-Butanone 2-Pentanone
Nitromethane Nitropropane
Pyridine Pyridine
2-Methyl-2-pentanol
Iodobutane
2-Octyne
1,4-Dioxane
Cis- Hydrindane
Even today the polarity of commercially available ionic liquids are predicted using McReynold’s
number as shown in Figure 15. The commercially available ionic liquids assigned polarity
number based on McReynolds number by Supelco-Sigma Aldrich. It is seen that the

55
contribution from each probe analyte is summed up and represented as P in the Figure 15.
Following this column is polarity number denoted by P.N. Here an assumption is made that SPB
octyl has a polarity number 1. The P value of other columns are normalized with respect to SPB
Octyl column. The discrepancy in the calculation of polarity number will be further discussed in
Chapter 2.
Figure 15: Polarity index calculation for commercial ionic liquid columns by Supelco-
Sigma Aldrich , adopted from reference 70.
56
Abraham’s solvation model
Abraham and co-workers by utilized large number of test probes that are capable of undergoing
multiple interactions with stationary phase34, 35 . This model can be applied to characterize liquid
or gas phase interactions between solutes and liquid phases. The solvation model is a linear free
energy relationship based on the assumption that the total free energy change for the transfer of
solute X from the gas phase to the liquid phase is the linear sum of the contributions from
different individual free energies. The solvation of solute X includes three steps: (1) a cavity of
suitable size is created in the solvent; (2) the solvent molecules reorganize around the cavity; and
(3) the solute is introduced into the cavity followed by the occurrence of the various interaction
between the solute and solvent. The test probes interact with the solvent through different types
of interactions depending on their structural properties. Five parameters, referred to as solute
descriptors (E, S, A, B, L) are utilized to describe the properties of the solute which have been
determined for hundreds of probe molecules. Each solute descriptor is described as follows: E is
the excess molar refraction calculated from the solute’s refractive index; S is the solute
dipolarity/polarizability; A, B are the solute hydrogen bond acidity and hydrogen bond basicity,
respectively; and L is the solute gas–liquid partition coefficient on hexadecane at 298K. The
model is described in Equation (15).
log k = c + eE + sS + aA + bB + lL Equation (15)
According to Equation (12), k is the retention factor of a given solute on a stationary phase at a
specific temperature. The system constants e, s, a, b, l are used to describe the solvation
properties of stationary phase and are defined as follows: e is the ability of the solvent to interact

57
with solute via π-π or n-π interactions; s is a measure of the dipolarity/polarizability of the
solvent; a and b are measure of the solvent hydrogen bond acidity and hydrogen bond basicity,
respectively; l describes the overall dispersive-type interactions. The system constants are
obtained by multiple linear regression analysis of the solute descriptors and retention
factors. The value of each system constant describes the contribution of the particular interaction
to the overall solute–solvent retention mechanism. It is important to stress the fact that the value
of the system constants is temperature dependent.
Other studies
In modern gas chromatography, wall coated open tubular capillary columns have replaced
packed columns for gas chromatographic separation. Various groups have attempted to refine the
above mentioned models36, 37. Most of them considered that simplicity of just selecting five to
ten probe analytes to find Mc Reynold’s number to account for all kind of interactions leads to
ambiguity in the ascertained polarity. The classification of the RTILs based upon dipolarity and
basicity provides a model that can be used to pick RTILs for specific organic reactions, liquid
extractions, or GLC stationary phases. It was established by Anderson that as compared to
conventional organic solvents, RTILs are much more complex solvent systems capable of
undergoing many types of interactions. Characterizing them with a single “polarity” term fails to
describe the type and magnitude of individual interactions that make each RTIL unique. The
solvation model uses many solute probe molecules in conjunction with inverse GC to
quantitatively determine the importance of different RTIL interactions as a function of
temperature. These results are especially useful in explaining solvent behavior between broad
classes of RTILs. Even today, there are questions about choosing the right scale or method that

58
can depict the characteristic retention aspects of ionic liquids as stationary phase. Especially for
the commercially available ionic liquid stationary phases, whose structure and type of bonded
phase are proprietary and may not be disclosed to the user, easily available parameters that assist
in selecting the column is desirable.
Ionic liquid in microextraction
Sample preparation plays a vital role in analytical chemistry. It includes extraction and
preconcentration of target analytes. Conventional liquid - liquid extraction generally employs
large amount of extracting solvents and is time consuming. Ionic liquids have been used for
liquid–liquid extraction of metal ions38 , small organic molecules39, 40 and large biological
compound41, 42. Since liquid-liquid extraction employs large volume of the extracting medium,
the end result was leads to generation of hazardous waste. To solve this issue, liquid phase
micro extraction or ionic liquid micro extraction started to evolve43, 44. Ionic liquids have an
ideal role to play when used as the extracting solvent in microextraction due to their physico-
chemical properties and unique selectivity. Ionic liquid submerged single drop microextraction
(IL-SSDME) involves liquid phase microextraction in direct immersion mode45, 46. Here a single
drop of ionic liquid is dispersed in the medium from which the analyte has to be extracted. After
the extraction, the layers are allowed to separate . Ionic liquid static headspace single drop
microextraction (IL-SHSSDME) involves suspending the single drop of the ionic liquid in the
headspace47, 48 In both cases, after the extraction is completed, the ionic liquid is retracted into a
syringe and introduced into analytical instruments like GC or HPLC for the qualitative and/or
quantitative screening of analytes. Experiments involving exhaustive dynamic headspace
microextraction (IL-DHME) have also been reported49. In this case , the extracting solvent ionic

59
liquid is used as a trap by purging with the vapors of the analyte. Since this extraction method
involves the motion of the phases, it is termed as dynamic headspace microextraction. There are
also several modified forms of ionic liquid based microextractions reported recently50, 51, 52.
Other Analytical Applications:
Ionic liquids are finding diverse application in various fields of analytical chemistry. The
following section discuses their applications in detail.
Solid phase microextraction
Solid-phase microextraction (SPME) is a fast, solventless alternative to conventional liquid
phase extraction. It integrates sampling, extraction, concentration and introduction to
chromatography into a single solvent-free step. A SPME method using a disposable IL coating
was developed to quantitatively analyze benzene, toluene, ethylbenzene, xylene in paints53 . This
coating material has some obvious advantages: lower cost, minimum carryover, and comparable
reproducibility to commercial fibers. The partitioning behavior of different types of compounds
in IL-aggregates coated on SPME was studied, and monocationic ILs generally provided higher
extraction power than dicationic analogues. Polymeric imidazolium-based IL coatings were
synthesized and applied to extract esters54 . This type of coating showed high thermal stability,
long lifetimes, and provided good analyte recoveries, comparable to those using
polydimethylsiloxane fibers. Recently, two new ILs, which contained styrene units, were used to
prepare silica-bonded polymeric SPME adsorbents55 . These SPME fibers can work successfully
in both the headspace mode and immersion mode.

60
Solvent for headspace GC
Headspace GC avoids direct liquid or solid probing and greatly decreases matrix interference.
One acidic, one basic, and one neutral compound were dissolved in different ILs with
appropriate acidity and basicity 56. They were detected by headspace GC and their detection
limits were in the low ppm level. Residual solvents (acetonitrile, dichloromethane, N-methyl-2-
pyrrolidone, toluene, DMF, and n-butyl ether) in pharmaceuticals were determined by headspace
GC using 1-butyl-3-methylimidazolium BF4 ([BMIM][BF4]) as the solvent57. These analytes
have relative low volatility (boiling point >150 ◦C), so higher temperature headspace procedure
is necessary. Due to its good thermal stability, [BMIM][BF4] worked, exceedingly well and
gave better sensitivity than DMSO as the solvent.
Thin layer chromatography
Most recent TLC stationary phases use silica gel as the solid support. The silica surface has
residual acidic silanol groups, which have deleterious effects on separations. For example,
unsymmetric (tailing), broad peaks are observed, especially for basic analytes. Therefore, amine
additives are often added to block the acidic surface and ameliorate these effects. ILs, with
proton acceptor properties, provide the potential for this application. Kaliszan et al. 58 first
reported that IL additives in the mobile phase suppressed free silanol effects on the retention of
basic drug compounds in TLC. Eight basic compounds were not moved from the application spot
either on the bare silica or on the octadecylsilica plates using acetonitrile eluent. Traditional
amine additives (triethylamine, dimethyloctylamine, and ammonia) could not completely
suppress the effect of free silanols. The tested ILs were imidazolium BF4 types (1-ethyl-3-
methylimidazolium [EMIM], 1-methyl-3- hexylimidazolium, and 1-hexyl-3-

61
heptyloxymethylimidazolium tetrafluoroborate). ILs decreased the retention of basic analytes
more effectively than other alkylamines.
Addition of ILs to the mobile phase in column-based LC separations could be traced to a
publication in 1986 59 , which reported ILs used as organic modifiers. Alkylammonium nitrate or
thiocyanate salt was mixed with another solvent of low viscosity and used as the mobile phase.
Later, the same group conducted detailed studies on the solvent properties of six ILs used in
microcolumn RPLC. They found that the solvent selectivities were controlled by proton
acceptor–donor and weak dispersive interactions, influenced by the cation size and the nature of
the IL anions. 60
LC stationary phases
More recently, development of new LC stationary phases based on ILs received greater attention.
Liu et al. are among the first to examine this application61. They synthesized anion
exchange stationary phases with immobilized imidazolium-based ILs62, 63. The new columns
successfully separated anions, amines, and nucleotides, and they exhibited both a strong anion
exchange character and a reversed phase interaction.
Capillary electrophoresis
CE has become a powerful separation technique in recent years due to low sample and reagent
consumption, high efficiency and simplicity. Generally fused-silica capillaries are used for CE,
and silanol groups on the inner surface are normally negatively charged. This results in the
formation of an electroosmotic flow (EOF). Also, the inner capillary surface could participate in

62
interacting with analytes, further affecting separations. The capillary surface could be chemically
modified to reverse EOF when cationic ions absorb or bond to the inner surface. Several groups
reported that ILs were covalently bonded to the capillary wall to modify the surface 64,65. A 1-
methylimidazoliumbased IL was covalently bonded to a fused-silica capillary surface
to reverse the EOF 66.
MALDI matrices
MALDI (matrix-assisted laser desorption ionization) is a soft ionization technique for mass
spectrometry, which allows detection of intact, large biomolecules, and synthetic polymers. The
analyte is dissolved in a volatile solvent containing the matrix and then spotted on the MALDI
plate. The matrix plays a key role in this technique in preventing analyte molecules from being
destroyed by direct laser energy absorption and facilitating their volatilization and ionization.
Matrix selection is crucial in MALDI-MS analysis. An ideal matrix should possess the following
properties: absorption at the laser wavelength, capabilities of dissolving or cocrystalizing with
the sample, low volatility, suppressing analyte decompositions, and promoting the ionization of
analytes. The unique properties of ILs (low volatility and wide solubility with various types of
compounds), make them suitable for working as MALDI matrixes. Armstrong et al. first
developed effective ILs as MALDI matrixes67. Typical imidazolium, pyridinium
and phosphonium ILs were ineffective matrixes as they did not adequately promote the
ionization of the sample. When ILs were formulated using anions of popular solid matrixes and
specific prononated cations, then peptides, proteins and polyethylene glycol could be detected
with high sensitivity and good reproducibility. 68

63
Chapter 2: Retention of alkanes and aromatic hydrocarbons on ionic liquid stationary
phases

64
Introduction
Ionic liquid is a salt similar to sodium chloride. The former is a liquid ionic species due to the
bulky anion while the latter is a crystalline solid. Due to the combination of anions, cations and
the linkage groups, ionic liquids have unique selectivity for analytes. Molten salts were used as
gas chromatographic stationary phase in 1959 by Barber etal.69 However useful chromatographic
performance and selectivity of ionic liquid as gas chromatographic stationary phase was first
demonstrated by Poole etal in 1982.70 Using packed gas chromatographic columns, attempts
were made to find if the retention in ionic liquid columns followed a partition or adsorption
mechanism for particular analyte by Poole’s group. Referring to Figure 13 in Chapter1, a plot of
net retention volume versus inverse of the volume of liquid phase per gram of packing generates
a linear plot with zero slope when partition predominated and showed positive slope when
adsorption mechanism predominates.67 Another approach shown by Poole was to plot net
retention volume per gram of stationary phase against percentage loading of the stationary phase.
The plot gave a positive intercept with negligible change in retention volume when extrapolated
to zero, when adsorption mechanism was followed. However if there was a linear increase in net
retention with increase of the phase loading, partition would predominate.71, 72 This observation
is consistent with the view that adsorption at support-liquid interface is dominant for phases of
low polarity and at the gas liquid interface for polar phases. Usually non polar compounds are
retained on polar stationary phases by interfacial adsorption indicating that gas liquid partition is
of minor importance for retention.
The physico- chemical properties of ionic liquids are favorable for coating them as a liquid film
in capillary gas chromatographic. The analogy of liquid-liquid extraction, where the partition

65
coefficient remains the same at a particular temperature irrespective of the phase volumes of the
acceptor and donor phase, can be applied to the gas chromatographic separation. In the present
work, a simpler approach was adopted to predict the predominant mechanism of retention of
probe analytes on commercially available ionic liquid stationary phases. Thus considering
chromatographic separation as an equilibrium process, the thermodynamic parameter Kc was
compared for ionic liquid stationary phase with different column length, internal diameter and
phase ratio. If partitioning of the analytes between liquid and vapor phase is the dominant
mechanism then the Kc would not vary with column length, internal diameter and phase ratio. If
the Kc varies with column length, internal diameter and phase ratio, then adsorption mechanism
dominates the retention process.
The biggest advantage of ionic liquid stationary phases are the high selectivity, thermal stability
and longer liquid temperature range. While a conventional polar polymeric polyethylene glycol
stationary phase has the upper temperature limit of 2800 C, the ionic liquid stationary phase
claimed to have similar polarity can go up to 3000 C 73. Commercially available 1,2,3-tris(2-
cyanoethoxy)propane based stationary phase(TCEP) also called as Mc Nair’s Stationary phase
has its upper temperature limit is 1400 C. How ever the extremely polar ionic liquid column
SLB-IL 111 can go upto 2700 C.73 This feature is extremely useful, allowing chromatographers to
analyze high boiling components at higher temperature without decomposing the stationary
phase. Ionic liquids are gaining more applications in multi dimensional chromatography.
Experiments using Ionic liquid stationary phase as secondary column or primary column are
gaining popularity.74, 75, 76 Separation of fatty acid methyl esters, polar and nonpolar mixtures,
66
polycyclic aromatic hydrocarbons77, in the analysis of flavors and fragrance compounds78 and
chiral separation.79
The ionic liquid stationary phases that are commercially available, exclusively from Supelco-
Sigma Aldrich, are assigned a polarity number based on the Mc Reynolds constant73. The
detailed description of polarity index calculation is explained in Chapter 1. To calculate the
polarity index , the ΔI value for Benzene, n-Butanol, 2-Pentanone, Nitropropane and Pyridine
were used as the probe analytes. The sum of ΔI values for the probe analytes were calculated.
Then the sum of ΔI was normalized against the sum of ΔI of SPB-Octyl column to get the
polarity number. Based on the calculated polarity number, the commercially available ionic
liquid stationary phases are ranked from polar to extremely polar (polarity number 59 to 111).
The principle used for calculation of polarity number for conventional polymeric column is
applied by Supelco to the ionic liquid columns. More rigorously, it would be worthy to account
for the retention features of these columns in terms of the thermodynamic parameters including
Kc, ΔH, ΔS.
Objective of the experiment
The key objectives of the study are shown in Figure 16, which included the determination of
thermodynamic parameters of retention of alkanes and aromatic hydrocarbons on commercially
available ionic liquid stationary phases. The Vant’ Hoff plots were constructed for alkanes and
aromatic hydrocarbons (refer Chapter1, page 24). From the slope and intercept of the Van’t Hoff
plot, ΔH and ΔS were determined. From these thermodynamic parameters, the predominant
mechanism of retention was explored.

67
Figure 16 : The schematic representation of the objective of the experiment.
The thermodynamic parameters of retention for same ionic liquid stationary phase with different
column length were compared to predict if the retention followed partition or adsorption of
analytes. The Thermodynamic parameters of retention of conventional polyethyleneglycol based
stationary phase was compared with the ionic liquid stationary phase claimed to have similar
polarity.The -∆G value of analytes on different ionic liquid stationary phases were correlated to
their structure to see their relationship to the alkyl groups in the linkage group. The same study
was made based on the depicted polarity. This gave an insight of the ambiguity in the claimed
polarity number of these columns.
Ionic liquid stationary phases
Determination of thermodynamic
parameter
Predicting the predominant mechanism
Comparing polyethylene glycol stationary phase to
Ionic liquid stationary phase
Examining the meaning of polarity index

68
Experimental
Materials and Chemicals
Nonane, decane, undecane, dodecane, tridecane, tetradecane ,benzene, toluene, ethylbenzene,
butylbenzene, hexylbenzene, heptylebenzene, hexane, supelcowax-10 with dimensions 30 m,
0.25 mm, 0.25 µm were purchased from Supelco Sigma-Aldrich . The ionic liquid stationary
phase SLB-IL 59, SLB-IL 60, SLB-IL 61 and SLB-IL 100 having dimensions 30 m , 0.25 mm,
0.20 µm and SLB-IL 100 with dimensions 15 m , 0.10 mm, 0.08 µm were provided by Sigma-
Aldrich . The aromatic hydrocarbons analysis was performed on Agilent GC 6890 coupled to
5973 MS detector system (Agilent Technologies, Palo Alto, CA, USA) equipped with CTC
Analytics CombiPal autosampler (Zwingen, Switzerland) while the analysis of alkanes were
performed in HP-5890 GC with flame ionization detector (GC-FID).
GC-FID and GC-MS parameters
The retention of alkanes were studied using GC-FID. Since the literature showed evidence of
change in selectivity for aromatic hydrocarbons73, the retention of aromatic hydrocarbons were
studied using GC- MS to be certain about the elution order . Based on the experiment performed,
a particular column was installed in the chromatographic system. The inlet temperature was
maintained at 250 0C. The inlet was maintained at constant pressure with linear velocity of 14 cm
sec-1. The split ratio was set as 50:1. The injection volume was 1 µL. The isothermal runs were
performed at 40 0C (313 K), 45 0C (318 K), 50 0C up to 80 0C (353K). For the flame ionization
detector, the detector temperature was set as 250 0C. The hydrogen and air flow were set as 30
mL min-1 and 300 mL min-1, respectively. For the MS, transfer line temperature, source and
69
quard temperature was set at 250 0C, 150 0C and 250 0C respectively. The MS was operated at 70
eV in scan mode from mass range 50 m/z to 500 m/z.
Standard preparation
The diluting solvent for working standard solution was hexane. 0.01% of nonane, decane,
undecane, dodecane, tridecane and tetradecane were prepared in hexane and was named as
alkanes working standard. The aromatic hydrocarbon working standard was prepared by mixing
0.01% of benzene, toluene, ethyl benzene, butylbenzene, hexylbenzene and heptylbenzene in
hexane. 1±0.1 µL of the working standards were injected into the chromatographic system.
After each run the syringe was cleaned with hexane five times.
Experimental
Retention of alkanes and aromatic hydrocarbons on ionic liquid stationary phase
A summary of the column chosen for particular experiment is summarized in Table 3. To study
the retention of alkanes and aromatic hydrocarbons on ionic liquid stationary phase, the
respective working standards were injected at isothermal oven temperature using a SLB-IL 100
stationary phases having dimension 30 m, 0.25 mm, 0.20 µm and SLB-IL 100, SLB-IL 111 and
SLB-IL 82 having dimensions 15 m , 0.10 mm, 0.08 µm respectively. To compare the retention
of alkanes on polyethylene glycol stationary phase, SLB-IL 59 and SLB-IL 60, Supelco wax10
column having dimensions 30 m, 0.25 mm, 0.25 µm was installed in the GC oven and the
alkanes working standard was injected at each isothermal temperature. The same experiment
was repeated using SLB-IL 59, SLB-IL 60 having dimensions 30 m, 0.25 mm, 0.20 µm. In all

70
the case the hold up (t0) time was considered as the time at which the diluting solvent started to
eluted.
Table 3: Columns choosen for the study and experiments performed
Column, Dimension Dimensions Objectives of the experiment
SLB-IL 100 30 m, 0.25 mm, 0.20 µm Retention of alkanes and
aromatic hydrocarbons 15 m , 0.10 mm, 0.08 µm.
SLB-IL 111, SLB-IL 100,
SLB-IL 82
15 m , 0.10 mm, 0.08 µm. Correlation of structure of
ionic liquid to the retention of
alkanes
SLB-IL 59, SLB-IL 60 30 m, 0.25 mm, 0.20 µm. Comparison of polyethylene
glycol column and IL having
similar polarity
Stabile Wax- 10 30 m, 0.25 mm, 0.25 µm
Van’t Hoff plot and statistical validation of the data
The retention time of the peaks at each temperature was determined from the chromatogram of
isothermal runs. From the retention time, and the holdup time t0, k was calculated using
Equation 2, plugging the k value into Equation 1(Chapter 1) gave the Kc. A plot of ln Kc vs 1/T
(kelvin-1) was plotted for all the above experiments. The plot was examined for linear behavior.
The residue of the least square regression was examined for a linear trend. From the slope and y-
intercept ΔH, ΔS were calculated. The error in slope and intercept at 95% confidence interval
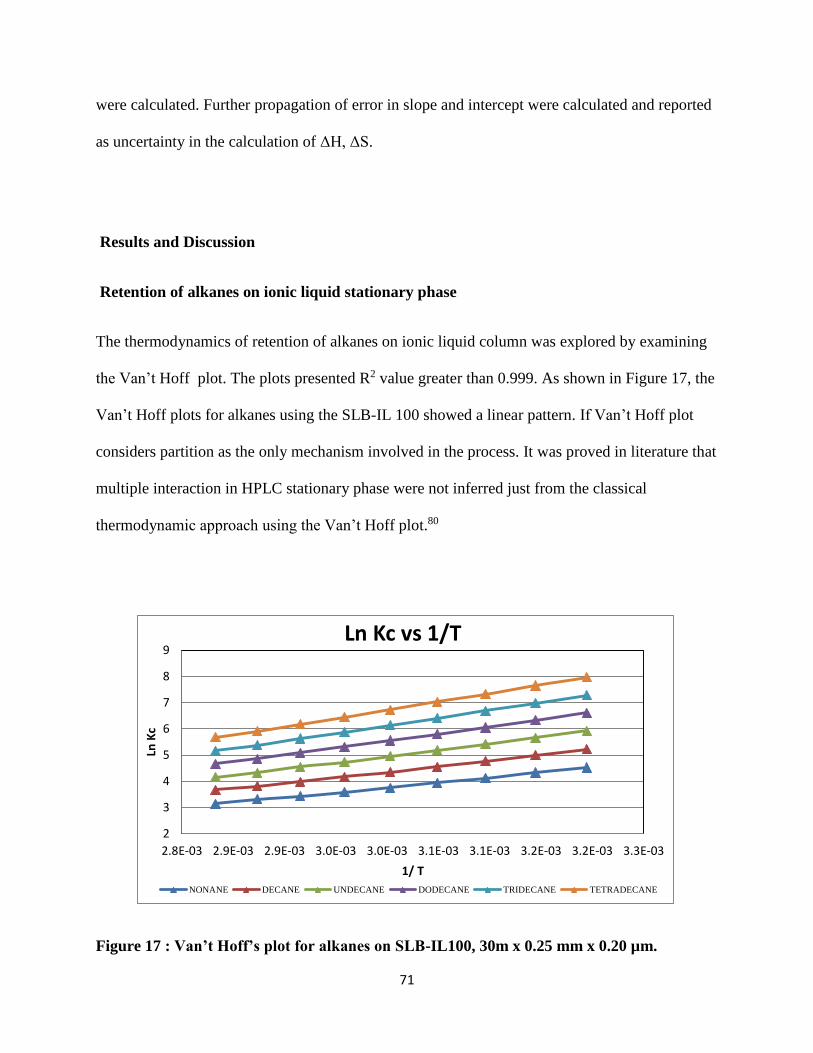
71
were calculated. Further propagation of error in slope and intercept were calculated and reported
as uncertainty in the calculation of ΔH, ΔS.
Results and Discussion
Retention of alkanes on ionic liquid stationary phase
The thermodynamics of retention of alkanes on ionic liquid column was explored by examining
the Van’t Hoff plot. The plots presented R2 value greater than 0.999. As shown in Figure 17, the
Van’t Hoff plots for alkanes using the SLB-IL 100 showed a linear pattern. If Van’t Hoff plot
considers partition as the only mechanism involved in the process. It was proved in literature that
multiple interaction in HPLC stationary phase were not inferred just from the classical
thermodynamic approach using the Van’t Hoff plot.80
Figure 17 : Van’t Hoff’s plot for alkanes on SLB-IL100, 30m x 0.25 mm x 0.20 µm.
2
3
4
5
6
7
8
9
2.8E-03 2.9E-03 2.9E-03 3.0E-03 3.0E-03 3.1E-03 3.1E-03 3.2E-03 3.2E-03 3.3E-03
Ln K
c
1/ T
Ln Kc vs 1/T
NONANE DECANE UNDECANE DODECANE TRIDECANE TETRADECANE
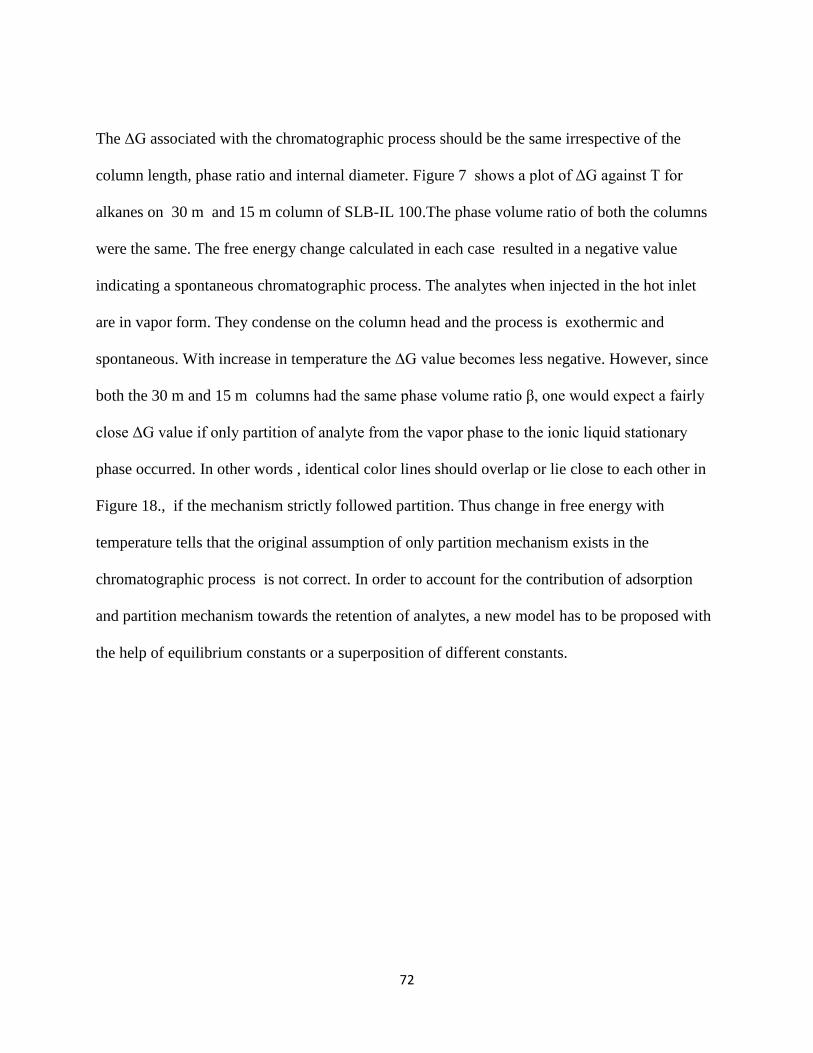
72
The ΔG associated with the chromatographic process should be the same irrespective of the
column length, phase ratio and internal diameter. Figure 7 shows a plot of ΔG against T for
alkanes on 30 m and 15 m column of SLB-IL 100.The phase volume ratio of both the columns
were the same. The free energy change calculated in each case resulted in a negative value
indicating a spontaneous chromatographic process. The analytes when injected in the hot inlet
are in vapor form. They condense on the column head and the process is exothermic and
spontaneous. With increase in temperature the ΔG value becomes less negative. However, since
both the 30 m and 15 m columns had the same phase volume ratio β, one would expect a fairly
close ΔG value if only partition of analyte from the vapor phase to the ionic liquid stationary
phase occurred. In other words , identical color lines should overlap or lie close to each other in
Figure 18., if the mechanism strictly followed partition. Thus change in free energy with
temperature tells that the original assumption of only partition mechanism exists in the
chromatographic process is not correct. In order to account for the contribution of adsorption
and partition mechanism towards the retention of analytes, a new model has to be proposed with
the help of equilibrium constants or a superposition of different constants.

73
Figure 18: Comparison of ΔG vs T for alkanes on SLB-IL100 : 30 m and 15 m column.
The linear free energy relationship was also observed for alkanes with increase in carbon chain.
The vertical lines in Figure 18 signifies that the ΔG had a linear relationship with the number of
carbons in the alkyl chain (from Nonane to Tetradecane).
In Table 4, the difference in ΔG value between a 30 m and a 15 m SLB-IL 100 stationary phase
for retention of alkanes are reported. The ΔG value increased with increase in the carbon chain
and increased with decrease in temperature. This is clear from the table that the ΔΔG value are
increasing towards the bottom right corner. This means that the thermodynamic property ΔG is
different for higher alkanes in the homologous series.
-23
-21
-19
-17
-15
-13
-11
-9
-7
310 315 320 325 330 335 340 345 350 355
ΔG
T
ΔG vs T
NONANE 30 m DECANE 30 m UNDECANE 30 mDODECANE 30 m TRIDECANE 30 m TETRADECANE 30 mNonane 15 m Decane 15 m Undecane 15 mDodecane 15 m Tridecane 15 m Tetradecane 15 m
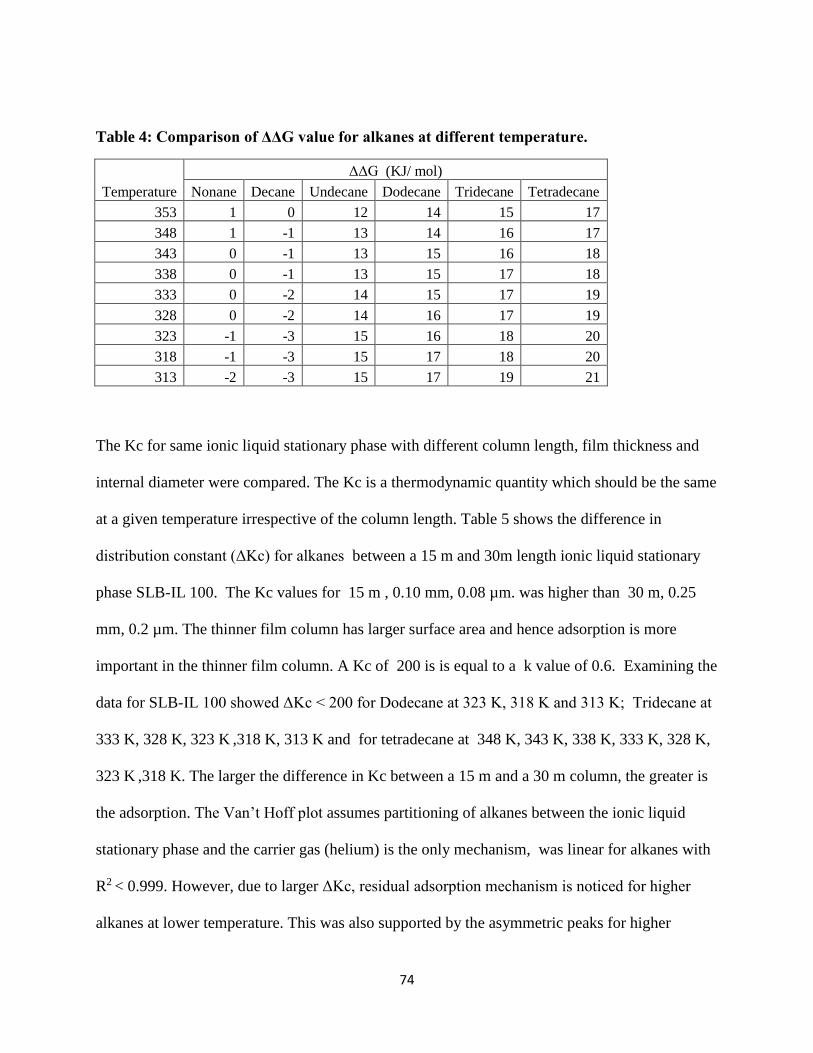
74
Table 4: Comparison of ΔΔG value for alkanes at different temperature.
Temperature
ΔΔG (KJ/ mol)
Nonane Decane Undecane Dodecane Tridecane Tetradecane
353 1 0 12 14 15 17
348 1 -1 13 14 16 17
343 0 -1 13 15 16 18
338 0 -1 13 15 17 18
333 0 -2 14 15 17 19
328 0 -2 14 16 17 19
323 -1 -3 15 16 18 20
318 -1 -3 15 17 18 20
313 -2 -3 15 17 19 21
The Kc for same ionic liquid stationary phase with different column length, film thickness and
internal diameter were compared. The Kc is a thermodynamic quantity which should be the same
at a given temperature irrespective of the column length. Table 5 shows the difference in
distribution constant (ΔKc) for alkanes between a 15 m and 30m length ionic liquid stationary
phase SLB-IL 100. The Kc values for 15 m , 0.10 mm, 0.08 µm. was higher than 30 m, 0.25
mm, 0.2 µm. The thinner film column has larger surface area and hence adsorption is more
important in the thinner film column. A Kc of 200 is is equal to a k value of 0.6. Examining the
data for SLB-IL 100 showed ΔKc < 200 for Dodecane at 323 K, 318 K and 313 K; Tridecane at
333 K, 328 K, 323 K ,318 K, 313 K and for tetradecane at 348 K, 343 K, 338 K, 333 K, 328 K,
323 K ,318 K. The larger the difference in Kc between a 15 m and a 30 m column, the greater is
the adsorption. The Van’t Hoff plot assumes partitioning of alkanes between the ionic liquid
stationary phase and the carrier gas (helium) is the only mechanism, was linear for alkanes with
R2 < 0.999. However, due to larger ΔKc, residual adsorption mechanism is noticed for higher
alkanes at lower temperature. This was also supported by the asymmetric peaks for higher

75
alkanes at lower temperature. With higher carbon chains, the mechanism tends towards
adsorption and partition.
Table 5: Difference in Kc for alkanes between 15m and 30 m SLB-IL 100 stationary phase
T (K) *
ΔKC **
Nonane Decane Undecane Dodecane Tridecane Tetradecane
353 17±1 26±1 43±1 68±2 111±2 180±4
348 20±1 31±1 51±1 83±2 137±3 228±5
343 22±1 37±1 62±2 104±2 176±4 298±7
338 25±1 44±2 75±2 130±3 224±5 389±9
333 30±1 53±2 93±3 164±4 289±6 513±11
328 35±2 64±2 116±3 210±5 379±8 687±15
323 43±2 79±3 147±4 273±7 503±11 933±21
318 52±3 100±3 190±5 359±9 677±15 1286±29
313 66±3 128±4 248±7 480±11 925±20 1800±40
* GC oven temperature in Kelvin
** Difference in Kc for aromatic hydrocarbons between 15m and 30 m column
Retention of aromatic hydrocarbons on ionic liquid stationary phase
The Van’t Hoff’s plot for aromatic hydrocarbons on SLB-IL 100 showed R2 > 0.995 . Table 6
shows the comparison of the ΔKc of aromatic hydrocarbons on SLB-IL 100 15 m , 0.10 mm,
0.08 µm and 30 m, 0.25 mm, 0.20 µm .

76
Table 6: Difference in Kc for aromatic hydrocarbons between 15m and 30 m SLB-IL 100
stationary phase
T
*(K)
ΔKC **
Benzene Toluene Ethylbenzene Butylbenzene Hexylbenzene Heptylbenzene
353 19±3 41±17 66±2 179±4 492±11 831±13
348 28±3 53±20 80±2 221±5 646±14 1124±17
343 31±4 59±24 98±2 274±6 839±18 1471±22
338 33±4 67±29 113±3 344±8 1090±24 1961±30
333 36±5 75±35 131±3 422±10 1407±32 2594±40
328 40±6 172±29 159±4 527±13 1835±42 3479±55
323 49±7 204±37 200±5 690±16 2506±57 4857±75
318 59±8 135±64 240±6 876±22 3366±78 NA ***
313 70±10 172±79 301±8 1144±29 4486±108 NA ***
* GC oven temperature in Kelvin
** Difference in Kc for aromatic hydrocarbons between 30m and 15 m column
*** Not analyzed
The ΔKc is much higher for aromatic hydrocarbons when compared to alkanes using the same
column. The ΔKc was greater than 200 for toluene at 323 K, ethylbenzene at 323 K, 318K , 313
K; butyl benzene at 348 K, 343 K, 338 K, 333 K, 323 K, 318K , 313 K; hexyl and heptylbenzene
at 353 K, 348 K, 343 K, 338 K, 333 K, 323 K, 318K , 313 K. Thus the adsorption is more
pronounced for the retention of aromatic hydrocarbons on SLB-IL 100. column. Table 7 shows
the comparison of difference in ΔG between a 30 m and 15 m stationary phase for aromatic

77
hydrocarbons. Here too the right hand side of the table shows larger ΔΔG signifying a
significant amount adsorption along with the dominant partition mechanism.
Table 7: Comparison of ΔΔG of aromatic hydrocarbons at different temperature.
Temperature
ΔΔG (KJ /mol)
Benzene Toluene
Ethyl
Benzene Butyl Benzene
Hexyl
Benzene Heptyl Benzene
353 1 3 4 7 9 11
348 1 3 4 7 10 11
343 2 3 5 7 10 12
338 2 4 5 8 11 12
333 2 4 5 8 11 13
328 2 4 5 8 12 13
323 2 4 6 9 12 14
318 3 5 6 9 13 NA*
313 3 5 6 10 13 NA* * Not analyzed as these peaks were expected to elute with run time more than 60 min.
With reference to the structure of the ionic liquid used in SLB-IL-100 , there are multiple
interactions between the analyte and the ionic liquid. The π -electron cloud of the probe aromatic
hydrocarbons can interact with the two cations and the alkane chain with the linkage group of the
ionic liquid (Figure 11, Chapter 1). Thus multiple interaction of analytes is very well
demonstrated. This is supported by a change in the selectivity for alkanes and aromatic
hydrocarbons with increase in temperature as reported earlier by the column manufacturer.73
However all our experiments were performed at isothermal temperature, separately for alkanes
and aromatic hydrocarbons at optimum linear velocity to avoid misinterpretation of peak elution
order. No cross-over in Van’t Hoff plot was observed at the chosen temperature within the
homologous series. This signified that the cross over and the mechanism of the multiple

78
interaction was influenced by the temperature and linear velocity of carrier gas. In other words,
the ionic liquid used in SLB-IL 100 interacts differently with analytes at different temperature.
Correlation of structure to retention
Recently the structure of few of the ionic liquid stationary phase were revealed by Supelco.105
The structure of ionic liquid SLB-IL 82, SLB-IL 100 and SLB-IL 111 are shown in Figure 19
which were very similar in structure. SLB-IL82 and SLB-IL 100 differed only with respect to the
number of carbons in the linkage chain . While SLB-IL 100 differed in the number of carbons in
the linkage group and the vinyl group attached to the cation, instead of the methyl groups at1,3
position in SLB-IL 82 and SLB-IL 111. The free energy changes associated with the
chromatographic process for the retention of alkanes on these three ionic liquid stationary phase
were determined.
The linkage group had 5 carbons for SLB-IL 111, 9 carbon chain for SLB-IL 100 and 12 carbons
for SLB-IL 82. In general, a plot of ΔG against number of carbons in the analyte is linear.4 The
ΔG of alkanes should be related to the number of carbon chain in the ionic liquid linearly if the
retention of alkanes are controlled only by the linkage group in the ionic liquid. So the
thermodynamic parameter ΔG for alkanes were compared with the number of carbons in the
linkage group. Referring Table 8, the R2 values were greater than 0.999 for the correlation of
ΔG and number of carbons in the linkage group of the ionic liquid. There was linear relationship
between the number of carbons in the linkage group and the ΔG and the retention of alkanes in
all the three columns were controlled by the length of the carbon chain only. With reference to

79
Figure 19: Structure of ionic liquid stationary phase SLB-IL 100, SLB-L 111, SLB-IL 82,
adopted from reference 105.
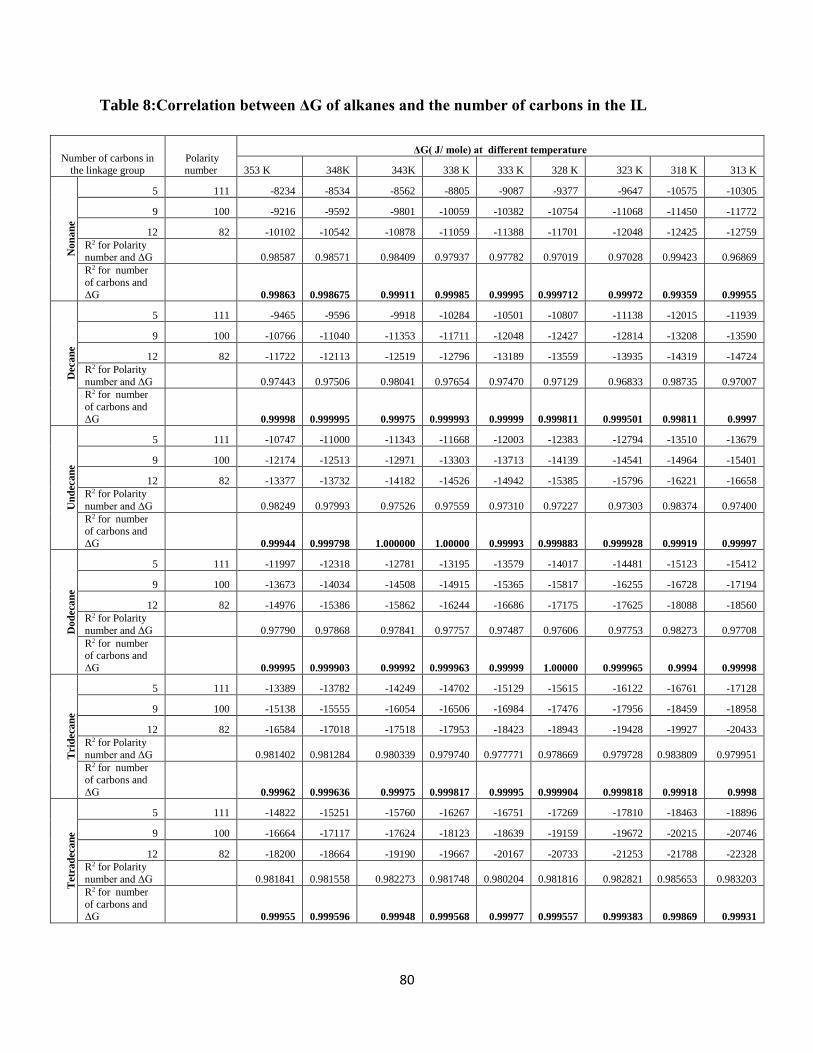
80
Table 8:Correlation between ΔG of alkanes and the number of carbons in the IL
Number of carbons in the linkage group
Polarity number
ΔG( J/ mole) at different temperature
353 K 348K 343K 338 K 333 K 328 K 323 K 318 K 313 K
No
na
ne
5 111 -8234 -8534 -8562 -8805 -9087 -9377 -9647 -10575 -10305
9 100 -9216 -9592 -9801 -10059 -10382 -10754 -11068 -11450 -11772
12 82 -10102 -10542 -10878 -11059 -11388 -11701 -12048 -12425 -12759
R2 for Polarity number and ΔG 0.98587 0.98571 0.98409 0.97937 0.97782 0.97019 0.97028 0.99423 0.96869
R2 for number
of carbons and
ΔG 0.99863 0.998675 0.99911 0.99985 0.99995 0.999712 0.99972 0.99359 0.99955
Deca
ne
5 111 -9465 -9596 -9918 -10284 -10501 -10807 -11138 -12015 -11939
9 100 -10766 -11040 -11353 -11711 -12048 -12427 -12814 -13208 -13590
12 82 -11722 -12113 -12519 -12796 -13189 -13559 -13935 -14319 -14724
R2 for Polarity
number and ΔG 0.97443 0.97506 0.98041 0.97654 0.97470 0.97129 0.96833 0.98735 0.97007
R2 for number
of carbons and
ΔG 0.99998 0.999995 0.99975 0.999993 0.99999 0.999811 0.999501 0.99811 0.9997
Un
deca
ne
5 111 -10747 -11000 -11343 -11668 -12003 -12383 -12794 -13510 -13679
9 100 -12174 -12513 -12971 -13303 -13713 -14139 -14541 -14964 -15401
12 82 -13377 -13732 -14182 -14526 -14942 -15385 -15796 -16221 -16658
R2 for Polarity
number and ΔG 0.98249 0.97993 0.97526 0.97559 0.97310 0.97227 0.97303 0.98374 0.97400
R2 for number of carbons and
ΔG 0.99944 0.999798 1.000000 1.00000 0.99993 0.999883 0.999928 0.99919 0.99997
Do
deca
ne
5 111 -11997 -12318 -12781 -13195 -13579 -14017 -14481 -15123 -15412
9 100 -13673 -14034 -14508 -14915 -15365 -15817 -16255 -16728 -17194
12 82 -14976 -15386 -15862 -16244 -16686 -17175 -17625 -18088 -18560
R2 for Polarity
number and ΔG 0.97790 0.97868 0.97841 0.97757 0.97487 0.97606 0.97753 0.98273 0.97708
R2 for number of carbons and
ΔG 0.99995 0.999903 0.99992 0.999963 0.99999 1.00000 0.999965 0.9994 0.99998
Trid
eca
ne
5 111 -13389 -13782 -14249 -14702 -15129 -15615 -16122 -16761 -17128
9 100 -15138 -15555 -16054 -16506 -16984 -17476 -17956 -18459 -18958
12 82 -16584 -17018 -17518 -17953 -18423 -18943 -19428 -19927 -20433
R2 for Polarity
number and ΔG 0.981402 0.981284 0.980339 0.979740 0.977771 0.978669 0.979728 0.983809 0.979951
R2 for number
of carbons and
ΔG 0.99962 0.999636 0.99975 0.999817 0.99995 0.999904 0.999818 0.99918 0.9998
Tetr
ad
eca
ne
5 111 -14822 -15251 -15760 -16267 -16751 -17269 -17810 -18463 -18896
9 100 -16664 -17117 -17624 -18123 -18639 -19159 -19672 -20215 -20746
12 82 -18200 -18664 -19190 -19667 -20167 -20733 -21253 -21788 -22328
R2 for Polarity
number and ΔG 0.981841 0.981558 0.982273 0.981748 0.980204 0.981816 0.982821 0.985653 0.983203
R2 for number
of carbons and ΔG 0.99955 0.999596 0.99948 0.999568 0.99977 0.999557 0.999383 0.99869 0.99931

81
Figure 19, the ionic liquid in SLB-IL 82, 100 and 111 has few difference in structure. The main
difference was the length of the linkage group. SLB-IL82 and SLB-IL 100 differed only with
respect to the number of carbons in the linkage chain . While SLB-IL 100 differed in the number
of carbons in the linkage group and the vinyl group attached to the cation, instead of the methyl
groups at1,3 position in SLB-IL 82 and SLB-IL 111. The major difference in structure was the
length of the linkage group that controlled the retention of alkanes on these ionic liquid
stationary phases. In other words the hydrophobic non bonded interaction of the linkage group in
the ionic liquid with that of the probe analytes (alkanes) chain was the contributing factor to the
retention. The R2 values were calculated for ΔG and the polarity number of the column and
they did not show a linear relationship. Since only three ionic liquids were commercially
available having similar structure, the type of non linear relationship between polarity number
and ΔG was not studied. The linear relationship between ΔG and carbons in linkage grouo and
non linear relationship between ΔG and polarity number signifies that the structure of the ionic
liquid is directly related to the retention and not the polarity number. The polarity number were
not a representation of the retention because they were calculated by Supelco Sigma Aldrich
(refer Figure 12 in Chapter 1) (1) by summing up the difference in Kovats retention index ΔI of
all the five probe analytes and normalizing against SPB-octyl column’s polarity number. (2)
SPB-octyl had negative ΔI value for n-Butanol which when summed up with other probe
analyte’s polarity value, causes an error. (3) For the SPB-octyl column polarity of 28 was
considered as polarity number 1. Due to these ambiguity in calculation, the polarity number or
the McReynold’s number is not a representative of the retention. Due to the summation of the
retention index of probe analytes and normalization against a non polar column the actual
interaction of each probe analyte used, is not related to the polarity number.

82
Comparison of Ionic liquid stationary phase with polyethyleneglycol stationary phase
Supelcowax-10 is a commercially available stationary phase bearing polyethyleneglycol
backbone. It is always compared with the SLB-IL 59 and SLB-IL 60 in terms of the polarity
number. It has been iterated by the manufacturer that SLB-IL 59 and SLB-IL 60 columns are
similar to Supelcowax-10. The polarity index number for Supelcowax-10 is predicted as 52 and
that for the SLB-IL 59 and SLB-IL 60 are 59 and 60 respectively. The detailed calculation of the
polarity number is provided by the column manufacture in reference 70. To understand the real
meaning of the claimed polarity number, a plot of -ΔH0 against polarity number and - ΔS0 against
polarity number (Figure 20, 21) were drawn. It was seen from Figure 20 that the - ΔH0 was
highest for SLB-IL 59 and lowest for SLB-IL 60 for all the alkane probe analytes. Thus no trend
Figure 20 : Comparison of –ΔH0 for alkanes on SUPELCOWAX, SLB-IL-59 and
SLB-IL 60
SUPELCO WAX 10
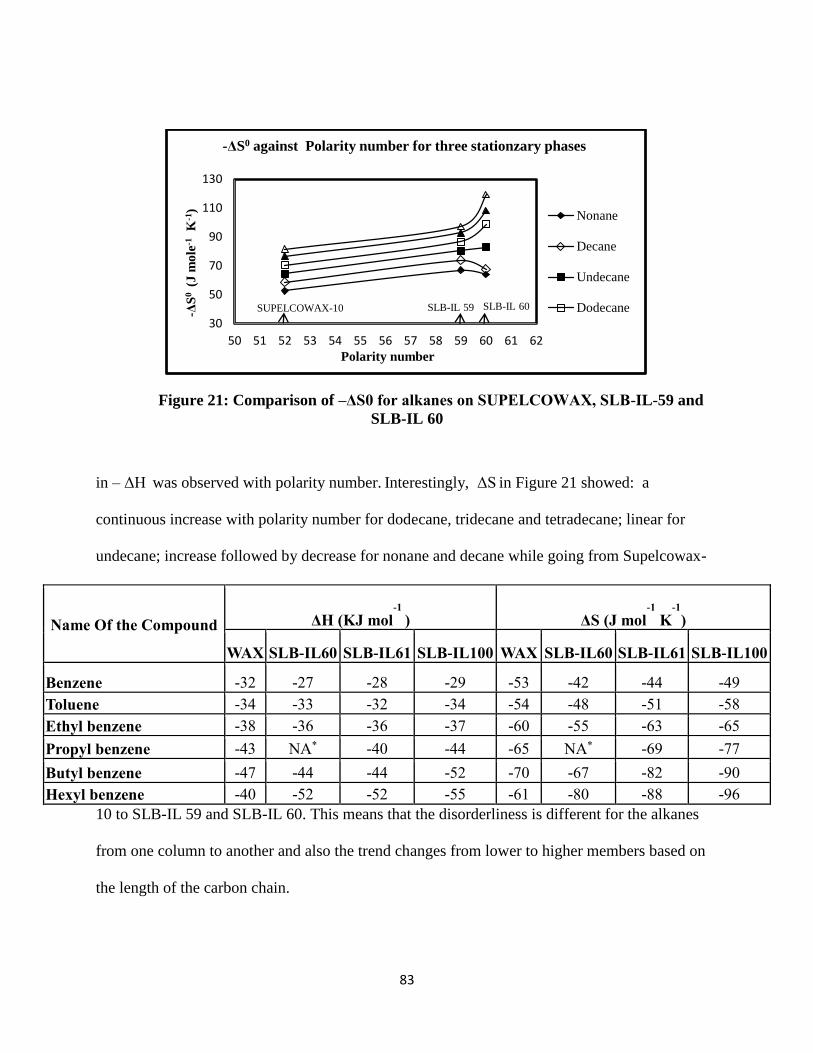
83
Figure 21: Comparison of –ΔS0 for alkanes on SUPELCOWAX, SLB-IL-59 and
SLB-IL 60
in – ΔH was observed with polarity number. Interestingly, ΔS in Figure 21 showed: a
continuous increase with polarity number for dodecane, tridecane and tetradecane; linear for
undecane; increase followed by decrease for nonane and decane while going from Supelcowax-
10 to SLB-IL 59 and SLB-IL 60. This means that the disorderliness is different for the alkanes
from one column to another and also the trend changes from lower to higher members based on
the length of the carbon chain.
30
50
70
90
110
130
50 51 52 53 54 55 56 57 58 59 60 61 62
-ΔS
0 (J
mo
le-1
K-1
)
Polarity number
-ΔS0 against Polarity number for three stationzary phases
Nonane
Decane
Undecane
DodecaneSUPELCOWAX-10 SLB-IL 59 SLB-IL 60
Name Of the Compound ΔH (KJ mol-1
) ΔS (J mol-1
K-1
)
WAX SLB-IL60 SLB-IL61 SLB-IL100 WAX SLB-IL60 SLB-IL61 SLB-IL100
Benzene -32 -27 -28 -29 -53 -42 -44 -49
Toluene -34 -33 -32 -34 -54 -48 -51 -58
Ethyl benzene -38 -36 -36 -37 -60 -55 -63 -65
Propyl benzene -43 NA* -40 -44 -65 NA* -69 -77
Butyl benzene -47 -44 -44 -52 -70 -67 -82 -90
Hexyl benzene -40 -52 -52 -55 -61 -80 -88 -96

84
The reason for observed trend Figure 21. is attributed to discrepancy (refer page 82) in the
model used for the calculation of polarity number. The five molecules used for the calculation of
Mc Reynold’s number were not representative of all possible interactions (24).
Table 9: Comparison of Ionic liquid stationary phase with polyethyleneglycol stationary
phase in terms of thermodynamic parameters.
* Not analyzed
A direct comparison of the retention of the thermodynamic parameters of ionic liquid stationary
phase with polyethyleneglycol based polymeric stationary phase was made for the retention of
aromatic hydrocarbons as shown in Table 6 . The ΔH values for Stabilewax-10, SLB-IL 60,
SLB-IL 61 were pretty close to each other while the ΔS for the homologous series differed very
much from that of Stabile wax-10. This exhibited the basic difference in the type of interactions
in an ionic liquid stationary phase to that in the polymeric polyethyleneglycol phase. In the
former case, there existed phenyl π-π interaction between the probe analyte and the ionic liquid
stationary phase, nonbonded interaction between the hydrocarbon chain of the aromatic
hydrocarbon and the linkage group of the ionic liquid. How ever the ΔH and ΔS of the stabile
wax 10, SLB-IL 60, SLB-IL 61 and SLB-IL 100 are similar. Considering that SLB-IL 100 is
very highly polar, it wouldn’t retain the higher members like butyl benzene and hexyl benzene to
the same extent like how the SLB-IL 60 does. In other words , deviation would be bigger for
compounds with longer hydrocarbon chain.
The consideration that the interaction of five probe analytes are additive, while calculating the
polaritry number is an over simplification. Normalization of the additive value with respect to
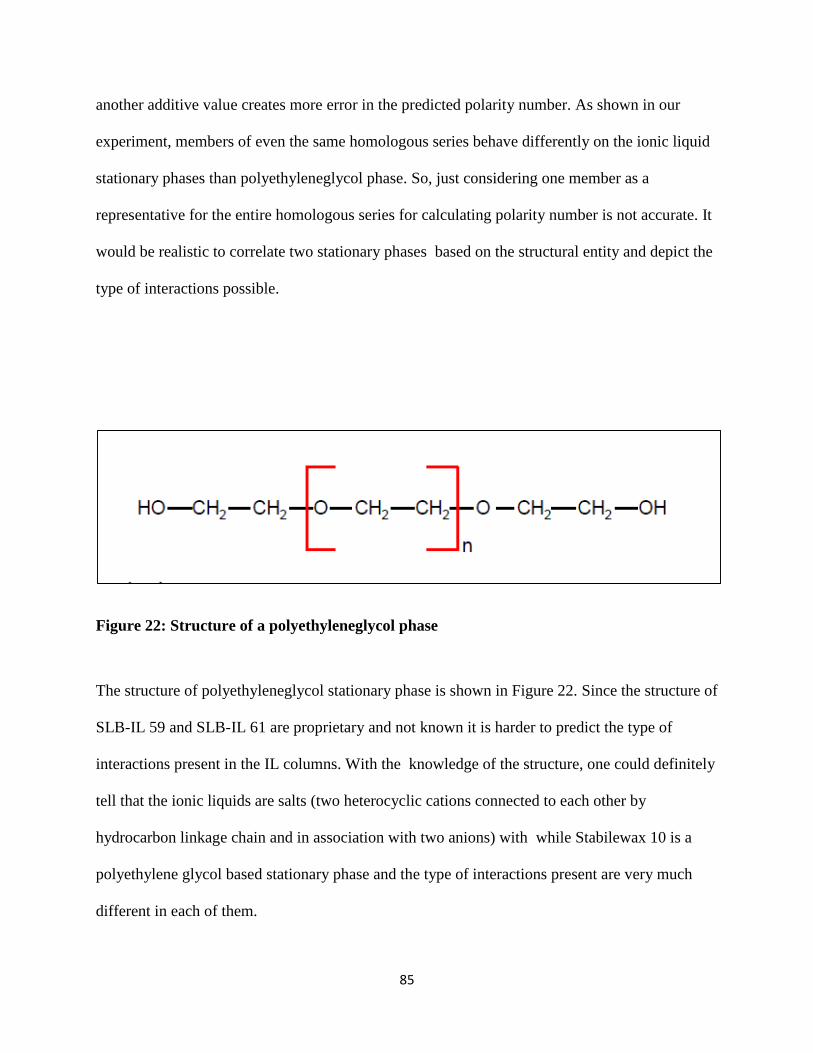
85
another additive value creates more error in the predicted polarity number. As shown in our
experiment, members of even the same homologous series behave differently on the ionic liquid
stationary phases than polyethyleneglycol phase. So, just considering one member as a
representative for the entire homologous series for calculating polarity number is not accurate. It
would be realistic to correlate two stationary phases based on the structural entity and depict the
type of interactions possible.
Figure 22: Structure of a polyethyleneglycol phase
The structure of polyethyleneglycol stationary phase is shown in Figure 22. Since the structure of
SLB-IL 59 and SLB-IL 61 are proprietary and not known it is harder to predict the type of
interactions present in the IL columns. With the knowledge of the structure, one could definitely
tell that the ionic liquids are salts (two heterocyclic cations connected to each other by
hydrocarbon linkage chain and in association with two anions) with while Stabilewax 10 is a
polyethylene glycol based stationary phase and the type of interactions present are very much
different in each of them.

86
Conclusions
Ionic liquid stationary phases are attractive alternatives to conventional polyethylene glycol
stationary phases. The distribution constant at different temperature were determined for alkanes
and aromatic hydrocarbons on commercially available ionic liquid stationary phases.
Thermodynamic parameters for the chromatographic process using ionic liquid stationary phase
were evaluated. The retention mechanism was predominantly partitioning for the alkanes. At
lower temperature, for higher member of alkanes in the homologous series, there was
considerable amount of adsorption along with the partition. The polarity number was not linearly
related to the ΔG for alkanes while it was linearly related to the length of the alkyl chain present
in the linkage group of the ionic liquid. For aromatic hydrocarbons, huge difference in Kc was
observed between 15 m and 30 m SLB-IL 100 stationary phase indicating mixed mechanism of
adsorption and partition. To exactly predict the contribution of each mechanism towards
retention of analytes, a new model has to be proposed. The retention of alkanes and aromatic
hydrocarbons on ionic liquid stationary phase were compared with polyethyleneglycol stationary
phase in terms of their polarity number. The ambiguity in the calculated polarity number was
established from the plot of thermodynamic parameters against the polarity number.

87
Chapter 3: Air as carrier gas using ionic liquid stationary phase

88
Introduction
The carrier gas plays an important role in the gas chromatographic retention process. In a gas
chromatographic system, the analytes get partitioned between the liquid film in the stationary
phase and the carrier gas which is the mobile phase. The carrier gas needs to be inert so that it
does not leach the stationary phase. The diffusion coefficient, purity of carrier gas, availability
are other parameters to be considered. The carrier gases that are used for GC analysis includes
helium, hydrogen and nitrogen. The choice of the carrier gas is also dependent on the type of
detector used. For example, ultra high pure nitrogen is used for electron capture detector and
helium/ hydrogen are used for mass detector. Nitrogen and helium are commonly used for flame
ionization detector. The decision to choose the right carrier gas is based on the Van Deemter
curve. Hydrogen and helium are lighter gases and suitable for fast GC analysis while nitrogen is
very cheap source. About 77% of the atmospheric air composition is nitrogen. The other major
gas is 20% oxygen. So if one considers air, it is predominantly composed of nitrogen. There are
not many attempts to use air as carrier gas in the literature81. The main reason is oxygen and
moisture that can leach the stationary phase and cause bleeding of column. The active hydroxyl
groups in the polyethyleneglycol based and polydimethylsiloxane based stationary phases are
succeptable to oxidation. Air, composed of 77% nitrogen , would be beneficial for analyzing
highly volatile gases under narrow temperature ranges where increasing stationary phase
interaction is desirable. Air when used as carrier gas would be very useful for field samples.
How ever, its application would be limited based on the type of detector used , analytes stability
to air.

89
Ionic liquid stationary phases are superior to conventional polymeric gas chromatographic
stationary phases for the following reasons: unique selectivity, thermal stability, no active
hydroxyl group in their structure. Commercially available ionic liquids have promises about their
stability to air and moisture. So they would be ideal candidate to study the effect of air as carrier
gas on retention. Attempts were made by Supelco- Sigma Aldrich to use air as carrier gas using
SLB-IL-59 as stationary phase. Their application note shows the stability of SLB-IL 59 using air
as carrier gas88. They have also compared its stability with polyethyleneglycol stationary phase
using air as carrier gas. Figure23 shows the stability of SLB-IL 59 using air as carrier gas. It was
seen that the peak shapes remained Gaussian even after 200 injections and no degradation of the
phase was noticed. They also compared it with polyethyleneglycol stationary phase which
started phase degradation during 100th injection and the stationary phase completely degraded by
200 injections.
Figure 23: Stability of SLB_IL 59 while using air as carrier gas adopted from Supelco-
Sigma Aldrich’s application note88

90
The thermodynamic and kinetic behavior of retention of analytes using air as carrier gas are not
explored to any depth in literature. In the present research, attempts were made to explore the
thermodynamics and kinetics of retention of aromatic hydrocarbons on ionic liquid stationary
phase.
Objective
The objective of the study was to use air as carrier gas and ionic liquid column SLB-IL 100 as
gas chromatographic stationary phase. The key objectives of the study are listed in Figure 11
which includes: the determination of thermodynamic parameters like ΔH, ΔS for the retention of
aromatic hydrocarbons on ionic liquid stationary phase SLB-IL-100 using air as carrier gas and
to compare the retention behavior in terms of thermodynamic parameters when helium is used as
carrier gas, studying the kinetics using air as carrier gas and explore its merits and demerits in
terms of Van Deemter’s plot and extending the application of air as carrier gas for separation of
o, m, p-xylene.
Figure 24: Objective of the analysis: Air as carrier gas using ionic liquid stationary phase
Ionic liquid stationary phase
Air as carrier gas
Thermodynamics
Kinetics
Separation of xylene isomers
91
Experimental
Materials and Chemicals
Benzene, toluene, ethylbenzene, butylbenzene, hexylbenzene, heptylebenzene, ortho, meta, para-
xylene, hexane were purchased from Supelco Sigma-Aldrich. The ionic liquid stationary phase
SLB-IL 100 was donated by Sigma-Aldrich.
GC-FID parameters
The aromatic hydrocarbons analysis using air, helium as were performed on GC-Flame
ionization detector (GC-FID), HP-5890 model. The ionic liquid stationary phase, SLB-IL 100
with dimensions 15 m, 0.10 mm, 0.08 µm was installed in the chromatographic system. For the
thermodynamic study, the inlet temperature was maintained at 250 0C. The split ratio was set as
1:50. The injection volume was 1 µL. The isothermal runs were performed at 40 0C (313 K), 45
0C (318 K), 50 0C upto 80 0C (353K) respectively. For the flame ionization detector, the detector
temperature was set as 250 0C. The hydrogen and air flow were set as 30 mL min-1 and 300 mL
min-1, the inlet was maintained at constant pressure with linear velocity of 14 cm sec-1.The
carrier gas was changed to helium and the same conditions were used for thermodynamic studies
using helium as carrier gas.
A kinetic study was performed using air as carrier gas. The inlet temperature was maintained at
250 0C. The split ratio was set as 1:50. The injection volume was 1 µL. The isothermal runs was
performed at 70 0C (343 K). For the flame ionization detector, the detector temperature was set
as 250 0C. The hydrogen and air flow were set as 30 mL min-1 and 300 mL min-1.The carrier gas

92
pressure mode was constant pressure mode and the experiments were run individually at 5, 8,
10, 15 and 20 cm/ sec.
For the separation of xylene isomers, the inlet temperature was maintained at 250 0C. The split
ratio was set as 1:50. The oven was set at 500C for 1 minute, 200C/min until 2400C with a final hold
time of 5 minutes. Air was used as the carrier gas at a constant inlet pressure . The injection volume
was 1 µL. For the flame ionization detector, the detector temperature was set as 250 0C. The
hydrogen and air flow were set as 30 mL min-1 and 300 mL min-1, the inlet was maintained at
Standard preparation
The thermodynamic and kinetic studies were performed using hexane as diluting solvent. The
aromatic hydrocarbon working standard was prepared by mixing 0.01% of benzene, toluene,
ethyl benzene, butylbenzene, hexylbenzene and heptylbenzene in hexane. Exactly 1±0.1 µL of
the working standards were injected in to the chromatographic system. After each run the syringe
was cleaned with hexane five times.
This working standard was used for the separation of xylene isomers consisted of 0.01%
benzene, benzene, toluene, ethyl benzene, butylbenzene, hexylbenzene and heptylbenzene, and
o, m, p-xylene in methanol.

93
Experiments performed
The thermodynamic parameters of retention were calculated by finding the Kc values at various
temperature using helium and air as carrier gas respectively. A Van’t Hoff’s plot was drawn for
each aromatic hydrocarbon using helium and air as carrier gases and the thermodynamic
parameters ΔH and ΔS were determined from the slope and the intercept of the linear regression.
To account for the kinetic behavior, the standards were injected at 70o C at different linear
velocities. The efficiency of the peaks were determined from the number of theoretical
plates(N). From this the height equivalent theoretical plates (HETP) were calculated. A Van
Deemter plot of HETP against the carrier gas linear velocity was made for the ionic liquid
stationary phase SLB-IL 100 with air as carrier gas. For the separation of xylene isomers, a
temperature program. of 500 C for 1 minute, 200C/min until 2400C with a final hold time of 5 minutes
was used because the working standard mixture had both high and low boiling aromatic
hydrocarbons.
Results and Discussion
Air vs Helium comparison based on thermodynamic parameters for the retention of
aromatic hydrocarbons
Theoretically, the carrier gas impacts the speed of the analysis and the efficiency. The Kp which
is equal to the partial pressure of analyte in vapor phase to that in the stationary phase. So , the
Kp of analytes using two different carrier gas , both at same pressure profile should be same. The
Kc values were calculated at different temperature using helium, air as carrier gas respectively.
At lower temperature there was a big difference in the Kc value between helium and air as
shown in Table 10. The effect got more pronounced for higher members of the homologous

94
series. This was because at lower temperature, the analytes had more time to spend with the
stationary phase than the mobile phase. So the true effect of change in partition coefficient with
change in the mobile phase was revealed for the higher members of the homologous series. At
lower temperature, the Kc values were higher for air when compared to helium while at higher
temperature, helium showed higher partition coefficient. In recent literature it is reported that the
Kc values changes with change in the carrier gas82. The velocity , viscosity, thermal expansion of
gases with temperature can cause a change in the Kc values.
Table 10: Comparison of Kc of aromatic hydrocarbons using helium and air as carrier
gas on SLB-IL 100 stationary phase
Oven Temperature (K) 353 348 343 338 333 323 318
Kc
Benzene
Helium 76 97 111 126 148 170 200
Air 74 84 97 100 133 187 223
ΔKc 2 14 14 26 14 -17 -23
Toluene
Helium 142 173 203 239 285 345 421
Air 132 152 180 203 260 387 481
ΔKc 10 22 23 36 25 -42 -60
Ethyl
Benzene
Helium 216 260 315 379 461 564 698
Air 194 230 278 324 413 636 809
ΔKc 22 30 37 55 48 -71 -111
Butyl
benzene
Helium 546 674 850 1067 1351 1716 2219
Air 486 594 750 931 1194 1988 2653
ΔKc 60 80 99 136 158 -272 -434
Hexyl
benzene
Helium 1436 1850 2419 3162 4170 5531 7457
Air 1273 1611 2112 2752 3633 6563 9161
ΔKc 163 239 307 410 537 -1032 -1703
Heptyl
benzene
Helium 2355 3101 4120 5501 7407 10046 13837
Air 2082 2680 3584 4765 6404 12049 17229
ΔKc 274 421 536 736 1003 -2003 -3392

95
The Van’t Hoff plot of aromatic hydrocarbons using SLB-IL 100 with air , helium as carrier
gas is shown in Figure 25. The plot was linear for both the carrier gas. The intercepts were very
close for benzene, toluene and ethyl benzene using helium and air as carrier gases. The intercept
started to vary with the higher members like hexyl benzene and heptyl benzene. The difference
in intercept means a difference in ΔS value for helium and air as carrier gas.
Figure 25:Van't Hoff plot for aromatic hydrocarbons using air, helium as carrier gas
4
5
6
7
8
9
10
2.8E-03 2.9E-03 2.9E-03 3.0E-03 3.0E-03 3.1E-03 3.1E-03 3.2E-03 3.2E-03
ln K
c
1/T
Comparison of Carrier Gases Helium and Air
Benzene He Benzene Air Toluene He Toluene Air
Ethyl Benzene He Ethyl benzene Air Butyl benzene He Butyl benzene Air
Hexyl Benzene He Hexyl benzene Air Heptyl benzene He Heptyl benzene Air

96
The thermodynamic parameters -ΔH and -ΔS that were determined from the Van’t Hoff plot for
aromatic hydrocarbons on SLB-IL 100 stationary phase using helium and air as carrier gas are
listed in Table 11. The -ΔH for aromatic hydrocarbons using helium as carrier were different
from that of air. The higher members of the homologous series showed pronounced difference
than the lower members. There was a difference in change in entropy between the two helium
and air as well. The ΔS value signified the disorderliness of the system. Helium is much lighter
than air and air predominantly contains nitrogen. Thus helium travelling faster than air causing
lesser disorderliness. Since air is mainly composed of nitrogen and oxygen, it would be worth
while to study the thermodynamics individually with air, nitrogen and compare the data with that
of air.
Table 11: Comparison of ΔH0 and ΔS0 for aromatic hydrocarbons using helium and air as
carrier gas on SLB-IL 100 stationary phase
Compound
ΔH0 (KJ mole-1) ΔS0 (J mole-1 K-1)
Helium Air Difference Helium Air Difference
Benzene -24 -30 6 -31 -49 19
Toluene -28 -35 7 -37 -58 20
Ethylbenzene -30 -38 8 -41 -65 24
Butylbenzene -36 -45 9 -50 -77 27
Hexylbenzene -43 -53 10 -60 -90 30
Heptylbenzene -46 -56 10 -65 -96 31

97
Kinetics of retention of Aromatic hydrocarbons using ionic liquid stationary phase:
The plot of HETP against average linear velocity for benzene toluene and propyl benzene using
air as carrier gas is shown in Figure 12. It was seen that all the three curves were u shaped with a
very narrow plateau. This observation was very similar to that of Van Deemter’s plot of nitrogen
reported in literature. This was typical because the major composition of air was nitrogen. Thus
the curves showed low optimum B term. The lowest HETP was observed at 15 cm/sec linear
velocity. Since the curve was very sharp, the range of linear velocity over which the low HETP
prevailed were very small. So if one needs to use air as carrier gas, they would have to run their
experiments within the small range to get highest efficiency. In other words there was a very
narrow range at which air could be used as a carrier gas to get maximum efficiency. The curve
started to rise with very steep slope after the optimum linear velocity, demonstrating a dominant
C term. So if one would increase the flow of the carrier gas beyond the optimum, there would be

98
Figure 26: HETP vs linear velocity for analytes using air as carrier gas and ionic liquid
stationary phase SLB IL-100
a compromise of efficiency due to the mass transfer coefficient C term. Thus air would not be
suitable for fast GC analysis. However it is less expensive and could be used as carrier gas based
on the goal of the analysis.

99
Separation of xylene isomers using air as carrier gas and ionic liquid stationary phase
There was a threat of using air as carrier gas because of the oxygen present in air can oxidize the
stationary phase causing column bleeding. This would result in appearance of ghost peaks,
inconsistent retention time and poor repeatability of resolution for closer eluting peaks.
Figure 27: Chromatogram of aromatic hydrocarbons on SLB IL 100 using air as career
gas.
The chromatogram of aromatic hydrocarbons including xylene isomers were injected into GC
installed with SLB-IL 100 column and air as carrier gas. The chromatogram is presented in
Figure 27. The chromatogram shows well defined sharp peaks. No base line disturbance or
ghost peaks were observed. Clear base to base separation of xylene isomers were achieved using
air as carrier gas. The resolution between p and m-xylene was 2.51. This separation was possible
due to the unique selectivity of ionic liquids to the positional isomers. Referring to the structure
100
of the ionic liquid SLB IL- 100 (Figure 11, Chapter 1), the heteroaromatic dication offers π-π
interaction while the hydrocarbon linkage group offers non bonded interaction . Due to these
interactions, the SLB-IL 100 was able to distinguish even very similar structurs like xylene
isomers. In other words the partition coefficient of the three isomers of xylene were entirely
different on the ionic liquid stationary phase. SLB-IL 100. There existed the π interaction of the
dicationic ionic liquid stationary phase with the π electron clouds of the xylene isomer and also
the non bonded interaction of the methyl groups at different position in the xylene isomers were
to a different extent with that of the nine carbon linkage group in the ionic liquid.
Unlike conventional gas chromatographic stationary phases, ionic liquid stationary phase does
not contain active hydroxyl group that are prone to oxidation. The structure of the ionic liquid is
resonance stabilized due to the delocalized electron clouds of the cations and the linkage
hydrocarbon chain group connecting the two cations stays intact. The ionic liquid stationary
phase SLB-IL 100 was installed in the GC oven with air as carrier gas for six months. There
were no discrepancy in the peak shape and retention time as well as no ghost peaks were
observed during the course of time. Thus ionic liquid stationary phase proved to resist the torcher
from the oxygen present in air. This opens a new gateway of application of ionic liquid
stationary phase, especially for quantitative analysis of field samples using air as carrier gas.
However, this application is restricted to analytes that are stable in air even in the hot inlet like
alkanes and aromatic hydrocarbons.

101
Conclusion
Air was successfully employed as the carrier gas for gas chromatographic analysis using ionic
liquid as the stationary phase. The thermodynamic properties of retention of aromatic
hydrocarbons on ionic liquid stationary phase SLB-IL 100 using air as carrier gas was
determined. This was compared with the thermodynamic properties of aromatic hydrocarbons,
obtained using helium as carrier gas. The Kc values were different from air and Helium. In
literature it was reported before that there would be change in the partition coefficient with
change in the carrier gas. The kinetics of the chromatographic process using air as carrier gas
was also studied. The study showed that air when used as carrier gas had a lower optimum B
term over a very narrow range and a dominant C term. So air could not be used for fast GC
applications. However air served as the cheap alternate to helium or hydrogen. Further air was
used as the carrier gas to separate xylene isomers and a clear base to base separation of o, m, p-
xylene was achieved using SLB-IL 100 stationary phase. The ionic liquid column with air as
carrier gas was installed in the gas chromatographic instrument for six months continuously and
showed consistent retention, peak shape and no ghost peaks, thus demonstrated the stability of
ionic liquid stationary phase SLB-IL 100 even under extreme conditions. This feature would
open new doors to the analysis of sample using air as carrier gas for field samples.

102
Chapter 4: Partition coefficient by depletion study for ionic liquid single drop
microextraction of aromatic hydrocarbons from water and quantitative estimation by no
Interface gas chromatography mass spectrometry

103
Introduction
Sample preparation plays a very important role in analytical chemistry. It involves extraction ,
preconcentration and separation of the analytes from the matrix components. As seen in Figure
14, the time spent in sample preparation is 61% and is the major sector of the pie chart. Hence
there is a need for quick and easy ways to perform sample preparation. This data was published
in 199183 and in recent years much researches has focused on ways to reduce the sample
preparation time.
Figure 28: Time spent during various activities while performing analysis, adopted from
reference 83.
61%
27%
6%
6%Sample Preparation

104
The other concern with conventional sample preparation methods is generation of hazardous
waste. So in addition to quick and easy way of sample preparation, one should look for
responsible volumes of organic solvents for extractions. Thus micro extractions are effective
substitutes for conventional extraction.
Ionic liquids are salts that are liquid at room temperature. They exhibit unique selectivity and are
versatile as solvents for microextraction. Since they are ionic species that are liquid at room
temperature, and not a solvent, the extraction performed using ionic liquids are green. Ionic
liquid static headspace single drop microextraction (IL-SHS SDME) and ionic liquid submerged
single drop microextraction (IL- SSDME) are two modes to perform micro extraction using ionic
liquids. In the present research, attempts are made to understand the chemistry behind the ionic
liquid based extractions by determining the thermodynamic property Kc of the extraction.
The conventional IL-SHS SDME, reported in literature is performed as follows84, 85, 87. The
extraction solvent is just one drop of liquid, suspended on the syringe needle, which is put in the
headspace. Typically 5 to 8mL of the sample or standard solution containing sodium chloride
and 50µL of concentrated HNO3 were placed in a 10 mL or 20 mL glass vial which was tightly
sealed with a silicone septum. Later on the GC syringe, previously filled with 2µL of ionic
liquid, was inserted in the vial through the septum until its needle tip was located about 1 cm
above the surface of the stirred solution. The plunger was depressed and a microdrop of the
acceptor phase was exposed on the headspace above the aqueous solution. After the extraction,
the drop was retracted into the syringe . This procedure employed a 10.0 ml vial and even for the
volatile analyte like benzene, toluene it took 30 min for headspace equilibration at 80 0C.

105
Typically it takes 30-60 minutes to equilibrate based on the nature of the analyte, the ionic liquid
used and the temperature at which the extraction is performed84.
The biggest challenge in using ionic liquid based SDME for analysis is introduction in to the gas
chromatographic inlet. As ionic liquids are nonvolatile, the direct introduction of ionic liquid into
the gas chromatographic inlet is not desirable, leads to clogging of the capillary column and
destroys the stationary phase.85 Due to this reason samples for ionic liquid based extraction are
either analyzed by high performance liquid chromatography 86or a special interface is designed
to introduce the ionic liquid into the gas chromatographic inlet87.
The schematic representation of the interface used for SDME is shown in Figure 29. The
interface consisted of three main integrated components: an injection zone, a removable unit and
a transfer line. The injection zone was fitted with a polydimethylsiloxane septum and connected
to a carrier gas line. This zone was connected downstream to a removable unit that consists of a
3-mm i.d. perfluoroalkoxi (PFA) tubing packed with cotton. This tube can be easily removed for
clean up purposes. A transfer line, provided with a 5-cm needle, was used to connect the
removable unit to the GC inlet. The interface was connected to the carrier gas line, whose flow
rate could be controlled by means of a millimetre valve. The total flow through the capillary
column was the sum of the carrier gas from the interface plus the helium supply line of the GC,
which allowed the use of the electronic control pressure system of the GC in order to have
constant flow rates through the column.

106
Figure 29: Interface used for sample introduction in IL-SDME , adopted from reference 87 .

107
The interface, however creates increased complexity in design and usage. Rapid transfer of the
analyte from the interface into the inlet is a challenge, cleaning and replacing the dirty interface
can be complex and the interfaces are not commercially available. Chromatograms presented in
the literature using such interface do not show symmetric peak shape due to the slow transfer of
the analyte into the column head.85, 87 The interface described in literature is similar to the
traditional inlet but not an integral part of the automated GC. So it did not help with the
complete transfer and/or fast transfer of the analyte to the column. For this work, understanding
the fundamentals of the splitless injection enabled a no-interface introduction of the analyte into
the inlet. Further, an ionic liquid stationary phase was installed in the oven instead of a
conventional polymeric stationary phase (5% phenyl, 95% methyl polysiloxane). Additionally,
earlier reported methods employing interface suggested changing glass wool in the interface
after every 5 injections.87 However with the present methodology of sample introduction, there
was no need to change the liner for more than 100 injections.
Headspace solid phase microextraction is an equilibrium technique introduced by Pawilszyn
etal88 and the fiber-sample partition coefficient of the analytes have been determined by
depletion studies89. Consecutive extractions of the analytes from a single vial resulted in
decrease or depletion in the concentration of the analyte in the extracting phase. Since IL-SHS
SDME is an equilibrium technique similar to HS-SPME, the depletion study can be applied to
determine the ionic liquid/water extraction ratio and partition coefficient. The ionic liquid –
water partition coefficient of the analyte is a thermodynamic parameter that provides an insight
into how efficiently the analytes can be extracted. To the best of our knowledge, this is the first
time a depletion study is used for the determination of partition coefficient of IL- SHS SDME.
108
The ionic liquid/water partition coefficient and its trend in the homologous series of aromatic
hydrocarbons were explored using the ionic liquid 1-Butyl-3-methylimidazolium
bis(trifluoromethylsulfonyl)imide as extracting medium. While there has been extensive studies
on partition coefficient in SPME, there is little literature on partition coefficient in IL-SHS
SDME.
Objective of the analysis
The Key objectives of the experiment are shown in Figure 15, which were (i) to perform IL-
SHS SDME that is time efficient (ii) to introduce ionic liquid directly into the gas chromatograph
without an interface (iii) to have a selective extraction as well as a selective separation (iv) to
determine the partition coefficient of the extraction by depletion study (v) to compare the
partition coefficient of of analyte belonging to the homologous series of aromatic hydrocarbons
(vi) to compare the extraction efficiency of 1-Butyl-1-methylpyrrolidinium
bis(trifluoromethylsulfonyl)imide to that of 1-Butyl-3-methylimidazolium
bis(trifluoromethylsulfonyl)imide in IL-SHS SDME (vii) to validate the extraction method and
apply it to real sample analysis.

109
Figure 30: IL SHS SDME, the objective of the analysis
Theory
IL-SHS SDME is a three phase equilibrium process. Figure 31 shows the equilibrium involved in
the IL-SHS SDME.The first equilibrium exists between the liquid phase (aqueous sample) and
the vapor phase. The second equilibriam exists between the vapor phase and the ionic liquid.
Thus there are three phases and two equilibrium processes involved in IL-SHS SDME. The
partition coefficient KIL/S would be the product of the partition coefficient of individual
equilibrium process.
IL-SHS SDME
Time efficient extraction
No interface sample introduction
Selective extraction and separation
Partition coefficient by depletion
Comparison of two ionic liquids based on
Kc
Validate the extraction method and extend to
real sample analysis

110
Figure 31: Phases involved in IL SHS SDME
The extraction ratio E is defined as the ratio of the amount of analyte in the ionic liquid after
extraction n IL,x, to the amount of analyte in the sample before extraction ns,x−1 :
E = nil, x/ ns, x−1 Equation (16)
where x denotes the number of the consecutive extraction steps. E is a very useful parameter to
characterize the efficiency of IL-SHS SDME as it indicates the fraction of analyte that is actually
used in analysis. Starting with an initial amount in the sample of ns,0, after the first extraction the
amount remaining in the sample ns,1 is reduced by the fraction sorbed by the ionic liquid nIL,1
(Equation.(17)). The latter is proportional to the initial amount ns,0 with the extraction ratio as
factor (Equation. (16)).

111
n s,1 = n s,0 – n IL,1 = ns,0 – En s,0 = n s,0 (1 − E) Equation (17)
After desorption, the same sample is extracted again and the remaining amount ns2 can be
calculated using the considerations described above.
ns,2 = ns,1 − nIL,2 = ns,0 (1 − E) − Ens,1 = ns,0 (1 − E)2 Equation (18)
On the basis of the Equation. (17) and (18) the general geometric sequence can be developed for
x extractions:
n s,x = ns,0 (1 − E)x Equation (19)
Using Equation. (19) the amount of analyte in the sample can be described as a function of the
number of extractions. As the extracted amount n IL is defined as difference between two
consecutive extractions, the following relationship is obtained by application of Equation. (19)
where n il,x is proportional to ns x−1.
nil,x = ns,x−1 − ns,x = ns,0 (1 − E) x−1 − ns,0 (1 − E)x = ns,0 E(1 − E)x−1 Equation (20)
If the peak areas of the depletion experiment that are proportional to the extracted amount nIL are
plotted against the number of extractions x the resulting curve can be fitted with f(x) = abx

112
according to Equation (20) with a = ns,0 E and b=1−E. The extraction ratio E can be easily
determined from the slope b. The data analysis can be simplified by plotting the logarithmical
peak
areas against the number of extraction which results in a linear relationship. After linear
regression, the extraction ratio can be easily determined from the slope of the equation which
would be log(1−E).
log nil,x = log(ns,0 E) + (x − 1) log(1 − E) Equation (21)
The ionic liquid and sample volumes are incorporated in the calculation of the partition
coefficients K IL/s,
KIL/S = CIL/Cs = Vs/ VIL * nIL / ns = nilVs / Vil(CoVs – nil) Equation (22)
where KIL/S is the partition coefficient between the acceptor ionic liquid phase IL and the
aqueous sample s, nil the amount of analyte extracted by the ionic liquid, c0 the initial
concentration of the analytes in the sample and Vs, Vil is the volumes of the sample and the ionic
liquid, respectively. The partition coefficient may be expressed as ratio of the analyte
concentrations in the ionic liquid C IL and in the sample CS. Partition coefficients are typically
used in the literature as they are independent from initial concentrations and sample volumes.
While Vs, Vil and C0 are known, the extracted amount, nil has to be determined. Under
equilibrium conditions, the extraction ratios E can be used to determine the Ionic liquid sample

113
partition coefficients. Otherwise, an apparent partition coefficient is obtained as a practical
alternative that characterizes real conditions met in routine analysis.
Following Equation (16) substitution of nil = Ens,0 in Equation (22) results in the following term:
KIL/S = VS/VIL * E / (1 − E) Equation (23)
In contrast to Euation (22), Equation (23) is independent from the absolute analyte amounts nil
and ns,0. Therefore, the initial concentration of an analyte in a sample is not required for the
determination of partition coefficients. Thus the partition coefficient can be found out even for
unknown samples if one does not know the initial concentration of the analytes in it. The same
model discussed above was employed by Zimmerman to determine the the fiber/ sample
partition coefficient of pesticide compounds in headspace SPME.89 Since HS –SPME is an
equilibrium technique like IL-SHS SDME with negligible volume change, the depletion study
was adopted for in the later procedure to find the ionic liquid/ sample partition coefficient. Thus
Equation. (23) has 2 components in it; the volume component and the extraction ratio. The
volume of the ionic liquid Vil and the volume of the sample Vs can be directly measured and the
1-E and E values can be calculated from the linear regression.
Experimental
Materials used
Ultrapure water was produced in the lab using MilliQ Plus Ultra (Billerica, MA). Ionic liquids:
1-Butyl-3-methylimidazolium bis(trifluoromethylsulfonyl)imide,1-Butyl-1-methylpyrrolidinium
bis(trifluoromethylsulfonyl)imide, aromatic hydrocarbons and all other chemicals used for the

114
extraction were purchased from Sigma-Aldrich (St. Louis, MO). The ionic liquid column SLB-
IL 76 was donated by Supelco Sigma-Aldrich (St. Louis, MO). The ultra inert low pressure drop
liner with wool was supplied by Restek (Bellefonte, PA). A 10 µL syringe with teflon tip plunger
and a bevel tip needle of 22 gauge were purchased from Hamilton (Switzerland) . An ultra sound
bath from Cole Palmer (Vernon Hills, IL) was used.
Standard and sample preparation
A stock solution of 100 µg mL-1 of each naphthalene, biphenyl, benzene, toluene, ethyl benzene,
propyl benzene, butyl benzene, pentyl benzene, hexyl benzene, heptyl benzene, octyl benzene
and nonyl benzene were prepared in methanol. Further dilutions were made as per the
concentration required. The final dilution in every case was made by spiking appropriate quantity
of standard in a 2 mL vial for IL-SHS SDME containing 1.5 ml of 200 mg mL-1 aqueous
sodium chloride solution made in Millipore water .
The public water from different places were collected in amber colored bottles and kept closed
until analysis. 1.5 ml of the water was transferred into a 2 mL vial for IL-SHS SDME and 200
mg sodium chloride was added. The vial was closed with the screw cap and subjected to IL-
SHS SDME.
IL-SHS SDME procedure
IL-SHS SDME as performed in in this was quite different from what is described in the
literature. Considering the main objective of fast and sensitive extraction, fundamental principles
of static headspace extraction was applied to the initial two phase extraction90. The peak area in a

115
static headspace extraction can be given by the Equation (24). Where Cg represents the
concentration of the analyte in the gaseous phase and Cs represents the concentration of the
analyte in the sample (aqueous phase in the present experiment) or the initial concentration of the
analyte, KS/V represents the partition coefficient of the analyte , β represents the phase volume
ratio which is given by the volume of the vapor phase to the volume of the sample and A
represents the peak area
A α Cg = Cs /(KS/V +β) Equation (24)
Thus the peak area is static headspace extraction is proportional to the concentration of analyte
in the headspace of the vial which is equal to the concentration of analyte in the initial sample
over the sum of partition coefficient and phase ratio. If KS/V is much higher when compared to β
then the phase volume ratio has no or very little influence on the sensitivity as per Equation (24).
If β is higher than KS/V then the phase volume ratio has a higher influence on the sensitivity. The
probe analytes chosen for the present study are volatile aromatic hydrocarbons and they prefer to
stay in the headspace than in the sample matrix. Here, since the analytes have preference to the
vapor phase, KS/V would be smaller than the phase ratio. Hence the phase volume ratio would
have greater influence on the sensitivity. Irrespective of the dimension of the partition
coefficient, reducing the size of the vial and reducing the headspace volume would reduce would
help in fastere equilibration. Taking this into consideration, the headspace volume of 0.5 ml in a
2.0 ml vial was chosen for the analysis which resulted in the β value of 0.33. Thus the initial step
in the optimization process was to optimize the two phase equilibrium between the aqueous
phase and the vapor phase. An ultrasound bath was used to equilibrate the headspace. This was
116
followed by the exposure of the ionic liquid to the headspace. Thus the complex three phase
equilibrium process was optimized at every step to produce maximum sensitivity.
A schematic diagram of IL-SHS SDME performed in our lab is shown in Figure 32. This
represents the practical sequence of tasks performed in the laboratory. The first step represented
by Step A in the figure was to take the ionic liquid 1-Butyl-3-methylimidazolium
bis(trifluoromethylsulfonyl)imide (IL1) in a 10.0 mL microsyringe and to exactly adjusted the
plunger to 2.0 µL. Thus the syringe had 2 µL of ionic liquid in it and needle volume of
approximately 0.5 µL. Due to the viscosity and surface tension of the ionic liquid, a syringe
with a Teflon plunger was used. The next step as shown in Step B was to measure exactly 1.5 ml
of the sample or working standard containing the analyte in a 2.0 ml screw cap vial and add
small magnetic stir bar to it . The vial was closed with a screw cap and placed in an ultrasound
bath for 7.0 min. Step C was the final step where the vial containing the analyte was kept in a
magnetic stirring plate at a speed of approximately 1200 rpm. The septum was pierced with the
needle of the syringe and the needle stayed in the headspace of the vial 0.2 cm above the liquid
phase. The 2.0 µL of the ionic liquid was dispensed slowly to form a droplet that suspends as a
pendent from the tip of the needle. The drop was exposed to the headspace for 8 minute after
which the drop was retracted into the syringe. The same procedure was repeated using the ionic
liquid 1-Butyl-1-methylpyrrolidinium bis(trifluoromethylsulfonyl)imide (IL2).
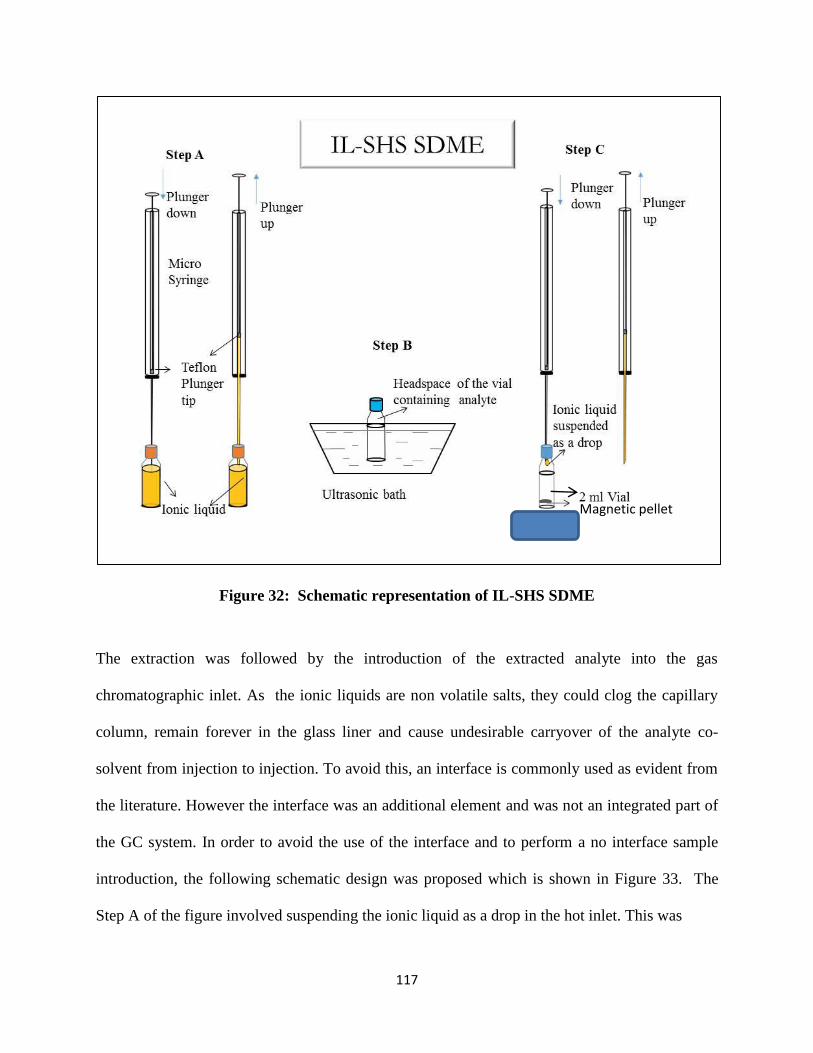
117
Figure 32: Schematic representation of IL-SHS SDME
The extraction was followed by the introduction of the extracted analyte into the gas
chromatographic inlet. As the ionic liquids are non volatile salts, they could clog the capillary
column, remain forever in the glass liner and cause undesirable carryover of the analyte co-
solvent from injection to injection. To avoid this, an interface is commonly used as evident from
the literature. However the interface was an additional element and was not an integrated part of
the GC system. In order to avoid the use of the interface and to perform a no interface sample
introduction, the following schematic design was proposed which is shown in Figure 33. The
Step A of the figure involved suspending the ionic liquid as a drop in the hot inlet. This was
Magnetic pellet

118
Figure 33: No interface introduction of ionic liquid containing the extracted analyte by
Step A) Suspending the ionic liquid containing the extracted analyte at syringe tip inside
the hot splitless inlet and retracting the ionic liquid in to the syringe after injection Step B)
Purging the inlet with carrier gas to clean the inlet.
followed by retracting the ionic liquid back in the syringe after the injection was completed
while the needle of the syringe was still in the inlet. Thus instead of injecting the ionic liquid into
the gas chromatographic inlet, only the analyte of interest was allowed to go to the column while
the ionic liquid was retained back. Since the inlet was operated in splitless mode, continuous
purging of carrier gas in the inlet and rapid opening of vent valve after the injection helped
maintain a clean inlet as shown in Figure 17, Step B. As an additional layer of safety, the ultra
inert glass liner with glass wool in the center was used. Since the inlet was run in splitless mode,
the carrier gas flushed the inlet after every injection and any residual analyte was taken to the
Step A Step B
119
split vent and provided a clean inlet for the next injection. Instead of a conventional polymeric
stationary phase, ionic liquid stationary phase SLB IL 76 was installed in the gas
chromatographic oven.
GC/MS Parameters
The GC/MS analysis was performed using a 6890A GC coupled to 5973 MS detector system
(Agilent Technologies, Palo Alto, CA, USA). The analysis was carried out in constant flow
mode with a flow rate of 1 mL min-1. The ionic liquid column SLB-IL 76, 30 m x 0.25 mm x
0.20 µm was installed in the GC oven. All injections were performed in splitless mode. The inlet
temperature was set at 300 ºC. The oven temperature program was 35 ºC (hold for 1 min)
increased at the ramp of 20 ºC min-1 up to 225 ºC (hold for 4.5 min) with a total run time of 15
min. Transfer line, ion source and quard temperatures were set at 270, 250 and 150 ºC
respectively. A quadrupole MSD was operated in single ion monitoring (SIM) during runs . In
the SIM, 78, 91, 128 and 154 m/z were chosen as the quantitative ions.
Depletion study
In order to determine the ionic liquid/water extraction ratio and the apparent partition coefficient
of the analyte, depletion study was performed for IL-SHS SDME. This was performed by doing
consecutive extraction of the analytes from the same vial, according to the method of
Zimmerman.89

120
Results and Discussion
Sample introduction
No interface sample introduction was achieved by suspending the ionic liquid in the splitless
inlet and retracting it back. The liner used in the experiment worked in the same way as the
interface described in the literature. However, as the liner was an integrated part of the inlet
system, complete and fast transfer of the analyte into the GC column head was achieved. Further,
Ionic liquid stationary phase was installed in the GC inlet. The ionic liquid stationary phase not
only supported the sample introduction but also provided good selectivity for closer eluting
analytes like nonyl benzene and naphthalene as shown in Figure 34.
Figure 34: A typical chromatogram of 60 ng mL-1 aromatic hydrocarbons extracted by
IL-SHS SDME.

121
Prior to the IL-SHS SDME method development, a liquid injection of 12 aromatic hydrocarbons
were injected using Stabile Wax-10 column and only 11 peaks were observed signifying the
coelution of Nonyl benzene and biphenyl as shown in Figure 33. Another notable difference was
that biphenyl eluted before naphthalene.
Figure 35:Chromatogram of liquid injection of 12 aromatic hydrocarbons using Stabile
Wax-10 column.
Thus Ionic liquid stationary phase SLB-IL 76 used for the chromatographic separation offered
unique selectivity. Due to the presence of cations, anions and linkage group in it, the ionic liquid
stationary phase was able to separate all the 12 peaks. Prior to the sample introduction method
optimization, conventional GC stationary phase with 5% biphenyl and 95%
dimethylpolysiloxane was used for the analysis and the column damaged, especially upon
accidental introduction of the ionic liquid from the inlet. In a nutshell, sample introduction mode,
inlet mode, design of the liner and the ionic liquid stationary phase allowed a no interface sample
introduction. A typical chromatogram of 60 ng mL-1 of aromatic hydrocarbons extracted by
using IL-SHS SDME is shown in Figure 34. The sharper peaks were observed due to a rapid
3 . 0 0 4 . 0 0 5 . 0 0 6 . 0 0 7 . 0 0 8 . 0 0 9 . 0 0 1 0 . 0 0 1 1 . 0 0 1 2 . 0 0 1 3 . 0 0 1 4 . 0 0
0
2 0 0 0 0 0
4 0 0 0 0 0
6 0 0 0 0 0
8 0 0 0 0 0
1 0 0 0 0 0 0
1 2 0 0 0 0 0
1 4 0 0 0 0 0
1 6 0 0 0 0 0
1 8 0 0 0 0 0
T im e - - >
A b u n d a n c e
T I C : W A X S I M 1 0 2 8 1 3 0 0 2 . D \ d a t a . m s
1 2
3
4
5 6 7
8
9
12
10 & 11
1 Benzene 2 Toluene 3 Ethyl benzene 4 Propyl Benzene 5 Butyl benzene 6 Pentyl benzene 7 Hexyl benzene 8 Heptyl benzene 9 Octyl benzene 10 Nonyl benzene 11 Biphenyl 12 Naphthalene

122
transfer of the analyte from the inlet to the column head. Previously reported literature also
suggested the change of the glass wool in the interface after every 5 consecutive injections. Since
the ionic liquid was not injected into the inlet, this method of sample introduction did not need
change or cleaning of the liner. However as a safety measure, the liner was inspected and cleaned
after every 100 injections.
Challenges faced during method optimization
At the start of the project , several trials were made for sample introduction before considering
no interface sample introduction. A splitless liner with a glass wool and a guard column were
used for the initial optimization trials, as reported in the literature91. However the ionic liquid
for our study were different and the probe analytes were different too. The initial chromatogram
is presented in Figure 36.
Figure 36: Chromatogram obtained by the first injection of IL-SHS SDME
4 . 0 0 6 . 0 0 8 . 0 0 1 0 . 0 0 1 2 . 0 0 1 4 . 0 0 1 6 . 0 0 1 8 . 0 00
5 0 0 0 0
1 0 0 0 0 0
1 5 0 0 0 0
2 0 0 0 0 0
2 5 0 0 0 0
3 0 0 0 0 0
3 5 0 0 0 0
4 0 0 0 0 0
4 5 0 0 0 0
5 0 0 0 0 0
5 5 0 0 0 0
6 0 0 0 0 0
6 5 0 0 0 0
7 0 0 0 0 0
7 5 0 0 0 0
8 0 0 0 0 0
8 5 0 0 0 0
T i m e - - >
A b u n d a n c e
T I C : 0 9 0 6 1 2 1 4 . D \ d a t a . m s
4 . 5 3 8
6 . 9 1 5
8 . 2 8 7
9 . 4 4 9
1 0 . 5 1 5
1 4 . 0 3 31 5 . 0 8 4

123
The chromatogram showed very sharp peaks . However upon third consecutive injections, the
chromatogram showed irregular peak shapes and also carry over from the previous injection as
shown in Figure 37. Further injections produced clouted hump instead of individual peaks as
shown in Figure 38. Also the point at which the pressfit connected the analytical column to the
guard column, residue of chared ionic liquid was noticed. After the injection about one meter of
the column was cut near the inlet side, conditioned over night at 2500C in the presence of helium.
The column was tested with liquid injection of aromatic hydrocarbons and it was found that the
column was irreversibly damaged. It was clear that the ionic liquid when injected directly into
the inlet clogged the column. Due to the nonvolatile nature of the ionic liquid, they were found
as residue deposited in the head of the column and produced a very dirty inlet.
Figure 37: Chromatogram obtained by the third injection of IL-SHS SDME
4 . 0 0 5 . 0 0 6 . 0 0 7 . 0 0 8 . 0 0 9 . 0 0 1 0 . 0 0 1 1 . 0 0 1 2 . 0 0 1 3 . 0 0 1 4 . 0 0 1 5 . 0 0 1 6 . 0 0 1 7 . 0 00
5 0 0
1 0 0 0
1 5 0 0
2 0 0 0
2 5 0 0
3 0 0 0
3 5 0 0
4 0 0 0
4 5 0 0
5 0 0 0
5 5 0 0
6 0 0 0
6 5 0 0
7 0 0 0
7 5 0 0
8 0 0 0
8 5 0 0
9 0 0 0
9 5 0 0
1 0 0 0 0
T i m e - - >
A b u n d a n c e
T I C : 0 9 1 0 1 2 0 1 . D \ d a t a . m s
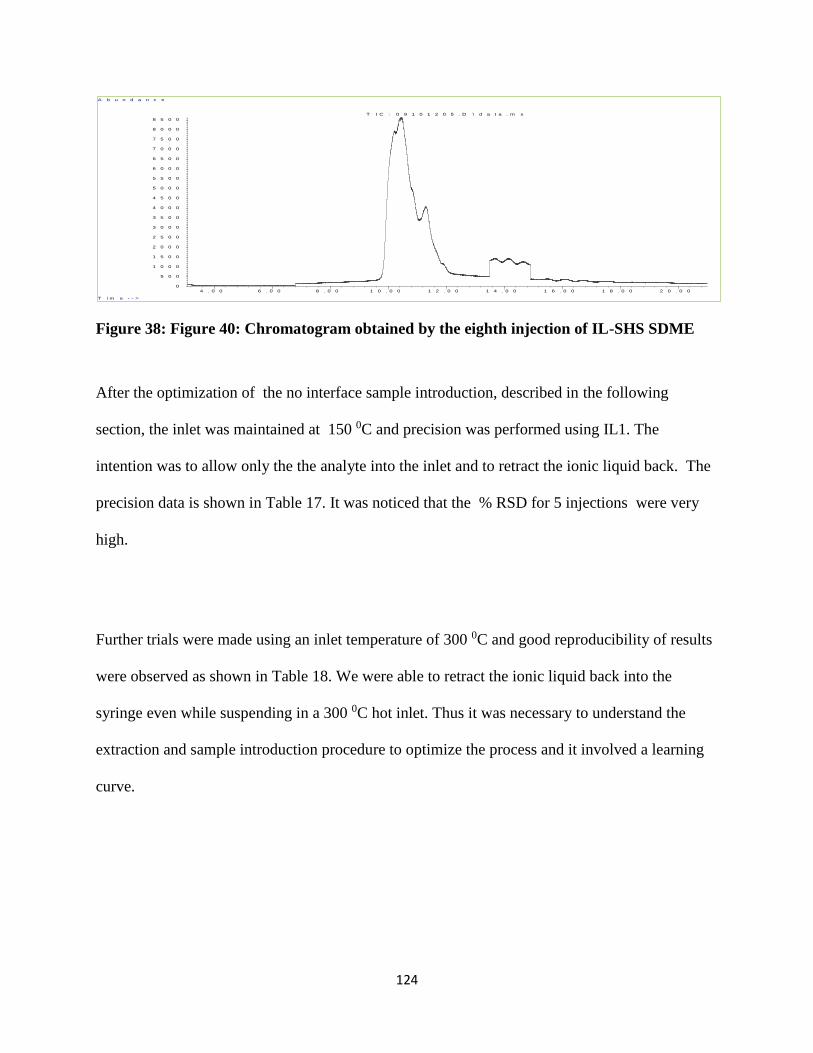
124
Figure 38: Figure 40: Chromatogram obtained by the eighth injection of IL-SHS SDME
After the optimization of the no interface sample introduction, described in the following
section, the inlet was maintained at 150 0C and precision was performed using IL1. The
intention was to allow only the the analyte into the inlet and to retract the ionic liquid back. The
precision data is shown in Table 17. It was noticed that the % RSD for 5 injections were very
high.
Further trials were made using an inlet temperature of 300 0C and good reproducibility of results
were observed as shown in Table 18. We were able to retract the ionic liquid back into the
syringe even while suspending in a 300 0C hot inlet. Thus it was necessary to understand the
extraction and sample introduction procedure to optimize the process and it involved a learning
curve.
4 . 0 0 6 . 0 0 8 . 0 0 1 0 . 0 0 1 2 . 0 0 1 4 . 0 0 1 6 . 0 0 1 8 . 0 0 2 0 . 0 0
0
5 0 0
1 0 0 0
1 5 0 0
2 0 0 0
2 5 0 0
3 0 0 0
3 5 0 0
4 0 0 0
4 5 0 0
5 0 0 0
5 5 0 0
6 0 0 0
6 5 0 0
7 0 0 0
7 5 0 0
8 0 0 0
8 5 0 0
T i m e - - >
A b u n d a n c e
T I C : 0 9 1 0 1 2 0 5 . D \ d a t a . m s

125
Table 12: Precision of IL-SSDME at 150 0C inlet temperature before complete method
optimization using IL1
Name
Peak Area
%RSD Injection1 Injection2 Injection3 Injection4 Injection5
Benzene 95698872 45374301 67489949 52815299 32037184 34.0
Toluene 106285443 67470612 77732749 67184437 41659770 23.1
Ethyl Benzene 176337624 99930586 137485106 117134408 78525811 24.8
Propyl Benzene 207220447 129301935 167942854 147965476 106203016 20.5
Butyl Benzene 141326415 87393674 114261782 102658211 75968226 20.4
Naphthalene 50354770 31518115 40203468 36445915 31713375 20.1
Anthracene 13327445 8847466 10478045 9520570 8544071 18.7
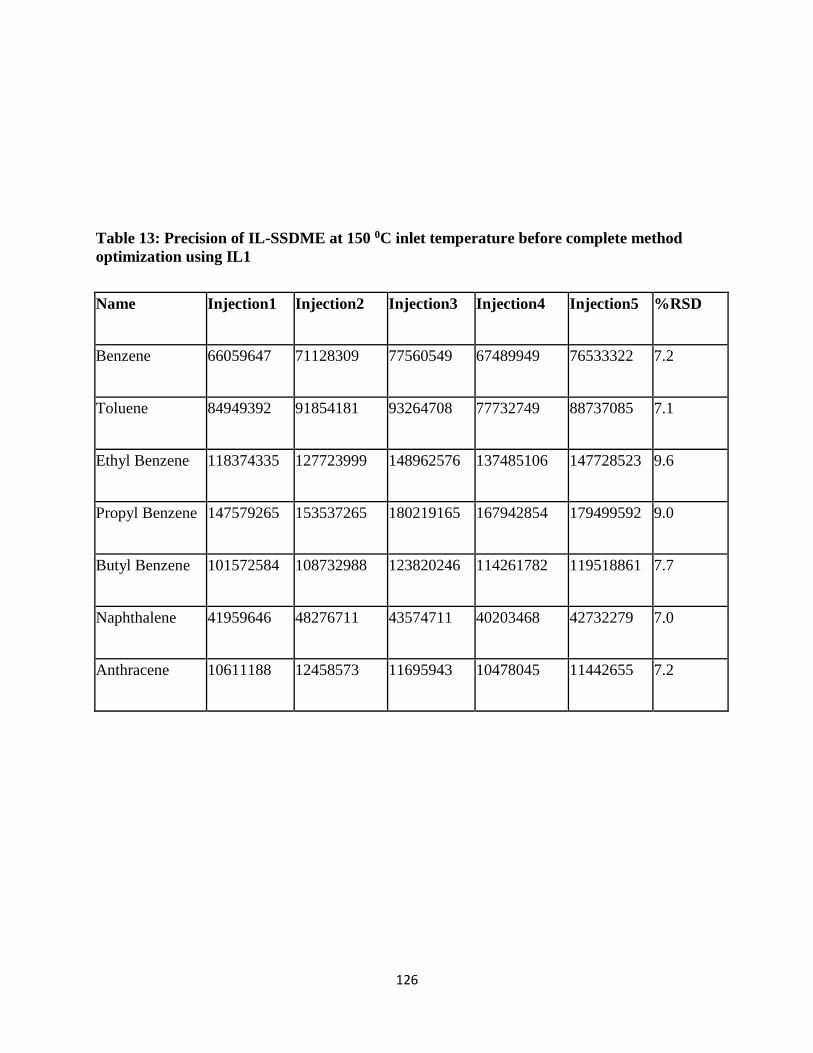
126
Table 13: Precision of IL-SSDME at 150 0C inlet temperature before complete method
optimization using IL1
Name Injection1 Injection2 Injection3 Injection4 Injection5 %RSD
Benzene 66059647 71128309 77560549 67489949 76533322 7.2
Toluene 84949392 91854181 93264708 77732749 88737085 7.1
Ethyl Benzene 118374335 127723999 148962576 137485106 147728523 9.6
Propyl Benzene 147579265 153537265 180219165 167942854 179499592 9.0
Butyl Benzene 101572584 108732988 123820246 114261782 119518861 7.7
Naphthalene 41959646 48276711 43574711 40203468 42732279 7.0
Anthracene 10611188 12458573 11695943 10478045 11442655 7.2

127
While doing the extraction, most of the time the ionic liquid was successfully suspended as
droplet. But 1 out of 20 showed a failure of the ionic liquid falling down into the aqueous
solution. During our trials we noticed that the failure was less if the droplet size was little lesser
than the maximum volume the syringe could suspend. Initially 2.5 µL of the ionic liquid was
suspended and it fell down 3 out of 6 times after few minutes of suspending it as a droplet, while
the failure reduced to 1 out of 20.
The need for automation of the process is really in demand and that’s when the IL-SHS SDME
could be used by different section of analysts excluding human errors. The automation of the IL-
SHS SDME has been reported with the interface and it would be much easier especially with the
no interface sample introduction .
Method optimization
The method optimization was performed for IL-SHS SDME using IL2 in flame ionization
detector and presented in Figure 39. Seven 2 mL vials, each containing 1.5 mL of the sample in,
the vial were taken. They were sonicated for 4, 5, 6….11 minutes respectively, followed by
singledrop microextraction. The extraction was performed at different sonication time. Figure 39
represents a plot of peak area against sonication time. It was found that 8.0 min gave the
maximum area response for all the analytes.
After optimizing the sonication time, the extraction time was optimized. The extraction time was
the time for which the ionic liquid was exposed to the headspace of the vial. After the sonication
of analytes in the vial, the ionic liquid was exposed to the headspace of the vial for 5, 7, 8 and 9

128
min respectively. A plot of peak area against the extraction time was made as shown in
Figure 40. The peak area of for 7.0 min extraction was maximum and was considered as the
optimized extraction time.
To optimize the salt concentration, 100, 150, 200…400 mg of sodium chloride per 1mL was
added to individual vial and IL-SHS SDME was performed on each of them. A histogram of
peak area against mg/mL of Sodium chloride was made as shown in Figure 41. A salt
concentration of 200 mg/mL gave the highest peak area for all the analytes.
Once the analytes were extracted by IL-SHS SDME, they were desorbed in the inlet. The time
for which the ionic liquid has to be exposed to the hot inlet was optimized. The IL-SHS SDME
was performed and ran at injection time(splitless time/ desorption time) of 2, 5, 10, 15 and 20
sec. A histogram of peak area against the injection time is shown in Figure 42. The optimized
injection time was found to be 15 sec. It was found if the ionic liquid was exposed to the hot inlet
for more than 20 sec, it was difficult to retract it back into the syringe.

129
Figure 39: Optimization of sonication time
Figure 40: Optimization of extraction time
0
20000
40000
60000
80000
100000
120000
140000
160000
4 5 6 7 8 9 10 11
Optimization of Sonication Time
BENZENE
TOLUENE
ETHYLBENZENE
PROPYLBENZENE
BUTYLBENZENE
Sonication time (min)
Peak
Are
a
0
10000
20000
30000
40000
50000
60000
70000
80000
90000
5 7 8 10
Optimization of Extraction Time
Toluene
EthylBenzene
Propylbenzene
ButylbenzeneExtraction Time
Pea
k A
rea
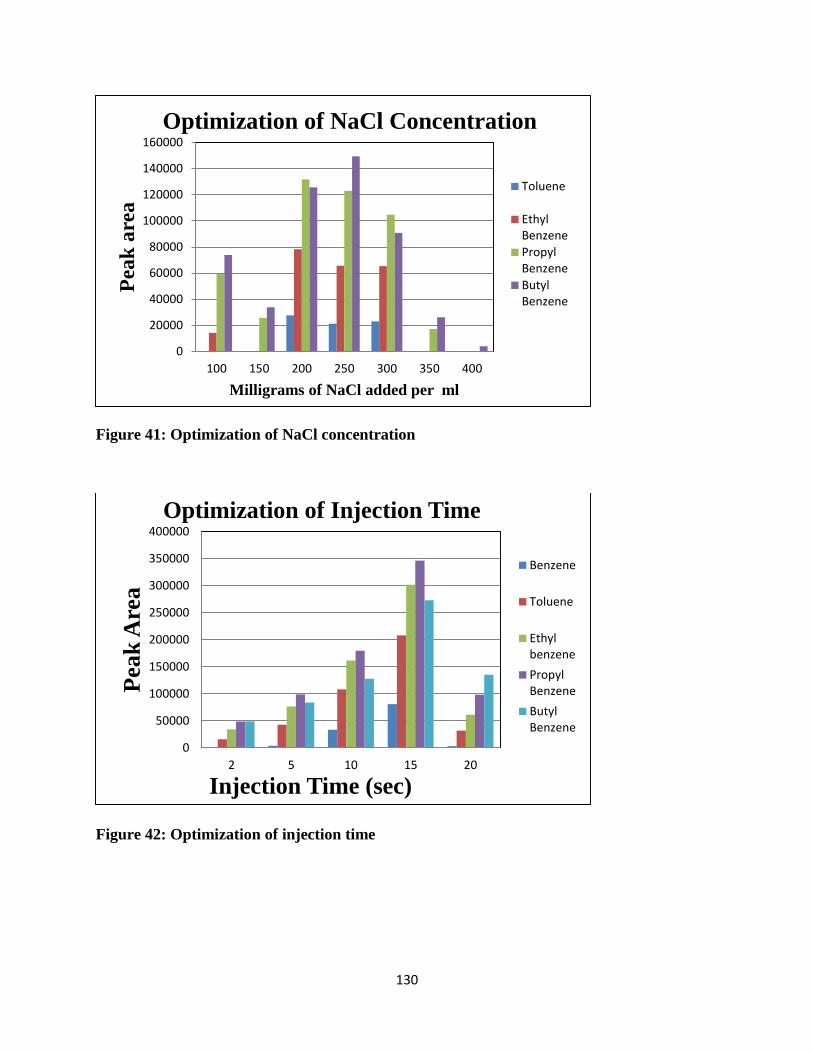
130
Figure 41: Optimization of NaCl concentration
Figure 42: Optimization of injection time
0
20000
40000
60000
80000
100000
120000
140000
160000
100 150 200 250 300 350 400
Pea
k a
rea
Milligrams of NaCl added per ml
Optimization of NaCl Concentration
Toluene
EthylBenzene
PropylBenzene
ButylBenzene
0
50000
100000
150000
200000
250000
300000
350000
400000
2 5 10 15 20
Peak
Are
a
Injection Time (sec)
Optimization of Injection Time
Benzene
Toluene
Ethylbenzene
PropylBenzene
ButylBenzene

131
Apparent partition coefficient by depletion study in IL-SHS SDME:
To visualize the extraction ratio of the two ionic liquids under consideration, IL-SHS SDME of
the two ionic liquids were performed and the peak areas were compared. As seen in Figure 43,
the ionic liquid 1-Butyl-3-methylimidazolium bis(trifluoromethylsulfonyl)imide (IL2) exhibited
60% higher peak area than 1-Butyl-1-methylpyrrolidinium bis(trifluoromethylsulfonyl) imide
(IL1). Since the peak areas are based on the extracted ion chromatogram in a GC-MS, it only
gave a rough estimate of how better the extraction was with IL2 when compared to IL1.
Figure 43: Comparison of IL-SHS SDME of 1-Butyl-1-methylpyrrolidinium
bis(trifluoromethylsulfonyl) imide and 1-Butyl-3-methylimidazolium
bis(trifluoromethylsulfonyl)imide in terms of peak area.

132
Further to determine the extraction ratio and the apparent partition coefficient, IL-SHS SDME
was performed six times consecutively on a 1.5 mL aliquot of 60 ng L-1 aromatic hydrocarbon
standard solution using IL1 and injected into the gas chromatographic inlet immediately after
every extraction. The same procedure was repeated using IL2. During the extractions, the
peak area started to reduce from extraction to extraction. This was because of the depletion of
analytes from the sample. Since the amount of analytes extracted was proportional to the peak
area, the peak area started to reduce exponentially with each extraction. A plot of logarithm
peak area against extraction number was made and were linear with a correlation coefficient
greater than 0.98 for the aromatic hydrocarbons. The depletion plots for aromatic hydrocarbons
using IL1 are shown in Figure. 44. and that of bicyclic aromatic hydrocarbons using IL1 are
shown in Figure 45. Biphenyl showed R2 value of 0.97 while all other analytes showed R2
greater than 0.98. Pentyl benzene was not availablewhile performing IL-SHS SDME using IL1
as the extracting medium and was not included in the standard preparation.

133
Figure 44: Depletion of analytes during consecutive extraction in IL-SHS SDME using 1-
Butyl-1-methylpyrrolidinium bis(trifluoromethylsulfonyl)imide as extracting ionic liquid.

134
Figure 45: Depletion of analytes during consecutive extraction of bicyclic aromatic
hydrocarbons in IL-SHS SDME using 1-Butyl-1-methylpyrrolidinium
bis(trifluoromethylsulfonyl)imide as extracting ionic liquid.
Referring to table 9, the highest partition coefficient was observed for Ethyl benzene and the
lowest was for Hexyl benzene. Considering the structure of IL1, the butyl chain is the main
source of interaction with the alkyl chain of the aromatic hydrocarbon. The KIL/S were in the
range of 200 to 300. The only possible source of interaction in IL1 is the alkyl chain with the
alkyl chain of the aromatic hydrocarbon and the π electron cloud in the anion with the π electron
cloud of the aromatic hydrocarbon. There was not a considerable difference in the KIL/S in the
homologous series. This was because the length of the linkage group alkyl chain in the IL1 had
only 4 carbons in it. In other words the 4 carbon alkyl chain in the ionic liquid was not able to
distinguish much between the alkyl chains of the aromatic hydrocarbon. If we compare Benzene,
Naphthalene and biphenyl, there was not big difference in the KIL/S. Again the anion in the ionic

135
liquid interacted with the π electron cloud of the mono and bicyclic aromatic ring to the same
extent.
Table 14: Calculation of apparent coefficient in IL-SHS SDME using 1-Butyl-1-
methylpyrrolidinium bis(trifluoromethylsulfonyl)imide at 22 °C
Compound Name R2 Residual
Error
Slope 1-E E KIL/S
Benzene 0.988 0.05 -0.16 0.70 0.30 200
Toluene 0.989 0.07 -0.21 0.62 0.38 300
Ethyl Benzene 0.990 0.06 -0.21 0.61 0.39 300
Propyl Benzene 0.989 0.06 -0.19 0.64 0.36 300
Butyl Benzene 0.981 0.06 -0.15 0.70 0.30 200
Hexyl Benzene 0.971 0.07 -0.14 0.73 0.27 200
Heptyl Benzene 0.980 0.07 -0.17 0.68 0.32 200
Octyl Benzene 0.984 0.07 -0.18 0.66 0.34 300
Nonyl Benzene 0.988 0.06 -0.19 0.65 0.35 300
Naphthalene 0.986 0.06 -0.19 0.65 0.35 300
Biphenyl 0.970 0.08 -0.16 0.69 0.31 200
The depletion of analytes with consecutive extraction in IL-SHS SDME using IL2 is represented
in Figure 46. The IL2 has an aromatic ring (imidazolium ring) in addition to the four carbon side
chain. The R2 values were greater than 0.98 for the aromatic hydrocarbons while biphenyl
showed R2 value of 0.90. The slope and the intercept of each line was quite different from each
other which signified a difference in KIL/S for the aromatic hydrocarbons. The experiment was

136
repeated twice and the standard deviation were considered as the uncertainty. The extraction
ratio and the KIL/S for IL-SHS SDME using IL2 are summarized in Table 13. Heptyl benzene
showed the highest KIL/S of 673 while Nonyl benzene showed the lowest KIL/S of 288.
Hypothetically, the KIL/S were expected to increase from benzene to 3 or four membered alkyl
chain of the homologous series and then plateau. However the observed trend was a zig zag
pattern among the
Figure 46: shows the depletion of aromatic hydrocarbons upon consecutive extraction in
IL-SHS SDME using IL2 .

137
Table 15: Apparent coefficient in IL-SHS SDME using 1-Butyl-3-methylimidazolium
bis(trifluoromethylsulfonyl)imide at 22 °C
Name
IL-SHS SDME 220C
E ± STDEV KIL/S ± STDEV
BENZENE 0.28±0.01
318±20
TOLUENE 0.40±0.01
494±31
ETHYL BENZENE 0.44±0.01
594±25
PROPYL BENZENE 0.38±0.03
453±51
BUTYL BENZENE 0.34±0.03
394±47
PENTYL BENZENE 0.40±0.04
497±92
HEXYL BENZENE 0.44±0.01
590±33
HEPTYL BENZENE 0.47±0.04
659±107
OCTYL BENZENE 0.47±0.01
673±9
NONYL BENZENE 0.29±0.09
288±158
NAPHTHALENE 0.30±0.01
315±5
BIPHENYL 0.10±0.01
81±11
homologous series. This was because of the inherent character of the ionic liquid to interact both
with the carbon chain as well as the aromatic moiety of the analyte. In other words, the π-π

138
interaction between the ionic liquid and the aromatic hydrocarbons and the non-bonded
interaction between the aliphatic chain in the ionic liquid with that of the aromatic
hydrocarbon’s aliphatic chain occurs to a different extent. Benzene and naphthalene exhibited
very close KIL/S while biphenyl reported KIL/S of 81.
To do a comparison of the effect of carbon chain on the partition coefficient of both LI1 and IL2,
a plot of apparent partition coefficient against the number of carbons in the aliphatic chain was
drawn as shown in Figure 47. The IL2 clearly exhibited superior partition coefficient when
compared to IL1 due to the presence of heterocyclic aromatic ring that interacted with the π
electron cloud of the aromatic hydrocarbon homologous series. If one wishes to selectively
extract higher members of aromatic hydrocarbons from biphenyl, IL2 would serve as a target
selective extracting solvent under the specified experimental conditions. The KIL/S for
Naphthalene should be much higher than benzene for the IL2 as it has two fused rings. However
there was not much difference noticed between the two. The reason is that the extraction was
performed at 220C by salting out and the vapor pressure of naphthalene at this temperature is
low, causing less analyte concentration in vapor phase when compared to volatile benzene,
during the first equilibrium process of the IL-SHS SDME.
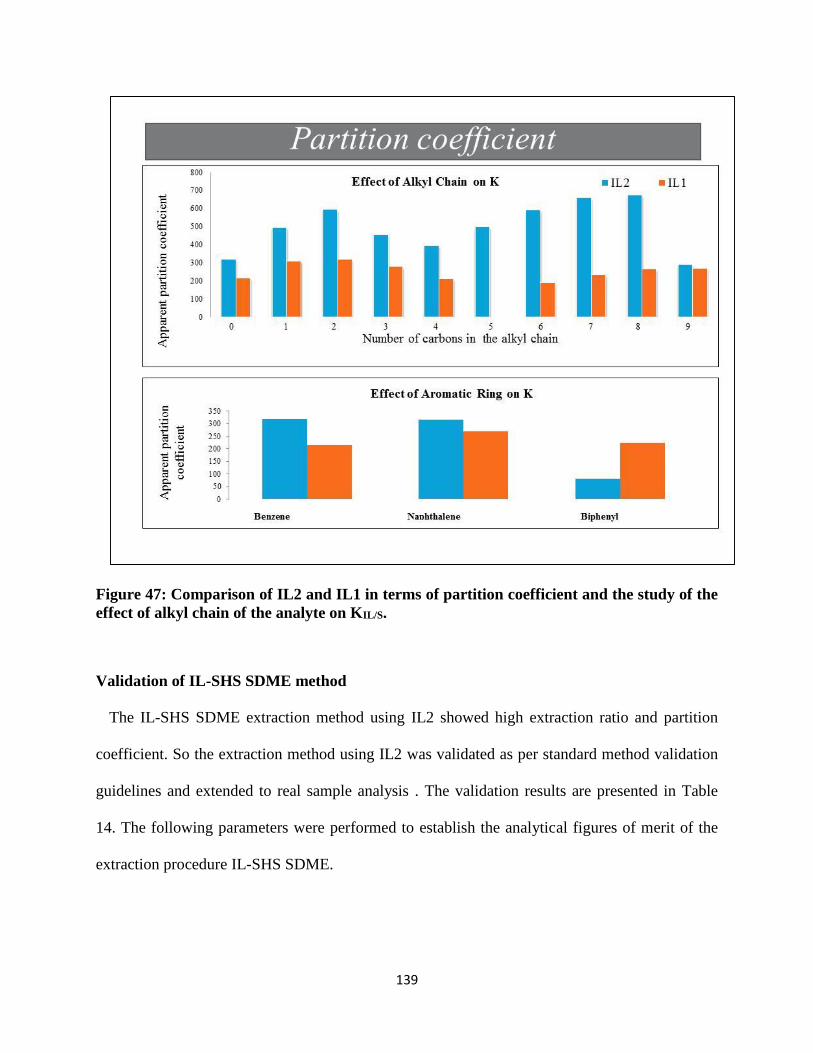
139
Figure 47: Comparison of IL2 and IL1 in terms of partition coefficient and the study of the
effect of alkyl chain of the analyte on KIL/S.
Validation of IL-SHS SDME method
The IL-SHS SDME extraction method using IL2 showed high extraction ratio and partition
coefficient. So the extraction method using IL2 was validated as per standard method validation
guidelines and extended to real sample analysis . The validation results are presented in Table
14. The following parameters were performed to establish the analytical figures of merit of the
extraction procedure IL-SHS SDME.

140
Table 16: Analytical figures of merit for IL-SHS SDME
Name Precision
%RSD
Accuracy
%Recovery±SD
Linearity
(60 pg L-1- 60 ng
mL-1)
Precision at QL
60 pg L-1
Benzene 4.3 89.0 ± 2 0.99527 12.7
Toluene 3.9 91 ± 1 0.99386 9.3
Ethyl benzene 3.6 91 ± 2 0.99152 7.3
Propyl benzene 3.2 91 ± 1 0.98210 13.0
Butyl benzene 3.2 91 ± 1 0.98224 7.5
Pentyl benzene 6.2 89 ± 1 0.99324 11.4
Hexyl benzene 3.4 94 ± 2 0.99650 11.7
Heptyl benzene 4.0 96± 2 0.98926 13.6
Octyl benzene 4.5 97 ± 2 0.98241 14.6
Nonyl benzene 5.5 98 ± 3 0.94856 18.0
Naphthalene 4.3 96 ± 1 0.98420 15.7
Biphenyl 2.9 96 ± 2 0.98001 8.1

141
Precision
The precision of an analytical procedure expresses the closeness of agreement (degree of
scatter) between a series of measurements obtained from multiple sampling of the same
homogeneous sample under the prescribed conditions. The precision of an analytical procedure
is usually expressed as the variance, standard deviation, %relative standard deviation or
coefficient of variation of a series of measurement. Repeatability is one form of precision
measurement. This was checked by performing extraction five times on five different vials, each
containing 60 ng mL-1 of the analyte in aqueous solution. The % relative standard deviation
were less than 6.5% for all the analytes showing the repeatability of the IL-SHS SDME method.
Accuracy
The accuracy of an analytical procedure expresses the closeness of agreement between the
value which is accepted either as a conventional true value or an accepted reference value and
the value found. To study the accuracy of the extraction method, the river water sample was
spiked with 60 ng mL-1 of the aromatic hydrocarbon standard in aqueous solution and the IL-
SHS SDME was performed. The (actual concentration/ theoretical concentration *100) gave the
% recovery which represented the accuracy of the method. The procedure was repeated by taking
10 ng mL-1 aromatic hydrocarbons in river water and spiking it with 50 ng mL-1 aromatic
hydrocarbon to it. This was repeated twice and the accuracy results reported in table 11 were the
average of the three % Recovery. The standard deviation of the three %recovery were calculated
and mentioned as the uncertainty.

142
Linearity and range
The specified range is normally derived from linearity studies and depends on the intended
application of the procedure. It is established by confirming that the analytical procedure
provides an acceptable degree of linearity, accuracy and precision when applied to samples
containing amounts of analyte within or at the extremes of the specified range of the analytical
procedure. The IL SHS SDME procedure was performed at five different concentrations. The
method was linear from 60 pg mL-1 to 60 ng mL-1 for most of the aromatic hydrocarbons. The R2
values are presented in table 14.
Limit of Quantitation (LOQ)
The quantitation limit of an individual analytical procedure is the lowest amount of analyte in a
sample which can be quantitatively determined with suitable precision and accuracy. Several
approaches for determining the quantitation limit are possible, depending on whether the
procedure is a non-instrumental or instrumental. Visual evaluation may be used for non-
instrumental methods but may also be used with instrumental methods. The quantitation limit is
generally determined by the analysis of samples with known concentrations of analyte and by
establishing the minimum level at which the analyte can be quantified with acceptable accuracy
and precision.
Based on the visual method, the limit of quantitation of The limit of quantitation 60 pg L-1 was
obtained. The chromatogram is shown in Figure 48. Even at such low level, clean and sharp
peaks were noticed. This is mainly because of the fast and complete mass transfer that happened
in the inlet due to the no interface sample introduction. Further, precision was performed at the

143
limit of quantitation and the % relative standard deviation was found to be less than 15.0% at 60
pg L-1 for all the analytes except naphthalene which showed a % relative standard deviation of
15.7 and nonyl benzene which showed a % relative standard deviation of of 18.0% . The
blanks injected before and after the injection did not show any carry over. This is the lowest
reported limit of quantitation using ionic liquid based extraction for aromatic hydrocarbons to the
best of our knowledge.86,87,91 Such low limit of quantitation was possible due to (1) the no
interface complete analyte transfer from inlet to the column (2) Efficient extraction using
appropriate ionic liquid containing π-π interaction. Faster equilibration of the headspace was
possible by using small vial and least possible headspace volume and use of ultrasonic bath prior
to the introduction of the extracting solvent.
Figure 48: Chromatogram of 60 pg L-1 of aromatic hydrocarbons in aqueous solution
extracted by IL-SHS SDME by using IL2.

144
Real sample analysis:
The real water samples were collected from different sources and examined for aromatic
hydrocarbon contamination. Public water collected from two different cities in New jersey and
one from New York city was examined. A river water from New Jersey was also examined. The
sample showed negative results to the aromatic hydrocarbon contamination. The river water
sample collected was spiked with 60 ng mL-1 of the aromatic hydrocarbons to determine the %
recovery. This was performed thrice and the standard deviation was represented as the error in
the recovery. The % recovery was between 88.9± 2.1 to 97.2 ± 2.4. In between each sample a
blank injection was performed to make sure that there was no carry over. The chromatogram is
presented in Figure 49.
Figure 49: Chromatogram of blank injection performed using milliQ water by IL-SHS
SDME by using IL2.
Usually, in solid phase microextraction, carry over is observed and there arises the need to bake
the fiber after each injection. However with IL-SHS SDME, the ionic liquid was taken freshly
for every extraction, extracted, suspended in the inlet, retracted back into the syringe after
3 . 0 0 4 . 0 0 5 . 0 0 6 . 0 0 7 . 0 0 8 . 0 0 9 . 0 0 1 0 . 0 0 1 1 . 0 0 1 2 . 0 0 1 3 . 0 0 1 4 . 0 0
0
1 0 0 0
2 0 0 0
3 0 0 0
4 0 0 0
5 0 0 0
6 0 0 0
7 0 0 0
8 0 0 0
T im e - - >
A b u n d a n c e
T I C : L I N 0 0 8 . D \ d a t a . m s

145
injection, and finally discarded into waste . Another notable point is that the inlet was run in
splitless mode and there was a continuous flushing of the inlet with carrier gas.
Conclusion
A time efficient IL-SHS SDME was performed using the ionic liquid: 1-Butyl-1-
methylpyrrolidinium bis(trifluoromethylsulfonyl)imide (IL1) and 1-Butyl-3-methylimidazolium
bis(trifluoromethylsulfonyl)imide (IL2) (50% less time than the previous reported value 87) . A
true no interface sample introduction was performed to introduce the ionic liquid into the gas
chromatographic inlet. The ionic liquid /water apparent partition coefficient (KIL/S) of aromatic
hydrocarbons were determined by depletion study. The KIL/S ranged from 187 ( for Hexyl
benzene) to 318 (for ethyl benzene) using IL1, whereas IL2 showed KIL/S in the range 81±11 (
for biphenyl) to 670±9 (for Octyl benzene) IL2 showed superior extraction ratio and KIL/S. So ,
the IL-SHS SDME method using IL2 was extended to quantitative analysis and wasfound to be
precise with % relative standard deviation (RSD) less than 6.0% for all analytes, recovery of 89
±2% to 96±2%. The method was linear from 60 pg L-1 to 60 ng mL-1.The limit of quantitation
were 60 pg L-1. The extraction method was applied to real samples like drinking water and river
water and aromatic hydrocarbons were not detected in any of these samples.

146
Chapter 5: Ionic Liquid Static Headspace Single Drop Micro Extraction (IL-SHS SDME)
and Submerged Single Drop Microextraction (IL-SSDME) of Aromatic Hydrocarbons
from Water

147
Introduction
Having known the versatility of ionic liquids, their applications in microextraction branched
enormously. Direct immersion (DI) of solvent drop into the aqueous sample is a generally
applicable mode of performing SDME. Here, the needle of a 10 µL syringe containing 1–3 µL of
water immiscible organic solvent is penetrated through the septum of the vial until the tip
protrudes below the meniscus of sample solution. The plunger is depressed to cause the solvent
to form a drop suspended from the needle tip. After equilibration for a pre-determined period of
time, whilst the solution is being continuously stirred, the drop is retracted back into the syringe
and immediately subjected to analysis by instrumental methods. For solvent drop stability during
extraction, it was important to remove any insoluble or particulate matter from the sample
sample, choose an organic solvent that is least soluble in water and has low vapour pressure but
has optimum extraction efficiency for analyte, and work at a stirring rate so that the drop is not
dislodged. Since a water immiscible solvent is used, DI-SDME was subjected to analysis by GC
method 92. n-Octane93 and toluene 94 gave best extraction efficiency for non-polar compounds,
whereas chloroform was used to extract polar alkaloids 95, and analysis by GC. One application
analyzed 3 μL of toluene extract by reversed-phase HPLC, selected among other non-polar
solvents such as xylene, tetrachloroethane, and iso-octane96. However, only one compound,
decabromodiphenyl ether, was analyzed that simplified the chromatography. Dibutyl phthalate
was used in DI-SDME and found to have good compatibility with the mobile phase in reversed-
phase HPLC97 . The main shortcoming of the DI-SDME process is the instability of the drop
when an organic solvent is used as extractant. This fact limits the usable volume of the extracting
medium, affecting directly the precision and also the sensitivity of the analysis.
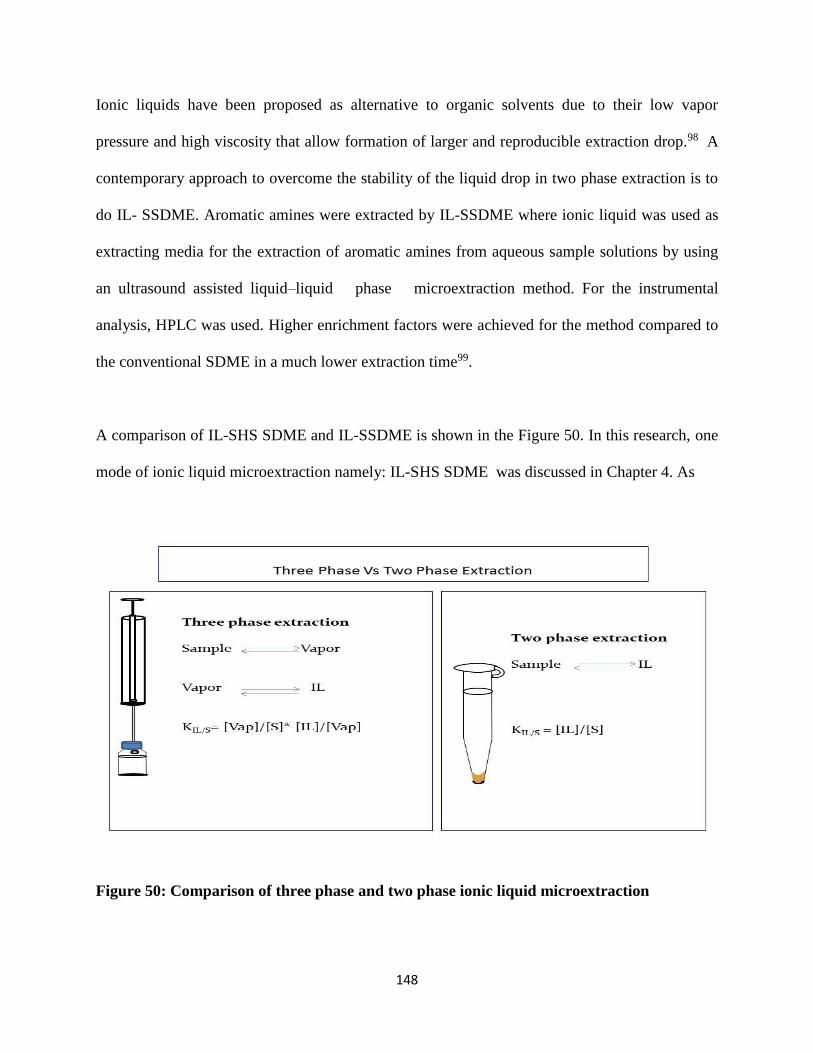
148
Ionic liquids have been proposed as alternative to organic solvents due to their low vapor
pressure and high viscosity that allow formation of larger and reproducible extraction drop.98 A
contemporary approach to overcome the stability of the liquid drop in two phase extraction is to
do IL- SSDME. Aromatic amines were extracted by IL-SSDME where ionic liquid was used as
extracting media for the extraction of aromatic amines from aqueous sample solutions by using
an ultrasound assisted liquid–liquid phase microextraction method. For the instrumental
analysis, HPLC was used. Higher enrichment factors were achieved for the method compared to
the conventional SDME in a much lower extraction time99.
A comparison of IL-SHS SDME and IL-SSDME is shown in the Figure 50. In this research, one
mode of ionic liquid microextraction namely: IL-SHS SDME was discussed in Chapter 4. As
Figure 50: Comparison of three phase and two phase ionic liquid microextraction

149
represented in the left side of the figure, IL-SHS SDME involved a three phase extraction
involving two equilibrium processes. The first equilibrium exists between the sample and the
vapor phase.
KVap/S = [Vap]/[S] Equation (25)
Where KVap/S is the partition coefficient of the analyte between the sample aqueous phase and the
vapor phase, [Vap]and [S] are the concentration of the analyte in the vapor phase and sample
aqueous phase.
The second equilibrium exists between the vapor phase and the ionic liquid.
KIL/Vap = [IL]/[Vap] Equation (26)
Where KIL/Vap is the partition coefficient of the analyte between vapor phase and the ionic liquid,
[IL] is the concentration of the analyte in the ionic liquid phase.
Over all, the ionic liquid-sample partition coefficient KIL/S is the product of Equation (25) and
Equation (26)
KIL/S = KVap/S * KIL/Vap = [Vap]/[S] * [IL]/[Vap] = [IL]/ [S] Equation (27)
IL-SSDME is shown in the right side of Figure 50 and is a liquid- liquid extraction which uses a
microliter volume of the acceptor phase (ionic liquid) and is a two phase extraction . The
partition coefficient KIL/S is given by

150
KIL/S = [IL]/ [S] Equation (28)
Comparing Equation (27) Equation(28) it is inferred that , If both the extractions are optimized
to equilibrium condition, the end result KIL/S for the two phase and the three phase extraction
should be the same irrespective of the number of equilibrium processes involved in the extraction
at a given temperature. This work is intended to compare the two extractions IL-SHS SDME
and IL SSDME in terms of their partition coefficient
Objective
Figure 51 outlines the key objectives of the experiment. In Chapter 4, the IL-SHS SDME.
Figure 51: Objectives of the experiment
IL-SSDME Vs IL-SHS SDME for aromatic hydrocarbons using IL2
Depletion study
Comparison of KIL/S

151
method was optimized to equilibrium conditions and the partition coefficient data was discussed.
It was seen that the IL2 exhibited superior extraction ratio and partition coefficient compared to
IL1. Taking this into consideration, IL2 was chosen for the IL-SSDME. The objective of the
present study was to compare IL-SHS SDME and IL SSDME in terms of their partition
coefficient using IL2 as the extracting solvent. The practical difference between the two
extraction procedure in terms of the extraction time, ease to perform the experiment were also
compared.
Experimental
Materials used
Ultrapure water was generated in the laboratory by a MilliQ Plus Ultra (Billerica, MA). Ionic
liquids: 1-Butyl-3-methylimidazolium bis(trifluoromethylsulfonyl)imide, aromatic hydrocarbons
and all other chemicals used for the extraction were purchased from Sigma-Aldrich (St. Louis,
MO). The ionic liquid column SLB-IL 76 was donated by Supelco Sigma-Aldrich (St. Louis,
MO). The ultra inert low pressure drop liner with deactivated glass wool was supplied by Restek
(Bellefonte, PA). A 25 µL syringe with blunt needle tip and teflon tip plunger, a 10 µL syringe
with teflon tip plunger and bevel tip needle of 22gauge were purchased from Hamilton
(Switzerland) . An ultra sound bath from Cole Palmer (Vernon Hills, IL) was used.
Standard and sample preparation
A stock solution of 100 µg mL-1 of each naphthalene, biphenyl, benzene, toluene, ethyl benzene,
propyl benzene, butyl benzene, pentyl benzene, hexyl benzene, heptyl benzene, octyl benzene
and nonyl benzene were prepared in methanol. Further dilutions were made as per the

152
concentration required. The final dilution in every case was made by spiking appropriate quantity
of standard in a 2 mL microcentrifuge tubes containing 1.5 ml of 200 mg mL-1 aqueous sodium
chloride solution made in Millipore water .
IL- SSDME procedure
The ILSHS SDME was performed as shown in the schematic in Figure 51. Step A involved
taking 10.0 µL of 1-Butyl-3-methylimidazolium bis(trifluoromethylsulfonyl)imide in a 25.0 µL
syringe having teflon tip plunger and blunt tip needle. Further in Step B the 10.0 µL ionic liquid
was dispensed into a microcentrifuge tube containing 1.5 mL of the aqueous analyte
Figure 52: Schematic representation of IL-SHS SDME

153
containing 200 mg mL-1 of sodium chloride in it. This was sonicaated in an ultrasound bath for
3.0 minutes. After the extraction, the tube was centrifuged at 12000 rpms for 2.0 min to separate
layers which is shown in step C. Since the ionic liquid considered for the present study was
denser than water, it formed the lower layer and hence the name IL-SSDME (ionic liquid-
submerged single drop microextraction) was given to the extraction procedure Finally, in step D,
the ionic liquid was retracted using the blunt tip microsyringe and dispensed into a small volume
sample holder. For sample introduction, 2.0 µL of the ionic liquid containing the extracted
analyte was taken from the small volume sample holder using a 10.0 µL syringe with beveled
tip. For the sample introduction into the gas chromatographic inlet, no interface sample
introduction procedure described in Figure 33 of Chapter 4 was adopted.
GC/MS Parameters
The GC/MS analysis was performed using a 6890A GC coupled to 5973 MS detector system
(Agilent Technologies, Palo Alto, CA, USA). The analysis was carried out in constant flow
mode with a flow rate of 1 mL min-1. The ionic liquid column SLB-IL 76, 30 m x 0.25 mm x
0.20 µm was installed in the GC oven. All injections were performed in splitless mode. The inlet
temperature was set at 300 ºC. The oven temperature program was 35 ºC (hold for 1 min)
increased at the ramp of 20 ºC min-1 up to 225 ºC (hold for 4.5 min) with a total run time of 15
min. Transfer line, ion source and quard temperatures were set at 270, 250 and 150 ºC
respectively. A quadrupole MSD was operated in single ion monitoring (SIM) during runs . In
the SIM, 78, 91, 128 and 154 m/z were chosen as the quantitative ions.
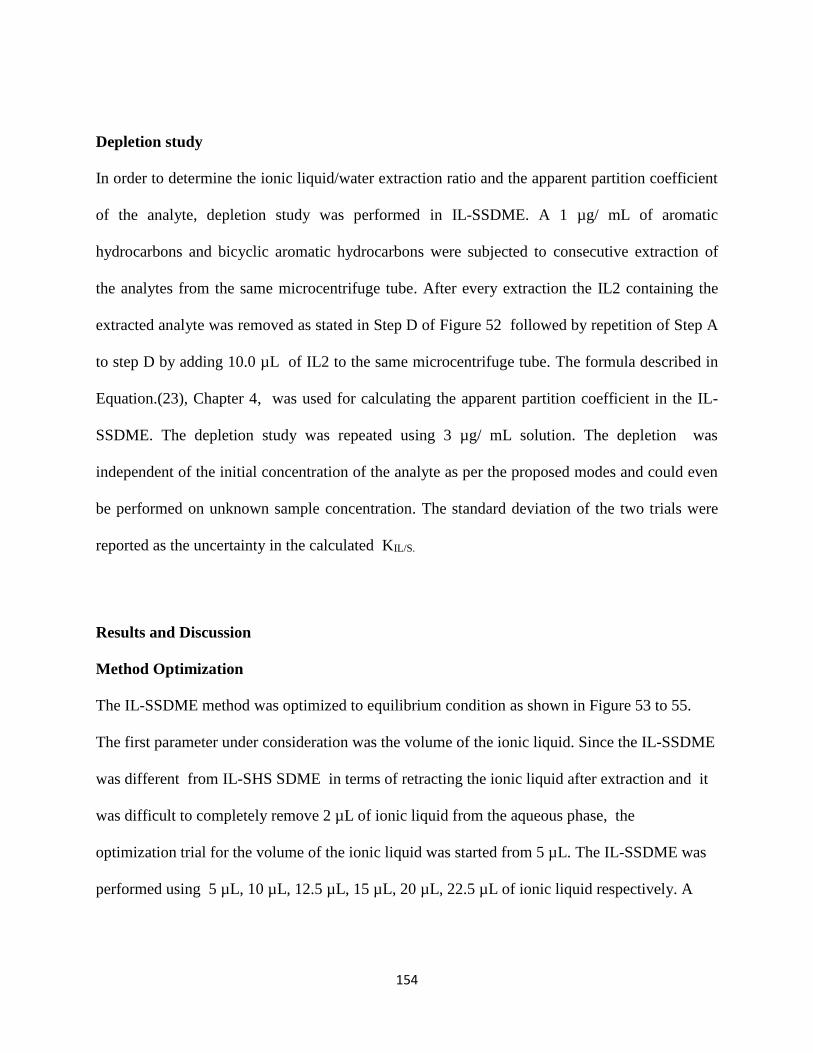
154
Depletion study
In order to determine the ionic liquid/water extraction ratio and the apparent partition coefficient
of the analyte, depletion study was performed in IL-SSDME. A 1 µg/ mL of aromatic
hydrocarbons and bicyclic aromatic hydrocarbons were subjected to consecutive extraction of
the analytes from the same microcentrifuge tube. After every extraction the IL2 containing the
extracted analyte was removed as stated in Step D of Figure 52 followed by repetition of Step A
to step D by adding 10.0 µL of IL2 to the same microcentrifuge tube. The formula described in
Equation.(23), Chapter 4, was used for calculating the apparent partition coefficient in the IL-
SSDME. The depletion study was repeated using 3 µg/ mL solution. The depletion was
independent of the initial concentration of the analyte as per the proposed modes and could even
be performed on unknown sample concentration. The standard deviation of the two trials were
reported as the uncertainty in the calculated KIL/S.
Results and Discussion
Method Optimization
The IL-SSDME method was optimized to equilibrium condition as shown in Figure 53 to 55.
The first parameter under consideration was the volume of the ionic liquid. Since the IL-SSDME
was different from IL-SHS SDME in terms of retracting the ionic liquid after extraction and it
was difficult to completely remove 2 µL of ionic liquid from the aqueous phase, the
optimization trial for the volume of the ionic liquid was started from 5 µL. The IL-SSDME was
performed using 5 µL, 10 µL, 12.5 µL, 15 µL, 20 µL, 22.5 µL of ionic liquid respectively. A

155
histogram of peak area against the volume of ionic liquid was plotted as shown in Figure 53. It
was found that the peak area started reducing after 10 µL and 10 µL gave the maximum peak.
Figure 53: Optimization of method parameters of IL-SSDME using IL2 as extracting
solvent.
The sonication time or the extraction time was optimized by performing the extraction for 2, 3, 4
and 5 min respectively. The histogram of peak area against sonication time is represented in
Figure 54. It was observed that 3 and 4 min extraction showed almost similar peak area. So 3
min was chosen as the optimum extraction time.
0
5000000
10000000
15000000
20000000
25000000
7.5 10 12.5 15 20 22.5
Pe
ak A
rea
Volume of Ionic liquid (µL)
Optimization of the volume of Ionic liquid
Benzene
Toluene
Ethyl Benzene
Propyl benzene
Butyl benzene
Biphenyl
Naphthalene

156
Figure 55. shows the effect of salt concentration on the extraction. It was noticed that the
extraction without salt showed better response than that with salt. The peak area reduced with the
addition of salt. However the intended purpose of the analysis was to compare the partition
Figure 54: Optimization of sonication time in IL-SSDME
coefficient in IL-SSDME with the IL- SHS SDME which employed a salt concentration of 200
mg mL-1.So the salt concentration was still maintained as 200 mg mL-1 for IL-SSDME.
The optimized volume of IL2 for IL-SSDME was 10 µL, the extraction time or the sonication
time was optimized was 3.0 min and the salt concentration was 200 mg/mL sodium
chloride.Thus the IL-SSDME was a very quick extraction compared to IL-SHS SDME.
0
2000000
4000000
6000000
8000000
10000000
12000000
14000000
2 3 4 5
Optimization of Sonication Time
Benzene
Toluene
Ethyl Benzene
Propyl Benzene
Butyl Benzene
Biphenyl
Naphthalene
Pe
ak A
rea
Sonication time (min)

157
Figure 55: Effect of salt concentration on IL-SSDME
Apparent partition coefficient by depletion study in IL-SSDME:
To understand IL-SSDME and to explore the differences from IL-SHS SDME, depletion study
was performed using ionic liquid 1-Butyl-3-methylimidazolium The Equation (23) presented in
Chapter 4 was used for calculating the apparent partition coefficient. Since the amount of
analytes extracted was proportional to the peak area, the peak area started to reduce
exponentially with number of extraction. A plot of logarithm peak area against extraction
number was made and were linear with a correlation coefficient greater than 0.98 for the
aromatic hydrocarbons. The depletion plots for aromatic hydrocarbons using IL1 are shown in
Figure 29. and that of bicyclic aromatic hydrocarbons using IL1 are shown in Figure 30.
Biphenyl showed R2 value of 0.95while all other analytes showed R2 greater than 0.98. It was
0
5000000
10000000
15000000
20000000
25000000
0 25 50
Pe
ak A
rea
Sodium chloride Concentration (mg/ml )
Effect of salt concentration on IL-SSDME
Benzene
Toluene
Ethyl benzene
Propyl benzene
Butyl benzene
Biphenyl
Naphthalene

158
also observed that biphenyl showed better correlation coefficient in IL-SSDME than IL SSDME
while performing depletion studies. This is because biphenyl is less volatile and its vapor
pressure is less and gave poor response in IL-SSDME, while in SSDME it is in direct contact
with the extracting ionic liquid and depleted better. The slope of the linear regression gave log(1-
E), from which the extraction ratio (E) was calculated. By applying the volume of the extracting
ionic liquid (10 µL), volume of the aqueous phase (1.5 mL) and the extraction ratio to Equation
(23), the ionic liquid/ water apparent partition coefficient of aromatic hydrocarbons in the two
phase extraction were calculated. Based on the Figure 56 and 57, it was clear that the slope of
some of the hydrocarbons were different from the other. The slope for naphthalene, biphenyl and
benzene were very different from each other

159
Figure 56: Depletion of analytes during consecutive extraction of aromatic hydrocarbons
in IL-SSDME using 1-Butyl-1-methylpyrrolidinium bis(trifluoromethylsulfonyl)imide as
extracting ionic liquid.
5
5.5
6
6.5
7
7.5
8
0 1 2 3 4 5 6
Lo
g (
pea
k a
rea
)
Extraction number
Depletion Study in IL-SSDME for Aromatic Hydrocarbons
Nonyl benzene Benzene Toluene Ethyl benzene Propyl benzene
Butyl benzene Pentyl benzene Hexyl benzene Heptyl benzene Octyl benzene

160
Figure 57: Depletion of analytes during consecutive extraction of bicyclic aromatic
hydrocarbons in IL-SSDME using 1-Butyl-1-methylpyrrolidinium
bis(trifluoromethylsulfonyl)imide as extracting ionic liquid.
Referring to Table 15, the highest KIL/S was observed for heptyl benzene and the lowest was
for benzene. Biphenyl showed the lowest KIL/S among the bicyclic aromatics, and Naphthalene
showed the highest KIL/S . Compared to benzene, biphenyl showed half the KIL/S, while
Naphthalene showed more than double the KIL/S of benzene. Considering the structure of IL2, the
butyl chain and the imidazolium hetero aromatic ring are the main source of interaction. The
KIL/S started to increase from benzene to butyl benzene, then plateaus out as expected.
hydrocarbon. There was not a considerable difference in the KIL/S in the homologous series. This
was because the length of the linkage group alkyl chain in the IL2 had only 4 carbons in it. The
6
6.2
6.4
6.6
6.8
7
7.2
7.4
7.6
0 1 2 3 4 5 6
Lo
g (
pea
k a
rea
)
Extraction number
Depletion Study in IL-SSDME for Bicyclic
Aromatic Hydrocarbons
Naphthalene Biphenyl

161
π-π was the primary and the stronger interaction and dispersive interaction was the less strong
secondary interaction. Since all the aromatic hydrocarbons had the same aromatic moiety and the
Table 17: Apparent coefficient in IL-SSDME using 1-Butyl-3-methylimidazolium
bis(trifluoromethylsulfonyl)imide at 22 °C
Name
IL-SSDME (Two phase extraction) 220C
E± STDEV K ± STDEV
Benzene 0.27±0.01 57±1
Toluene 0.44±0.01 121±3
Ethyl benzene 0.59±0.02 215±19
Propyl benzene 0.67±0.04 309±54
Butyl benzene 0.68±0.04 325±59
Pentyl benzene 0.67±0.03 311±49
Hexyl benzene 0.64±0.02 270±21
Heptyl benzene 0.61±0.01 237±5
Octyl benzene 0.60±0.01 223±10
Nonyl benzene 0.59±0.01 220±1
Naphthalene 0.48±0.02 137±10
Biphenyl 0.16±0.03 28±6

162
only differentiation was the alkyl chain in them, the ionic liquid tried to interact alike in terms of
π-π interaction and at the same time distinguished them based on its four membered alkyl chain’s
interaction with the analyte. After butyl benzene there was not much difference in KIL/S taking
the error bars into consideration. This was well illustrated when plot of KIL/S against the number
of carbons in the alkyl chain was made as shown in Figure 58. In other words the 4 carbon alkyl
chain in the ionic liquid was able to differentiate 0 to 4 alkyl chains whereas is saw 5 to 9 carbon
alkyl chain in the same manner as the 4 carbon alkyl chain during IL-SSDME.
Figure 58: Study of the effect of the alkyl chain on the partition coefficient in IL-SSDME
using IL2 as the extracting medium.
57
121
215
309 325
311
270
237223 220
IL -SSDME
Ap
pare
nt
Part
itio
nC
oeff
icie
nt
(K)
0 1 2 3 4 5 6 7 8 9
Number of carbon in the aliphatic chain

163
The side by side comparison of IL-SHS SDME and IL-SSDME was done on the basis of KIL/S
for aromatic hydrocarbons using the IL2 as illustrated in Figure 59. The primary observation
was that IL-SSDME exhibited superior KIL/S compared to IL-SSDME, contradicting the expected
outcome of the experiment. Theoretically, both the three phase and the two phase
Figure 59: Comparison of IL-SHS SDME and IL-SSDME in terms of the partition
coefficient of aromatic hydrocarbons using IL2 as the extracting medium.
extractions should give the same KIL/S at the given temperature using the same ionic liquid. The
trend was also explained clearly in terms of the free energy change associated with the phase
transfer of the analyte. The –ΔGIL/S in KJ/mole were calculated using Equation (4) in Chapter 1.
318
494
594
453
394
497590
659
673
330
57
121
215
309325
311270
237 223 220
IL-SHS SDME Vs IL -SSDME
IL- SHS SSDME IL- SSDME
Part
itio
nC
oeff
icie
nt
(K)
0 1 2 3 4 5 6 7 8 9
Number of carbon in the aliphatic chain

164
A plot of –ΔGIL/S was plotted against the number of carbons in the alkyl chain in the aromatic
hydrocarbons for IL-SHS SDME and ILSSDME as shown in Figure 60. It was clearly seen that
the –ΔGIL/S increased initially and plateaued after 3 carbon alkyl chain for SSDME. While for
SSDME, peak valley and again a peak was observed. The three phase equilibrium was more
spontaneous as indicated by higher –ΔGIL/S value. The gap between the blue and red line
indicated the difference in the spontaneity of the three phase and two phase equilibrium. For 3, 4
and 5 carbon alkyl chains, the –ΔGIL/S are very close for IL-SHS SDME and IL-SSDME
Figure 60: Comparison of IL-SHS SDME and IL-SSDME in terms of –ΔGIL/S of aromatic
hydrocarbons using IL2 as the extracting medium.
The anticipated reasons for lower KIL/S in IL-SSDME are summarized as follows . (i) The ionic
liquid could have degraded and /or slightly soluble in the liquid phase. This reason was
supported by the sonication time optimization and effect of salt concentration represented in
Figure 53 and Figure 55, that showed decrease in peak area upon extraction for 5.0 min and
89
101112131415161718
0 1 2 3 4 5 6 7 8 9 10
-ΔG
IL/S
(K
J/m
ole
)
Number of carbons in the alkyl chain
Comparison of IL-SHS SDME and IL-SSDME
IL-SSDME IL-SHS SDME

165
decrease in peak area with salt concentration respectly. (ii) The added sodium chloride directly
interacted with the cation and the anion of the ionic liquid suppressing the partition coefficient of
the aromatic hydrocarbon. (iii) the analytes tend to escape to the vapor phase during the
sonication process while dispersing the ionic liquid while it favored in IL-SHS SDME by
increasing the concentration of the analytes in the vapor phase. (iv) in IL-SHS SDME, the
headspace vapor/ ionic liquid equilibrium kinetics might be faster than the ionic liquid /sample
or vapor/ionic liquid kinetics. (v) The polar groups of ionic liquid is surrounded by the polar
water molecule and the ionic liquid becomes wet. Aromatic hydrocarbons being hydrophobic are
less soluble in wet ionic liquid thereby reducing KIL/S in IL-SSDME.

166
Figure 61: Comparison of IL-SHS SDME against IL-SSDME in terms of the partition
coefficient of benzene, naphthalene and biphenyl using IL2 as the extracting medium.

167
The Comparison of IL-SHS SDME against IL-SSDME in terms of the partition coefficient of
benzene, naphthalene and biphenyl using IL2 is shown in Figure 61. The trend was better
explained in terms of –ΔGIL/S as shown in Figure 62.
Figure 62: Comparison of IL-SHS SDME against IL-SSDME in terms of –ΔGIL/S
coefficient of benzene, naphthalene and biphenyl using IL2 as the extracting medium.
It was seen that there was gap in between the red and the blue line The gap between the the two
extractions indicated the difference in the spontaneity of the three phase and two phase
equilibrium. Considering the blue line, the –ΔGIL/S was higher for naphthalene (2 fused benzene
rings) compared to benzene in IL-SSDME while biphenyl (two attached benzene rings attached)
showed least value. The reason could be that the ionic liquid in liquid phase could interact with
6
8
10
12
14
16
18
-ΔG
IL/S
KJ/
mo
le)
Comparison of IL-SHS SDME and IL-SSDME
Series1 Series2
Benzene Naphthalene Biphenyl
IL-SSDME IL-SHS SDME
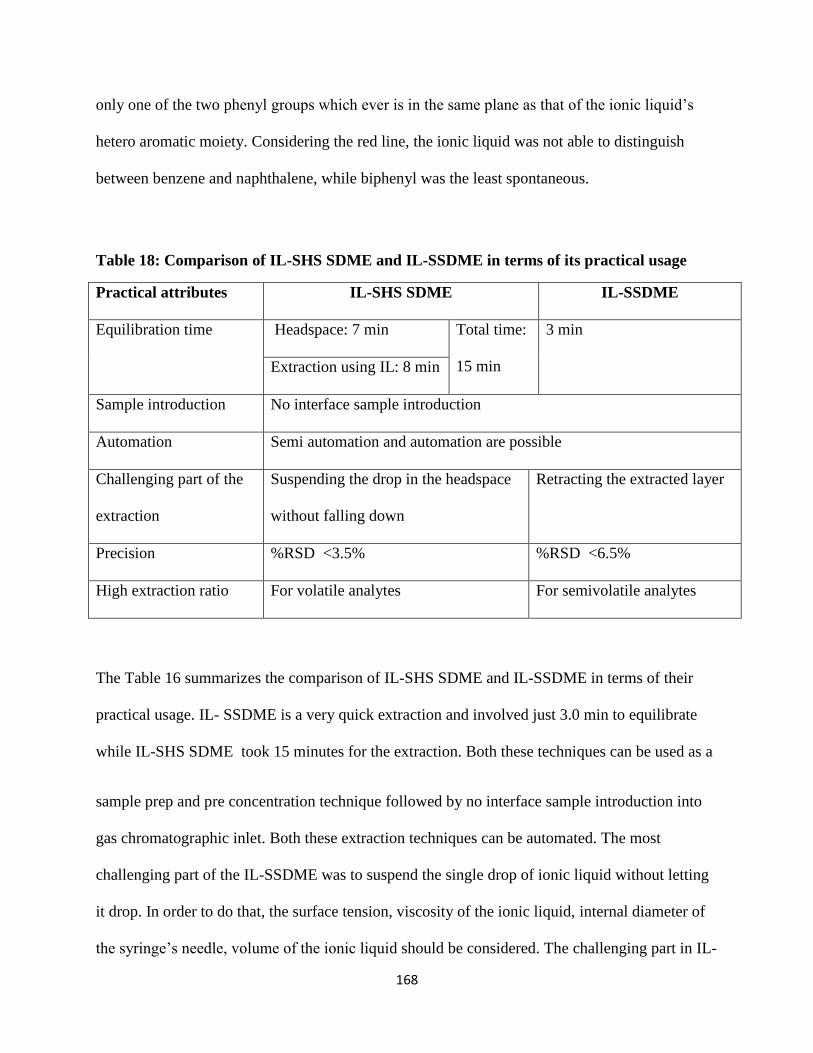
168
only one of the two phenyl groups which ever is in the same plane as that of the ionic liquid’s
hetero aromatic moiety. Considering the red line, the ionic liquid was not able to distinguish
between benzene and naphthalene, while biphenyl was the least spontaneous.
Table 18: Comparison of IL-SHS SDME and IL-SSDME in terms of its practical usage
Practical attributes IL-SHS SDME IL-SSDME
Equilibration time Headspace: 7 min Total time:
15 min
3 min
Extraction using IL: 8 min
Sample introduction No interface sample introduction
Automation Semi automation and automation are possible
Challenging part of the
extraction
Suspending the drop in the headspace
without falling down
Retracting the extracted layer
Precision %RSD <3.5% %RSD <6.5%
High extraction ratio For volatile analytes For semivolatile analytes
The Table 16 summarizes the comparison of IL-SHS SDME and IL-SSDME in terms of their
practical usage. IL- SSDME is a very quick extraction and involved just 3.0 min to equilibrate
while IL-SHS SDME took 15 minutes for the extraction. Both these techniques can be used as a
sample prep and pre concentration technique followed by no interface sample introduction into
gas chromatographic inlet. Both these extraction techniques can be automated. The most
challenging part of the IL-SSDME was to suspend the single drop of ionic liquid without letting
it drop. In order to do that, the surface tension, viscosity of the ionic liquid, internal diameter of
the syringe’s needle, volume of the ionic liquid should be considered. The challenging part in IL-

169
SSDME was retracting the ionic liquid into the syringe after the extraction, especially if the
volume of the IL droplet is less than 3µL. Since IL-SSDME involves less labor intensive work
than IL-SHS SDME, it showed better repeatability than the later.
Conclusion
A time efficient IL-SSDME method was developed which took 3.0 min for extraction. The IL-
SSDME method was precise with %RSD less than 3.5% for all analytes. The apparent partition
coefficient was determined by depletion studies. The highest KIL/S was observed for Butyl
benzene (325 ± 59) and the lowest KIL/S was observed for benzene (57 ± 1) among the aromatic
hydrocarbons . While biphenyl showed the lowest KIL/S ( 28±6), benzene (57±1) and
naphthalene showed the highest K IL/S (137±10) among mono and bicyclic aromatic
hydrocarbons. As expected the KIL/S started to plateau after 4 carbon alkyl chain. A comparison
of IL-SHS SDME and IL-SSDME was made in terms of their partition coefficient. Theoretically,
both were expected to show same KIL/S .In actual IL-SHS SDME showed superior extraction
ratio and KIL/S. The trend was well explained in terms of –ΔG IL/S. The plot of –ΔG IL/S against
number of carbons in the alkyl chain for ILSSDME showed a clear plateau after 3 carbon alkyl
chain while the IL-SHS SDME showed a peak and valley followed by another peak . This trend
in IL SHS SDME could be because of the preference of the aromatic hydrocarbon’s alkyl chain
and aromatic ring in vapor phase to interact with either the alkyl chain or the hetero aromatic
moiety . The observed decrease in KIL/S in IL-SSDME could be because of the
solubility/degradation of ionic liquid in aqueous medium, effect of sodium chloride, analytes
escaping to vapor phase.

170
Chapter 6: Merits, demerits and future of the applications of ionic liquids in analytical
separation science

171
Special features of the IL-SDME
The key features of the ionic liquid single drop micro extraction are described in Figure 63. The
IL-SHS SDME was a fast extraction method which took just 15 min to equilibrate. No interface
sample introduction was performed by using a splitless inlet. This greatly simplifies automation
and use of the method. Also the lack of a separate interface helped in fast and direct mass
transfer of the analyte to the column, improving sensitivity and peak width. The use of ionic
liquids for the extraction and stationary phase for the chromatographic separation, was
demonstrated. The partition coefficient determined by depletion study served as a tool to choose
the ionic liquid for an intended purpose. The LOQ reported are in ppq and it extends the use of
ionic liquids to ultra trace level analysis even with simple instrumentation.
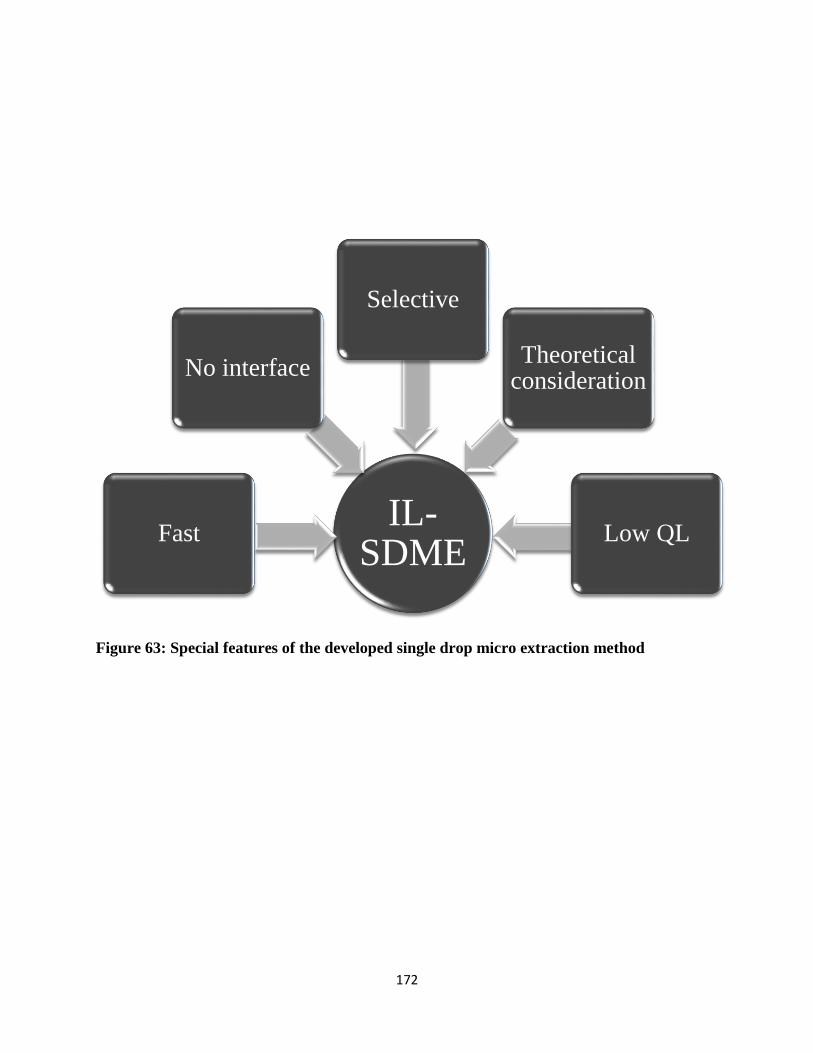
172
Figure 63: Special features of the developed single drop micro extraction method
IL-SDME
Fast
No interface
Selective
Theoretical consideration
Low QL

173
Draw backs of ionic liquid based extractions
Ionic liquids are definitely a green alternates to conventional sample preparation and pre
concentration procedures. There is additional research needed in several areas. Purification by
sparging with high purity nitrogen as discussed by von Wald et al. is effective but
inconvenient100. The commercially available ionic liquids with better purity or simpler methods
of purifying them in the lab need to be developed. There are numerous ionic liquids that are
commercially available but there is not an effective way to classify them based on their solvation
properties. Solution–vapor partition coefficients vary considerably for analytes dissolved in ionic
liquids. Much further study of liquid–vapor partitioning is therefore needed to aid in the selection
and method development process. Compared to other solvents, ILs have relatively high cost to
purchase and purify. This could be addressed only if more vendors are ready to manufacture
ionic liquids in bulk in order to use them as green alternatives to conventional solvents .
Conclusion
Room temperature ionic liquids are ionic species that are liquid at room temperature. Their
physic-chemical properties can be tailored by changing the combination of cation, anion and the
side chain. They have negligible vapor pressure, wide liquid range, thermal stability and exhibit
unique selectivity . They find many applications in the field of analytical chemistry. In this
research , the applications of ionic liquid as gas chromatographic stationary phase and as
medium for microextractions, were explored.

174
Ionic liquid stationary phases are attractive alternatives to conventional polyethylene glycol
stationary phases. Due to the dual nature of ionic liquid, they are suitable for the saparation of
polar and non polar analytes. To explore the retention of alkanes and aromatic hydrocarbons, the
distribution constant at different temperature were determined for alkanes and aromatic
hydrocarbons on commercially available ionic liquid stationary phases. Thermodynamic
parameters for the chromatographic process using ionic liquid stationary phase were evaluated.
The retention mechanism was predominantly partitioning for the alkanes. At lower temperature,
for higher member of alkanes in the homologous series, there was considerable amount of
adsorption along with the partition. The polarity number was not linearly related to the ΔG for
alkanes while it was linearly related to the length of the alkyl chain present in the linkage group
of the ionic liquid. For aromatic hydrocarbons, huge difference in Kc was observed between 15
m and 30 m. SLB-IL 100 stationary phase indicating mixed mechanism of adsorption and
partition. The retention of alkanes and aromatic hydrocarbons on ionic liquid stationary phase
were compared with polyethyleneglycol stationary phase in terms of their polarity number. The
ambiguity in the calculated polarity number was established from the plot of thermodynamic
parameters against the polarity number.
Air was successfully employed as the carrier gas for gas chromatographic analysis using ionic
liquid as the stationary phase. Ionic liquid stationary phase SLB-IL 100 did not have any active
hydroxyl group in its structure and was stable to oxidation. The thermodynamic properties of
retention of aromatic hydrocarbons on ionic liquid stationary phase SLB-IL 100 using air as
carrier gas were determined. This was compared with the thermodynamic properties of aromatic
hydrocarbons, obtained using helium as carrier gas. The Kc values were different from air and

175
Helium. In literature it was reported before that there would be change in the partition coefficient
with change in the carrier gas. The kinetics of the chromatographic process using air as carrier
gas was also studied. The study showed that air when used as carrier gas had a lower optimum B
term over a very narrow range and a dominant C term. So air could not be used for fast GC
applications. However air served as the cheap alternate to helium or hydrogen. Further air was
used as the carrier gas to separate xylene isomers and a clear base to base separation of o, m, p-
xylene was achieved using SLB-IL 100 stationary phase. The ionic liquid column with air as
carrier gas was installed in the gas chromatographic instrument for six months continuously and
showed consistent retention, peak shape and no ghost peaks, thus demonstrated the stability of
ionic liquid stationary phase SLB-IL 100 even under extreme conditions. This feature would
open new doors to the analysis of sample using air as carrier gas for field samples.
A time efficient IL-SHS SDME was performed using the ionic liquid: 1-Butyl-1-
methylpyrrolidinium bis(trifluoromethylsulfonyl)imide (IL1) and 1-Butyl-3-methylimidazolium
bis(trifluoromethylsulfonyl)imide (IL2) (50% less time than the previous reported value 87) . A
true no interface sample introduction was performed to introduce the ionic liquid into the gas
chromatographic inlet. The ionic liquid /water apparent partition coefficient (KIL/S) of aromatic
hydrocarbons were determined by depletion study. The KIL/S ranged from 187 ( for Hexyl
benzene) to 318 (for ethyl benzene) using IL1, whereas IL2 showed KIL/S in the range 81±11 (
for biphenyl) to 670±9 (for Octyl benzene) IL2 showed superior extraction ratio and KIL/S. So ,
the IL-SHS SDME method using IL2 was extended to quantitative analysis and wasfound to be
precise with % relative standard deviation (RSD) less than 6.0% for all analytes, recovery of 89
±2% to 96±2%. The method was linear from 60 pg L-1 to 60 ng mL-1.The limit of quantitation

176
were 60 pg L-1. The extraction method was applied to real samples like drinking water and river
water and aromatic hydrocarbons were not detected in any of these samples.
A time efficient IL-SSDME method was developed which took 3.0 min for extraction. The IL-
SSDME method was precise with %RSD less than 3.5% for all analytes. The apparent partition
coefficient was determined by depletion studies. The highest KIL/S was observed for Butyl
benzene (325 ± 59) and the lowest KIL/S was observed for benzene (57 ± 1) among the aromatic
hydrocarbons . While biphenyl showed the lowest KIL/S ( 28±6), benzene (57±1) and
naphthalene showed the highest K IL/S (137±10) among mono and bicyclic aromatic
hydrocarbons. As expected the KIL/S started to plateau after 4 carbon alkyl chain. A comparison
of IL-SHS SDME and IL-SSDME was made in terms of their partition coefficient. Theoretically,
both were expected to show same KIL/S .In actual IL-SHS SDME showed superior extraction
ratio and KIL/S. The trend was well explained in terms of –ΔG IL/S. The plot of –ΔG IL/S against
number of carbons in the alkyl chain for ILSSDME showed a clear plateau after 3 carbon alkyl
chain while the IL-SHS SDME showed a peak and valley followed by another peak . This trend
in IL SHS SDME could be because of the preference of the aromatic hydrocarbon’s alkyl chain
and aromatic ring in vapor phase to interact with either the alkyl chain or the hetero aromatic
moiety . The observed decrease in KIL/S in IL-SSDME could be because of the
solubility/degradation of ionic liquid in aqueous medium, effect of sodium chloride, analytes
escaping to vapor phase.

177
List of Publications
1. Barnes.B,B.; Wilson.B,M; Carr.W,P.; Vitha.F,M.; Broeckling.D, C.; Heuberger.L,H;
Prenn, J.; Janis.C,G.; Corcoran, H.; Snow. H,N.; Chopra, S.; Dhandapani, R.; Tawfall,
A.; Sumner. W, L.; Boswell.G, P, “Retention Projection” Enables Reliable Use of Shared
Gas Chromatographic Retention Data Across Labs, Instruments, and Methods, Analytical
chemistry, 2013, Volume 85(23), 11650-11657
2. Chopra, S.; Dhandapani,R.; Snow.N,H, Steroids Analysis by using SPME-GC-MS-MS,
Scientia Chromatographia, Communicated Oct 2013
In preparation
1. Partition coefficient by depletion study for ionic liquid single drop microextraction of
aromatic hydrocarbons from water and quantitative estimation by no interface gas
chromatography mass spectrometry.
2. Retention of alkanes and aromatic hydrocarbons on ionic liquid stationary phases.
3. Separation of metal phthalocyanines by normal phase: method development and scaleup
to semi-prep HPLC.

178
Future work
The present research focused on determining the partition coefficient of aromatic hydrocarbons
homologous series. The trial could be performed at different temperature to study the KIL/S
changes with temperature. Also it would be interesting to explore the KIL/S of different functional
groups using probe analytes benzene, chlorobenzene, nitrobenzene, phenol and study the effect
of the functional groups on KIL/S.
References
1 Ramsey, W. Proc. Roy. Soc. 1905, A76, 111.
2 Tswett, M.; Ber. Dent. Botan. Ges. 1906, 24, 316-384.

179
3 Mc Nair,H.M; Miller,J.M. Basic Gas chromatography, second ed, Wiley: New York, 1998, 1-
28.
4 Snow,N.H. Chem. Educ., 1996, 73 (6), 592.
5 Van Deemter, J. J.; Zuiderweg, F. J.; Klinkenberg, A. Chem. Eng. Sci, 1956, 5, 271.
6 Krossing, I.; Slattery, J.M.; Daguenet, C.; Dyson, P.J. ; Oleinikova, A.; Weingaertner, H.
J. Am. Chem. Soc., 2006, 128 13427.
7 Liu, J.; Jiang, G.B.; Chi, Y.G.; Cai, Y.Q.; Zhou, Q.X. ; Hu, J.T. Anal. Chem. 2003, 75,
5870- 5876.
8 Peng, J.F.; Liu, J.F.; Jiang, G.B. ; Tai, C.; Huang, M.J. J. Chromatogr. A . 2005, 1072, 3-6.
9 Ye, C.L.; Zhou, Q.X.; Wang, X.M. Anal. Chim. Acta , 2006, 572, 165-171.
10 Vidal, L.; Psillakis, E.; Domini, C.E.; Grane, N.; Marken, F.; Canals, A. Anal. Chim. Acta.
2007, 584 ,185-195.
11 Ye, C.; Zhou, O.; Wang, X.; Xiao, J. J. Sep. Sci. 2007, 30, 42-47.
12 Carmichael, A. J.; Seddon, K. R. J. Phys. Org. Chem. 2000, 13, 591-596.
13 Gabriel, S.; J. Weiner, Ber. 1888, 21, 2669-2679.
14 Walden, P.; Bull. Acad. Sci. St. Petersburg. 1914, 405-422.
15 Wilkes, J.S.; Levisky, J.A.; Wilson, R.A.; Hussey, C.L.Inorg. Chem. 1982, 21, 1263-1264.
16 Wilkes, J.S.; Zaworotko, M.J. Chem. Commun. 1992, 965-967.
17 Liu, J.; Jonsson, J.A.; Jiang, G. TrAC Trends Anal. Chem. 2005, 24, 20-27.
18 Anderson, J.L.; Armstrong, D.W.; Wei, G. Anal. Chem. 2006, 78, 2893-2902.
19 Soukup-Hein, R.J.; Warnke, M.M.; Armstrong, D.W.; Annu. Rev. Anal. Chem. 2009, 2,
145-168.
20 Anderson, J.L.; Ding, R.; Ellern, A.; Armstrong, D.W. J. Am. Chem. Soc. 2005, 127,

180
593-604.
21 Holbrey, J. D.; Reichert, W.M.; Reddy, R. G.; Roger, R. D: Ionic liquids as green solvents:
progress and prospect, ACS, Washington DC, 2003, 121
22 Robelo, L. P. N.; Lopes, J. N. C.; Esperance, J. M. S. S.; Filipe, E. J. Phys. Chem. B, 2005,
109, 6040.
23 Law, G.; Watson, P.R. Langmuir . 2001, 17, 6138-6141.
24 Freire, M.G.; Carvalho, P.J.; Fernandes, A.M.; Marrucho, I.M.; Queimada, A.J.;
Coutinho J.A.P. J. Colloid Interface Sci. 2007, 314, 621-630.
25 Prem, K., Gary, A.B. ; Paul, S. J. Chem. Eng. Data. 2007, 52, 2306.
26 Alexander, G.; Rutten, G.A.F.M. J. Chromatogr. 1974, 99, 81.
27 Armstrong, D.W.; He, L.; Liu, Y.-S. Anal. Chem. 1999, 71, 3873-3876.
28 Poole, C.F.; Butler, H.T.; Coddens, M.E.; Dhanesar, S.C.; Pacholec, F. J. Chromatogr.
1984, 289, 299-320.
29 Pacholec, F.; Poole, C.F. Chromatographia. 1983, 17, 370-374.
30 Kovats, E. S. Chim. Acta. 1958, 41, 1915-1932.
31 Rohrschneider, L. J. Chromatogr. 1966, 22, 6-22.
32 Rohrschneider, L.J. Chromatogr. 1969, 39, 383.
33 McReynolds, W.O. J. Chromatogr. Sci. 1970, 8, 685.
34 Abraham, M.H. Chem. Soc. Rev. 1993, 22, 73-83.
35 Kollie, T. O.; Poole, C. F. Anal. Chim. Acta, 1992, 259 , 1-13.
36 Snyder, L. R, J. Chromatogr. Sci. 1978, 16, 223-234.
37 Figgins, C. E.; Reinbold, B. L; Reinbold, B. L.; Risby, T. H. J. Chromatogr. Sci. 1977, 75,
4851-4858.

181
38 Dai, S.; Ju, Y.H.; Barnes, C.E. J. Chem. Soc., Dalton Trans: Inorg. Chem. 1999, 1201-1202.
39 Arce, A.; Earle, M.J.; Katdare, S.P., Rodriguez, H.; Seddon, K.R. Phys. Chem. Chem.
Phys. 2008, 10 , 2538-2542.
40 Guerra-Abreu, L.; Pino, V.; Anderson, J.L.; Afonso, A.M. J. Chromatogr. A. 2008, 1214,
23-29.
41 Shimojo, K.; Kamiya, N.; Tani, F.; Naganawa, H.; Naruta, Y.; Goto, M. Anal. Chem. 2006,
78, 7735-7742.
42 Pei, Y.; Wang, J.; Wu, K.; Xuan, X.; Lu, X. Sep. Purif. Technol. 2009, 64 288- 295.
43 Liu, J.; Jiang, G.; Chi, Y.; Cai, Y.; Zhou, Q.; Hu, J. Anal. Chem. 2003, 75, 5870- 5876.
44 Liu, J.; Chi, Y.; Jiang, G.; Tai, C.; Peng, J.; Hu, J. J. Chromatogr. A. 2004, 1026, 143-147.
45 Liu,Y.; Zhao, E.; Zhu, W.; Gao, H.; Zhou, Z. J. Chromatogr. A. 2009, 1216, 885-891.
46 Zhou, Q.; Bai, H.; Xie, G.; Xiao, J. J. Chromatogr. A. 2008, 1177, 43-49.
47 Vidal, L.; Domini, C.E.; Grane,N.; Psillakis, E.; Canals, A. Anal. Chim. Acta . 2007, 592,
9-15.
48 Vidal, L.; Psillakis,E.; Domini, C.E.; Grane, N.; Marken, F.; Canals, A. Anal. Chim. Acta
2007, 584, 189-195.
49 Wang,Y.; Kwok, Y.C.; He,Y.; Lee, H.K. Anal. Chem. 1998, 70, 4610–4614.
50 Hou, L.; Lee, H.K. J. Chromatogr. A. 2002, 976, 377–385.
51 Shen, G.; Lee, H.K.; Anal. Chem. 2003, 75, 98–103.
52 Saraji, M. J. Chromatogr. A. 2005, 1062, 15–21.
53 Liu,J.; Li, N.; Jiang, G.; Joensson, J.A.; Wen, M. J. Chromatogr. A. 2005, 1066, 27-32.
54 Zhao, F.; Meng, Y.; Anderson, J.L. J. Chromatogr. A. 2008, 1208, 1-9.

182
55 Wanigasekara, E.; Perera, S.; Crank, J.A.; Sidisky, L.; . Shirey, R; Berthod, A.; Armstrong,
D.W. Anal. Bioanal. Chem. 2010, 396, 511-524.
56 Andre,M.; Loidl, J.; Laus, G.; Schottenberger, H.; Bentivoglio, G.; Wurst, K.; Ongania, K.
Anal. Chem. 2005, 77, 702-705.
57 Liu, F.; Jiang, Y. J. Chromatogr. A. 2007, 1167, 116-119.
58 Kaliszan, R.; Marszall, M.P.; Markuszewski, M.J.; Baczek, T.; Pernak, J. J. Chromatogr.A.
2004, 1030, 263.
59 Poole,C.F.; Kersten, B.R. ; Ho, S.S.J.; Coddens, M.E.; Furton, K.G. J. Chromatogr. 1986,
352, 407-413.
60 Zhang, W.; He, L.; Gu, Y.; Liu, X.; Jiang, S. Anal. Lett. 2003, 36, 827-838.
61 Liu, S.J.; Zhou, F.; . Xiao, X.H.; Zhao, L.; Liu, X.; Jiang, S.X.; Chin. Chem. Lett. 2004, 15,
1060-1062.
62 Qiu, H.; Jiang, S.; Liu, X. J. Chromatogr. A. 2006, 1103, 265-270.
63 Qiu, H.; Jiang, S.; Liu, X.; Zhao, L. J. Chromatogr. A. 2006, 1116, 46-50.
64 Qiu, H.; Jiang, S.; Liu, X.; Zhao, L. J. Chromatogr. A. 2006, 1116, 46-50.
65 Qin, W.; Wei, H.; Li, S.F.Y. J. Chromatogr. A. 2003, 985, 447- 454.
66 Qin, W.; Wei, H.; Li, S.F.Y. J. Chromatogr. A. 2003, 985, 447- 454.
67 Armstrong, D.W.; Zhang, L.K.; He, L.; Gross, M.L. Anal. Chem. 2001, 73, 3679- 3686.
68 Crank, J.A.; Armstrong, D.W.; J. Am. Soc. Mass Spectrom. 2009, 20, 1790-1800.
69 D.W. Barber, C.S.G. Phillips, G.F. Tusa and A. Verdin, J. Chem. Soc, 18-24, (1959).
70 K.G. Furton and C.F. Poole, Anal. Chem. 1987, 59 (8), 1170-1176.
71 Pacholec, F.; Poole, C.F. Chromatographia. 983, 17, 370-374.
72 Poole,C.F.; Kollie, T.O.; Poole, S.K.; Chromatographia. 1992, 34, 281-302.

183
73http://www.sigmaaldrich.com/etc/medialib/docs/promo/General_Information/ionic_liquid_gc_
columns.Par.0001.File.tmp/ionic_liquid_gc_columns.pdf , accessed September 10 (2013).
74 Delmonte, P.; Fardin-Kia, A. R.; Kramer, J. K.; Mossoba, M. M.; Sidisky, L.; Tyburczy, C.;
Rader, J. I. J. Chromatogr. A . 2012, 1233, 137−146.
75 Tranchida, P. Q.; Franchina, F. A.; Dugo, P.; Mondello, L. J. Chromatogr. A 2012, 1255,
171−176.
76 Villegas, C.; Zhao, Y.; Curtis, J. M. J. Chromatogr. A, 2010, 1217,775−784
77 Anderson, J. L.; and Armstrong, D. W. Anal. Chem. 2003, 75, 4851-4858
78Ragonese, C.; Sciarrone, D.; Tranchida, P. Q,; Dugo, P.; Dugo, G.; Mondello, L. Anal. Chem.
2011, 83, 7947–7954
79 Ding,J.; Welton, T.; Armstrong, D. W. Anal. Chem. 2004, 76, 6819–6822
80 Y.V. Kazakevich, J. Chromatogr. A, 1126(1-2), 232-243(2006)
81 http://www.sigmaaldrich.com/content/dam/sigma-aldrich/docs/Supelco/Posters/1/ionic-
liquids-separations-breitbach.pdf
82 Mcginitie, T.M.; Korolat, B.R.; Whale, C.; Harynuk, J.J. J. Chromatogr. A, 2011, 1218, 3241-
3246
83 R. Majors, LC-GC, 1991, 9, 16.
84 Zhao, F.; Li, J.; Zeng, B. J. Sep. Sci. 2008, 31, 3045-3049.
85 Aguilera-Herrador, E.; Lucena, R.; Ca´ rdenas, S.; Valca´ rcel, M. Anal. Chem. 2008, 80,
793-800.
86 Liu, J. F.; Chi, Y. G; Jiang, G. B.; Tai, C.; Peng, J. F.; Hu, J.-T. J. Chromatogr.,A, 2004, 1026,
143-147.

184
87 Aguilera-Herrador, E.; Lucena, R.; Ca´ rdenas, S.; Valca´ rcel, M. J. Chromatogr., A. 2008,
1201, 106-111.
88 Arthur, C. L.; Pawliszyn. J. Anal. Chem. 1990, 62, 2145-2148.
89 Zimmermann, T.; Ensinger, W.J.; Schmidt, C. T. J. Chromatogr., A. 2006, 1102, 51-59.
90 Kolb, B; Ettre, L.S. Static headspace gas chromatography theory and practice, Wiley ,2006,
1- 43
91 Vallecillos, L.; Pocurulln, E.; Borrull, F. Talanta. 2012, 99 , 824–832
92 Xu, L.; Basheer, C.; Lee, H.K. J. Chromatogr. A, 2007, 1152, 184–192
93 Jeannot, M.A.; Cantwell F.F. Anal. Chem., 1997, 69, 235–239
94 Lambropoulou, D.A.; Albanis, T.A. J. Chromatogr. A. 2004, 1049, 17–23
95. Kardani, F.; Daneshfar, A..; Sahrai, R. J. Chromatogr. B, 2010, 878, 2857–2862
96 Li, Y.; Wei, G.; Wang X. J. Sep. Sci, 2007, 30, 2698–2702
97 Ma, M.; Kang, S.; Zhao, Q.; Chen, B.; Yao, S. J. Pharm. Biomed. Anal. 2006, 40, 128–135
98 Wang, Q., Qiu, H.; Li, J.; Liu, X.; Jiang S. J. Chromatogr. A, 2010, 1217, 5434–5439
99 Yazdi, A.S.; Mofazzeli, F. Chromatographia .2010, 72, 867–873.
100 Von Wald, G.; Albers, D.; Cortes, H.; McCabe, T. J. Chromatogr. A. 2008, 1201, 15-20.
101 Snow, N.H.; Bullock, G.P. J. Chromatogr. A. 2010, 1217, 2726–2735.
102 Koel,M. Ionic liquid in chemical analysis, CRS press,2009,139-166.
103 Jain ,A.; Verma. K. K. Analytica Chimica Acta .2011,706 , 37– 65.
104 Grob, R.L.; Barry, E.F. Modern practices of gas chromatography , Fourth ed, Wiley: New
York ,2004, 461-490.

185
105http://www.sigmaaldrich.com/content/dam/sigma-
aldrich/docs/Supelco/Posters/1/ionic_liquid_gc_columns.pdf , Accessed on 30th March 2014.