ionic exclusion phase transition in neutral and weakly ... · pdf fileionic exclusion phase...
TRANSCRIPT

Ionic exclusion phase transition in neutral and weakly charged cylindrical nanopores
Sahin Buyukdagli∗, Manoel Manghi†, and John Palmeri‡
Universite de Toulouse; UPS;Laboratoire de Physique Theorique (IRSAMC); F-31062 Toulouse, France and
CNRS; LPT (IRSAMC); F-31062 Toulouse, France(Dated: November 18, 2010)
A field theoretic variational approach is introduced to study ion penetration into water-filled cylin-drical nanopores in equilibrium with a bulk reservoir (S. Buyukdagli, M. Manghi, and J. Palmeri,Phys. Rev. Lett., 105, 158103 (2010)). It is shown that an ion located in a neutral pore undergoestwo opposing mechanisms: (i) a deformation of its surrounding ionic cloud of opposite charge, withrespect to the reservoir, which increases the surface tension and tends to exclude ions form the pore,and (ii) an attractive contribution to the ion self-energy due to the increased screening with ionpenetration of the repulsive image forces associated with the dielectric jump between the solventand the pore wall. For pore radii around 1 nm and bulk concentrations lower than 0.2 mol/L, thismechanism leads to a first-order phase transition, similar to capillary “evaporation”, from an ionic-penetration state to an ionic-exclusion state. The discontinuous phase transition exists within thebiological concentration range (∼ 0.15 mol/L) for small enough membrane dielectric permittivities(m < 5). In the case of a weakly charged pore, counterion penetration exhibits a non-monotonicbehavior and is characterized by two regimes: at low reservoir concentration or small pore radii,coions are excluded and counterions enter the pore due enforce electroneutrality; dielectric repulsion(image forces) remain strong and the counterion partition coefficient decreases with increasing reser-voir concentration up to a characteristic value; for larger reservoir concentrations, image forces arescreened and the partition coefficient of counterions increases with the reservoir electrolyte concen-tration, as in the neutral pore case. Large surface charge densities (> 2× 10⁻³ e/nm2) suppress thediscontinuous transition by reducing the energy barrier for ion penetration and shifting the criticalpoint towards very small pore sizes and molar reservoir concentrations. Our variational method isalso compared to a previous self-consistent approach and yields important quantitative corrections.The role of the curvature of dielectric interfaces is highlighted by comparing ionic penetration intoslit and cylindrical pores. Finally, a charge regulation model is introduced in order to explain thekey effect of pH on ionic exclusion and explain the origin of observed time-dependent nanoporeelectric conductivity fluctuations and their correlation with those of the pore surface charge.
PACS numbers: 03.50.De,87.16.D-,68.15.+e
I. INTRODUCTION
Electrostatic forces induced by macroscopic dielectricbodies immersed in water regulate important phenom-ena such as the stability of colloidal suspensions [1],membrane assemblies [2], and ion selectivity by syntheticmembranes [3] as well as in biological nanopores [4]. Theimage forces induced by the dielectric permittivity jumpbetween dielectric bodies and the solvent surroundingthem play a central role in these phenomena. Indeed,the equilibrium of similarly charged objects in a solventis driven by the competition between the repulsive elec-trostatic interaction of their charges and the attractivevan der Waals forces that originate from their low dielec-tric permittivity. This picture, valid at low ionic concen-trations, is also the basis of the DLVO theory [5]. A verysimilar competition is known to determine the perme-ability of biological channels that regulate ion exchangebetween the exterior and interior of cells. The strong
∗Email: [email protected]†Email: [email protected]‡Email: [email protected]
dielectric discontinuity between the membrane (dielec-tric permittivity m ≃ 2) and the water-filled channel(w ≃ 78) is at the origin of the high potential barrier forion penetration into the pore. In 1969, Parsegian foundthat the energetic cost to move an ion from the bulkreservoir into a cylindrical pore of infinite length and ra-dius a = 0.2 nm is approximately 16 kBT [6]. This resultclearly suggests that at room temperature, any biologicalpore would be totally impermeable to ions. From the nu-merical solution of the Debye-Huckel (DH) equation, itwas later shown that the consideration of the finite lengthof the channel reduces this barrier up to 6 kBT [7] forshort enough pores. Levin [8] recently proposed an ap-proximative, but reasonably accurate, analytical solutionof the DH equation for a finite length cylinder. He alsoshowed that the introduction of surface charges can fur-ther reduce this energy barrier by attracting counterionselectrostatically. Several perturbative approaches aroundweak-coupling (WC) theory [mean-field (MF) theory cor-rected up to one-loop or Debye-Huckel (DH) order] orstrong coupling (SC) theory (virial expansion) [9, 10]have been developed for charged slit pores [11–15], con-centric cylinders [16] as well as for two like-charged di-electric cylindrical bodies [17]. Because these methodstend to misevaluate ionic correlations, especially in the

2
presence of strong dielectric discontinuities, it becomesimperative to develop analytical or numerical tools validover a larger parameter range.
In the case of ions confined into a closed geometry char-acterized by a dielectric discontinuity, the existence ofan infinite number of image charges significantly compli-cates reliable numerical calculations such as MC simu-lations [18]. Although new MC algorithms for such sys-tems have been developed and applied to planar dielectricslabs [19–23], at the present, we are not aware of any ap-plication of these methods to dielectric cylinders wherethe curvature of the interface is likely to cause a furthercomplication of the numerical task. When MC data forionic penetration into dielectric cylinders become avail-able in the future, it will be interesting to test the va-lidity of approximative theoretical methods, such as theone presented in this article.
Differential equations for electrostatic potentials, thatpartially take into account ionic correlations at a non-linear level (i.e. beyond the DH theory) were derivedby Netz and Orland [24] within a field-theoretic varia-tional formalism. However these variational equationsare too complicated to be solved analytically or even nu-merically [24]. A restricted tractable variational methodfor neutral single and double planar interface as well asfor spherical systems was proposed in Ref. [25–27]. Be-cause of the piecewise inverse variational screening lengthintroduced in [26], the numerical minimization proce-dure is technically involved. We have recently proposeda simpler variational method to investigate the case ofcharged planar interfaces and slit pores [28]. The ap-proach is based on a generalized Onsager-Samaras ap-proximation [29] which assumes an electrostatic kernelwith a uniform variational inverse screening length vthat may differ from the bulk value. In this article, weextend this variational method to the case of neutral andcharged cylindrical pores [30], by using a constant vari-ational Donnan potential 0 which enforces electroneu-trality in the charged pore [28]. We show here that theextremization of the variational grand potential with re-spect to v and 0 yields two coupled variational equa-tions,
2v =
4ℓB⟨∂w(r;v)∂v
⟩∑i
q2i b,i
⟨e−Φi(r;v) ∂w(r;v)
∂v
⟩(1)
∫Sp
dS s = Vp
∑i
qib,i
⟨e−Φi(r;v)
⟩, (2)
where we define the pore average as ⟨A(r)⟩ ≡∫Vp
drVpA(r),
Vp (p for pore) stands for the volume occupied by the con-fined ions, Sp is the charged surface, s is the uniformsurface charge density (expressed in units of the elemen-tary charge e), qi denotes the ion valency, and b,i is thereservoir density of each ionic species. We also define thepotential of mean force (PMF)
Φi(r;v) ≡ − lni(r)
b,i=q2i
2w(r;v) + qi0 (3)
which is the change in the excess electro-chemical poten-tial when an ion is brought from the bulk inside the poreat position r (in the following, all energies are rescaled bythe thermal energy kBT = −1). The quantity w(r, v)incorporates dielectric and electrostatic solvation forces(see Fig. 1) and thus depends in a complex manner onv, and will be calculated in Section II. It is the v de-pendence of w that couples 0 to v, without which 0
is simply the Donnan potential. The variational schemeemployed here, which handles ionic correlations and im-age forces at a non-linear level, was recently applied tocharged slit pores [28]. It was shown that the method i) isable to explore the regime between the WC and SC lim-its for charged single and double interfaces and ii) goesbeyond the self-consistent methods used in nanofiltra-tion theories [28, 31]. The ability of the present methodto interpolate between the limiting WC and SC theo-ries makes it a valuable tool for exploring the physics ofcharged biological systems (lipid membranes, water chan-nels. . . ) where image forces play an extremely importantrole. Such a non-perturbative method is also essentialfor studying the possibility of an ionic liquid-vapor (L-V)transition in a nanopore, our principal goal here [30].In order to clarify the need for such a method, we notethat the for the weakly charged nanopores investigatedhere the V-phase can to a very good approximation beassimilated to a counter-ion only phase in the SC limit,because the despite the low values of the SC parameter,Ξ ∼ 0.1 the inequality (Eq. 4 of Jho et al, PRL 2008)delimiting the SC range of validity in a slab can, whenextrapolated to a cylindrical nanopores of radius ∼ 1 nm,still be satisfied thanks to the large value of the Gouy-Chapman length ∼ 10 nm. Since the ionic L-phase iscloser to the (salt) weak coupling limit, it is clear that amethod is needed that spans the region between the twolimiting laws.
The variational equations obtained by Netz and Or-land [24] are equivalent to the closure equations estab-lished in the context of nanofiltration theories (see [32,33] and [31] for a review). The closure equations weresolved for spherical pores within a self-consistent approx-imation by Dresner [33], who observed a discontinuousphase transition from a high to a low ionic penetrationstate for decreasing reservoir concentration. Althoughthe spherical geometry adopted by Dresner significantlysimplifies the technical difficulties, it remains a toy-modelsince in reality, ion-penetration is controlled by thin chan-nels connecting the pore to the reservoir. The closureequations were later solved within the mid-point approx-imation by Yaroshchuk [31] for a cylindrical pore. Themid-point approximation is equivalent to replacing thepotential of mean force in the exponential of Eqs. (1–2)by its value in the middle of the pore, which leads to anunderestimation of repulsive image forces and solvationdeficit effects. As will be shown below, this approxima-tion can overestimate the partition coefficients of ions inthe pore by up to a factor of three.
This paper is organized as follows. We introduce in

3
z
!m
!w bulk!"v-1
"b-1
polarization surface charge density
r
ionic cloud #s
solvation def icit
a
FIG. 1: Geometry for a cylindrical pore of infinite length andradius a. The cylindrical coordinates (r, , z) are defined inthe figure. The ionic cloud is distorted due to the dielectricrepulsion by the polarization surface charge density and thesolvation deficit outside the pore.
Section II the general lines of the field-theoretic approachfor charged dielectric bodies and derive the variationalgrand potential for a cylindrical pore. Section III dealswith ion penetration into a neutral pore of radius a.A first-order ionic exclusion transition from an ionic-penetration state to an ionic-exclusion state is found fora specific range of parameter values. We draw the phasediagram in the (a, b) space. We then compare our re-sults with the self-consistent approach within the mid-point approximation [31]. In order to compare the ionicpenetration into slit [28] and cylindrical pores, we alsocompute the electrostatic potential and the variationalfree energy for two neutral concentric cylinders and studythe limit of large cylinder radii with fixed separation. InSection IV, we first investigate the effect of a non-zerofixed surface charge on ion partitioning and show thatthe transition survives for sufficiently weak surface chargedensity, but disappears above a critical value because ofthe additional cost in electrostatic energy of the pore sur-face charge, leading to an enhanced ion penetration intothe nanopore favorable to its screening. Finally, we de-velop our approach for the case where the surface chargedensity is regulated by the pH (surface charge regulationmechanism) which occurs experimentally for nanotubesin, e.g., PET membranes [34] where weak acid groupsare located at the pore surface. The calculation of theGreen’s function for a cylindrical dielectric interface [35]is presented in Appendix A and for two concentric cylin-ders in Appendix B.
II. MODEL
In this section, we compute the variational grand po-tential of a symmetric electrolyte of dielectric permittiv-ity w (identical to the bulk value) confined in a cylinderof radius a and length L. We consider in this article thelimit of a sufficiently long cylinder (L ≫ a) and neglectsize effects. The cylindrical pore traversing a membraneis depicted in Fig. 1. The membrane of dielectric permit-tivity m is salt free (i.e. = 0) and the electrolyte is
in contact with an external particle reservoir at the endboundaries of the cylinder. Hence the fugacity of ions isi = ei/Λ3
i , where Λi = ℎ/√
2mikBT is the thermalDe Broglie wavelength of an ion i and i its chemicalpotential, and it is fixed inside the pore according to thechemical equilibrium condition, i = i,b.
The grand-canonical partition function of p species ofinteracting charges is
Q =
p∏i=1
∞∑Ni=0
Nii
Ni!
∫ Ni∏j=1
drj e−(Ec−Es) (4)
The electrostatic interaction in Eq. (4) is given by
Ec =1
2
∫drdr′ (r)vc(r, r
′)(r′) (5)
where the charge distribution, in units of the elementarycharge e, is
(r) =
p∑i=1
Ni∑j=1
qi(r− rj) + s(r), (6)
and s(r) = s(r − a) is the negative fixed chargedistribution (s < 0) at the surface of the cylinder (1e nm−2 = 0.16 C m−2). The electrostatic potentialvc(r, r
′) is solution of
v−1c (r, r′) = − 1
e2∇ [(r)∇(r− r′)] (7)
where
(r) = mΘ(r − a) + wΘ(a− r) (8)
is the dielectric permittivity (where Θ(x) is the Heavi-side distribution). Furthermore, the bulk self-energy ofmobile ions that we substract from the total electrostaticenergy in Eq. (4) is
Es =vbc(0)
2
p∑i=1
Niq2i . (9)
The bare Coulomb potential in the bulk is vbc(r) =ℓB/r, where the Bjerrum length is defined as ℓB =e2/(4wkBT ) ≃ 0.7 nm in water at T = 300 K. Afterperforming a Hubbard-Stratonovitch transformation andsumming over Ni in Eq. (4), the grand-canonical parti-tion function becomes Q =
∫D e−H[]/Zc, where the
field-theoretic Hamiltonian is
H[] =
∫dr
[(r)
2e2[∇(r)]2 − i(r)(r)−
∑i
ieiqi(r)
](10)
where we have introduced the rescaled fugacities, i =
ieq2i2 v
bc(0). The average electrostatic potential (r) is re-
lated to the fluctuating one (r) by (r) = i⟨(r)⟩. The

4
factor Zc in the partition function subtracts the non-screened van der Waals contribution. Since we are exclu-sively interested in the salt-dependent part of the grandpotential, we keep Zc in the functional integral. Thevariational method consists in extremizing, with respectto the variational parameters, the first-order cumulantΩv = Ω0 + ⟨H−H0⟩0 where the expectation values ⟨. . .⟩0are evaluated with the variational Gaussian Hamiltonian
H0[] =1
2
∫r,r′
[(r)− i0(r)] v−10 (r, r′) [(r′)− i0(r′)]
(11)and Ω0 = − 1
2 tr ln(v0/vc). The variational parametersare the Green’s function v0(r, r′) and the electrostaticpotential 0(r). In the following, we consider the re-
stricted case of a constant variational “Donnan” potential0 and v0(r, r′) a solution of the inhomogeneous varia-tional Debye-Huckel equation[−∇((r)∇) + (r)2(r)
]v0(r, r′) = e2(r− r′) (12)
with a variational inverse screening length defined by
(r) = v Θ(a− r). (13)
The restricted variational choice made here is both sim-ple enough to lead to a tractable method and judi-cious enough to capture the essential physics for tightnanopores (a < 2 nm). After evaluating the functionalintegrals, the variational grand potential becomes
ΩvVp
= −∑i
i
⟨exp
[q2i
2(vℓB − v0(r, r;v))− qi0
]⟩+3v
24+
2v
8ℓB
∫ 1
0
d⟨v0(r, r;v
√)− v0(r, r;v)
⟩+
2
as0
(14)
where Vp = a2L and v0(r, r;v) (see Fig. 2) is thecorrection due to the presence of the nanopore to thevariational Green function:
v0(r, r′;v) = ℓBe−v∣r−r′∣
∣r− r′∣+ v0(r, r′;v) (15)
evaluated at r′ = r [see Eq. (A9)], and is thus defined as
v0(r, r;v) =4ℓB
∫ ∞0
dk∑′
m≥0
Fm(k;v)I2m(ϰ∣r∣) (16)
where we note ϰ2 = k2 + 2v and the prime on the sum-
mation sign means that the term m = 0 is multipliedby 1/2. The function Fm is a combination of modified
Bessel functions Im and Km and is given in Eq. (A10).Note that we have Fm → 0 for a→∞ and thus v0 → 0.
To find the physical meaning of the various contribu-tions in Eq. (14), it is interesting to rewrite it in twoways. The classical thermodynamic equality in presenceof surface effects, Ωv = −pVp + Sp with Sp = 2aL,allows us to separate the volumic bulk contribution, thepressure, which is independent of a (or Sp)
p(v) =∑i
i exp
(q2i vℓB
2
)− 3
v
24(17)
and a surface contribution term, = (Ωv + pVp)/Sp,
=a
2
∑i
ieq2i vℓB/2
⟨1− e−q
2i v0(r,r;v)/2−qi0
⟩+
a2v
16ℓB
∫ 1
0
d⟨v0(r, r;v
√)− v0(r, r;v)
⟩+ s0 (18)
which is a function of nanopore characteristics (s, a andm via v0), and vanishes for a → ∞. By maximizingthe variational pressure in Eq. (17), we find the inversescreening length in the bulk, b, given by the followingimplicit equation as a function of the fugacities i:
2b = 4ℓB
∑i
q2i i exp
(q2i bℓB
2
). (19)
Note that Eq. (19) leads to instabilities for large values ofi if hard-core repulsion is not included [36]. Moreover,
Eq. (19) has no solution for large fugacities such thatq2i b()ℓB > 4. For low fugacities, Eq. (19) yields the
Debye-Huckel Limiting Law (DHLL). Indeed, the bulkdensity is computed through
i,b() = i∂p
∂i= i e
q2i2 bℓB (20)
which allows to rewrite Eq. (19) as
2b = 4ℓB
∑i
q2i i,b(). (21)

5
0.0 0.2 0.4 0.6 0.8 1.0
lBκv
0
5
10
15
δv0
r=0r=0.75 ar=0.9a
FIG. 2: Variation of v0 given in Eq. (16) with v for threevalues of r = 0, 0.75, and 0.9a (solid lines from bottom totop) and m = 2, w = 78, and a = 0.84 nm. The dotted linecorresponds to 0 for ∣s∣ = 5.4×10⁻⁴ nm−2 and b = 0.1812mol/L. The left and right reference lines mark the solutionsof v just below and above the transition point, respectively.
In the following, we will keep b in the equations by re-
placing eq2i2 bℓB by b in Eq. (14). Note that to get b,
we calculate it from , which is fixed in the grand canon-ical ensemble, using Eqs. (19)-(20). Solving Eq. (20) fori leads to the DHLL canonical ensemble result:
i = ln(i,bΛ3i )−
q2i
2bℓB . (22)
The second way to interpret Eq. (14) is by remark-ing that the first term on the rhs looks like the pres-sure of an ideal gas of ions “dressed” by their sur-rounding cloud, in a self-consistent or “external” field,q2i2 (−vℓB + v0(r, r;v)) + qi0. It favors high v. The
second and third terms are the correlation contribution,or the charging energy needed to create dressed ions [37],modified by the nanopore. They come from “attractive”correlations between ions and their surrounding ioniccloud of opposite charge [37]. The second term is minusthe DH pressure of a hypothetical bulk of inverse screen-ing length v and the third one is a surface contributiondue to the presence of the nanopore (dielectric exclusionand modified solvation effects). These two terms favorlow v because the third term, Ωd (Eq. A.15), like thesecond bulk one, increases with v, even if v0(v) isa decreasing function of v (see Fig 2). If, on the onehand, v is set arbitrarily to 0 (no screening, which cor-responds to “phantom ions”), one ends up with a simplebarometric law, i.e. an ideal gas in the external potential,q2i2 v0(r, r; 0)+qi0, induced by the dielectric discontinu-
ity at the pore surface. Within our restricted variationalmethod this limit is the analog of the SC approximation(the ion-nanopore interactions dominate over the ion-ion
correlations). If, on the other hand, we arbitrarily setv = b cosh[0] ≥ b and neglect the influence of thedielectric discontinuity on the Donnan potential 0, weobtain the analog of the WC PB/DH theory. As will beshown below by an application of our variational method,these simplifying limits are not sufficient for the task athand.
In summary, this system can be viewed as an ideal gasof dressed ions, whose accessible space is reduced by di-electric repulsion. Both the Boltzmann weight, whichtakes into account the feedback correlation associatedwith the fact that ions forming the surrounding cloud arethemselves dressed ions, and the repulsive dielectric self-energy contribution depend on the variational screeningparameter, v. The PMF, defined in Eq. (3), includesthe potential w(r) that incorporates the solvation andimage-charge interactions
w(r) = v0(r, r)− vbc(0) + b()ℓB (23)
= (b − v)ℓB + v0(r, r;v).
where b is defined in Eq. (19). The quantity q2iw(r)/2
is the difference between the excess chemical potential ofion i located at distance r in the nanopore and the excesschemical potential of the same ion in the bulk [28]. It isa decreasing function of v, since increasing v increasesthe electrostatic solvation gain of the hypothetic bulk(usual DH excess chemical potential term in −vℓB) andv0(v) decreases with v (very slowly for very low andhigh v and abruptly at intermediate v ≃ 1/(2a) , seeFig. 2), since the direct dielectric repulsion begins to bescreened).
By minimizing Eq. (14) with respect to v, one exactlyobtains Eq. (1) of the Introduction with w(r, v) definedin Eq. (23). Note that for a bulk electrolyte (a → ∞)treated variationally, Eq. (1) yields the Debye-Huckel re-lation Eq. (21) as long as the stability condition on fu-gacities i, q
2i bℓB < 4 (b < 3 mol/L for monovalent
ions) discussed in [25, 28] is satisfied. The drawback ofworking directly with Eq. (1) is that when it has threedistinct solutions for v, one cannot distinguish betweenstable, metastable and unstable solutions. For this rea-son, in the following, we will analyze the pore-electrolytemodel within the free energy minimization procedure anduse Eq. (1) exclusively to show the importance of quan-titative errors induced by a previous self-consistent ap-proach [31, 33].
Finally, average ion concentrations in the pore are cal-culated using
⟨i(r)⟩ = −i∂(Ωv/Vp)
∂i(24)
= i eq2i2 vℓB
⟨e−
q2i2 v0(r,r;v)−qi0
⟩. (25)
The ionic partition coefficients, which are measurablequantities, for instance in ion conductivity experiments,

6
are defined as
ki ≡⟨i(r)⟩i,b
=2
a2
∫ a
0
drre−q2i2 w(r)−qi0 . (26)
In terms of the ki, the first (entropic) term in Ωv Eq. (14),becomes −
∑i i,bki.
In the rest of the paper, we will consider a symmet-ric electrolyte, i.e. q+ = −q− = q. By differentiatingthe variational grand potential (14) with respect to 0,one simply obtains the electroneutrality condition Eq. (2)which for a cylindrical nanopore is simply
s = qbaΓ sinh (q0) (27)
where we have defined the coefficient
Γ ≡⟨e−
q2
2 w(r)
⟩= 2
∫ 1
0
dxx e−q2
2 w(xa) (28)
which accounts for solvation and image corrections tomean-field theory (corresponding to Γ = 1). By invertingEq. (27) we find for s < 0
q0 = − ln
[qΓ/
−1 +√
1 + (qΓ/)2
](29)
where we have defined = ∣s∣/(ba) = Xm/(2b),Xm = 2∣s∣/a being the volume charge density of thepore. The average potential 0 increases in absolutevalue as 1/q ln[/(2qΓ)] for /qΓ ≫ 1. By injecting thesolution Eq. (29) into the grand potential (14), we are leftwith a single variational parameter v that will be variedin order to find the optimal solutions to the variationalproblem.
III. NEUTRAL PORE
In this section, we investigate the exclusion of ionsfrom a neutral cylindrical pore. The electrolyte in thebulk reservoir is symmetric and composed of monova-lent ions (q = 1). For a symmetric electrolyte the van-ishing surface charge, s = 0, imposes 0 = 0 throughEq. (27). In Fig. 3a and 3b are plotted the variationalgrand potential Ωv vs the adimensional variational in-verse screening length ℓBv for pore radius a = 0.84 nm,m = 2 (the case for lipid membranes), and variousbulk concentration b. Figure 3a shows that as one re-duces the reservoir concentration from b = 0.77 mol/Lto b = 0.12 mol/L, the minimum of the grand poten-tial changes from ℓB
Lv ≃ 1.1 (⟨⟩ = 0.2524 mol/L) to
ℓBVv = 0.037 (⟨⟩ = 3 × 10⁻⁴ mol/L). In other words,
the pore evolves from an ionic-penetration liquid state(L) to a quasi total ionic-exclusion vapor one (V).
If one now slowly increases the bulk concentration fromb = 0.12 mol/L to, for instance, b = 0.181 mol/L,one notices the apparition of a second minimum at mod-erate ℓBv ≃ 0.34, shown in Fig. 3b, which corre-sponds to a significant ion concentration in the pore,
(a)
0.2 0.4 0.6 0.8 1.0 1.2 1.4 1.6 1.8 2.0
lBκv
-0.1
0.0
0.1
0.2
Ωv/L
(b)
0.1 0.2 0.3 0.4
lBκv
-5.0E-4
0.0E0
5.0E-4
1.0E-3
Ωv/L
FIG. 3: Variational grand potential vs v for m = 2, w = 78and a = 0.84 nm. From bottom to top, bulk concentrationsare (a) b = 0.77 and 0.123 mol/L, and (b) b = 0.181, 0.183,and 0.185 mol/L.
L = 29 mmol/L. One sees that this minimum ismetastable and the stable solution is the one correspond-ing to the ionic-exclusion state with b = 0.44 mmol/L.If we keep increasing the reservoir concentration up tocb = 0.1832 mol/L, the values of both minima be-come equal, which indicates a phase coexistence: indeed,the equality of the two values of the grand potential,Ωv(
Vv ) = Ωv(
Lv ), indicates mechanical equilibrium be-
tween both states. Finally, as b is increased furtherto b = 0.185 mol/L, the ionic-exclusion state becomesmetastable and the pore becomes penetrable to ions.
This behaviour is the signature of a first-order phasetransition over a certain parameter range for cylindricalnanopores. Note that such a transition does not appearto take place in slit-like pores [28] although a continuouscrossover from the presence to the absence of ions hasalready been observed for slit-like pores within a self-consistent calculation in Refs. [31, 33] and within thevariational approach in Ref. [26, 28] (see Figs. 7-9).
This discontinuous transition is characterized in Fig. 4where we display for m = 2 the partition coefficients,given by Eq. (26), corresponding to the stable state of the

7
0.0 0.1 0.2 0.3 0.4 0.5 0.6 0.7
ρb (mol/L)
0.0
0.2
0.4
0.6
0.8
1.0k
a = 1.96 nma = 0.98 nma = 0.84 nm
FIG. 4: Partition coefficients vs b for m = 2, w = 78, andpore radii a = 1.96, 0.98 and 0.84 nm (solid lines, from top tobottom). The (red) circles display the metastable solutions,thus defining the coexistence window. red and red diamondscorrespond to the solution of the self-consistent mid-point ap-proximation Eq. (31) for a = 1.96, and 0.98 nm.
variational grand potential, as a function of the reservoirconcentration b for three different radii. At large poresize a = 1.96 nm, the discontinuous jump is absent andthe transition to the ionic-exclusion state is a continuouscrossover. At a critical pore radius a∗ = 0.987 nm, a con-tinuous phase transition occurs, where a single minimumexists for Ωv which evolves towards lower ion concen-trations in the pore with decreasing reservoir concentra-tion in a fast but continuous way (data not shown). Fora = 0.98 nm (a < a∗), the discontinuous jump at the co-existence bulk concentration exists, but with a very smalljump for the partition coefficient.
This is illustrated in Fig. 5 where is shown the par-tition coefficient k versus the pore size for various b.The metastable and unstable branches are shown in redand the critical point, where the transition becomes sec-ond order, is for ∗b = 0.075 mol/L, a∗ = 0.987 nm.One notices the resemblance with the liquid-vapor (L-V) phase transition in bulk fluids, showing the “boilingpoint” curve and the “dew point” curve. Indeed, by in-terchanging the pore size, the partition coefficient of ionsin the pore and the reservoir electrolyte density respec-tively with the temperature, the density and the pressureof a bulk liquid, one notices that the first-order ion ex-clusion transition in a nanopore becomes analogous to abulk liquid-vapor (L-V) transition.
To determine the parameter regime in which the dis-continuous transition takes place, the phase diagram isshown in Fig. 6 for w = 78 and m = 1 to m = 4,where the lines correspond to the reservoir concentrationat the coexistence point versus the pore radius, cb(a).Each curve corresponds to the coexistence line separat-ing the ionic-penetration state, L, (the area above thecurve) from ionic-exclusion state, V (below the curve).
0.7 0.8 0.9 1.0
a (nm)
0.0
0.1
0.2
0.3 Stable Metastable Unstable
<ρ/ρb>
FIG. 5: Partition coefficient k = ⟨⟩/b inside a neutralnanopore (q = 1, m = 2, w = 78) vs the pore radius a for,from left to right, b = 0.7, 0.3, 0.156, 0.08 mol/L (“isobars”).Dotted (grey/red) lines show metastable (unstable) branches,light grey/red lines (guide for the eye) are the “boiling point”curve (bottom) and the “dew point” curve (top) and the dotis the critical point, ∗b = 0.075 mol/L, a∗ = 0.987 nm.
0.6 0.7 0.8 0.9 1.0 1.1 1.2 1.3 1.4
a (nm)
0.0
0.2
0.4
0.6
0.8
1.0
ρbc(mol/L)
FIG. 6: Phase diagram characterizing the discontinuous phasetransition for neutral pores (w = 78 and 2 = 1, 2, 3, 4, fromright to left). The critical line separates the ionic-penetrationL state (area above the curve) from the ionic-exclusion V state(area below the curve) and ends at the critical point (dot)where the transition becomes continuous and then disappears.
The lines end at the m dependent critical point (a∗, ∗b),marked by a dot beyond which the transition disappears.One first notices that the parameter regime where thephase separation is observable is considerably reducedwhen increasing m. The critical end-point evolves to-wards smaller pore sizes and higher reservoir densities.For w = 78 and m from 1 to 4 (the curves in Fig. 6), thecritical pore size is a∗ = 1.44, 0.99, 0.77 and 0.65 nm whilethe critical reservoir concentration is ∗b = 17, 75, 221and 489 mmol/L, respectively. Higher values of m arenot considered in this work since the coexistence line
8
would correspond in this case to very high bulk densitiesand extremely small pore sizes, where hard-core effects,which are not yet incorporated in our model, becomenon-negligible.
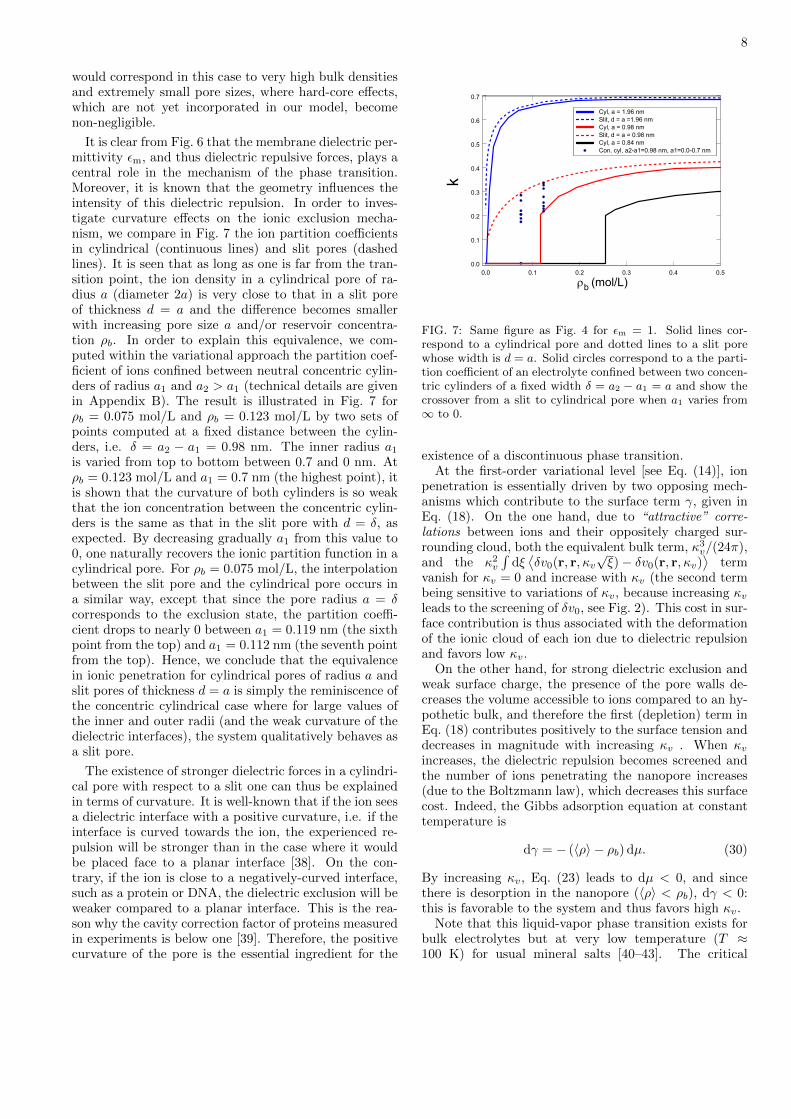
It is clear from Fig. 6 that the membrane dielectric per-mittivity m, and thus dielectric repulsive forces, plays acentral role in the mechanism of the phase transition.Moreover, it is known that the geometry influences theintensity of this dielectric repulsion. In order to inves-tigate curvature effects on the ionic exclusion mecha-nism, we compare in Fig. 7 the ion partition coefficientsin cylindrical (continuous lines) and slit pores (dashedlines). It is seen that as long as one is far from the tran-sition point, the ion density in a cylindrical pore of ra-dius a (diameter 2a) is very close to that in a slit poreof thickness d = a and the difference becomes smallerwith increasing pore size a and/or reservoir concentra-tion b. In order to explain this equivalence, we com-puted within the variational approach the partition coef-ficient of ions confined between neutral concentric cylin-ders of radius a1 and a2 > a1 (technical details are givenin Appendix B). The result is illustrated in Fig. 7 forb = 0.075 mol/L and b = 0.123 mol/L by two sets ofpoints computed at a fixed distance between the cylin-ders, i.e. = a2 − a1 = 0.98 nm. The inner radius a1
is varied from top to bottom between 0.7 and 0 nm. Atb = 0.123 mol/L and a1 = 0.7 nm (the highest point), itis shown that the curvature of both cylinders is so weakthat the ion concentration between the concentric cylin-ders is the same as that in the slit pore with d = , asexpected. By decreasing gradually a1 from this value to0, one naturally recovers the ionic partition function in acylindrical pore. For b = 0.075 mol/L, the interpolationbetween the slit pore and the cylindrical pore occurs ina similar way, except that since the pore radius a = corresponds to the exclusion state, the partition coeffi-cient drops to nearly 0 between a1 = 0.119 nm (the sixthpoint from the top) and a1 = 0.112 nm (the seventh pointfrom the top). Hence, we conclude that the equivalencein ionic penetration for cylindrical pores of radius a andslit pores of thickness d = a is simply the reminiscence ofthe concentric cylindrical case where for large values ofthe inner and outer radii (and the weak curvature of thedielectric interfaces), the system qualitatively behaves asa slit pore.
The existence of stronger dielectric forces in a cylindri-cal pore with respect to a slit one can thus be explainedin terms of curvature. It is well-known that if the ion seesa dielectric interface with a positive curvature, i.e. if theinterface is curved towards the ion, the experienced re-pulsion will be stronger than in the case where it wouldbe placed face to a planar interface [38]. On the con-trary, if the ion is close to a negatively-curved interface,such as a protein or DNA, the dielectric exclusion will beweaker compared to a planar interface. This is the rea-son why the cavity correction factor of proteins measuredin experiments is below one [39]. Therefore, the positivecurvature of the pore is the essential ingredient for the
0.0 0.1 0.2 0.3 0.4 0.5
ρb (mol/L)
0.0
0.1
0.2
0.3
0.4
0.5
0.6
0.7
k
Cyl, a = 1.96 nmSlit, d = a =1.96 nmCyl, a = 0.98 nmSlit, d = a = 0.98 nmCyl, a = 0.84 nmCon. cyl, a2-a1=0.98 nm, a1=0.0-0.7 nm
FIG. 7: Same figure as Fig. 4 for m = 1. Solid lines cor-respond to a cylindrical pore and dotted lines to a slit porewhose width is d = a. Solid circles correspond to a the parti-tion coefficient of an electrolyte confined between two concen-tric cylinders of a fixed width = a2 − a1 = a and show thecrossover from a slit to cylindrical pore when a1 varies from∞ to 0.
existence of a discontinuous phase transition.At the first-order variational level [see Eq. (14)], ion
penetration is essentially driven by two opposing mech-anisms which contribute to the surface term , given inEq. (18). On the one hand, due to “attractive” corre-lations between ions and their oppositely charged sur-rounding cloud, both the equivalent bulk term, 3
v/(24),and the 2
v
∫d⟨v0(r, r, v
√)− v0(r, r, v)
⟩term
vanish for v = 0 and increase with v (the second termbeing sensitive to variations of v, because increasing vleads to the screening of v0, see Fig. 2). This cost in sur-face contribution is thus associated with the deformationof the ionic cloud of each ion due to dielectric repulsionand favors low v.
On the other hand, for strong dielectric exclusion andweak surface charge, the presence of the pore walls de-creases the volume accessible to ions compared to an hy-pothetic bulk, and therefore the first (depletion) term inEq. (18) contributes positively to the surface tension anddecreases in magnitude with increasing v . When vincreases, the dielectric repulsion becomes screened andthe number of ions penetrating the nanopore increases(due to the Boltzmann law), which decreases this surfacecost. Indeed, the Gibbs adsorption equation at constanttemperature is
d = − (⟨⟩ − b) d. (30)
By increasing v, Eq. (23) leads to d < 0, and sincethere is desorption in the nanopore (⟨⟩ < b), d < 0:this is favorable to the system and thus favors high v.
Note that this liquid-vapor phase transition exists forbulk electrolytes but at very low temperature (T ≈100 K) for usual mineral salts [40–43]. The critical

9
temperature T ∗ is thus shifted towards room temper-ature in pores of nanometer radius due to surface ef-fects. Indeed, essentially due to dielectric repulsion, thelow dielectric surface favors the vapor phase and thusshifts the first-order transition. We thus call this phe-nomenon capillary evaporation, just as for nano-capillaryconfined water, which undergoes condensation for hy-drophilic surfaces [44–47] and evaporation for hydropho-bic ones [48, 49].
The possibility for the existence of a first-order phasetransition for electrolytes confined in spherical pores wasfirst pointed-out by Dresner [33]. He used an approxi-mate Green’s function, which is exact at the center ofa spherical pore, and a self-consistent approach to showthat the first-order phase transition survives as long asm ≪ w. However, because of the numerous approxi-mations introduced in his work, Dresner [33] recognizedthat the quantitative predictions of this approach werenot reliable. Yaroschuk [31] later performed a similarself-consistent calculation using the correct Green’s func-tion at the center of a cylindrical pore and showed thatin this case a discontinuous phase transition to an ionic-exclusion state also coccurs. He also argued, however,that this phase transition is unphysical because it comesfrom the use of the DH equation, which ignores non-linear effects. By introducing a non-linear DH equa-tion (in analogy with the non-linear PB equation), heargued that the first-order phase transition should dis-appear. However, this PB-like generalization of the DHequation is incorrect as already argued by Onsager in the1930s [50]. Hence, we argue that, within the confinedelectrolyte model presented in this work, the existence ofa first-order phase transition is physically sound.
We finally analyze Yaroschuk’s self-consistent (SC) ap-proach. It consists in finding self-consistently the screen-ing parameter by defining 2 as the average value of2b e−Φ(r,) in the pore [31]. To pursue in a cylindrical
geometry, he replaced the PMF within the integral byits value on the pore-axis, which in turn causes an un-derestimation of repulsive dielectric forces that becomesignificantly stronger close to the pore wall. He obtainedwhat we call the “mid-point approximation” for :
2 = 2b e− q2
2 w(0,) (31)
where b is defined in Eq. (21). The partition coefficientsin a neutral pore obtained from the numerical solutionof Eq. (31) are compared in Fig. 4 with the prediction ofour variational approach for a = 1.96 and 0.98 nm. It isclearly seen that the mid-point approximation overesti-mates ionic penetration into the pore, which is due to theunderestimation of dielectric forces, as stressed above.This point was also noticed for slit-pores in our previouswork [28]. As one sees in Fig. 4, the error induced by themid-point approach increases with decreasing pore size,which originates from the amplification of image forceswhen one decreases the pore radius. One notices that fora = 0.98 nm the partition coefficients as well as the po-sition of the transition point predicted by the mid-point
approximation can deviate from the predictions of ourvariational method by 200–300 %.
IV. CHARGED PORE
A. Fixed surface charge
In this part, we investigate ion penetration into a cylin-drical nanopore of non-zero negative fixed surface chargedensity, s < 0. We first note that the electroneutralitycondition Eq. (27) can be written, using Eq. (26), as
k+ − k− =2∣s∣qba
=Xm
qb. (32)
We introduce the good coion exclusion (GCE) limit whichcorresponds to the counterion-only case in the nanopore.In the case of slit pores, it was shown that the charge re-pulsion GCE limit is reached for small pore sizes, strongsurface charge, and low bulk concentrations even with-out any dielectric effects [28] (Γ ≈ 1, 2∣s∣/(qba) ≫ 1)and associated with the electric repulsion of coions. Inthe case of cylindrical nanopores, a second dielectric re-pulsion GCE limit exists for low ∣s∣ as soon as Γ ≪2∣s∣/(qba). The partition coefficients of ions in thecylindrical pore become
k+ ≃2∣s∣qba
and k− ≃qab2∣s∣
Γ2 ≪ k+. (33)
The first equality shows that in the GCE regime, the av-erage counterion concentration in the pore, ⟨+⟩ = k+b,is independent of b and depends only on the pore radiusa and the surface charge s. Hence, we are in a regimewhere dielectric repulsion plays only an indirect role (byexcluding coions) in determining the average nanoporecounterion concentration, which is solely determined bythe global electroneutrality in the pore.
We plot in Fig. 8 the partition coefficient of ions k± andthe variational Donnan potential 0 against the reservoirconcentration b for m = 2, a = 0.84 nm and a weak sur-face charge, ∣s∣ = 5.4 × 10⁻⁴ nm−2. One observes thatat high bulk concentrations, k+ and k− decrease when bdecreases, as in the neutral case [and indeed 0 ≈ 0 sinceqΓ ≫ in Eq. (29), the slight difference k+ − k− beinggiven by Eq. (32)] down to a characteristic value cb wherea discontinuous jump towards a weak ionic-penetrationstate takes place. It is interesting to note that the Don-nan potential 0 also exhibits a jump at this point. Afirst conclusion is the existence of a discontinuous tran-sition for charged pores at low ∣s∣, with the coexistencevalue cb(s) ⪅ cb(s = 0). If one further decreases thereservoir concentration, k− evolves towards vanishinglysmall values while k+ abruptly changes by rapidly in-creasing. We thus reach the dielectric repulsion GCEregime, Eq. (33), denoted by the dotted curve. Althoughthe concentration of ions is low, it is not zero (in order tofulfill electroneutrality) and the vapor phase is thus now

10
-1
-2
-3
-4
-5
00.4
0.3
0.2
0.1
00 0.2 0.4 0.6 0.8
coionscounterionsGCE
potential
(mol/L)!b
"0
k+
k#
FIG. 8: Partition coefficients of coions and counterions versusthe reservoir concentration (above) and the effective Donnanpotential (below) for m = 2, w = 78, a = 0.84 nm and∣s∣ = 5.4 × 10⁻⁴ nm−2. The dotted line in the top plotdenotes the GCE regime Eq. (33).
a weak ionic-penetration phase. In this regime, ∣0∣ in-creases abruptly (as 1/q ln[/(2qΓ)]) because the dielec-tric exclusion dominates and thus qΓ≪ in Eq. (29).
Figure 9a shows the partition coefficients for a slightlystronger surface charge density ∣s∣ = 1.35× 10⁻³ nm−2.In this case, the discontinuous jump disappears and thetransition becomes continuous. Hence a large enoughfixed surface charge density destroys the first-order phasetransition. Figure 9b shows the partition coefficients for ahigher surface charge ∣s∣ = 2×10⁻² nm−2. In this case,not only the discontinuous phase transition, but also theturning point characterizing the abrupt change in thebehaviour of k+ disappears from the range of displayedb. In other words, above a characteristic surface chargeand at low concentrations, the dielectric repulsion GCEregime sets in and the counterion penetration into thepore is solely determined by the global electroneutralityEq. (33).
In the previous section, we emphasized that the first-order nature of the transition is associated with the varia-tions of v0 with v, which influences both the nanoporemodified DH correlations (which favor the low densityV phase) and the entropic term (which favors the highdensity L phase). The absence of a first-order phase tran-sition when increasing s beyond a characteristic valueis due to the increase of the surface contribution asso-ciated with the positive electrostatic energy of the poresurface charge (the last term in Eqs. (14, 18)), whichfavors the higher ion concentration in the nanopore nec-essary for screening out the pore surface charge. Thecomplete characterization of the phase transition is il-lustrated in Fig. 10 where is shown the phase diagramfor several values of s. The main effect of the surfacecharge is to reduce the coexistence line and to shift thecritical point towards smaller pore sizes and higher reser-voir densities. Comparison of Figs. 10 and 6 clearly shows
(a)
0.0 0.2 0.4 0.6
ρb (mol/L)
0.0
0.1
0.2
0.3
0.4
coionscounterionsGCEk±
(b)
0.1 0.3 0.5 0.7
ρb(mol/L)0.0
0.5
1.0
1.5
k±
coionscounterionsGCE
FIG. 9: Partition coefficients of coions and counterions versusthe reservoir concentration for m = 2, w = 78, a = 0.84 nmand ∣s∣ = 1.35×10⁻³ nm−2 (above) and ∣s∣ = 2×10⁻² nm−2
(below). The dotted line in the top plot denotes the GCEregime Eq. (33).
that the increase of the surface charge plays qualitativelythe same role as an increase of the membrane dielectricpermittivity. It is important to note that the smearingof the discontinuous phase transition takes place over avery narrow surface charge range: within the parameterregime considered in Fig. 10, the transition completelydisappears for ∣s∣ > 6.0× 10⁻³ nm−2.
It is well known that nature uses the very same poresurface chargemechanism to deal with strong image forcesin water-filled ion channels [51]. As it was illustrated inthe Section III, a neutral channel is impermeable to ionsat low reservoir concentrations. In potassium channels,negatively charged carbonyl oxygens located at the poresurface [52, 53] reduce the potential barrier induced byimage interactions and make the channel cation-selective.

11
0.6 0.7 0.8 0.9 1.00.0
0.5
1.0
1.5
2.0
2.5
a (nm)
ρbc(mol/L)
FIG. 10: Phase diagram characterizing the discontinuousphase transition in charged pores for several values of the fixedsurface charge. The critical line separates the ion-penetrationstate (area above the curve) from the ion-exclusion state (areabelow the curve) and ends at the critical point (dot). m = 2and w = 78. From top to bottom, the lines correspond to∣s∣ = 0, 1, 2, 4, 6× 10⁻³ nm−2.
B. Charge regulation mechanism
In the previous part, we considered a boundarysurface characterized by a fixed and uniform surfacecharge. However, in experiments on the conductivity ofnanopores in PET membranes [34, 54], the surface chargedensity is unknown and cannot be measured easily. If onewishes to make quantitative comparisons with these ex-periments, one should consider the fact that, in these ex-periments where the pore surface carries carboxylic acidgroups, s increases with pH [55]. The pH in the reser-voir, defined as pH = − log10 b (H3O+), is thus used asa control parameter.
In this section, we introduce a charge regulation mech-anism where, in the presence of water, chemical groupslocated at the surface may become chemically active,leading to proton release from the acid groups and thusto a variable surface charge. As a first hint of the fullproblem, we use two approximations: i) we consider ex-clusively the case of trace hydronium ions, H3O+, (spec-tator ions) with a bulk concentration (2 < pH < 12)significantly lower than that of salt ions; ii) the effectivesurface charge density, which becomes a function of thepH, is computed at the an effective mean-field level [56],i.e. we consider that image forces, etc. for the hydro-nium ions in the pore and thermal fluctuations of theelectric potential are implicitly accounted for via en ef-fective equilibrium constant.
The charge dissociation mechanism at the surface isdescribed by the following chemical equilibrium:
[surface]− COOH + H2O [surface]− COO−
+ H3O+
(34)characterized by the equilibrium constant Ka. Note the
this effective Ka implicitly takes into account not onlyimage forces but also all other non-electrostatic interac-tions at the pore surface. The source term [last term ofEq. (14)] is thus modified. In a simple Langmuir two-state model [56, 57], each carboxylic group at the cylin-dric surface is a site, with surface density 0, which canbe empty, i.e. dissociated, with an energy per site −0, oroccupied, i.e. associated with an hydronium ion, with anenergy Ea which takes into account the chemical bound-ing and all other surface interactions and which, in afirst approximation, is taken to be independent of v.The grand potential for this adsorbed two-dimensionalhydronium gas is then
Q2D = e0 + +eEa (35)
where + = +b = ln b,H3O+e−bℓb/2 is the fugacity of
hydronium ions and Ea is the energy gained in the asso-ciated state. The equilibrium constant of Eq. (34) is thus
defined as Ka ≡ H3O+ COO−
COOH= e−Ea+bℓB , where i are
activities coefficients of the relevant species.Instead of s0 in Eq. (14), the source term becomes
now [56]
Ω2D
S= −0 lnQ2D (36)
= −00 − 0 ln[1 + 10pKa−pH e−0
]where pKa = − log10Ka. By minimizing the full grandpotential with respect to 0, one obtains the electroneu-trality condition Eq. (27) with the effective surface chargedensity [58]
s = −0 −+
S
∂Ω2D
∂+=
−0
1 + 10pKa−pH e−0. (37)
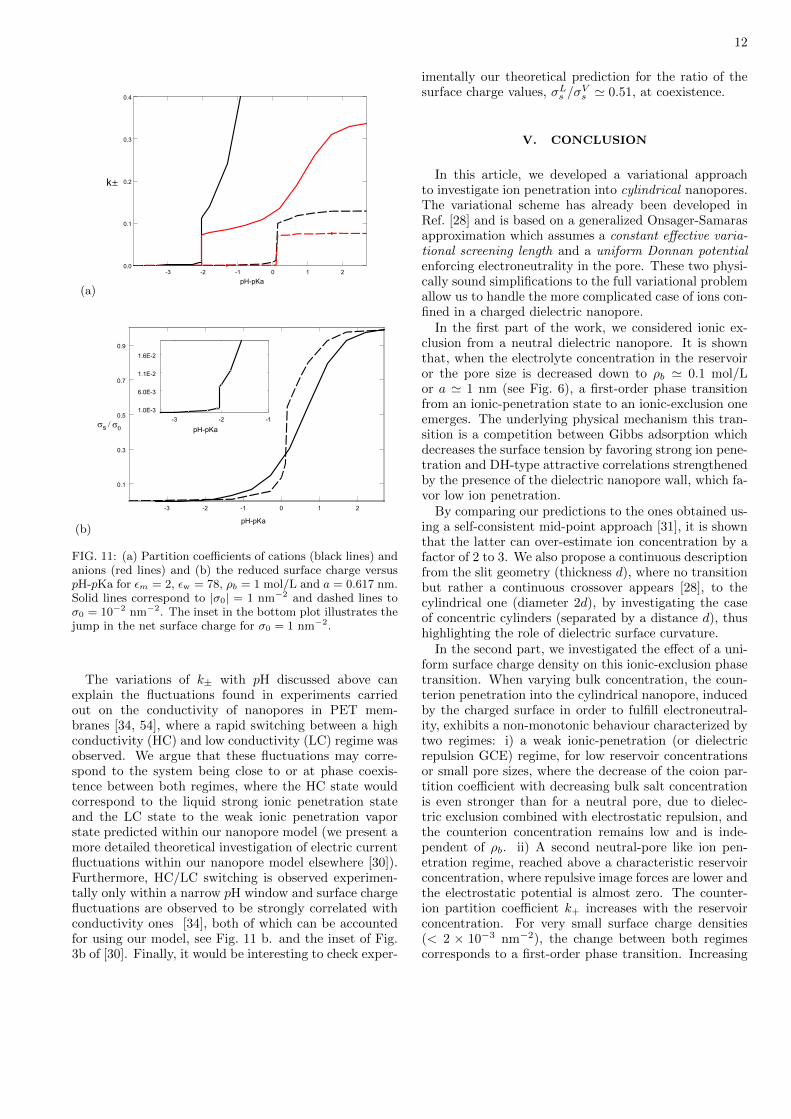
Figure 11 illustrates for 0 = 1 and 10 nm−2 the ionicpartition coefficients (Fig. 11a) and the surface charge(Fig. 11b) versus the acidity of the solvent, pH − pKa.The low pH regime corresponds to the neutral pore limit,where hydronium ions of high bulk concentration almosttotally neutralize the acid groups of the surface and thesystem is in the weak ionic penetration state. By in-creasing pH (or decreasing the hydronium concentrationin the bulk), the partition coefficient slowly increases un-til a characteristic value, pHC , beyond which one crossesthe critical line and due to the high surface charge attrac-tion, the system evolves into the ionic penetration state.This transition is illustrated in Fig. 11a by the suddenjump of the coion and counterion partition coefficients,k±. The most remarkable prediction of our charge reg-ulation model is that the surface charge density displaysa sharp discontinuous increase at the transition point.This behavior is obviously associated with the jump ofthe electrostatic potential 0 (see Fig. 8) at the transitionfrom the V- to the L-phase: salt ions induce the screeningof the electrostatic potential in the pore 0 ≃ 0, whichleads to a release of the spectator hydronium ions to thebulk and thus a sudden increase of the surface charge.
12
(a)
-3 -2 -1 0 1 2pH-pKa
0.0
0.1
0.2
0.3
0.4
k≤
(b)
-3 -2 -1 0 1 2
pH-pKa
0.1
0.3
0.5
0.7
0.9
σs / σ0-3 -2 -1
pH-pKa
1.0E-3
6.0E-3
1.1E-2
1.6E-2
FIG. 11: (a) Partition coefficients of cations (black lines) andanions (red lines) and (b) the reduced surface charge versuspH-pKa for m = 2, w = 78, b = 1 mol/L and a = 0.617 nm.Solid lines correspond to ∣0∣ = 1 nm−2 and dashed lines to0 = 10−2 nm−2. The inset in the bottom plot illustrates thejump in the net surface charge for 0 = 1 nm−2.
The variations of k± with pH discussed above canexplain the fluctuations found in experiments carriedout on the conductivity of nanopores in PET mem-branes [34, 54], where a rapid switching between a highconductivity (HC) and low conductivity (LC) regime wasobserved. We argue that these fluctuations may corre-spond to the system being close to or at phase coexis-tence between both regimes, where the HC state wouldcorrespond to the liquid strong ionic penetration stateand the LC state to the weak ionic penetration vaporstate predicted within our nanopore model (we present amore detailed theoretical investigation of electric currentfluctuations within our nanopore model elsewhere [30]).Furthermore, HC/LC switching is observed experimen-tally only within a narrow pH window and surface chargefluctuations are observed to be strongly correlated withconductivity ones [34], both of which can be accountedfor using our model, see Fig. 11 b. and the inset of Fig.3b of [30]. Finally, it would be interesting to check exper-
imentally our theoretical prediction for the ratio of thesurface charge values, Ls /
Vs ≃ 0.51, at coexistence.
V. CONCLUSION
In this article, we developed a variational approachto investigate ion penetration into cylindrical nanopores.The variational scheme has already been developed inRef. [28] and is based on a generalized Onsager-Samarasapproximation which assumes a constant effective varia-tional screening length and a uniform Donnan potentialenforcing electroneutrality in the pore. These two physi-cally sound simplifications to the full variational problemallow us to handle the more complicated case of ions con-fined in a charged dielectric nanopore.
In the first part of the work, we considered ionic ex-clusion from a neutral dielectric nanopore. It is shownthat, when the electrolyte concentration in the reservoiror the pore size is decreased down to b ≃ 0.1 mol/Lor a ≃ 1 nm (see Fig. 6), a first-order phase transitionfrom an ionic-penetration state to an ionic-exclusion oneemerges. The underlying physical mechanism this tran-sition is a competition between Gibbs adsorption whichdecreases the surface tension by favoring strong ion pene-tration and DH-type attractive correlations strengthenedby the presence of the dielectric nanopore wall, which fa-vor low ion penetration.
By comparing our predictions to the ones obtained us-ing a self-consistent mid-point approach [31], it is shownthat the latter can over-estimate ion concentration by afactor of 2 to 3. We also propose a continuous descriptionfrom the slit geometry (thickness d), where no transitionbut rather a continuous crossover appears [28], to thecylindrical one (diameter 2d), by investigating the caseof concentric cylinders (separated by a distance d), thushighlighting the role of dielectric surface curvature.
In the second part, we investigated the effect of a uni-form surface charge density on this ionic-exclusion phasetransition. When varying bulk concentration, the coun-terion penetration into the cylindrical nanopore, inducedby the charged surface in order to fulfill electroneutral-ity, exhibits a non-monotonic behaviour characterized bytwo regimes: i) a weak ionic-penetration (or dielectricrepulsion GCE) regime, for low reservoir concentrationsor small pore sizes, where the decrease of the coion par-tition coefficient with decreasing bulk salt concentrationis even stronger than for a neutral pore, due to dielec-tric exclusion combined with electrostatic repulsion, andthe counterion concentration remains low and is inde-pendent of b. ii) A second neutral-pore like ion pen-etration regime, reached above a characteristic reservoirconcentration, where repulsive image forces are lower andthe electrostatic potential is almost zero. The counter-ion partition coefficient k+ increases with the reservoirconcentration. For very small surface charge densities(< 2 × 10⁻³ nm−2), the change between both regimescorresponds to a first-order phase transition. Increasing
13
the surface charge density shrinks the coexistence lineand moves the critical point towards smaller pore sizesand higher electrolyte concentrations.
We finally consider the experimental case where thesurface charge density varies with the bulk pH by intro-ducing a charge regulation mechanism. The first-ordertransition survives and qualitatively corresponds to ex-perimental results for conductivity fluctuations measure-ments in nanopores [34, 54]. Moreover, our charge regu-lation model, at an effective mean-field level, predicts ajump of the surface charge density as a funciton of pH atthe transition, which is the signature of a sudden releaseof hydronium ions from the pore in going from the ionicVapor to Liquid phase.
Of course, our model has several limitations. Firstof all, due to the homogeneous form of the variationalscreening length, the dielectric/solvation deficit repul-sion is slightly underestimated. One interesting possibleextension consists in introducing a piecewise screeninglength, as in Ref. [26], but for an initial investigationof the type presented here the technical complicationswould outweigh the benefits. The model neglects alsoion size, which becomes important for bulk systems athigh concentration or strongly charged interfaces whereion concentrations may exceed the close packing value.For a cylindrical pore characterized by strong repulsiveimage forces where ionic concentrations are always far be-low their bulk value, we expect the ion size effect to playa less important role than in the bulk. However directcorrelations, such as ion pairing, between “dressed” ionsin the nanopore are neglected and could be taken into ac-count by extending the variational approach adopted inthe present work to a second order cumulant expansion.Further investigation will be necessary to estimate thehigher order contributions and we expect that it mightchange the parameter values at coexistence without mod-ifying our qualitative conclusions.
Our present model also neglects ionic polarizabilityand treats the water solvent as a dielectric continuumof the same polarizability as in the bulk. It is importantto note that due to various effects, the dielectric permit-tivity within the pore can be lower or higher than that ofthe bulk [59]. The consideration of this additional com-plication requires a more detailed solvent model. We arecurrently working on the generalization of our model toinclude the polarizability of charged ions, which shouldyield a more complete picture of the behaviour of largeanions in confined geometries. The application of thepresent model to membrane nanofiltration with practicalapplications and direct comparison with experiments willbe presented in a future work.
Acknowledgments
We thank B. Coasne for helpful discussions. This workwas supported in part by the French ANR (project SI-MONANOMEM No. ANR-07-NANO-055).
APPENDIX A: GREEN’S FUNCTION INCYLINDRICAL COORDINATES : SINGLE
CYLINDER
In this appendix, we derive the Green’s functionv0(r, r′) in the presence of a cylindrical dielectric in-
terface of infinite length and radius a. The systemis characterized by an electric discontinuity defined by(r) = <Θ(a − r) + >Θ(r − a) and a Debye constant(r) = <Θ(a − r) + >Θ(r − a), where r denotes theradial distance and ≷ means r ≷ a. We solve the Debye-Huckel equation
[−∇((r)∇) + (r)2(r)
]v0(r, r′) = e2(r− r′) (A1)
by exploiting the cylindrical symmetry of the system, i.e.v0(r, r′) = v0(z−z′, −′, r, r′), where stands for the az-imuthal angle. To this end, we expand v0(r, r′) in Fourierspace
v0(r, r′) =
+∞∑m=−∞
eim(−′)∫ +∞
−∞
dk
42eik(z−z′)v0(r, r′;m, k).
(A2)By injecting this expansion into Eq. (A1) and using
(r− r′) =1
r(r − r′)(z − z′)( − ′)
(z − z′) =1
2
∫ ∞−∞
dk eik(z−z′)
( − ′) =1
2
+∞∑m=−∞
eim(−′), (A3)
Eq. (A1) reduces to
∂2v0
∂r2+
1
r
∂v0
∂r−[ϰ2≷ +
m2
r2
]v0 = −
4ℓ≷r
(r− r′), (A4)
where we have defined ϰ2≷ = k2 + 2
≷ and ℓ≷ =
e2/(4≷). The homogeneous solutions of Eq. (A4)are the modified Bessel functions, v0(r, r′;m, k) =A(r′)Im(ϰr) + B(r′)Km(ϰr). By taking into accountthe finiteness of the Green’s function on the cylinder axisr = 0 and at infinity r →∞ together with the continuityconditions
v>0 (r = a) = v<0 (r = a) (A5)
m∂v>0∂r
∣∣∣∣r=a
= w∂v<0∂r
∣∣∣∣r=a
(A6)
∂v>0∂r
∣∣∣∣r=r′
=∂v<0∂r
∣∣∣∣r=r′− 4ℓB
r′, (A7)
one obtains the solution of Eq. (A1) in the form
v≷0 (r, r′) = ℓ≷
e−≷∣r−r′∣
∣r− r′∣+ v
≷0 (r, r′). (A8)

14
The first term in the rhs is the usual DH potential in the bulk and the second term, which incorporates the dielectricdiscontinuity at the interface, reads for r′ < r < a
v<0 (r, r′) =4ℓ<
′∑m≥0
cos[m( − ′)]∫ ∞
0
dk cos[k(z − z′)]Fm(k;<, >)Im(ϰ<r)Im(ϰ<r′) (A9)
Fm(k;<, >) =<ϰ<Km(ϰ>a)K ′m(ϰ<a)− >ϰ>Km(ϰ<a)K ′m(ϰ>a)
>ϰ>Im(ϰ<a)K ′m(ϰ>a)− <ϰ<Km(ϰ>a)I ′m(ϰ<a). (A10)
and the prime on the summation sign means that the term m = 0 must be multiplied by 1/2. Let us note that in themid-point approximation (r = 0), the potential reduces to
v<0 (r = r′ = 0, z = z′, = ′) =4ℓ<
∫ ∞0
dk<ϰ<K0(ϰ>a)K1(ϰ<a)− >ϰ>K0(ϰ<a)K1(ϰ>a)
<ϰ<K0(ϰ>a)I1(ϰ<a) + >ϰ>I0(ϰ<a)K1(ϰ>a). (A11)
If the source is located outside the cylinder, one obtains in the region a < r < r′
v>0 (r, r′) =4ℓ>
′∑m≥0
cos[m( − ′)]∫ ∞
0
dk cos[k(z − z′)]Gm(k;<, >)Km(q>r)Km(q>r′) (A12)
Gm(k;<, >) =>q>Im(q<a)I ′m(q>a)− <q<Im(q>a)I ′m(q<a)
<q<Km(q>a)I ′m(q<a)− >q>Im(q<a)K ′m(q>a). (A13)
We also report the following coefficients introduced in Eq. (A15)
J0(k;) = I20 (ϰa)− I2
1 (ϰa) ,
Jm(k;) = I2m(ϰa)− Im+1(ϰa)Im−1(ϰa) for m > 0. (A14)
Finally, in the calculation of the variational grand potential Eq. (14), we perform analytically the integral over theradial distance r = ∣r∣ for the dielectric part which depends on v0, which simplifies to
ΩdVp
=2v
22
′∑m≥0
∫ 1
0
d
∫ ∞0
dk[Fm(k;v
√, > = 0)Jm(k;v
√)− Fm(k;v, > = 0)Jm(k;v)
]. (A15)
APPENDIX B: GREEN’S FUNCTION IN CYLINDRICAL COORDINATES : CONCENTRICCYLINDERS
We report in this appendix the Green’s function solution of Eq. (A4), for concentric cylinders of radius a1 and a2
with a1 < a2. We briefly explain in the end the computation of the variational free energy for this more complicatedcase. The system is characterized by a dielectric discontinuity defined by (r) = mΘ(a1−r)+ wΘ(r−a1)Θ(a2−r)+mΘ(r − a2) and a Debye constant (r) = vΘ(r − a1)Θ(a2 − r) (we consider only the case of ions confined betweenthe two cylinders). The solution of Eq. (A4) satisfying the boundary conditions
v>0 (r = a1) = v<0 (r = a1) (B1)
v>0 (r = a2) = v<0 (r = a2) (B2)
w∂v>0∂r
∣∣∣∣r=a1
= m∂v<0∂r
∣∣∣∣r=a1
(B3)
m∂v>0∂r
∣∣∣∣r=a2
= w∂v<0∂r
∣∣∣∣r=a2
(B4)
∂v>0∂r
∣∣∣∣r=r′
=∂v<0∂r
∣∣∣∣r=r′− 4ℓB
r′(B5)
is given by
v0(r, r′) = ℓBe−v∣r−r′∣
∣r− r′∣+ v0(r, r′) (B6)

15
with
v0(r, r′) =4ℓB
′∑m≥0
cos[m( − ′)]∫ ∞
0
dk cos[k(z − z′)] Am(k;v)Im(ϰvr)Im(ϰvr′) (B7)
+Bm(k;v)Km(ϰvr)Km(ϰvr′) + Cm(k;v) [Im(ϰvr)Km(ϰvr′) + Im(ϰvr′)Km(ϰvr)]
where we have defined
Am(k;v) =am(k;v)cm(k;v)
am(k;v)bm(k;v)− cm(k;v)dm(k;v)
Bm(k;v) =dm(k;v)bm(k;v)
am(k;v)bm(k;v)− cm(k;v)dm(k;v)
Cm(k;v) =cm(k;v)dm(k;v)
am(k;v)bm(k;v)− cm(k;v)dm(k;v),
with the coefficients am(k;v), bm(k;v) and cm(k;v) defined according to
am(k;v) = mkKm(ϰva1)I ′m(ka1)− wϰvIm(ka1)K ′m(ϰva1)
bm(k;v) = mkIm(ϰva2)K ′m(ka2)− wϰvKm(ka2)I ′m(ϰva2)
cm(k;v) = wϰvKm(ka2)K ′m(ϰva2)− mkKm(ka2)K ′m(ϰva2)
dm(k;v) = wϰvIm(ka1)I ′m(ϰva1)− mkIm(ka1)I ′m(ϰva1),
and ϰ2v = 2
v + k2. The Green’s function evaluated at the same point is given by
v0(r, r′) = vbc(0, 0)− vℓB + v0(r, r′) (B8)
with
v0(r, r) =4ℓB
′∑m≥0
∫ ∞0
dkAm(k;v)Im(ϰvr)2 +Bm(k;v)Km(ϰvr)2 + 2Cm(k;v)Im(ϰvr)Km(ϰvr)
. (B9)
The DH pressure from an hypothetical bulk solution isnow given by
p = −ΩvL
= −(a22 − a2
1)3v
24(B10)
and the spatial integrations in Eq. (14) are evaluatedfrom r = a1 to r = a2. As in the case with a single
cylindrical pore, the obtained grand-potential energy Ωvis minimized with respect to v to find the optimal solu-tion to the variational problem.
[1] C. Holm, P. Kekicheff, and R. Podgornik, ElectrostaticEffects in Soft Matter and Biophysics, Kluwer Aca-demic,Dordrecht (2001).
[2] M. Dubois and T. Zemb, Langmuir, 7, 1352 (1991).[3] S. D. Shoemaker and T. K. Vanderlick, Biophys. J., 83,
2007 (2002).[4] D. J. Bonthuis et al., Phys. Rev. Lett., 97, 128104 (2006).[5] Verwey EJW, Overbeek JThG, Theory of the stability of
lyophobic colloids, Elsevier, Amsterdam (1948).[6] A. Parsegian, Nature, 221 ,844 (1969).[7] D. G. Levitt , Biophys. J., 22, 209 (1978).[8] Y. Levin, Europhys. Lett., 76 , 163 (2006).[9] B.I. Shklovskii, Phys. Rev. E, 60, 5802 (1999).
[10] A. G. Moreira and R. R. Netz, Europhys. Lett., 52 (6),705 (2000) .
[11] P. Attard, D.J. Mitchell , and B.W. Ninham, J. Chem.Phys., 88, 4987 (1988); ibid. 89, 4358.
[12] R. Podgornik and B. Zeks, J. Chem. Soc. Faraday Trans.II 84 , 611 (1988).
[13] R.R. Netz and H. Orland, Eur. Phys. J. E, 1, 203 (2000).[14] M. Kanduc and R. Podgornik, Eur. Phys. J. E, 23, 265
(2007).[15] D.S. Dean and R.R. Horgan,, Phys. Rev. E 70, 011101
(2004)[16] D.S. Dean and R.R. Horgan, J. Phys. C. 17, 3473, (2005).[17] M. Kanduc, A. Naji and R. Podgornik, J. Chem. Phys.,

16
132, 224703 (2010).[18] A. Naji et al., Physica A, 352, 131 (2005).[19] A. Arnold and C. Holm, Comput. Phys. Commun. 148,
327 (2002).[20] Tyagi S., Arnold A. and C. Holm, J. Chem. Phys. 127,
154723 (2007).[21] Y. S. Jho et al., Phys. Rev. E 76, 011920 (2007).[22] Y. S. Jho et al., J. Chem. Phys. 129, 134511 (2008).[23] Y. S. Jho et al., Phys. Rev. Lett. 101, 188101 (2008).[24] R.R. Netz and H. Orland, Eur. Phys. J. E, 11, 301 (2003).[25] R.A. Curtis and L. Lue,. J. Chem. Phys., 123, 174702
(2005)[26] M.M. Hatlo, R.A. Curtis and L. Lue, J. Chem. Phys.,
128, 164717 (2008)[27] M.M. Hatlo and L. Lue, Soft Matter, 4, 1582 (2008)[28] S. Buyukdagli, M. Manghi, and J. Palmeri, Phys. Rev.
E 81, 041601 (2010).[29] L. Onsager and N. Samaras, J. Chem. Phys. 2, 528
(1934).[30] S. Buyukdagli, M. Manghi, and J. Palmeri, Phys. Rev.
Lett., 105, 158103 (2010).[31] A.E. Yaroshchuk, Adv. Colloid Interf. Sci., 85, 193
(2000).[32] A. L. Loeb, J. Colloid. Sci.,6, 75 (1950).[33] L. Dresner, Desalination, 15, 39 (1974).[34] A.A. Lev et al., Proc. R. Soc. Lond. B 252, 187 (1993).[35] B. Jancovici and X. Artru, Mol. Phys., 49, 487 (1983).[36] S. Buyukdagli, M. Manghi, and J. Palmeri, unpublished.[37] D.A. McQuarrie, Statistical Mechanics chap.15 (Univer-
sity Science Book, New York, 2000).[38] J. Groenewold, J. Chem. Phys., 107, 9668 (1997).[39] T. Arawaka and S. N. Timasheff, Biochemistery, 21, 6545
(1982).[40] G. Stell et al. Phys. Rev. Lett. 37, 1369 (1976).
[41] R.R. Singh and K.S. Pitzer, J. Chem. Phys. 92, 6775(1990).
[42] M.E. Fisher and Y. Levin, Phys. Rev. Lett. 71, 3826(1993).
[43] A.-P. Hynninen and A.Z. Panagiotopoulos, Mol. Phys.106, 2038 (2008).
[44] R. Evans, U.M.B. Marconi, P. Tarazona, J. Chem. Phys.84, 2376 (1986).
[45] R. Evans, J. Phys.: Condens. Matter 2, 8989 (1990).[46] G.S. Heffelfinger, F. van Swol, and K.E. Gubbins, J.
Chem. Phys. 89, 5202 (1988).[47] B.K. Peterson et al., J. Chem. Phys. 88, 6487 (1988).[48] R. Roth and K.M. Kroll, J. Phys.: Condens. Matter 18,
6517 (2006).[49] O. Beckstein and M.S.P. Sansom, Proc. Natl. Acad. Sc.
USA 100, 7063 (2003).[50] L. Onsager, Chem. Rev., 13, 73 (1933).[51] B. Hille, Ion Channels of Excitable Membranes, Sinauer
Associates, Sunderland, MA (2001).[52] J. Zhang, A. Kamenev, B. I. Shklovskii, Phys. Rev. Lett.
95, 148101 (2005).[53] J. Zhang, A. Kamenev, and B. I. Shklovskii, Phys. Rev.
E 73, 051205 (2006).[54] C.A. Pasternak et al., Colloids Surf. A 77, 119 (1993).[55] H.J.M. Hijnen and J.A.M. Smit, Biophys. Chem. 41, 101
(1991).[56] R. Podgornik, J. Chem. Phys., 91, 5840 (1989).[57] B.W. Ninham and V.A. Parsegian, J. Theor. Biol., 31,
405 (1971).[58] M. Manciu and E. Ruckenstein, Advances in Colloid and
Interface Science, 105, 63 (2003).[59] Marti et al., J. Phys. Chem. B 110, 23987 (2006)