ionic abundance and distributions in groundwater systems: a
TRANSCRIPT
Greener Journal of Physical Sciences ISSN: 2276-7851 Vol. 3 (4), pp. 115-130, May 2013.
www.gjournals.org 114
ISSN: 2276-7851 Impact Factor 2012 (UJRI): 0.7799 ICV 2012: 5.88
Ionic Abundance and Distributions in
Groundwater Systems: A Case Study
By
Nwankwoala H.O.
Greener Journal of Physical Sciences ISSN: 2276-7851 Vol. 3 (4), pp. 115-130, May 2013.
www.gjournals.org 115
Research Article
Ionic Abundance and Distributions in Groundwater Systems: A Case Study
Nwankwoala H.O.
Department of Geology, College of Natural and Applied Sciences, University of Port Harcourt, Nigeria.
Email:[email protected] Abstract A hydro-chemical evaluation of ionic abundance in groundwater systems in Port Harcourt City, Southern Nigeria, was carried out. Thirty two (32) groundwater samples were analyzed for their physical and chemical properties. The average temperature of the groundwater samples is 29
oC. The water is slightly acidic with pH values ranging from 4.28 – 7.72
while Eh ranges between 26.44 to 197mV. Electrical Conductivity (EC) values ranges from 28µS/cm to 717.40µS/cm. Elevated EC values in some locations are indicative of high ionic activities as well as salinity and suggest possible pollution of groundwater. Chloride concentrations in some boreholes are up to 710mg/l, which shows saltwater encroachment at those locations. The Total Dissolved Solids (TDS) ranges from 12.60mg/l – 401mg/l, respectively. Besides pH, Fe, TDS and EC (in some locations), all other parameters fall within the WHO desirable and maximum permissible limits for drinking and other purposes. Thus, the groundwater in the area is low in dissolved constituents, soft and acidic. When treated for pH, Fe
2+, Mn, Zn, Cu, and Pb, in the locations affected, the water would be suitable for
domestic purposes. The analytical results show the abundance of the ions in the following order: Mg > Ca > Na > K = Cl > SO4 > HCO3 > NO3. Chloride is the dominant anion found in the groundwater of the study area. For determining groundwater types and visualizing trends of groundwater chemistry, Piper trilinear diagrams reveal that there is a mixture of two types of water with variable concentrations of major ions. These are: Ca – Mg-Cl-SO4 type and Na – K - Cl - SO4 type water. The second water type is also influenced by NO3. This means that groundwater in the area is mainly made up of mixtures of earth alkaline and alkaline metals. Chloride is the dominant anion followed by sulphate. This study therefore, provides the basic tool for sustainable groundwater management in the context of quality assessment. It is recommended that regular, systematic, comprehensive and sustainable groundwater quality monitoring in the study area be carried out. Key Words: Groundwater quality, Ionic ratio, Hydro-geochemistry, Saltwater intrusion.
Introduction The chemistry of groundwater not only depends on the processes in the Vadose zone but also on the reactions operating along the saturated flow system (Freeze & Cherry, 1979). Most of the same processes affecting ion concentrations in the unsaturated zone are also operative in the saturated zone including the dissolution and precipitation of various minerals and cat-ion exchange (Swartz and Zhang, 2003). Groundwater chemistry is largely a function of the mineral composition of the aquifer through which it flows (Lakshmanan et al., 2003; Nwankwoala & Udom, 2011a). The order groundwater encounters strata of different mineralogical composition, which influences the final chemistry of the groundwater (Freeze & Cherry, 1979).
Port Harcourt, the study area, is the capital of Rivers State. The area is approximately between latitudes 04
043’N and 05
000’N and longitudes 06
045’E and 07
006’E (Fig.1). The study locations fall within both Port Harcourt
City and Obio/Akpor Local Government Areas. The area is situated within the subequatorial region, north of the Bight of Biafra. It is a deep-water Port City, which lies along Bonny River (an eastern distributary of the Niger), 41 miles (66km) upstream from the Gulf of Guinea.
Several studies have been carried out on the interaction of groundwater with the host rock in parts of the Niger Delta (Amadi et al., 1989; Olobaniyi and Owoyemi, 2006; Edet and Ekpo, 2008, Nganje et al., 2010 and Amadi et al 2010). None of the studies have been able to evaluate the hydro-geochemistry of groundwater in the area, especially of the deep aquifer systems.
The hydro-geochemical processes and hydro-geochemistry of the groundwater vary spatially and temporally, depending on the geology and chemical characteristics of the aquifer ( Lakshmanan et al., 2003 ; Nwankwoala &

Greener Journal of Physical Sciences ISSN: 2276-7851 Vol. 3 (4), pp. 115-130, May 2013.
www.gjournals.org 116
Udom, 2011b). Thus, knowledge on hydro-geochemical processes that control groundwater chemical evolution could lead to improved understanding of hydro-geochemical characteristics of an aquifer. This would contribute to effective management and use of groundwater resources. This study, therefore aims at identifying the hydro-geochemical processes that control the groundwater chemistry, the ionic abundance as well as the distribution in the area. Methods of Study Groundwater samples were collected from boreholes after 5 minutes of pumping to ensure the samples were true representative from the aquifer. The samples were stored in sterilized two-litre containers with tightly fitting covers wrapped in a black polyethylene plastic bag and put in a cooler to ensure constant temperature. The containers were first washed with de-ionized water, and then several times with the sample water before collection in order to avoid any contamination.
The electrical conductivity was measured using a Mark Electronic Switchgear Conductivity Meter. After sampling, the lids of the containers were immediately replaced to minimize contamination and escape of gases. The samples were then stored in an ice-packed cooler for analysis within 24 hours. All analyses were carried out at standardized Parameters like pH, temperature and electrical conductivity were determined in the field due to their unstable nature. The pH of the water sample was measured with a pH-meter. The glass tube in the kit was sterilized before been filled to its mark with water sample. The tube was then placed in the space provided in the equipment and a knob adjusted for colour matching, the pH was then read and recorded. The temperature was read using a laboratory mercury thermometer with national and international regulatory methods. The evaluation of water quality was in accordance with regulatory standard. The approach ensures that the samples collected were tested in accordance with agreed requirements using competent personnel as well as appropriate equipment and materials. Fig.1 is the map of Port Harcourt showing sampling locations.
Figure 1: Map of Study Area showing Sampled Boreholes

Greener Journal of Physical Sciences ISSN: 2276-7851 Vol. 3 (4), pp. 115-130, May 2013.
www.gjournals.org 117
Results and Discussion The analytical results for groundwater samples from study area are presented in Table 1. Groundwater temperature in the study area ranges from 26.35 – 29.64
0C. There is no standard value recommended for groundwater
temperature by the WHO (2006). The hydrogen ion concentration (pH) and redox potential (Eh) of the groundwater in the study area ranges from 3.84 – 7.72 and 26.44 – 197.00mV respectively. EC ranges between 28.00µS/cm and 717.40µS/cm. Majority of the samples have values which fall above the WHO (2006) guide values of 500µS/cm, except few low values. The concentration of Total Dissolved Solids (TDS) ranges from 12.60–401.00mg/l. The TDS values correlate well with conductivity values. The highest TDS value (401.00mg/l) recorded had a corresponding high conductivity of 717.40µS/cm in Borokiri (UPE) (BH 5). The concentration of Total Suspended Solids (TSS) ranges from Below Detection Limit (BDL) to 35.00mg/l. TSS is not stated in WHO (2006) guidelines. WHO (1996) stipulates 10mg/l as the desirable level of TSS and a maximum permissible limit of 25mg/l in drinking water. The highest TSS value (35.00mg/l) was recorded in Borokiri Sand-fill (BH 14). A comparison of measured TSS value with WHO (1996) standards shows that the water samples are within the maximum permissible limit implying that the water is suitable for drinking/domestic uses, except in Borokiri Sand-fill (BH 14) which needs to be treated before use.

Greener Journal of Physical Sciences ISSN: 2276-7851 Vol. 3 (4), pp. 115-130, May 2013.
www.gjournals.org 118
Table 1: Hydro-geochemical Data of Groundwater Samples in the Study Area BH No. Location Temp
(0C)
pH EC
(µS/cm) TDS (mg/l)
TSS (mg/l)
Hardness (mg/l)
Cl-
(mg/l) Eh
(mV) SO4
2-
(mg/l)
Fe
(mg/l) Salinity (mg/l)
NO3-
(mg/l)
HCO3
-
(mg/l)
1. Abuloma (GSS) 27.22 55.53 573.00 250.00 1.00 28.00 710.00 122.00 ND 1.600 116.00 0.230 18.401 2. Amadi-Ama 26.91 6.81 421.60 370.50 5.00 8.43 250.00 131.00 ND 0.400 511.00 ND 21.800
3. Moscow Rd 1 (Pumping Station)
27.02 4.50 522.00 230.60 10.0 14.50 330.00 170.00 ND ND 355.00 0.201 6.701
4. Moscow Rd 2(Post Office)
28.33 7.40 513.00 221.30 12.00 20.40 300.00 143.00 75.00 0.400 82.00 0.831 10.321
5. Borokiri (UPE) 26.51 3.84 717.40 142.70 1.00 14.00 351.00 152.00 19.30 0.020 181.00 0.510 21.010
6. Borokiri (Comprehensive Sec. Sch.)
29.03 7.72 618.20 297.20 BDL 36.00 410.00 191.00 90.10 ND 163.40 ND 54.011
7. Eagle Island (NAOC Fence)
26.35 6.50 230.00 49.00 10.00 10.40 53.00 124.00 69.13 0.200 398.60 ND 11.000
8. Eastern-Bye-P(LNG) 27.67 6.70 183.70 183.21 3.00 70.00 331.00 187.00 82.55 0.300 200.50 14.000 39.230
9. Harley Street(Old GRA) 29.03 7.23 195.20 55.00 1.00 142.00 300.00 192.00 96.32 0.200 85.10 34.000 23.003 10. Forces Avenue(Old
GRA) 29.64 7.34 181.40 59.70 BDL 8.00 68.00 137.00 38.31 0.400 49.31 0.100 8.190
11. Elekahia 28.28 7.30 33.50 21.00 2.00 6.00 18.00 123.00 87.15 0.500 240.11 6.500 12.110 12. Woji 27.19 5.90 49.30 12.60 3.00 7.00 48.00 127.00 75.80 0.800 150.00 3.200 15.300 13. Elijiji Woji 26.40 5.81 28.00 20.00 1.00 20.00 38.00 135.00 ND 0.200 50.00 0.310 58.040
14. Borokiri Sandfill 27.92 6.23 429.30 241.00 35.00 13.5 250.00 196.00 48.00 0.020 113.21 6.300 23.171 15. Rumuolumeni 27.51 5.90 350.60 122.70 3.00 2.50 115.00 193.00 72.96 0.820 210.32 0.600 30.000 16. Marine Base 26.83 7.11 560.00 401.00 7.00 11.00 103.50 123.00 22.03 0.000 63.70 13.000 7.110 17. Reclamation Rd 26.33 6.02 527.00 270.00 8.00 13.00 132.00 124.00 24.70 0.100 25.00 9.311 9.500 18. Aggrey Rd 27.04 5.83 150.00 255.00 4.00 121.32 401.00 130.00 230.11 0.020 15.60 0.500 15.210
19. Churchill (Harold Wilson Drive)
28.27 5.31 160.00 218.00 14.00 78.36 390.50 185.00 9.70 0.010 62.10 0.100 20.713
20. Rumuagholu 29.47 5.44 50.00 25.00 2.00 135.00 12.00 131.00 78.00 0.200 95.30 0.200 8.080 21. Elelenwo 28.03 5.93 35.00 25.00 3.00 132.10 35.00 192.00 65.10 0.100 26.40 0.500 10.345 22. Rumuibekwe 28.17 6.01 56.00 59.00 4.00 12.34 38.00 194.00 74.71 0.010 62.10 0.010 11.000
23. Mgbuoba (Okilton) 26.78 6.82 32.00 39.30 1.00 18.00 19.00 196.00 96.00 0.040 672.75 1.550 13.400 24. D/Line (Okija Street) 28.51 6.76 49.42 65.60 3.00 48.00 23.00 197.00 ND 0.030 60.24 1.580 10.361 25. GRA 111(Abacha Rd) 28.02 4.69 36.73 140.54 1.00 4.00 41.00 96.30 80.00 0.051 130.30 2.000 12.712 26. Mile4(Mkt Junction) 27.30 7.71 30.21 33.60 2.00 13.13 30.80 26.44 70.00 0.400 220.50 5.320 15.170 27. Orazi 28.03 6.50 74.01 36.00 1.00 12.00 50.51 27.78 78.00 0.210 120.12 0.400 12.121
28. Rumuigbo 27.22 4.75 33.00 33.00 3.00 10.00 32.00 55.77 191.32 0.090 50.00 0.330 13.100 29. Diobu (Nanka Street) 28.00 6.83 45.00 35.72 4.00 30.23 16.10 ND 126.00 0.303 10.33 0.624 29.100 30. UST (New VCs Lodge) 27.11 5.73 250.13 150.10 1.00 19.31 28.00 39.22 100.00 0.400 15.11 0.666 12.000 31. Onne 28.13 4.28 519.40 381.31 2.00 25.22 215.00 123.22 80.00 0.361 12.00 0.378 12.000 32. Odili Rd (GTC/Zoo) 27.10 7.00 210.28 211.00 1.00 14.12 28.13 50.00 120.30 0.111 10.00 0.507 12.300
WHO (2006) Standards
LOCATIONS NS 6.5-8.5
500 500 NS 500 250 NS 250 0.3 NS 50 NS
Greener Journal of Physical Sciences ISSN: 2276-7851 Vol. 3 (4), pp. 115-130, May 2013.
www.gjournals.org 119
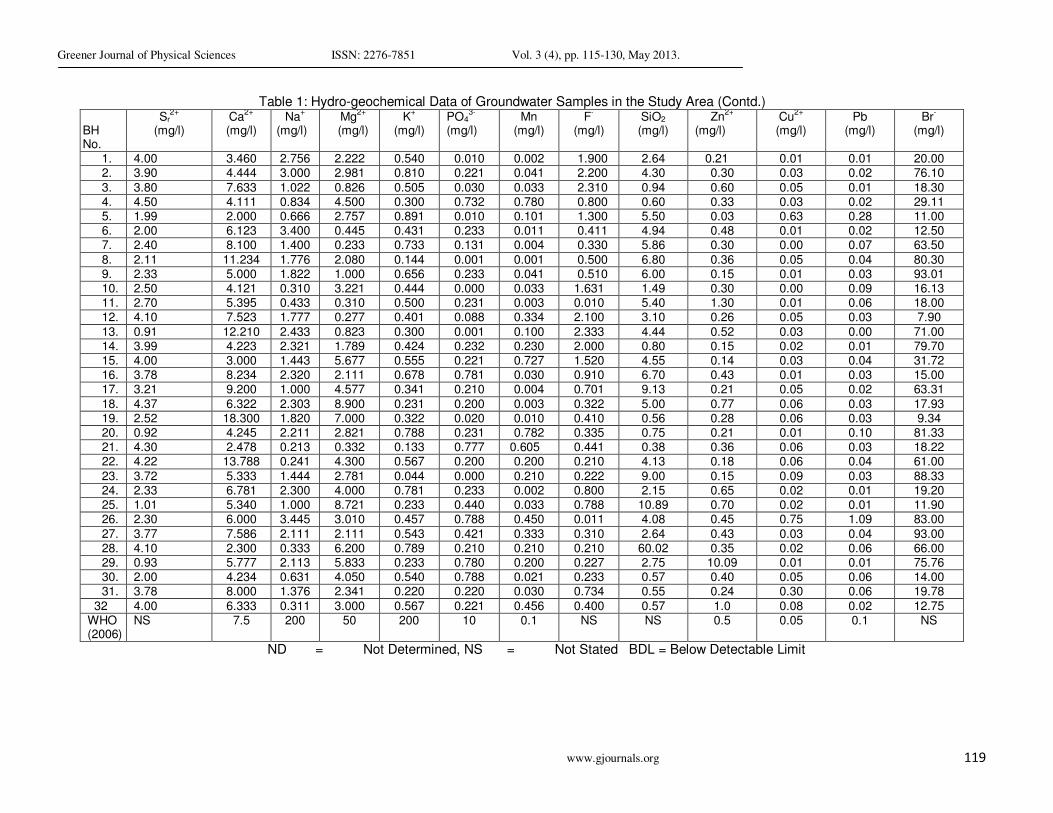
Table 1: Hydro-geochemical Data of Groundwater Samples in the Study Area (Contd.)
BH No.
Sr2+
(mg/l)
Ca2+
(mg/l)
Na+
(mg/l) Mg
2+
(mg/l) K
+
(mg/l) PO4
3-
(mg/l)
Mn (mg/l)
F-
(mg/l) SiO2
(mg/l) Zn
2+
(mg/l) Cu
2+
(mg/l) Pb
(mg/l) Br
-
(mg/l)
1. 4.00 3.460 2.756 2.222 0.540 0.010 0.002 1.900 2.64 0.21 0.01 0.01 20.00 2. 3.90 4.444 3.000 2.981 0.810 0.221 0.041 2.200 4.30 0.30 0.03 0.02 76.10
3. 3.80 7.633 1.022 0.826 0.505 0.030 0.033 2.310 0.94 0.60 0.05 0.01 18.30 4. 4.50 4.111 0.834 4.500 0.300 0.732 0.780 0.800 0.60 0.33 0.03 0.02 29.11 5. 1.99 2.000 0.666 2.757 0.891 0.010 0.101 1.300 5.50 0.03 0.63 0.28 11.00 6. 2.00 6.123 3.400 0.445 0.431 0.233 0.011 0.411 4.94 0.48 0.01 0.02 12.50 7. 2.40 8.100 1.400 0.233 0.733 0.131 0.004 0.330 5.86 0.30 0.00 0.07 63.50
8. 2.11 11.234 1.776 2.080 0.144 0.001 0.001 0.500 6.80 0.36 0.05 0.04 80.30 9. 2.33 5.000 1.822 1.000 0.656 0.233 0.041 0.510 6.00 0.15 0.01 0.03 93.01 10. 2.50 4.121 0.310 3.221 0.444 0.000 0.033 1.631 1.49 0.30 0.00 0.09 16.13 11. 2.70 5.395 0.433 0.310 0.500 0.231 0.003 0.010 5.40 1.30 0.01 0.06 18.00 12. 4.10 7.523 1.777 0.277 0.401 0.088 0.334 2.100 3.10 0.26 0.05 0.03 7.90
13. 0.91 12.210 2.433 0.823 0.300 0.001 0.100 2.333 4.44 0.52 0.03 0.00 71.00 14. 3.99 4.223 2.321 1.789 0.424 0.232 0.230 2.000 0.80 0.15 0.02 0.01 79.70 15. 4.00 3.000 1.443 5.677 0.555 0.221 0.727 1.520 4.55 0.14 0.03 0.04 31.72 16. 3.78 8.234 2.320 2.111 0.678 0.781 0.030 0.910 6.70 0.43 0.01 0.03 15.00 17. 3.21 9.200 1.000 4.577 0.341 0.210 0.004 0.701 9.13 0.21 0.05 0.02 63.31
18. 4.37 6.322 2.303 8.900 0.231 0.200 0.003 0.322 5.00 0.77 0.06 0.03 17.93 19. 2.52 18.300 1.820 7.000 0.322 0.020 0.010 0.410 0.56 0.28 0.06 0.03 9.34 20. 0.92 4.245 2.211 2.821 0.788 0.231 0.782 0.335 0.75 0.21 0.01 0.10 81.33 21. 4.30 2.478 0.213 0.332 0.133 0.777 0.605 0.441 0.38 0.36 0.06 0.03 18.22 22. 4.22 13.788 0.241 4.300 0.567 0.200 0.200 0.210 4.13 0.18 0.06 0.04 61.00
23. 3.72 5.333 1.444 2.781 0.044 0.000 0.210 0.222 9.00 0.15 0.09 0.03 88.33 24. 2.33 6.781 2.300 4.000 0.781 0.233 0.002 0.800 2.15 0.65 0.02 0.01 19.20 25. 1.01 5.340 1.000 8.721 0.233 0.440 0.033 0.788 10.89 0.70 0.02 0.01 11.90 26. 2.30 6.000 3.445 3.010 0.457 0.788 0.450 0.011 4.08 0.45 0.75 1.09 83.00
27. 3.77 7.586 2.111 2.111 0.543 0.421 0.333 0.310 2.64 0.43 0.03 0.04 93.00 28. 4.10 2.300 0.333 6.200 0.789 0.210 0.210 0.210 60.02 0.35 0.02 0.06 66.00 29. 0.93 5.777 2.113 5.833 0.233 0.780 0.200 0.227 2.75 10.09 0.01 0.01 75.76 30. 2.00 4.234 0.631 4.050 0.540 0.788 0.021 0.233 0.57 0.40 0.05 0.06 14.00 31. 3.78 8.000 1.376 2.341 0.220 0.220 0.030 0.734 0.55 0.24 0.30 0.06 19.78
32 4.00 6.333 0.311 3.000 0.567 0.221 0.456 0.400 0.57 1.0 0.08 0.02 12.75 WHO (2006)
NS 7.5 200 50 200 10 0.1 NS NS 0.5 0.05 0.1 NS
ND = Not Determined, NS = Not Stated BDL = Below Detectable Limit

Greener Journal of Physical Sciences ISSN: 2276-7851 Vol. 3 (4), pp. 115-130, May 2013.
www.gjournals.org 120
Ionic Abundance in Groundwater Generally, the chemical composition of groundwater is primarily dependent on the geology as well as the geochemical processes taking place within the groundwater system. Major and minor ions in groundwater from the study area were plotted on Piper (1944) diagram in order to identify hydro-chemical facies in the study area.
Analytical results show the abundance of ions in the following order: Mg > Ca > Na > K and Cl > SO4 > HCO3 > NO3. Chloride is the dominant anion found in the groundwater of the study area. Its concentration is generally higher than 12mg/l. Sulphate is equally found in considerable amount (9.70 – 230.11mg/l), with mean value of 68.76mg/l, followed by Bicarbonate (3.003 – 58.040mg/l), with mean value of 16.68mg/l. NO3 values ranges from 0.010 – 34.000mg/l, with mean value of 3.24mg/l. Magnesium dominate the cat-ions with a mean value of 3.16mg/l, followed by Calcium, with mean value of 3.02mg/l. Next to calcium is Sodium with mean value of 1.58mg/l, followed by Potassium with mean value of 0.47mg/l.
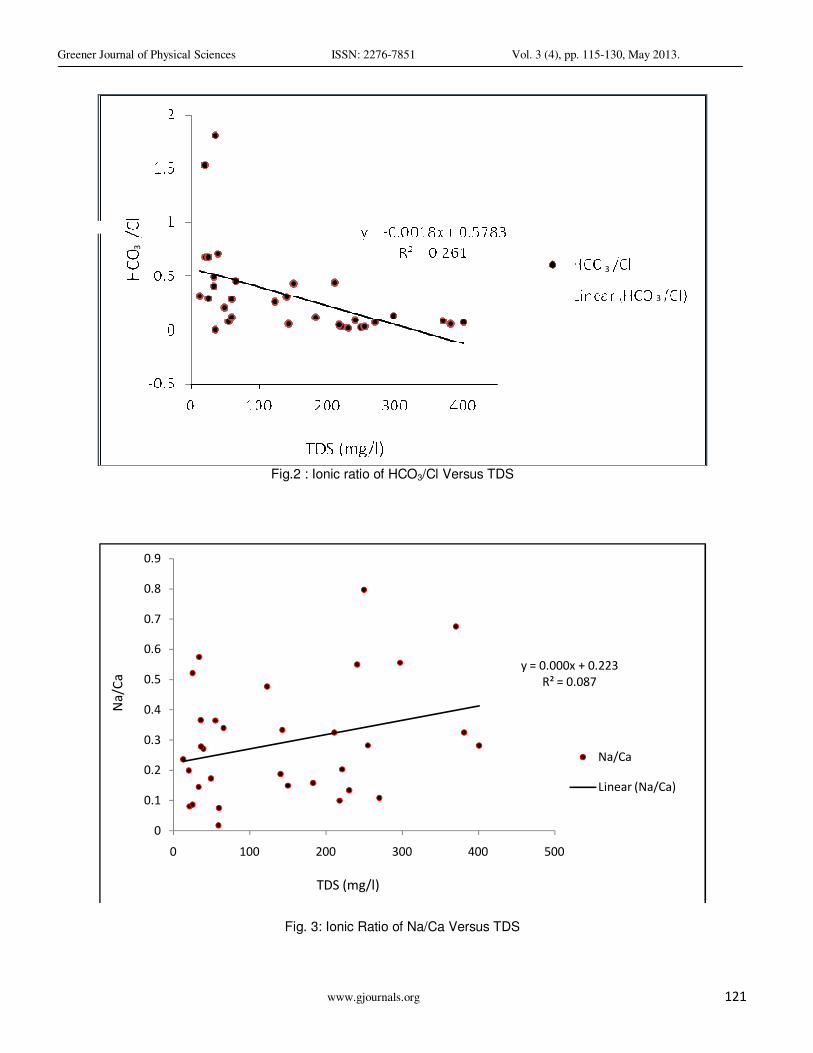
Major ions constitute the most significant part of the total dissolved solids present in the groundwater and the concentration of these ions in groundwater depends on geology and hydro-chemical processes that take place in the aquifer system (Lakshmanan, et al. 2003). Major ions in the groundwater present a definite spatial trend (Fig.3.1). The distributions of the ionic components and relationships of the groundwater in the study area are shown in Figs.3.7 and 3.3. Distribution of Ionic Ratios Ionic ratios of groundwater have been often used to evaluate seawater intrusion in coastal areas (Sachez-Martos et al., 2002; Kim et al., 2003; El Moujabber et al., 2006). Table 2 shows some selected ionic ratios and hydro-chemical processes of the groundwater in the area. Results revealed that the values of the ratios gradually increase and approach the seawater value as TDS increases, which indicated increase in influence of seawater intrusion (Figs. 2 – 7). As previously noted, TDS is a perfect surrogate for Cl. Consequently, the ratio (HCO3/Cl) can be a good indicator for salinization due to seawater encroachment. Ratios of Na/Ca, indicating cat-ion exchange reaction (Edet and Okereke, 2001), showed some mixed behavior but it mostly increased with increase of TDS (r
2 = 0.09). The ratios of
Na/Cl showed insignificant correlation with TDS level (r2 = 0.14) but they are very similar (not distinctive to each
other) to the seawater value. Thus, this ratio may not be a good indicator revealing the salinization process. Ratios of Ca/Cl exhibited generally, a moderate negative correlation with TDS (r
2 = 0.07). They decreased as
TDS increased, which was derived from Cl enrichment in groundwater due to saline water intrusion. Ratios of Mg/Cl are moderately varying (r
2 = 0.16) and showed a moderate negative correlation with TDS. They decreased as TDS
increased and thus low values may indicate influence of seawater intrusion. Ratio of K/Cl showed a weak correlation with TDS (r
2 = 0.17). For a given range of TDS, it is greatly varying.
Therefore, it may not be a good criterion for evaluating seawater intrusion. The Mg/Ca ratio showed a very weak correlation with TDS (r
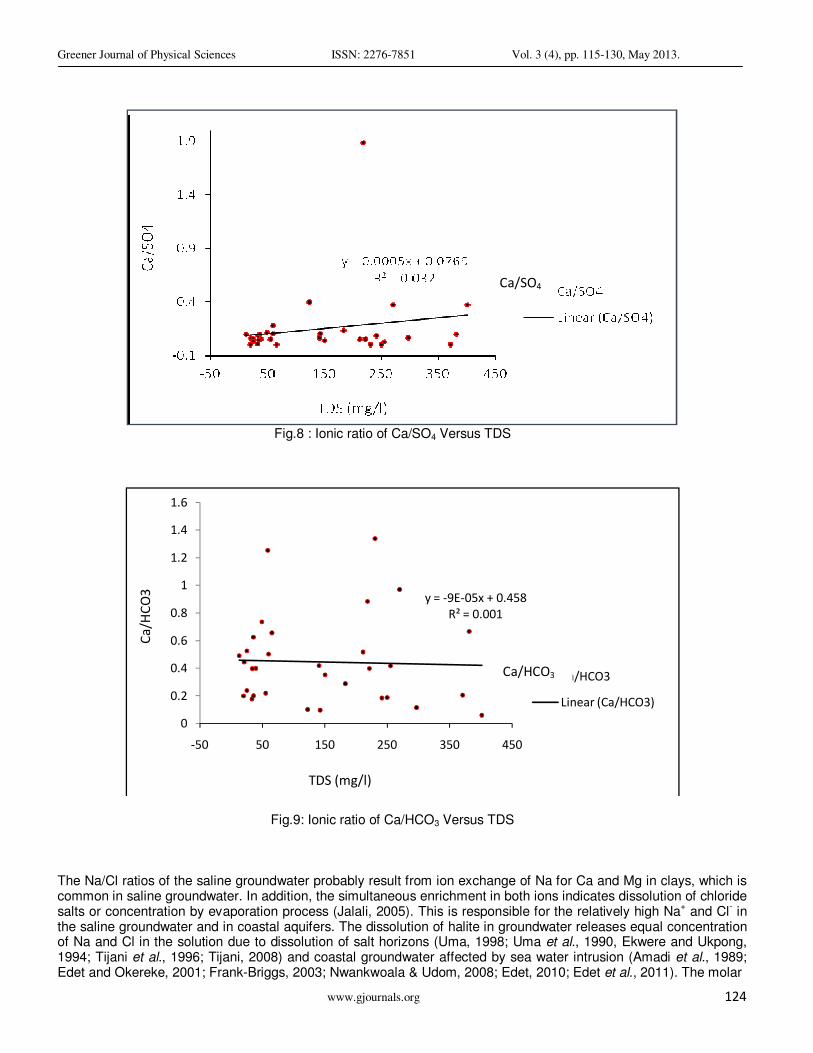
2 = 0.02), hence may not be a criterion for seawater intrusion evaluation. The Ca/SO4 ratio
showed some mixed behavior but it mostly increased with increase of TDS while ratios of Ca/HCO3 are not mostly correlated with TDS and are not generally varying in spite of increase of TDS. The ionic ratios are shown in Figs. 2 - 7.
Greener Journal of Physical Sciences ISSN: 2276-7851 Vol. 3 (4), pp. 115-130, May 2013.
www.gjournals.org 121
Fig.2 : Ionic ratio of HCO3/Cl Versus TDS
Fig. 3: Ionic Ratio of Na/Ca Versus TDS
y = 0.000x + 0.223
R² = 0.087
0
0.1
0.2
0.3
0.4
0.5
0.6
0.7
0.8
0.9
0 100 200 300 400 500
Na
/Ca
TDS (mg/l)
Na/Ca
Linear (Na/Ca)
3
3
3

Greener Journal of Physical Sciences ISSN: 2276-7851 Vol. 3 (4), pp. 115-130, May 2013.
www.gjournals.org 122
Fig.4 : Ionic ratio of Ca/Cl Versus TDS
Fig.5: Ionic ratio of Mg/Cl Versus TDS

Greener Journal of Physical Sciences ISSN: 2276-7851 Vol. 3 (4), pp. 115-130, May 2013.
www.gjournals.org 123
Fig.6 : Ionic ratio of K/Cl Versus TDS
Fig.7 : Ionic ratio of Mg/SO4/Cl Versus TDS
Greener Journal of Physical Sciences ISSN: 2276-7851 Vol. 3 (4), pp. 115-130, May 2013.
www.gjournals.org 124
Fig.8 : Ionic ratio of Ca/SO4 Versus TDS
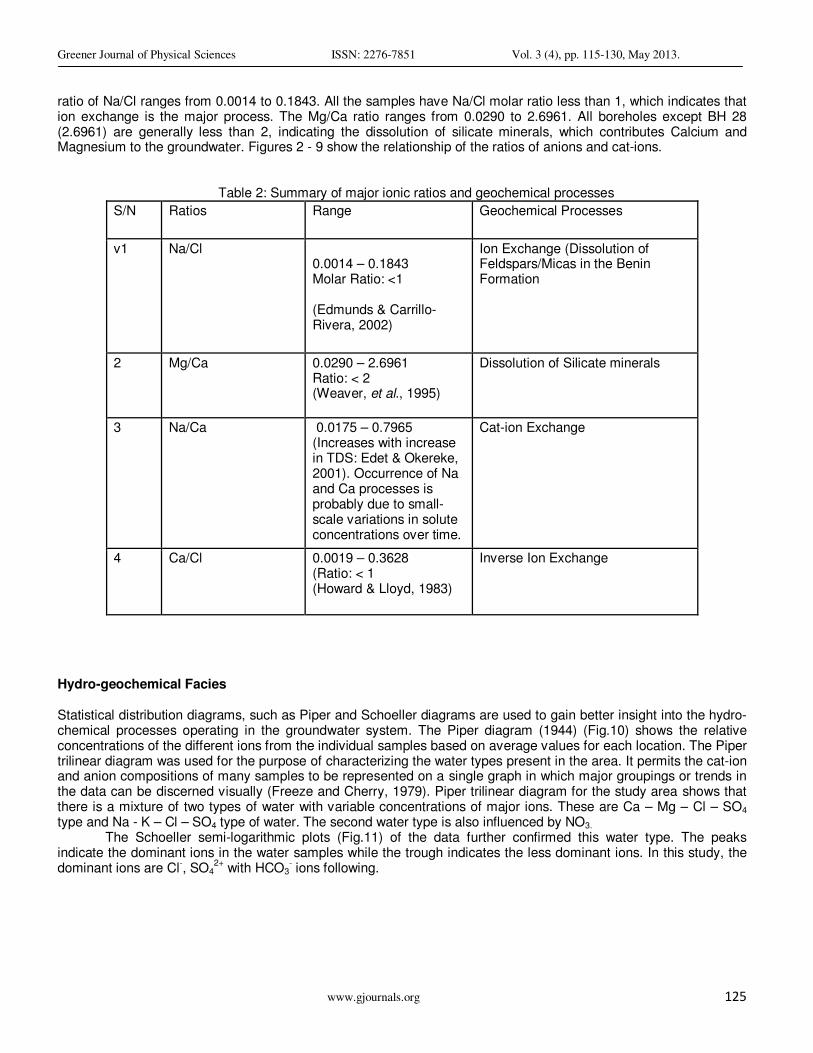
Fig.9: Ionic ratio of Ca/HCO3 Versus TDS The Na/Cl ratios of the saline groundwater probably result from ion exchange of Na for Ca and Mg in clays, which is common in saline groundwater. In addition, the simultaneous enrichment in both ions indicates dissolution of chloride salts or concentration by evaporation process (Jalali, 2005). This is responsible for the relatively high Na
+ and Cl
- in
the saline groundwater and in coastal aquifers. The dissolution of halite in groundwater releases equal concentration of Na and Cl in the solution due to dissolution of salt horizons (Uma, 1998; Uma et al., 1990, Ekwere and Ukpong, 1994; Tijani et al., 1996; Tijani, 2008) and coastal groundwater affected by sea water intrusion (Amadi et al., 1989; Edet and Okereke, 2001; Frank-Briggs, 2003; Nwankwoala & Udom, 2008; Edet, 2010; Edet et al., 2011). The molar
y = -9E-05x + 0.458
R² = 0.001
0
0.2
0.4
0.6
0.8
1
1.2
1.4
1.6
-50 50 150 250 350 450
Ca
/HC
O3
TDS (mg/l)
Ca/HCO3
Linear (Ca/HCO3)
Ca/SO4
Ca/HCO3
Greener Journal of Physical Sciences ISSN: 2276-7851 Vol. 3 (4), pp. 115-130, May 2013.
www.gjournals.org 125
ratio of Na/Cl ranges from 0.0014 to 0.1843. All the samples have Na/Cl molar ratio less than 1, which indicates that ion exchange is the major process. The Mg/Ca ratio ranges from 0.0290 to 2.6961. All boreholes except BH 28 (2.6961) are generally less than 2, indicating the dissolution of silicate minerals, which contributes Calcium and Magnesium to the groundwater. Figures 2 - 9 show the relationship of the ratios of anions and cat-ions.
Table 2: Summary of major ionic ratios and geochemical processes
S/N Ratios Range Geochemical Processes
v1 Na/Cl 0.0014 – 0.1843 Molar Ratio: <1 (Edmunds & Carrillo-Rivera, 2002)
Ion Exchange (Dissolution of Feldspars/Micas in the Benin Formation
2 Mg/Ca 0.0290 – 2.6961 Ratio: < 2 (Weaver, et al., 1995)
Dissolution of Silicate minerals
3 Na/Ca 0.0175 – 0.7965 (Increases with increase in TDS: Edet & Okereke, 2001). Occurrence of Na and Ca processes is probably due to small-scale variations in solute concentrations over time.
Cat-ion Exchange
4 Ca/Cl 0.0019 – 0.3628 (Ratio: < 1 (Howard & Lloyd, 1983)
Inverse Ion Exchange
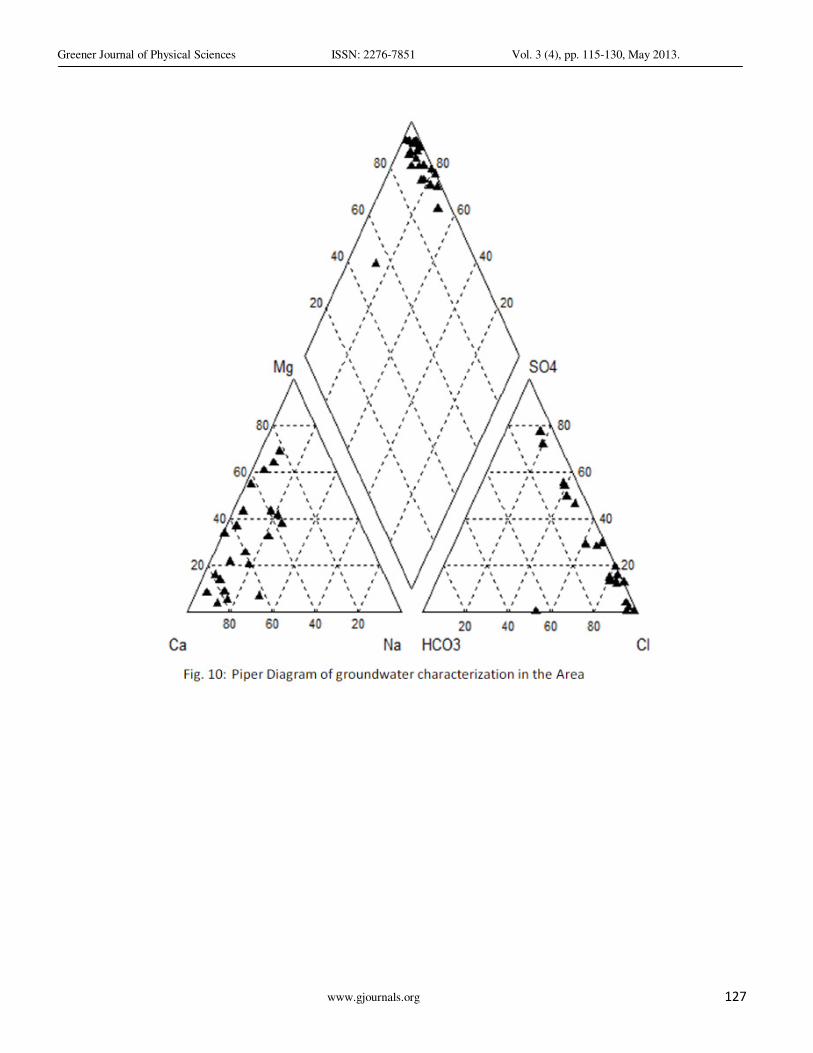
Hydro-geochemical Facies Statistical distribution diagrams, such as Piper and Schoeller diagrams are used to gain better insight into the hydro-chemical processes operating in the groundwater system. The Piper diagram (1944) (Fig.10) shows the relative concentrations of the different ions from the individual samples based on average values for each location. The Piper trilinear diagram was used for the purpose of characterizing the water types present in the area. It permits the cat-ion and anion compositions of many samples to be represented on a single graph in which major groupings or trends in the data can be discerned visually (Freeze and Cherry, 1979). Piper trilinear diagram for the study area shows that there is a mixture of two types of water with variable concentrations of major ions. These are Ca – Mg – Cl – SO4 type and Na - K – Cl – SO4 type of water. The second water type is also influenced by NO3.
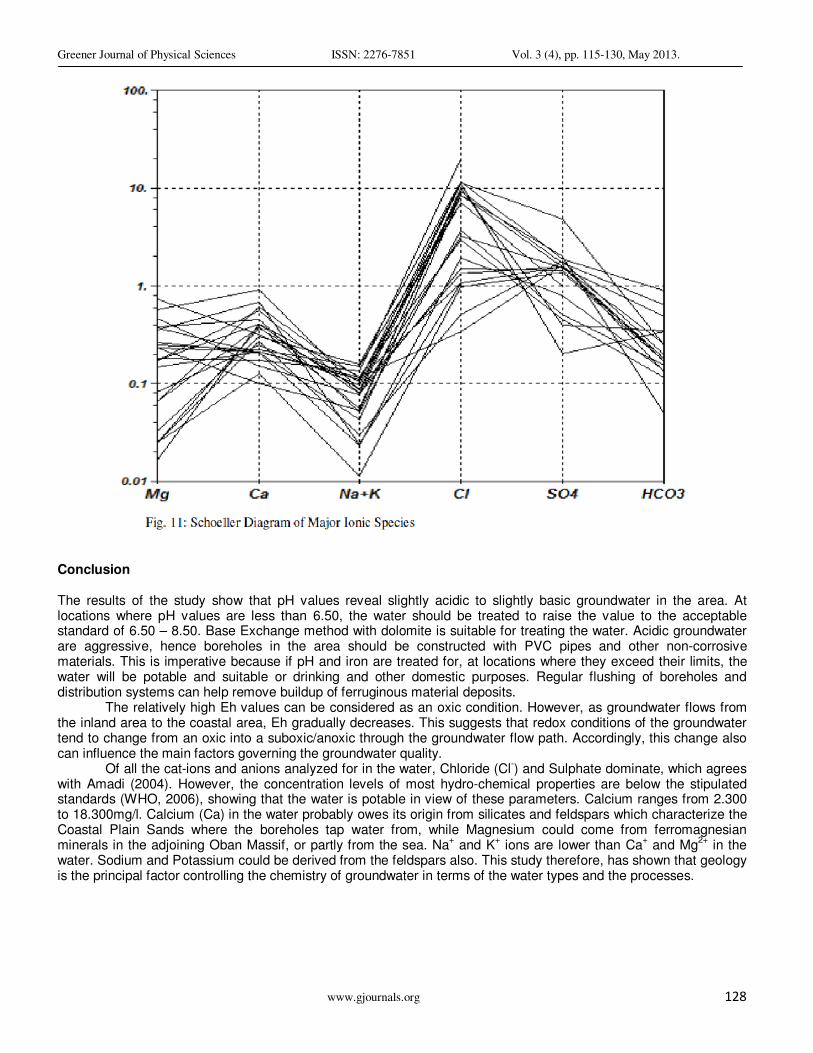
The Schoeller semi-logarithmic plots (Fig.11) of the data further confirmed this water type. The peaks indicate the dominant ions in the water samples while the trough indicates the less dominant ions. In this study, the dominant ions are Cl
-, SO4
2+ with HCO3
- ions following.

Greener Journal of Physical Sciences ISSN: 2276-7851 Vol. 3 (4), pp. 115-130, May 2013.
www.gjournals.org 126
Table 3: Hydro-geochemical Facies Analysis Data of Groundwater Samples
BOREHOLE S/NO
Ca 2+
%
Mg 2+
%
SO4 2-
% Cl -% Na
+% K
+% HCO3
-% CO3
-% SO4
2- +
Cl-
Ca 2+
+ Mg
2+ Na
+ + k
+ HCO3
-
+CO3-
BH1 1.66 2.20 ND 13.73 5.45 3.58 3.45 ND 13.73 3.86 9.03 3.45 BH2 2.13 2.94 ND 4.84 5.93 5.36 4.09 ND 4.84 5.07 11.29 4.09 BH3 3.66 0.82 ND 6.39 2.02 3.34 1.26 ND 6.39 4.48 5.36 1.26 BH4 1.97 4.45 3.41 5.81 1.65 1.99 1.93 ND 9.22 6.42 3.64 1.93 BH5 0.96 2.72 0.88 6.79 1.32 5.90 3.94 ND 7.67 3.68 7.22 3.94 BH6 2.93 0.44 4.09 7.93 6.72 2.85 10.12 ND 12.02 3.37 9.57 10.12 BH7 3.88 0.23 3.14 1.03 2.77 4.85 2.06 ND 4.17 4.11 7.62 2.06 BH8 5.38 2.05 3.75 6.41 3.51 0.95 7.35 ND 10.16 7.43 4.46 7.35 BH9 2.39 0.99 4.38 5.81 3.60 4.34 0.56 ND 10.19 3.38 7.94 0.56 BH10 1.97 3.18 1.74 1.32 0.61 2.94 1.53 ND 3.06 5.15 3.55 1.53 BH11 2.58 0.31 3.96 0.35 0.86 3.31 2.27 ND 4.31 2.89 4.17 2.27 BH12 3.60 0.27 3.45 0.93 3.51 2.66 2.87 ND 4.38 3.87 6.17 2.87 BH13 5.85 0.81 ND 0.74 4.81 1.99 10.88 ND 0.74 6.86 6.80 10.88 BH14 2.02 1.77 2.18 4.84 4.59 2.81 ND ND 7.02 3.79 9.08 ND BH15 1.44 5.61 3.32 2.23 2.85 3.68 5.62 ND 5.55 7.05 6.53 5.62 BH16 3.92 20.09 1.00 2.00 4.59 4.49 1.33 ND 3.00 6.01 9.08 1.33 BH17 4.41 4.56 1.12 2.55 1.98 2.26 1.78 ND 3.67 8.93 4.24 1.78 BH18 3.03 8.79 10.46 7.76 4.55 1.53 2.85 ND 18.22 11.82 6.08 2.85 BH19 8.76 6.92 0.44 7.56 3.60 2.13 3.88 ND 8.00 15.68 5.73 3.88 BH20 2.03 2.79 3.54 0.23 4.37 5.22 1.51 ND 3.77 4.82 9.59 1.51 BH21 1.19 0.33 2.96 0.68 0.42 0.88 1.94 ND 3.64 1.52 1.30 1.94 BH22 6.60 4.25 3.42 0.74 0.48 3.75 2.06 ND 4.14 10.85 4.23 2.06 BH23 2.55 2.75 4.36 0.37 2.86 0.29 2.51 ND 4.73 5.30 3.15 2.51 BH24 3.25 3.95 ND 0.45 4.55 5.17 1.94 ND 0.45 7.20 9.72 1.94 BH25 2.57 8.62 3.64 0.79 1.98 1.54 2.38 ND 4.43 11.19 3.52 2.38 BH26 2.87 2.97 3.18 0.60 6.81 3.03 2.84 ND 3.78 5.84 9.84 2.84 BH27 3.63 2.09 3.54 0.98 4.17 3.60 2.27 ND 4.52 5.72 7.77 2.27 BH28 1.10 6.12 8.69 0.62 0.66 5.22 2.45 ND 9.31 7.22 5.88 2.45 BH29 2.77 5.76 5.73 0.31 4.18 1.54 5.45 ND 6.04 8.53 5.72 5.45 BH30 2.03 4.00 4.54 0.54 1.25 3.58 2.25 ND 5.08 6.03 4.83 2.25 BH31 3.83 2.31 3.64 4.16 2.72 1.46 2.25 ND 7.80 6.14 4.18 2.25 BH32 3.03 2.96 5.47 0.54 0.62 3.75 2.30 ND 6.01 5.99 4.37 2.30
Note: BH=Borehole; ND=Not Determined
Greener Journal of Physical Sciences ISSN: 2276-7851 Vol. 3 (4), pp. 115-130, May 2013.
www.gjournals.org 127
Greener Journal of Physical Sciences ISSN: 2276-7851 Vol. 3 (4), pp. 115-130, May 2013.
www.gjournals.org 128
Conclusion The results of the study show that pH values reveal slightly acidic to slightly basic groundwater in the area. At locations where pH values are less than 6.50, the water should be treated to raise the value to the acceptable standard of 6.50 – 8.50. Base Exchange method with dolomite is suitable for treating the water. Acidic groundwater are aggressive, hence boreholes in the area should be constructed with PVC pipes and other non-corrosive materials. This is imperative because if pH and iron are treated for, at locations where they exceed their limits, the water will be potable and suitable or drinking and other domestic purposes. Regular flushing of boreholes and distribution systems can help remove buildup of ferruginous material deposits.
The relatively high Eh values can be considered as an oxic condition. However, as groundwater flows from the inland area to the coastal area, Eh gradually decreases. This suggests that redox conditions of the groundwater tend to change from an oxic into a suboxic/anoxic through the groundwater flow path. Accordingly, this change also can influence the main factors governing the groundwater quality.
Of all the cat-ions and anions analyzed for in the water, Chloride (Cl-) and Sulphate dominate, which agrees
with Amadi (2004). However, the concentration levels of most hydro-chemical properties are below the stipulated standards (WHO, 2006), showing that the water is potable in view of these parameters. Calcium ranges from 2.300 to 18.300mg/l. Calcium (Ca) in the water probably owes its origin from silicates and feldspars which characterize the Coastal Plain Sands where the boreholes tap water from, while Magnesium could come from ferromagnesian minerals in the adjoining Oban Massif, or partly from the sea. Na
+ and K
+ ions are lower than Ca
+ and Mg
2+ in the
water. Sodium and Potassium could be derived from the feldspars also. This study therefore, has shown that geology is the principal factor controlling the chemistry of groundwater in terms of the water types and the processes.

Greener Journal of Physical Sciences ISSN: 2276-7851 Vol. 3 (4), pp. 115-130, May 2013.
www.gjournals.org 129
References Amadi P.A. (2004). Groundwater Resources of Port Harcourt and its Environs. Unpublished PhD Thesis, Nnamdi
Azikiwe University, Awka, Nigeria. 394p. Amadi, A.N; Olasehinde, PI and Yisa, J (2010). Characterization of Groundwater Chemistry in the Coastal Plain-sand
Aquifers of Owerri using Factor Analysis. Int. J. Phy. Sci., 5(8):1306 – 1314 Amadi, P.A; Morrison, T; Ofoegbu, C.O (1989). Hydrogeochemical assessment of groundwater quality in parts of the
Niger Delta, Nigeria. Environmental Geology, 14 (3), 195-202. Edet, A.E (2010). The Development of a Groundwater Quality Index for the Niger Delta Region, Nigeria.In
Proceedings of XXXVII IAH Congress on Groundwater Quality Sustainability,12–17 September,2010,AGH University of Science and Technology, Krakow, Poland.
Edet, A.E and Ekpo, B.O (2008).Hydro-geochemistry of a Fractured Aquifer in the Ogoja/Obudu Area of SE Nigeria. In:Applied Groundwater Studies in Africa (eds. Adelana S, MacDonald A)IAH Selected Papers on Hydrogeology, 13:391 – 403
Edet, A.E and Okereke,C.S (2001).A Regional Study of Saltwater Intrusion in Southeastern Nigeria based on the analysis of Geo-electrical and Hydro-chemical data. Environmental Geology, 40:1278 – 1289.
Edet, A.E;Worden,R.H;Mohammed, E.A and Preston,M.R (2011).Hydrogeochemical processes in a populated shallow coastal Plain Sand Aquifer,Southeastern Nigeria.Environmental Earth Sciences, DOI 10, 007/s12665-011-1175-9. 21p
Edmunds,W.M and Carrillo-Rivera,C (2002).Geochemical Evolution of Groundwater beneath Mexico City.J.Hydrol. 258:1-24
Ekwere,S.J and Ukpong, E.E (1994).Geochemistry of Saline Water in Ogoja, Cross River State of Nigeria. J.Min. Geol., 30 (1): 11 - 15
El Moujabber, M., Bou Samra, B.,Darwish,T & Atallah,T (2006)Comparison of different indicators for groundwater contamination by seawater intrusion on the Lebanese Coast. Water Resources Management, Vol.20:161-180
Frank- Briggs, I.N (2003). Hydrogeology of Some Island Towns in the Eastern Niger Delta, Nigeria. Unpublished Ph.D Thesis, University of Port Harcourt, Nigeria. 283p
Freeze,R.A and Cherry,J.A (1979).Groundwater.2nd
Edition.Prentice Hall,Englewood, Cliff, New Jersey, USA, 604p Howard,K.W.F and Lloyd, J.W (1983).Major Ion Characterization of Coastal Saline Ground-waters. Groundwater 21
(4):429-437 Jalali, M (2005).Major ion chemistry of Ground-waters in the Bahar area, Hamadan, Western Iran. Environmental
Geol. 47:763 – 772 Kim, J.H.,Kim, R.H & Chang,H.W (2003a).Hydro-geochemical Characterization of Major Factors affecting the Quality
of Shallow Groundwater in the Coastal Area at Kimje in South Korea. Environmental Geology, 44: 478-489 Lakshmanan,E;Kannan,R and Kumar,M.S (2003).Major Ion Chemistry and Identification of Hydro-chemical
Processes of Groundwater in a Part of Kancheepuram district,Tamil Nadu, India. Environmental Geosciences, Vol.10, No.4, pp157 – 166.
Nganje,T.N;Adamu,C.I;Ugbaja,A.N and Amah,A.E (2010).Evaluation of hydrogeochemical characteristics of groundwater in parts of Lower Benue Trough,Nigeria. Chin.J.Geochem.29:398 – 406
Nwankwoala, H.O and Udom, G.J (2011a). Patterns of Groundwater Chemistry and Ionic Ratios in the Aquifer Systems of Port Harcourt, Nigeria: Implications for Saline Water Intrusion. Journal of Science and Technology Research 10 (1): 55- 62
Nwankwoala, H.O and Udom, G.J (2011b). Investigation of Hydro-geochemical Characteristics of Groundwater in Port Harcourt City, Nigeria: Implications for Use and Vulnerability. Journal of Applied Science and Environmental Management 15(3):479-488.
Nwankwoala,H.O and Udom,G.J (2008).Influence of Land Reclamation on the Status of Groundwater in Borokiri Area of Port Harcourt,Nigeria. International Journal of Natural and Applied Sciences 4(4):431- 434.
Olobaniyi, S.B and Owoyemi,F.B (2006).Characterization by Factor Analysis of the Chemical Facies of Groundwater in the Deltaic Plain Sands Aquifers of Warri, Western Niger Delta, Nigeria. African Journal of Science and Technology (AJST), Science and Engineering Series, 7(1):73 – 81.
Piper,A.M (1944).A Graphical Procedure in the Geochemical Interpretation of Water Analyses. American Geophysical Union Transactions, Vol.25:914-923
Sanchez-Martos,F.Pulido-Bosch,A.Molina-Sanchez,L & Vallejos-Izquierdo,A (2002).Identification of the Origin of Salinization in Groundwater using Minor Ions (Lower Andarax, Southeast Spain).Science of the Total Environment, Vol.297:43-58
Tijani,M.N (2008).Hydro-chemical and Stable Isotopes Compositions of Saline Ground-waters in the Benue Basin, Nigeria. In Applied groundwater studies in Africa (Eds Adelana S, MacDonald A) IAH Selected papers on Hydrogeol., 13:352 – 369
Greener Journal of Physical Sciences ISSN: 2276-7851 Vol. 3 (4), pp. 115-130, May 2013.
www.gjournals.org 130
Tijani, M.N; Loehnert, E.P; Uma, K.O (1996). Origin of Saline Ground-waters in the Ogoja area, Lower Benue Basin,
Nigeria. Journal of African Earth Sciences, 23 (2):237 – 252 Uma, K.O (1998). The Brown Fields of the Benue Basin, Nigeria: A comparative Study of Geomorphic, Tectonic and
Hydro-Chemical properties. Journal of African Earth Sciences, 28(2):261 – 275 Uma, K.O; Onuoha, K.M and Egboka, C.E (1990). Hydrochemical Facies, Groundwater Flow Pattern and Origin of
Saline Waters in Parts of the Western Flank of the Cross River Basin, Nigeria. In the Evolution of the Benue Basin (Eds C.O Ofoegbu), pp 115 - 134
Weaver, T.R; Frape, S.K and Cherry, J.A (1995). Recent Cross-Formational Fluid Flow and Mixing in the Shallow Michigan Basin. Geol Soc Am Bull 107:697-707
World Health Organization (1996).Guidelines for Drinking Water.Vol.2.Recommendations.World Health Organization, Geneva.
World Health Organization (2006).Guidelines for Drinking Water Quality: Incorporating 1st and 2
nd Addlenda, Vol.1
Recommendations 3rd
ed. Geneva.