ion clustering in aqueous solutions probed with
TRANSCRIPT

Ion clustering in aqueous solutions probedwith vibrational energy transferHongtao Biana, Xiewen Wena, Jiebo Lia, Hailong Chena, Suzee Hana, Xiuquan Sunb, Jian Songb,Wei Zhuangb, and Junrong Zhenga,1
a Department of Chemistry, Rice University, Houston, TX 77005; and bState Key Laboratory of Molecular Reaction Dynamics,Dalian Institute of Chemical Physics, Chinese Academy of Sciences, Dalian 116023, People’s Republic of China
Edited* by Robert F. Curl, Rice University, Houston, TX, and approved February 4, 2011 (received for review January 3, 2011)
Despite prolonged scientific efforts to unravel the hydration struc-tures of ions in water, many open questions remain, in particularconcerning the existences and structures of ion clusters in 1∶1strong electrolyte aqueous solutions. A combined ultrafast 2D IRand pump/probe study through vibrational energy transfersdirectly observes ion clustering in aqueous solutions of LiSCN,NaSCN, KSCN and CsSCN. In a near saturated KSCN aqueous solu-tion (water/KSCNmolar ratio ¼ 2.4∕1), 95% of the anions form ionclusters. Diluting the solution results in fewer, smaller, and tighterclusters. Cations have significant effects on cluster formation. Asmall cation results in smaller and fewer clusters. The vibrationalenergy transfer method holds promise for studying a wide varietyof other fast short-range molecular interactions.
The solution properties of ions in water are relevant to a widerange of systems, including electrochemistry, biological envir-
onments, and atmospheric aerosols (1, 2). For more than 100 yr,tremendous scientific efforts have been devoted to unravel thehydration structures of ions in water (1–11). However, manyfundamental questions remain open, in particular concerningthe existence, concentration, and structure of ion clusters in 1∶1strong electrolyte aqueous solutions. Whether strong 1∶1 electro-lytes (especially salts of Naþ and Kþ) form ion pairs or clusters inwater has been considered a key issue for understanding manyimportant problems, e.g., the excess ionic activity in 1∶1 electro-lytes (12), ion dependent conformational and binding equilibriaof nucleic acids (13), the concentration difference between Naþand Kþ in living cells, protein denaturation by salts (14, 15), andion concentration dependent properties of ion channels (16).
The properties of aqueous solutions of 1∶1 strong electrolytesdeviate from the ideal dilute solution at extremely low concentra-tions (<10−5 M). The deviations were generally believed to becaused by the attraction between ions of opposite charge andthe repulsion of ions of the same charge, leading to the develop-ment of the Debye-Hückel theory (17, 18). However, this theorybegins to fail at a very low concentration (∼10−3 M), as the as-sumptions upon which the theory was based become invalid. Theformation of ion pairs containing two ions of opposite charge hasbeen proposed to be primarily responsible for this failure (1, 2).Recently, calculations from molecular dynamics (MD) simula-tions, suggested that, clusters with more than one ion of the samecharge which are traditionally viewed as unlikely, could be a ma-jor factor contributing to the nonideality of solutions at mediumor high concentrations (12, 19). However, these predicted ionclusters cannot be investigated by the usual tools for probingmolecular structures and particle sizes in liquids, e.g., X-ray orneutron diffraction (20), or the dynamic light scattering (19, 21),because the contribution of ion-ion correlations to the total scat-tering pattern is too small compared to the contributions fromwater-water and water-ion interactions (19). In addition, the clus-ters are expected to be small, containing only a few ions whichexchange rapidly with ions in the water phase (12).
In this work, by monitoring intermolecular mode-specific reso-nant and nonresonant vibrational energy transfers (22–25) usingultrafast 2D IR and pump/probe techniques, we were able to di-
rectly probe ion clustering in a series of 1∶1 strong electrolyte(LiSCN, NaSCN, KSCN and CsSCN) aqueous solutions. Weobtained through these experiments clear evidence that a signif-icant portion of the ions form clusters in unsaturated solutions. Inhighly concentrated solutions, almost all anions (>90%) form ionclusters, suggesting water/ion microphase separations. In otherwords, in an apparent “homogeneous” SCN− aqueous solution,both clustered and water-solvated anions simultaneously exist, asillustrated in Fig.. 1A. Even at a medium concentration (1M) witha salt/water molar ratio only 1∶50, ∼27% of anions are clusteredunder the ambient condition. As expected, diluting the solutionshifts the dissolution equilibrium to fewer and smaller clusters,but, surprisingly, dilution makes the clusters tighter. The ionclustering is cation-size-dependent with smaller cations tendingto form smaller and fewer clusters.
Results and DiscussionAnions in a Cluster Can Exchange Vibrational Energy.We first describethe vibrational energy transfer method for studying ion clusteringin a concentrated KSCN solution, and then present the concen-tration and cation dependent results. Fig. 1B is the FTIR spec-trum of the CN and 13C15N− stretches of SCN− and S13C15N− in a1∶1 KSCN∕KS13C15N mixed aqueous (D2O) solution with asalt/water molar ratio 1∕2.4 (10M, which we name as solutionC). The isotope labeling shifts the CN stretch frequency from2;064 cm−1 (SCN−) down to 1;991 cm−1 (S13C15N−). Theoreticalpredictions for other concentrated or melt electrolyte solutions(26, 27), suggest that the probability of forming contact clustersof the general formula KnðSCNÞmðS13C15NÞp is statistically veryhigh in solution C. In these clusters, the anions SCN− andS13C15N− can be considered as “ligands” to the cation Kþ. Theanions thus held in close proximity can exchange vibrational en-ergy through their overlapped orbitals or via dipole-dipole inter-actions, in a manner similar to that observed for metal carbonylcompounds (28). Vibrational energy exchange between SCN− andS13C15N− in the clusters can be monitored with fast 2D IR meth-ods (Fig.. 1C, here the solution is C, i.e., 10M). From these 2D IRmeasurements, not only the vibrational energy exchange rates,but also the cluster concentration and the exchange dynamics be-tween clustered and separated anions can be obtained.
The intermolecular mode-specific vibrational energy transfer2D IR technique has been previously described in detail (22,23). Very briefly, energy exchange 2D IR measurements allowthe energy exchange between the CN and 13C15N stretches ofSCN− and S13C15N− to be followed in real time through the
Author contributions: J.Z. designed research; H.B., X.W., J.L., S.H., and J.Z. performedresearch; X.S., J.S., W.Z. did MD simulations; H.B., X.W., J.L., H.C., and J.Z. contributednew reagents/analytic tools; H.B., X.W., H.C., and J.Z. analyzed data; and J.Z. wrotethe paper.
The authors declare no conflict of interest.
*This Direct Submission article had a prearranged editor.1To whom correspondence should be addressed. E-mail: [email protected].
This article contains supporting information online at www.pnas.org/lookup/suppl/doi:10.1073/pnas.1019565108/-/DCSupplemental.
www.pnas.org/cgi/doi/10.1073/pnas.1019565108 PNAS ∣ March 22, 2011 ∣ vol. 108 ∣ no. 12 ∣ 4737–4742
CHEM
ISTR
Y

growth of the two cross peak pairs (Peaks 5 ∼ 8) as marked in the50-ps row of Fig.. 1C (for the 10M solution named C). The anionswhich have not exchanged their energy (including anions whichhave exchanged but received energy from reverse transfers andthe resonance acceptors of the same isotope) produce the twodiagonal peak pairs (Peaks 1 ∼ 4). Now we consider all six wait-ing-time (Tw) dependent 2D IR spectra of solution C at roomtemperature. The 200-fs row corresponds to a very short Tw,at which negligible vibrational energy exchange has occurred.During the Tw period, the initial and final energy carriers inthe sample are unchanged. Therefore, the ωpump (the excitationalfrequency) and ωprobe (the detected frequency) values of each redpeak (the 0–1 CN or 13C15N stretch transition) are identical, andthe peaks appear only on the diagonal. The two blue peaks 2 and4 are the 1-2 transitions, which shift to lower frequencies alongthe ωprobe axis because of vibrational anharmonicity. Peaks 1 and2 represent SCN− and Peaks 3 and 4 are for S13C15N−. With theincrease of probe delay time (Tw ¼ 200 fs ∼ 20 ps), vibrationalenergy begins to flow between the two anions. Cross peak pairsbegin to grow. After a long reaction period (Tw ¼ 50 ps), vibra-tional energy has exchanged to a substantial degree as shownby the additional peaks (Peaks 5 ∼ 8) that have appeared onthe off-diagonal. These new peaks arise from the vibrationalenergy exchange. The vibrational energy transfer from SCN−
to S13C15N− produces peaks 5 and 6 at positions with ωpump ¼2;064 cm−1 and ωprobe ¼ 1;991 cm−1 and 1;966 cm−1. ωpump ¼2;064 cm−1 is the 0–1 transition frequency of the CN stretch, re-presenting the vibrational energy is originally from SCN−.ωprobe ¼ 1;991 cm−1 and 1;966 cm−1 are the 0–1 and 1–2 transi-tion frequencies of the 13C15N− stretch, respectively, representingthat at the end of Tw the vibrational energy has transferred toS13C15N−. Likewise, peaks 7 and 8 are produced by energy trans-fer from S13C15N− to SCN−.
In contrast to the chemical exchange 2D IR methods (29–33),the cross peak intensities in the energy exchange method arenot equal. The ratio of the cross peaks’ growth rates is deter-mined by the Boltzmann distribution. The energy mismatch be-tween the CN and 13C15N stretches is 2;064-1;991 ¼ 73 cm−1,making the energy up-pumping rate constant from S13C15N−
to SCN− ∼70% of the down-flowing rate constant from SCN−
to S13C15N−. As in Fig.. 1C, Peaks 5 and 6 are always bigger thanPeaks 7 and 8 at the same Tws. In solution C, some anions areclustered and can transfer energy efficiently. Some anions arewell separated from each other and less able to exchange energywith other anions. These two types of anions are not frequencyresolvable. Both produce diagonal peak pairs in 2D IR spectra inFig.. 1C. Because the clustered anions can exchange energy muchmore efficiently, the cross peak pairs are mostly from the clus-tered anions. Therefore, simultaneous analysis of diagonal andcross peaks provides not only the rate constants for energy ex-change, but also the ratio of clustered to separated anions andthe rate constants for the exchange of anions from separatedto clustered.
In solution C, based on the liquid density, the nominal averageanion distance is calculated to be 5.5 Angstrom (Å). Can the en-ergy exchange observed in Fig. 1C be simply because of the shortaverage distance rather than ion clustering? The speculationcan be directly tested by diluting the solution. Previous experi-ments suggest that the intermolecular vibrational energy transfercan be described by the dipole-dipole interaction (25, 34–36):
k ∝�1
r
�6
; [1]
where k is the energy transfer rate constant and r is the donor/acceptor distance. According to [1], diluting solution C with awater/salt ratio from 2.4∕1 to 25∕1 will increase the average aniondistance for ∼1.9 times and therefore slow down the energy trans-
1950 2000 2050 21000.0
0.2
0.4
0.6
0.8
1.0
SCN-S13C15N-
Abs
orba
nce
(Nor
mal
ized
)
Frequency (cm-1)
BA
C
1940 1980 2020 2060 2100
0.2ps 2ps 10ps
20ps 50ps 100ps
1940 1980 2020 2060 2100 1940 1980 2020 2060 2100
1
4
3
2
6
7
5
8
prob
e(c
m-1
)
pump (cm-1)
1960
2000
2040
2080
1940 1980 2020 2060 2100 1940 1980 2020 2060 2100 1940 1980 2020 2060 2100
prob
e(c
m-1
)
pump (cm-1)
1960
2000
2040
2080
1940 1980 2020 2060 2100
0.2ps 2ps 10ps
20ps 50ps 100ps
1940 1980 2020 2060 2100 1940 1980 2020 2060 2100
1
4
3
2
6
7
5
8
prob
e(c
m-1
)
pump (cm-1)
1960
2000
2040
2080
1940 1980 2020 2060 2100 1940 1980 2020 2060 2100 1940 1980 2020 2060 2100
prob
e(c
m-1
)
pump (cm-1)
1960
2000
2040
2080
Fig. 1. (A) A snapshot of a 1.8M KSCN aqueoussolution from a molecular dynamics simulation (De-tails are in SI Appendix). O (red), H (white), C (lightblue), N (deep blue), K (green), and S (yellow). Anion cluster is visible at the center of the picture.Some water molecules are removed from the origi-nal file to better display the cluster structure. (B) FT-IR absorption spectra of the CN and 13C15N stretchesof SCN− and S13C15N− of a 10M 1∶1 KSCN∕KS13C15Naqueous solution (solution C). (C) The time depen-dence of the 2D IR spectrum of solution C. As Tw
increases, the off-diagonal peaks grow in becauseof energy exchange between SCN− and S13C15N−.The vibrational coupling and the heat effect (22,23) (pump/probe data are in SI Appendix: Fig. S1)are too weak to show up in the spectra of the timerange.
4738 ∣ www.pnas.org/cgi/doi/10.1073/pnas.1019565108 Bian et al.
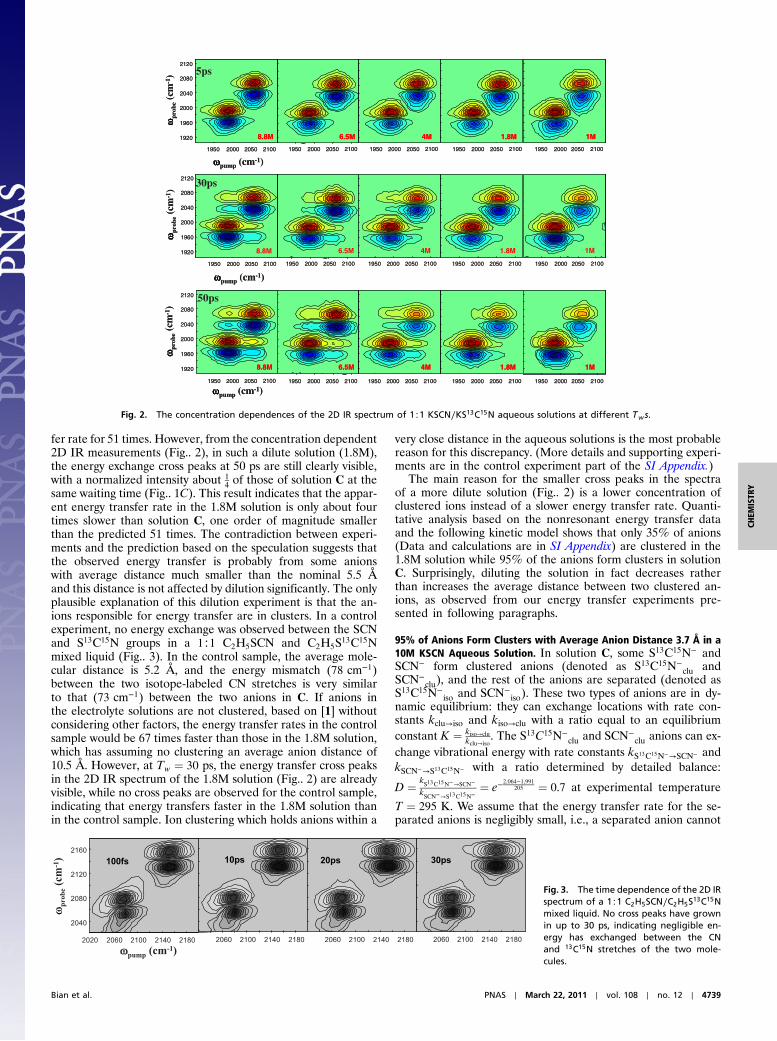
fer rate for 51 times. However, from the concentration dependent2D IR measurements (Fig.. 2), in such a dilute solution (1.8M),the energy exchange cross peaks at 50 ps are still clearly visible,with a normalized intensity about 1
4of those of solution C at the
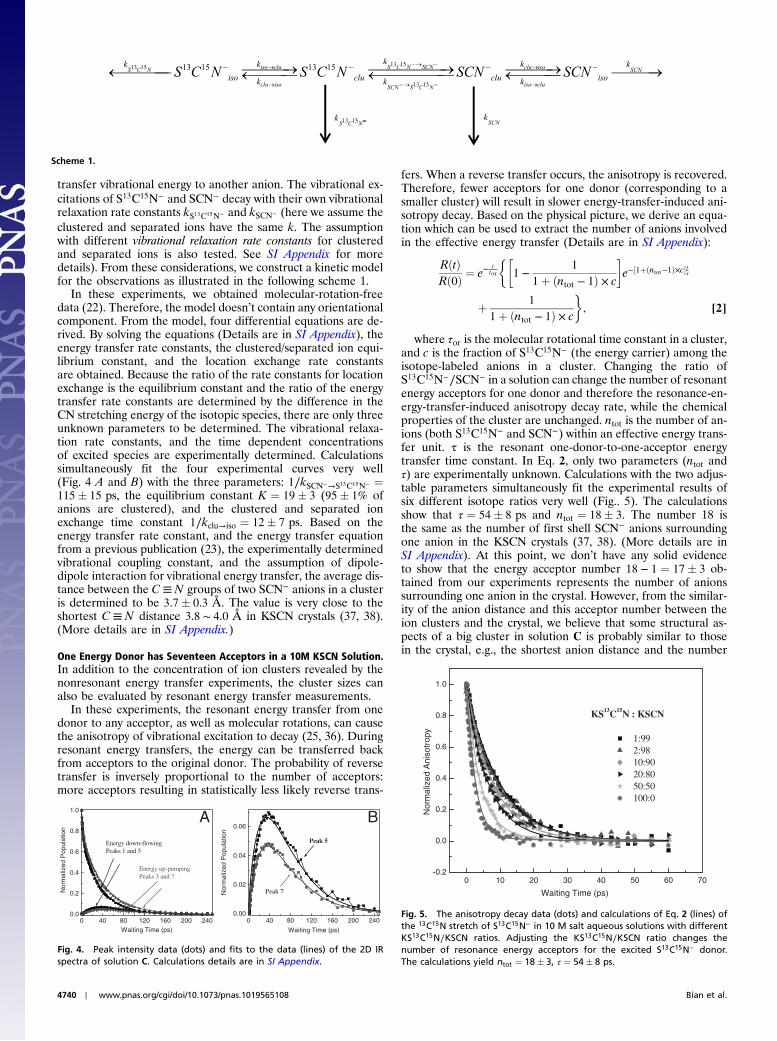
same waiting time (Fig.. 1C). This result indicates that the appar-ent energy transfer rate in the 1.8M solution is only about fourtimes slower than solution C, one order of magnitude smallerthan the predicted 51 times. The contradiction between experi-ments and the prediction based on the speculation suggests thatthe observed energy transfer is probably from some anionswith average distance much smaller than the nominal 5.5 Åand this distance is not affected by dilution significantly. The onlyplausible explanation of this dilution experiment is that the an-ions responsible for energy transfer are in clusters. In a controlexperiment, no energy exchange was observed between the SCNand S13C15N groups in a 1∶1 C2H5SCN and C2H5S13C15Nmixed liquid (Fig.. 3). In the control sample, the average mole-cular distance is 5.2 Å, and the energy mismatch (78 cm−1)between the two isotope-labeled CN stretches is very similarto that (73 cm−1) between the two anions in C. If anions inthe electrolyte solutions are not clustered, based on [1] withoutconsidering other factors, the energy transfer rates in the controlsample would be 67 times faster than those in the 1.8M solution,which has assuming no clustering an average anion distance of10.5 Å. However, at Tw ¼ 30 ps, the energy transfer cross peaksin the 2D IR spectrum of the 1.8M solution (Fig.. 2) are alreadyvisible, while no cross peaks are observed for the control sample,indicating that energy transfers faster in the 1.8M solution thanin the control sample. Ion clustering which holds anions within a
very close distance in the aqueous solutions is the most probablereason for this discrepancy. (More details and supporting experi-ments are in the control experiment part of the SI Appendix.)
The main reason for the smaller cross peaks in the spectraof a more dilute solution (Fig.. 2) is a lower concentration ofclustered ions instead of a slower energy transfer rate. Quanti-tative analysis based on the nonresonant energy transfer dataand the following kinetic model shows that only 35% of anions(Data and calculations are in SI Appendix) are clustered in the1.8M solution while 95% of the anions form clusters in solutionC. Surprisingly, diluting the solution in fact decreases ratherthan increases the average distance between two clustered an-ions, as observed from our energy transfer experiments pre-sented in following paragraphs.
95% of Anions Form Clusters with Average Anion Distance 3.7 Å in a10M KSCN Aqueous Solution. In solution C, some S13C15N− andSCN− form clustered anions (denoted as S13C15N−
clu andSCN−
clu), and the rest of the anions are separated (denoted asS13C15N−
iso and SCN−iso). These two types of anions are in dy-
namic equilibrium: they can exchange locations with rate con-stants kclu→iso and kiso→clu with a ratio equal to an equilibriumconstant K ¼ kiso→clu
kclu→iso. The S13C15N−
clu and SCN−clu anions can ex-
change vibrational energy with rate constants kS13C15N−→SCN− andkSCN−→S13C15N− with a ratio determined by detailed balance:
D ¼ kS13C15N−→SCN−
kSCN−→S13C15N−¼ e−
2;064−1;991205 ¼ 0.7 at experimental temperature
T ¼ 295 K. We assume that the energy transfer rate for the se-parated anions is negligibly small, i.e., a separated anion cannot
pump (cm-1)1950 2000 2050 2100 1950 2000 2050 2100 1950 2000 2050 2100 1950 2000 2050 2100 1950 2000 2050 2100
prob
e(c
m-1
)
1920
1960
2000
2040
2080
2120
6.5M 4M 1.8M 1M8.8M
5ps
1950 2000 2050 2100 1950 2000 2050 2100 1950 2000 2050 2100 1950 2000 2050 2100 1950 2000 2050 2100
prob
e(c
m-1
)
pump (cm-1)
1920
1960
2000
2040
2080
2120 50ps
6.5M 4M 1.8M 1M8.8M
1950 2000 2050 2100 1950 2000 2050 2100 1950 2000 2050 2100 1950 2000 2050 2100 1950 2000 2050 2100
prob
e(c
m-1
)
pump (cm-1)
1920
1960
2000
6.5M 4M 1.8M 1M8.8M
2040
2080
212030ps
pump (cm-1)1950 2000 2050 2100 1950 2000 2050 2100 1950 2000 2050 2100 1950 2000 2050 2100 1950 2000 2050 2100
prob
e(c
m-1
)
1920
1960
2000
2040
2080
2120
6.5M 4M 1.8M 1M8.8M 6.5M 4M 1.8M 1M8.8M
5ps
1950 2000 2050 2100 1950 2000 2050 2100 1950 2000 2050 2100 1950 2000 2050 2100 1950 2000 2050 2100
prob
e(c
m-1
)
pump (cm-1)
1920
1960
2000
2040
2080
2120 50ps
6.5M 4M 1.8M 1M8.8M 6.5M 4M 1.8M 1M8.8M
1950 2000 2050 2100 1950 2000 2050 2100 1950 2000 2050 2100 1950 2000 2050 2100 1950 2000 2050 2100
prob
e(c
m-1
)
pump (cm-1)
1920
1960
2000
6.5M 4M 1.8M 1M8.8M8.8M
2040
2080
2120 30ps
Fig. 2. The concentration dependences of the 2D IR spectrum of 1∶1 KSCN∕KS13C15N aqueous solutions at different Tws.
2020 2060 2100 2140 2180
2040
2080
2120
2160
probe(cm-1)
pump (cm-1)
100fs
2060 2100 2140 2180 2060 2100 2140 2180
10ps 20ps
2060 2100 2140 2180
30ps
Fig. 3. The time dependence of the 2D IRspectrum of a 1∶1 C2H5SCN∕C2H5S13C15Nmixed liquid. No cross peaks have grownin up to 30 ps, indicating negligible en-ergy has exchanged between the CNand 13C15N stretches of the two mole-cules.
Bian et al. PNAS ∣ March 22, 2011 ∣ vol. 108 ∣ no. 12 ∣ 4739
CHEM
ISTR
Y
transfer vibrational energy to another anion. The vibrational ex-citations of S13C15N− and SCN− decay with their own vibrationalrelaxation rate constants kS13C15N− and kSCN− (here we assume theclustered and separated ions have the same k. The assumptionwith different vibrational relaxation rate constants for clusteredand separated ions is also tested. See SI Appendix for moredetails). From these considerations, we construct a kinetic modelfor the observations as illustrated in the following scheme 1.
In these experiments, we obtained molecular-rotation-freedata (22). Therefore, the model doesn’t contain any orientationalcomponent. From the model, four differential equations are de-rived. By solving the equations (Details are in SI Appendix), theenergy transfer rate constants, the clustered/separated ion equi-librium constant, and the location exchange rate constantsare obtained. Because the ratio of the rate constants for locationexchange is the equilibrium constant and the ratio of the energytransfer rate constants are determined by the difference in theCN stretching energy of the isotopic species, there are only threeunknown parameters to be determined. The vibrational relaxa-tion rate constants, and the time dependent concentrationsof excited species are experimentally determined. Calculationssimultaneously fit the four experimental curves very well(Fig. 4 A and B) with the three parameters: 1∕kSCN−→S13C15N− ¼115� 15 ps, the equilibrium constant K ¼ 19� 3 (95� 1% ofanions are clustered), and the clustered and separated ionexchange time constant 1∕kclu→iso ¼ 12� 7 ps. Based on theenergy transfer rate constant, and the energy transfer equationfrom a previous publication (23), the experimentally determinedvibrational coupling constant, and the assumption of dipole-dipole interaction for vibrational energy transfer, the average dis-tance between the C≡N groups of two SCN− anions in a clusteris determined to be 3.7� 0.3 Å. The value is very close to theshortest C≡ N distance 3.8 ∼ 4.0 Å in KSCN crystals (37, 38).(More details are in SI Appendix.)
One Energy Donor has Seventeen Acceptors in a 10M KSCN Solution.In addition to the concentration of ion clusters revealed by thenonresonant energy transfer experiments, the cluster sizes canalso be evaluated by resonant energy transfer measurements.
In these experiments, the resonant energy transfer from onedonor to any acceptor, as well as molecular rotations, can causethe anisotropy of vibrational excitation to decay (25, 36). Duringresonant energy transfers, the energy can be transferred backfrom acceptors to the original donor. The probability of reversetransfer is inversely proportional to the number of acceptors:more acceptors resulting in statistically less likely reverse trans-
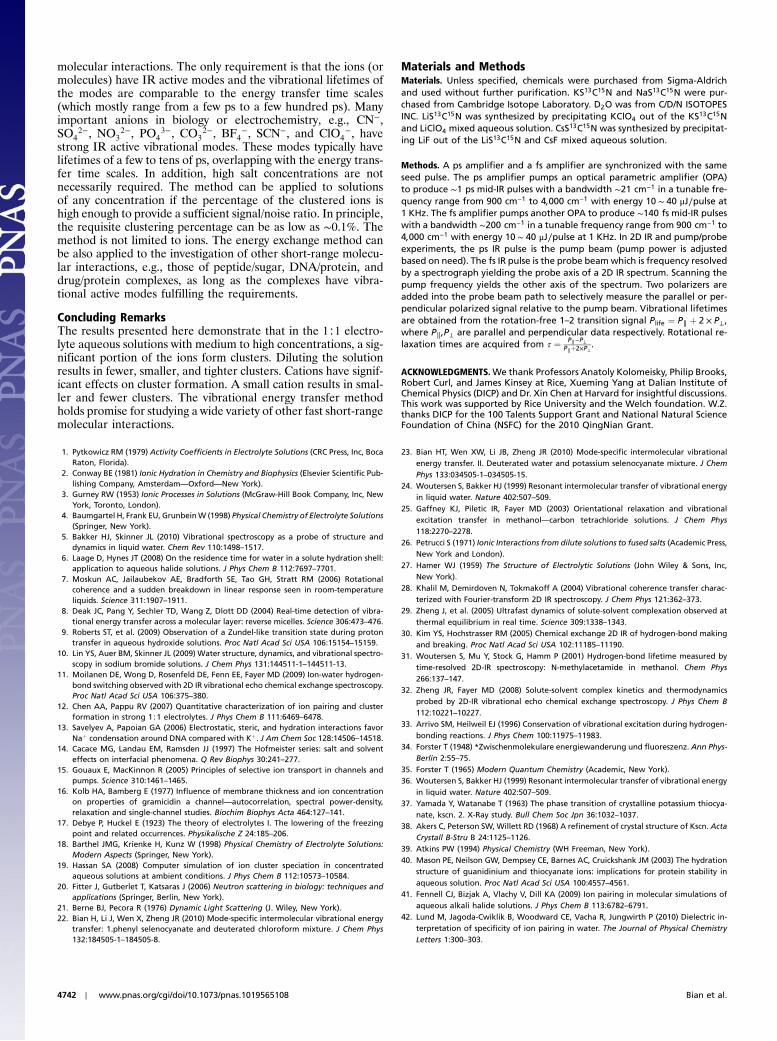
fers. When a reverse transfer occurs, the anisotropy is recovered.Therefore, fewer acceptors for one donor (corresponding to asmaller cluster) will result in slower energy-transfer-induced ani-sotropy decay. Based on the physical picture, we derive an equa-tion which can be used to extract the number of anions involvedin the effective energy transfer (Details are in SI Appendix):
RðtÞRð0Þ ¼ e−
tτor
��1 −
1
1þ ðntot − 1Þ × c
�e−½1þðntot−1Þ×c�tτ
þ 1
1þ ðntot − 1Þ × c
�; [2]
where τor is the molecular rotational time constant in a cluster,and c is the fraction of S13C15N− (the energy carrier) among theisotope-labeled anions in a cluster. Changing the ratio ofS13C15N−∕SCN− in a solution can change the number of resonantenergy acceptors for one donor and therefore the resonance-en-ergy-transfer-induced anisotropy decay rate, while the chemicalproperties of the cluster are unchanged. ntot is the number of an-ions (both S13C15N− and SCN−) within an effective energy trans-fer unit. τ is the resonant one-donor-to-one-acceptor energytransfer time constant. In Eq. 2, only two parameters (ntot andτ) are experimentally unknown. Calculations with the two adjus-table parameters simultaneously fit the experimental results ofsix different isotope ratios very well (Fig.. 5). The calculationsshow that τ ¼ 54� 8 ps and ntot ¼ 18� 3. The number 18 isthe same as the number of first shell SCN− anions surroundingone anion in the KSCN crystals (37, 38). (More details are inSI Appendix). At this point, we don’t have any solid evidenceto show that the energy acceptor number 18 − 1 ¼ 17� 3 ob-tained from our experiments represents the number of anionssurrounding one anion in the crystal. However, from the similar-ity of the anion distance and this acceptor number between theion clusters and the crystal, we believe that some structural as-pects of a big cluster in solution C is probably similar to thosein the crystal, e.g., the shortest anion distance and the number
0 40 80 120 160 200 2400.0
0.2
0.4
0.6
0.8
1.0
Energy down-flowing Peaks 1 and 5
Energy up-pumping Peaks 3 and 7
Nor
mal
ized
Pop
ulat
ion
Waiting Time (ps)
0 40 80 120 160 200 2400.00
0.02
0.04
0.06
Nor
mal
ized
Pop
ulat
ion
Peak 7
Peak 5
Waiting Time (ps)
BA
Fig. 4. Peak intensity data (dots) and fits to the data (lines) of the 2D IRspectra of solution C. Calculations details are in SI Appendix.
Scheme 1.
0 10 20 30 40 50 60 70-0.2
0.0
0.2
0.4
0.6
0.8
1.0
1:99 2:98 10:90 20:80 50:50 100:0
Nor
mal
ized
Ani
sotr
opy
Waiting Time (ps)
KS13C15N : KSCN
Fig. 5. The anisotropy decay data (dots) and calculations of Eq. 2 (lines) ofthe 13C15N stretch of S13C15N− in 10 M salt aqueous solutions with differentKS13C15N∕KSCN ratios. Adjusting the KS13C15N∕KSCN ratio changes thenumber of resonance energy acceptors for the excited S13C15N− donor.The calculations yield ntot ¼ 18� 3, τ ¼ 54� 8 ps.
4740 ∣ www.pnas.org/cgi/doi/10.1073/pnas.1019565108 Bian et al.

of anions in the first solvation shell of an energy donor. In experi-ments, Kþ doesn’t produce any signal. Kþ
’s number in any clusterwas therefore not determined. In highly concentrated solutions,the clusters could be large and contain many energy transferunits. Thus ntot is not the same as the number of anions in a clus-ter. At lower concentrations, the numbers and sizes of clustersbecome smaller. ntot is expected to become closer to the numberof anions in a cluster.
Diluted Solutions Have Fewer, Smaller, and Tighter Clusters. Accord-ing to the thermodynamic principle (39), diluting solution C withwater shifts the dissolution equilibrium to fewer clusters. Dilutingsolution C with water shifts the dissolution equilibrium to fewerclusters, this can be revealed by simple inspection of the growthof cross peaks in 2D IR spectra of solutions with different saltconcentrations (Fig.. 2). At higher concentrations, the intensitiesof cross peaks are higher at the same Tws. As described above, thegrowth of cross peaks is from the energy exchange of clusteredanions, while the diagonal peak pairs are from both clusteredand separated anions. The cross/diagonal peak ratio representsnot only how fast the energy exchange is, but also how manyof the anions form clusters. A higher cross/diagonal peak ratioindicates a faster energy transfer and/or more clusters. Quantita-tive analyses based on the above methods show that fewer andsmaller clusters form in a lower concentration (Fig. 6A. Numer-ical values are listed in SI Appendix: Table S1). The fraction ofanions in clusters is unexpectedly large in all studied concentra-tions. In highly concentrated solutions (10 and 8.8M) almost allanions are in clusters (>90%). Even for a relatively dilute solution(1M) whose salt/water ratio is only ∼1∕50, there still ∼27% ofanions in clusters which contain three anions on average. The re-sults suggest microphase separation in these solutions.
SCN− is one of the strongest and most frequently used proteindenaturants. SCN− has been the subject of intense investigationsand debates for its “salt-in” effect for many years (40). The highclustering tendency of KSCN observed in these experimentssuggests another avenue for understanding SCN−
’s high effec-tiveness in denaturing proteins: it is conceivable that the interac-tion between SCN− and water is indeed not very strong so that
SCN− prefers to associate to amino acid residues of a proteinover water in a protein aqueous solution.
Another interesting result of the concentration dependentexperiments is that the one-donor-to-one-acceptor energy trans-fer rate is faster at a lower concentration (Fig.. 6B). Accordingto [1], this result suggests that a smaller cluster is tighter. Theexact molecular mechanism giving rise to this phenomenon is notclear at this point. Instead, we propose a qualitative explanation.In a bigger cluster, more anions are close to each cation so thatthe average radius of the anion shells could be larger because ofthe geometry constraint and electrostatic repulsion.
Salts with Bigger Cations Form More Clusters. It has long beenrecognized that the size and charge density of a cation haveprofound effects on the properties of electrolyte solutions andtheir biological activities (2). Theoretical calculations suggestthat cations may affect the formation of ion pairs and clustersin aqueous solutions (12, 41). To explore cation specific effects,we performed energy transfer measurements on 4M (salt∕water ratio ¼ 1∕10) aqueous solutions of LiSCN, NaSCN,KSCN, and CsSCN. These experiments show that in solution,smaller cations form smaller and fewer clusters (Fig.. 6 C and D.Numerical values are listed in SI Appendix: Table S1). In solutionwith the smallest cation Liþ (LiSCN), ∼50% of the anions formclusters which contain ∼4 anions on average. In solution withthe biggest cation Csþ (CsSCN), ∼70% of the anions form clus-ters containing ∼9 anions. This trend may be qualitatively under-stood with the theoretical description of “matching cation andanion sizes” for some electrolyte solutions (41, 42): small-smalland large-large easily associate, while small-large readily dissoci-ate. SCN− is large and polarizable, and therefore, more readilyassociates with the large and polarizable Csþ than the small Liþ.
The Energy Exchange Method Can Be General for Short-Range Mole-cular Interactions. The mode-specific vibrational energy exchangemethod can be used to study many molecular interactions if theinteractions are strong enough and the probe vibrational lifetimesare long enough. The energy exchange method may or may notneed isotope labeling, which in general does not perturb the
LiSCN NaSCN KSCN CsSCN0
10
20
30
40
50
60
Salts with different cations
On
e-to
-on
e re
son
ance
tra
nsf
er t
ime
(ps)
0 1 2 3 4 5 6 7 8 9 10 110
10
20
30
40
50
60
On
e-to
-on
e re
son
ance
tra
nsf
er t
ime
(ps)
Concentration of KSCN solution (M)
A B
C D
40
50
60
70
80
Clu
ster
ed io
n p
erce
nta
ge
Salts with different cations
Clustered ion percentage
LiSCN NaSCN KSCN CsSCN0
2
4
6
8
10
12
ntot
nto
t
1 2 3 4 5 6 7 8 9 10 110
20
40
60
80
100
Clu
ster
ed io
n p
erce
nta
ge
Concentration of KSCN solution (M)
Clustered ion percentage
0
4
8
12
16
20 ntot
nto
t
Fig. 6. (A) The concentration depen-dences of clustered ion percentage andthe number (ntot) of anions in an energytransfer unit of KSCN aqueous solutions.(B) The concentration dependence ofthe one-donor-to-one-acceptor resonantenergy transfer time constant in ion clus-ters of KSCN aqueous solutions. (C) Thecation dependences of clustered ion per-centage and the number (ntot) of anionsin an energy transfer unit of 4M aqueoussolutions of LiSCN, NaSCN, KSCN, andCsSCN. (D) The cation dependence ofthe one-donor-to-one-acceptor resonantenergy transfer time constant in ion clus-ters of 4 M aqueous solutions of LiSCN,NaSCN, KSCN, and CsSCN.
Bian et al. PNAS ∣ March 22, 2011 ∣ vol. 108 ∣ no. 12 ∣ 4741
CHEM
ISTR
Y
molecular interactions. The only requirement is that the ions (ormolecules) have IR active modes and the vibrational lifetimes ofthe modes are comparable to the energy transfer time scales(which mostly range from a few ps to a few hundred ps). Manyimportant anions in biology or electrochemistry, e.g., CN−,SO4
2−, NO32−, PO4
3−, CO32−, BF4
−, SCN−, and ClO4−, have
strong IR active vibrational modes. These modes typically havelifetimes of a few to tens of ps, overlapping with the energy trans-fer time scales. In addition, high salt concentrations are notnecessarily required. The method can be applied to solutionsof any concentration if the percentage of the clustered ions ishigh enough to provide a sufficient signal/noise ratio. In principle,the requisite clustering percentage can be as low as ∼0.1%. Themethod is not limited to ions. The energy exchange method canbe also applied to the investigation of other short-range molecu-lar interactions, e.g., those of peptide/sugar, DNA/protein, anddrug/protein complexes, as long as the complexes have vibra-tional active modes fulfilling the requirements.
Concluding RemarksThe results presented here demonstrate that in the 1∶1 electro-lyte aqueous solutions with medium to high concentrations, a sig-nificant portion of the ions form clusters. Diluting the solutionresults in fewer, smaller, and tighter clusters. Cations have signif-icant effects on cluster formation. A small cation results in smal-ler and fewer clusters. The vibrational energy transfer methodholds promise for studying a wide variety of other fast short-rangemolecular interactions.
Materials and MethodsMaterials. Unless specified, chemicals were purchased from Sigma-Aldrichand used without further purification. KS13C15N and NaS13C15N were pur-chased from Cambridge Isotope Laboratory. D2O was from C/D/N ISOTOPESINC. LiS13C15N was synthesized by precipitating KClO4 out of the KS13C15Nand LiClO4 mixed aqueous solution. CsS13C15N was synthesized by precipitat-ing LiF out of the LiS13C15N and CsF mixed aqueous solution.
Methods. A ps amplifier and a fs amplifier are synchronized with the sameseed pulse. The ps amplifier pumps an optical parametric amplifier (OPA)to produce ∼1 ps mid-IR pulses with a bandwidth ∼21 cm−1 in a tunable fre-quency range from 900 cm−1 to 4;000 cm−1 with energy 10 ∼ 40 μJ∕pulse at1 KHz. The fs amplifier pumps another OPA to produce ∼140 fs mid-IR pulseswith a bandwidth ∼200 cm−1 in a tunable frequency range from 900 cm−1 to4;000 cm−1 with energy 10 ∼ 40 μJ∕pulse at 1 KHz. In 2D IR and pump/probeexperiments, the ps IR pulse is the pump beam (pump power is adjustedbased on need). The fs IR pulse is the probe beamwhich is frequency resolvedby a spectrograph yielding the probe axis of a 2D IR spectrum. Scanning thepump frequency yields the other axis of the spectrum. Two polarizers areadded into the probe beam path to selectively measure the parallel or per-pendicular polarized signal relative to the pump beam. Vibrational lifetimesare obtained from the rotation-free 1–2 transition signal Plife ¼ P∥ þ 2 × P⊥,where P∥;P⊥ are parallel and perpendicular data respectively. Rotational re-laxation times are acquired from τ ¼ P∥−P⊥
P∥þ2×P⊥.
ACKNOWLEDGMENTS.We thank Professors Anatoly Kolomeisky, Philip Brooks,Robert Curl, and James Kinsey at Rice, Xueming Yang at Dalian Institute ofChemical Physics (DICP) and Dr. Xin Chen at Harvard for insightful discussions.This work was supported by Rice University and the Welch foundation. W.Z.thanks DICP for the 100 Talents Support Grant and National Natural ScienceFoundation of China (NSFC) for the 2010 QingNian Grant.
1. Pytkowicz RM (1979) Activity Coefficients in Electrolyte Solutions (CRC Press, Inc, BocaRaton, Florida).
2. Conway BE (1981) Ionic Hydration in Chemistry and Biophysics (Elsevier Scientific Pub-lishing Company, Amsterdam—Oxford—New York).
3. Gurney RW (1953) Ionic Processes in Solutions (McGraw-Hill Book Company, Inc, NewYork, Toronto, London).
4. Baumgartel H, Frank EU, GrunbeinW (1998) Physical Chemistry of Electrolyte Solutions(Springer, New York).
5. Bakker HJ, Skinner JL (2010) Vibrational spectroscopy as a probe of structure anddynamics in liquid water. Chem Rev 110:1498–1517.
6. Laage D, Hynes JT (2008) On the residence time for water in a solute hydration shell:application to aqueous halide solutions. J Phys Chem B 112:7697–7701.
7. Moskun AC, Jailaubekov AE, Bradforth SE, Tao GH, Stratt RM (2006) Rotationalcoherence and a sudden breakdown in linear response seen in room-temperatureliquids. Science 311:1907–1911.
8. Deak JC, Pang Y, Sechler TD, Wang Z, Dlott DD (2004) Real-time detection of vibra-tional energy transfer across a molecular layer: reverse micelles. Science 306:473–476.
9. Roberts ST, et al. (2009) Observation of a Zundel-like transition state during protontransfer in aqueous hydroxide solutions. Proc Natl Acad Sci USA 106:15154–15159.
10. Lin YS, Auer BM, Skinner JL (2009) Water structure, dynamics, and vibrational spectro-scopy in sodium bromide solutions. J Chem Phys 131:144511-1–144511-13.
11. Moilanen DE, Wong D, Rosenfeld DE, Fenn EE, Fayer MD (2009) Ion-water hydrogen-bond switching observed with 2D IR vibrational echo chemical exchange spectroscopy.Proc Natl Acad Sci USA 106:375–380.
12. Chen AA, Pappu RV (2007) Quantitative characterization of ion pairing and clusterformation in strong 1∶1 electrolytes. J Phys Chem B 111:6469–6478.
13. Savelyev A, Papoian GA (2006) Electrostatic, steric, and hydration interactions favorNaþ condensation around DNA compared with Kþ. J Am Chem Soc 128:14506–14518.
14. Cacace MG, Landau EM, Ramsden JJ (1997) The Hofmeister series: salt and solventeffects on interfacial phenomena. Q Rev Biophys 30:241–277.
15. Gouaux E, MacKinnon R (2005) Principles of selective ion transport in channels andpumps. Science 310:1461–1465.
16. Kolb HA, Bamberg E (1977) Influence of membrane thickness and ion concentrationon properties of gramicidin a channel—autocorrelation, spectral power-density,relaxation and single-channel studies. Biochim Biophys Acta 464:127–141.
17. Debye P, Huckel E (1923) The theory of electrolytes I. The lowering of the freezingpoint and related occurrences. Physikalische Z 24:185–206.
18. Barthel JMG, Krienke H, Kunz W (1998) Physical Chemistry of Electrolyte Solutions:Modern Aspects (Springer, New York).
19. Hassan SA (2008) Computer simulation of ion cluster speciation in concentratedaqueous solutions at ambient conditions. J Phys Chem B 112:10573–10584.
20. Fitter J, Gutberlet T, Katsaras J (2006) Neutron scattering in biology: techniques andapplications (Springer, Berlin, New York).
21. Berne BJ, Pecora R (1976) Dynamic Light Scattering (J. Wiley, New York).22. Bian H, Li J, Wen X, Zheng JR (2010) Mode-specific intermolecular vibrational energy
transfer: 1.phenyl selenocyanate and deuterated chloroform mixture. J Chem Phys132:184505-1–184505-8.
23. Bian HT, Wen XW, Li JB, Zheng JR (2010) Mode-specific intermolecular vibrationalenergy transfer. II. Deuterated water and potassium selenocyanate mixture. J ChemPhys 133:034505-1–034505-15.
24. Woutersen S, Bakker HJ (1999) Resonant intermolecular transfer of vibrational energyin liquid water. Nature 402:507–509.
25. Gaffney KJ, Piletic IR, Fayer MD (2003) Orientational relaxation and vibrationalexcitation transfer in methanol—carbon tetrachloride solutions. J Chem Phys118:2270–2278.
26. Petrucci S (1971) Ionic Interactions from dilute solutions to fused salts (Academic Press,New York and London).
27. Hamer WJ (1959) The Structure of Electrolytic Solutions (John Wiley & Sons, Inc,New York).
28. Khalil M, Demirdoven N, Tokmakoff A (2004) Vibrational coherence transfer charac-terized with Fourier-transform 2D IR spectroscopy. J Chem Phys 121:362–373.
29. Zheng J, et al. (2005) Ultrafast dynamics of solute-solvent complexation observed atthermal equilibrium in real time. Science 309:1338–1343.
30. Kim YS, Hochstrasser RM (2005) Chemical exchange 2D IR of hydrogen-bond makingand breaking. Proc Natl Acad Sci USA 102:11185–11190.
31. Woutersen S, Mu Y, Stock G, Hamm P (2001) Hydrogen-bond lifetime measured bytime-resolved 2D-IR spectroscopy: N-methylacetamide in methanol. Chem Phys266:137–147.
32. Zheng JR, Fayer MD (2008) Solute-solvent complex kinetics and thermodynamicsprobed by 2D-IR vibrational echo chemical exchange spectroscopy. J Phys Chem B112:10221–10227.
33. Arrivo SM, Heilweil EJ (1996) Conservation of vibrational excitation during hydrogen-bonding reactions. J Phys Chem 100:11975–11983.
34. Forster T (1948) *Zwischenmolekulare energiewanderung und fluoreszenz. Ann Phys-Berlin 2:55–75.
35. Forster T (1965) Modern Quantum Chemistry (Academic, New York).36. Woutersen S, Bakker HJ (1999) Resonant intermolecular transfer of vibrational energy
in liquid water. Nature 402:507–509.37. Yamada Y, Watanabe T (1963) The phase transition of crystalline potassium thiocya-
nate, kscn. 2. X-Ray study. Bull Chem Soc Jpn 36:1032–1037.38. Akers C, Peterson SW, Willett RD (1968) A refinement of crystal structure of Kscn. Acta
Crystall B-Stru B 24:1125–1126.39. Atkins PW (1994) Physical Chemistry (WH Freeman, New York).40. Mason PE, Neilson GW, Dempsey CE, Barnes AC, Cruickshank JM (2003) The hydration
structure of guanidinium and thiocyanate ions: implications for protein stability inaqueous solution. Proc Natl Acad Sci USA 100:4557–4561.
41. Fennell CJ, Bizjak A, Vlachy V, Dill KA (2009) Ion pairing in molecular simulations ofaqueous alkali halide solutions. J Phys Chem B 113:6782–6791.
42. Lund M, Jagoda-Cwiklik B, Woodward CE, Vacha R, Jungwirth P (2010) Dielectric in-terpretation of specificity of ion pairing in water. The Journal of Physical ChemistryLetters 1:300–303.
4742 ∣ www.pnas.org/cgi/doi/10.1073/pnas.1019565108 Bian et al.