iom sudan displacement tracking matrix dtm mobility
TRANSCRIPT

Round Two August 2021DTM
Sudan 1
The Displacement Tracking Matrix (DTM) is a global IOM system used to track and monitor displacement and population mobility. It has been implemented in over 80 countries worldwide and is designed to regularly and systematically capture, process and disseminate information to provide a better understanding of the movements and evolving needs of mobile populations, whether on site or en route. It is comprised of four distinct components, namely: Mobility Tracking, Registration, Flow Monitoring and Surveying.
Commencing in November 2020, DTM Sudan began its preparation for the second round of Mobility Tracking; this started with the expansion of DTM operations across three additional states of implementation, namely Kassala, Gedaref and Blue Nile, followed by visiting locations in North, East, South, West, and Central Darfur, as well as South and West Kordofan which were not visited in Round One. Data collection was then carried out over a two-month period, concluding in mid-March, and followed by data cleaning and veri�cation to produce the second round of results.
Geographically, Round Two covers 165 locations in North Darfur, two locations in East Darfur, six locations in South Darfur, 31 locations in Central Darfur, four locations in West Darfur, 53 locations in South Kordofan, 20 locations in West Kordofan, 17 locations in Gedaref, 14 locations in Kassala and 26 locations in Blue Nile. Across these 338 new locations, DTM captured 637,160 additional internally displaced persons (IDPs) and 323,039 additional returnees not captured by DTM teams in Round One.
It is important to note that the above mentioned 338 locations were not visited in Round One, and therefore, this Round Two report provides an accumulative overview of the 1,425 locations visited in Round One, and the additional 338 locations visited in Round Two. Accordingly, any increase in �gures since Round One is due to expanded geographic coverage, and is not indicative of an increase in population presence in previously visited locations.
Mobility Tracking Round Two identi�ed the accumulative presence of 3,036,593 IDPs, 969,397 permanent returnees from internal displacement, 141,495 seasonal returnees, 92,696 returnees from abroad, and 399,946 foreign nationals currently residing in Sudan.
AUGUST 2021MOBILITY TRACKING SUDAN ROUND TWO
10States
338Locations
INTERNALLY DISPLACED PERSONS (IDPs)
3,036,593Individuals
647,256households
637,160
155,722
PERMANENT RETURNEES FROM INTERNAL DISPLACEMENT
969,397Individuals
180,550households
265,801
47,568
SEASONAL RETURNEES
141,495Individuals
27,532households
3,625
820
RETURNEES FROM ABROAD
92,696Individuals
18,169households
53,613
10,071
FOREIGN NATIONALS
399,946 Individuals
91,091 households
259,285
54,290
1,553Key Informants
IOM SUDAN DISPLACEMENT TRACKING MATRIX DTM
Sudan

Round Two August 2021DTM
Sudan2
DTM’s operational expansion in Sudan, and the implementation of the Mobility Tracking methodology, serve to gain a comprehensive understanding of displacement by providing regularly updated figures on population movements. This in turn informs and guides humanitarian response planning and durable solutions.
MOBILITY TRACKINGMobility Tracking is a methodology aimed at the systematic collection of information on selected target population groups within defined locations, and it allows to update such figures at regular intervals to provide updates on displacement and other forms of mobility in Sudan. Through this standard methodology, DTM produces an evidence base for programme planning, with the intention to support humanitarian, transition and recovery operations across the country.
DTM employs enumerators who originate from the areas of assessment. Enumerators collect quantitative data at location level, through direct interviews with key informants (selected for their knowledge of the area under observation). Key informants consist of representatives from the Humanitarian Aid Commission (HAC), humanitarian aid workers, religious and other prominent community leaders.
The methodology utilised to implement Mobility Tracking Round Two is summarised below:
• DTM conducted a Training of Trainers (ToT) in Khartoum with DTM teams from the states of operation on the Mobility Tracking methodology and data collection process.
• DTM teams visited Gedaref, Kassala and Blue Nile to introduce the DTM programme, its Mobility Tracking methodology and data collection process – facilitated and supported by HAC.
• Data collection commenced to verify the presence of target population groups across 338 locations not covered in Round One. Additional locations with target population presence were also identified throughout the data collection period, and added accordingly to DTM’s existing baseline to be visited in Round Three.
• DTM teams relied on a broad network of key informants to quantify and detail the characteristics of each target population group present per location. Where possible, triangulation1 of information provided by different key informants in the same geographic location further verified the figures.
• Additional information was collected, such as the time of arrival of IDPs, returnees from internal displacement and foreign nationals, as well as their locations of origin, reasons for displacement, return intentions, and temporary shelter categories.
• Sex and age disaggregation was projected based on the headcount of at least ten households within each identified location and for each population group present.
• Locations are defined as the smallest administrative units where population groups can be assessed, such as villages, neighbourhoods, camps, or gathering-sites.
Field teams will continue to revisit all locations and interview key informants to update locations and verify population presence on a periodic basis – ensuring updates are communicated regularly through datasets and reports, and remain reflective of evolving dynamics in Sudan.
TARGET POPULATION GROUPSDTM in Sudan collects information on the following target population groups:
Internally displaced personsAccording to the Guiding Principles on Internal Displacement, IDPs are: “persons or groups of persons who have been forced or obliged to flee or to leave their homes or places of habitual residence, in particular as a result of or in order to avoid the effects of armed conflict, situations of generalized violence, violations of human rights or natural or human-made disasters, and who have not crossed an internationally recognized state border” (United Nations, 1998). Building from this, and for operational purposes, DTM lists a person to be displaced if they have been forced or obliged to flee from their habitual residence due to an event dating from 2003 onwards, while subsequently seeking safety in a different location such as a village, neighbourhood, camp, or gathering site.2
Returnees from internal displacementPersons who were previously displaced from their habitual residence, within Sudan, due to an event dating from 2003 onwards, and have now voluntarily returned to the location of their habitual residence, irrespective of whether they have returned to their former residence or to another shelter type. Under this definition, DTM is only monitoring returns, without referring to whether the return was safe, dignified, or a durable solution. Permanent returnees from internal displacement: Any returnee from internal displacement who has returned to their place of habitual residence.Seasonal returnees from internal displacement: Any returnee from internal displacement who returns to their place of habitual residence annually based on seasonal activities, such as seasonal harvests.
Returnees from abroadClassified as all Sudanese nationals who have returned to Sudan from abroad, regardless of whether they sought international protection or not.
Foreign nationalsAny person who is not a Sudanese national and residing within the location (village, neighbourhood, camp, gathering site) regardless of their status; including persons who may/may not have sought international protection while in Sudan.
METHODOLOGY
1 Triangulation refers to triple verification done by interviewing at least three key informants for best estimates.2 For a nomadic population, habitual residence refers to the habitual living space on which their pastoral way of life is dependent.

Round Two August 2021DTM
Sudan3
3UNOCHA (2021) UNHCR refugee camps. URL: https://data.humdata.org/dataset/unhcr-refugee-camps
EXPANSION TO GEDAREF, KASSALA AND BLUE NILE DTM’s expansion to Gedaref, Kassala and Blue Nile states in late 2020 provides IOM’s first baseline estimation figures indicating population presence of vulnerable groups across the southeast region of Sudan.
Historically, there has been limited internal displacement and return in Gedaref and Kassala states. However, since 1984 (and more recently in 2020 with the influx of Tigray and Amhara tribes from Ethiopia due to armed conflict in the Tigray region of Ethiopia), both states host large foreign national populations. DTM’s definition of foreign nationals includes any person who is not Sudanese, regardless of their status; including persons who may/may not have sought international protection while in Sudan. Foreign nationals originate from Eritrea and Ethiopia, in addition to Somalia, South Sudan, Palestinian Territories, Chad, Syrian Arab Republic, India and Jordan. A substantial percentage of these populations are located within eight main locations across Kassala and Gedaref (see Map 1). Namely, these include Um Gargour, Umgulja, Tunaydba, Um Rakuba, Village 8, Hamdayet, Abuda, and Shagarab camps.3
Since 1987, inter-communal armed conflict across Blue Nile has resulted in displacement of local populations. In 2011 and 2014, many Sudanese fled Blue Nile (Baw locality in particular) into Ethiopia (Tango camp) and South Sudan. Of those who did not cross international borders, many remain displaced in Blue Nile, Sennar and White Nile states.
U N K
E T H I O P I A
Y E M E NC H A D
E G Y P T
L I B Y A
S O M A L I A
E R I T R E A
C . A . R .
D J I B O U T I
S O U T H S U D A N
NorthernRed Sea
North Darfur
River Nile
North KordofanGedaref
Kassala
West Kordofan
South Darfur
Sennar
South KordofanEast Darfur Blue Nile
Aj Jazirah
Khartoum
White Nile
Central Darfur
West Darfur
Abyei PCA
E T H I O P I A
E R I T R E A
Hamdayet
Village 8Umm Gulja
Tunaydba
Um Rakuba
Abuda Camp
Umm Gargour
Shagarab South Camp
Shagarab North Camp
Shagarab Center Camp
Gedaref
Kassala
Sennar
Aj Jazirah
Map 1 Operational Expansion to Blue Nile, Gedaref, and Kassala
Blue Nile
81,693
Kassala
ForeignNationals
Gedaref
ForeignNationals
IDPs
Returnees
Individuals13,641Households
56,678Individuals
9,650Households
81,329Individuals
18,966Households
ForeignNationals
7,367Individuals
1,473Households
158,412Individuals
31,634Households

Round Two August 2021DTM
Sudan 4
IDPs OVERVIEWDTM identified a total accumulative number of 3,036,593 IDP individuals (647,256 households) across eight states in Sudan. Through DTM’s expansion into Blue Nile, DTM captured 81,693 IDPs across 13 newly identified locations. Overall, 637,160 IDP individuals (155,722 households) were identified in Round Two.
The greatest proportion of displacement in the country is protracted (ongoing for more than five years) (refer to Diagram 3). Subsequently, an estimated 1,753,007 current IDPs (57%) were initially displaced between 2003 and 2010 at the height of the Darfur crisis. In comparison, 47,398 IDPs (2%) captured have been newly displaced in 2019 and 29,765 (1%) in 2020 – this does not demonstrate a decreasing trend in new displacement as this Round Two report only covers locations not visited in Round One. In Blue Nile, the majority of IDPs (73,449 individuals) were displaced between 2011 and 2017 due to inter-communal conflict.
In terms of population presence, the state with the highest number of IDPs is North Darfur – having recorded an estimated 933,320 individuals (31% of the total IDP count). This increase in population presence in North Darfur captured in Round Two is due to the addition of an estimated 381,904 IDPs (111,310 households) captured in Zamzam Camp, Al Fasher. South Darfur hosts the second largest population presence with 797,081 IDPs (26% of the total IDP count). Comparatively, Blue Nile is estimated to have the lowest population presence with 81,693 IDPs (3%), followed by West Kordofan (91,343 IDPs, 3%).
North Darfur has the greatest number of IDP locations – consisting of 270 locations (31% of the total), followed by South Kordofan (29%) and West Kordofan (19%). East Darfur has the fewest number of IDP locations and represents just one per cent of the total location count, followed by Blue Nile (2%) and West Darfur (5%). IDPs are most highly concentrated in the Darfur states, with Central Darfur hosting on average 13,215 IDPs per location, East Darfur hosting 12,462 IDPs per location and South Darfur hosting 11,071 IDPs per location. In contrast, South and West Kordofan have a far sparser distribution – averaging 1,108 IDPs and 560 IDPs respectively per location. This dynamic is attributed to the high presence of densely populated camps in Darfur in comparison to more informal gathering-sites in South and West Kordofan.
Camps (formal) Abandoned buildings or critical shelters
Gathering sites (informal settlements)
Host communities / families or on host community land
Rented accommodation Schools or other public buildings (no rent)
Other shelter types478,600 99624,18269,377 1,705 20172,195
73.94% 0.15%43.74%10.72% 0.26% 0.03%11.15%
Diagram 1: Percentage of IDPs per State and Comparison of MT Rounds4
4 Round Two of MT only visited locations not covered in Round One. Data on Round One locations where sudden displacements occurred can be found in DTMs Emergency Event Tracking reports.
933,320Individuals
503,200Individuals
797,081Individuals
793,328Individuals
422,877Individuals
377,209Individuals
337,801Individuals
335,301Individuals
272,781Individuals
217,683Individuals
91,343Individuals
73,015 Individuals
81,693Individuals
Blue Nile
Central Darfur
North Darfur
South Darfur
South Kordofan
West Darfur
West Kordofan
Round One Round Two Accumulative Total
31%
26%
14%
11%
9%
3%
3%
State
99,697Individuals
99,697Individuals
East Darfur 3%
Not Covered
430,120Individuals
3,753Individuals
45,668Individuals
2,500Individuals
55,098Individuals
18,328Individuals
81,693Individuals
Not Covered
TEMPORARY IDP HOUSEHOLDS SHELTER TYPES
NorthernRed Sea
North Darfur
River Nile
North Kordofan
Gedaref
West Kordofan
Kassala
South Darfur
Sennar
South KordofanEast Darfur
Blue Nile
White Nile
Al Jazirah
Khartoum
Central Darfur
West Darfur
Abyei PCA
Halfa
Al Malha
Soudari
Delgo
Al Golid
Al Ganab
Hala'ib
Dongola
Haya
Ad Dabbah Ad Damar
Gebrat Al Sheikh
Melit
Abu Hamad
Bara
Jubayt Elma'aadin
Al Radoum
Merwoe
Kutum
Barbar
Um Baru
Al Buhaira
Al Butanah
Agig
Shendi
Baw
Tawkar
Bahr Al Arab
Dordieb
Abu Jubayhah
Keilak
Ad Dinder
Sinkat
Kernoi
Atbara
An Nuhud
Al Leri
Al Idia
Ad Dali
Sheikan
Al Dibab
Kas
Um Kadadah
At Tawisha
Gharb Bara
Al KhiwaiUm Rawaba
Zalingi
Al Kurmuk
Al Fasher
Yassin
Wad Bandah
Mukjar
Al Matama
At Tina
Sennar
Abyei
As Sunut
Guli
Ghubaish
Ghadeer
Adila Al Lagowa
As Serief
Abyei PCA area
Bendasi
Sharg An Neel
KereneikKelemando
Ar Rahad
Bahri Reifi Khashm Elgirba
Dilling
Delami
Habila - SK
Azum
Assalaya
Tawila
Ad Diwaim
Abu JabrahBuram
Al Meiram
Shia'ria
Geisan
Al Fashaga
Abu Zabad
Abassiya
Talawdi
Heiban
At Tadamon - BN
Um Dafoug
Nitega
Al Lait
Kulbus
Karrari
Kebkabiya
Beliel
As Salam / Ar Rawat
Sharg Aj Jazirah
As Sunta
Sirba
Abu Hujar
Basundah
Sinja
Al FaoJebel Moon
Beida
Um Rimta
Al Qureisha
Gereida Kadugli
Rabak
As Salam - WK
Al GitainaWasat Al Gedaref
Tendal�
Rehaid Albirdi
Reifi Aroma
Reifi Telkok
Kubum
Tulus
As Suki
Um Bada
Kateila
As Salam - SD
Um Algura
Aj Jabalain
Al Hasahisa
Ar Rusayris
Ed Al Fursan
Reifi Shamal Ad Delta
Al Manaqil
Al Quoz
Kos�
Wadi Salih
Al Qurashi
Al Firdous
Wad Al Mahi
Reifi Wad Elhilaiw
Reifi Kassla
Gala'a Al Nahal
Sawakin
Damso
Um Dam Haj Ahmed
Nyala Shimal
Sharg Sennar
Babanusa
Ag Geneina
Abu Kershola
Ar RahadDar As Salam
Um Dukhun
Sha�aya
Sharg Aj Jabal
At Tadamon - SK
Janub Aj Jazirah
Reifi Hamashkureib
Abu Karinka
Al Kamlin
Um Durein
Habila - WD
Galabat Ash-Shargiah
Al Buram
Ar Rashad
Al Burgaig
Ed Damazine
Reifi Nahr Atbara
Al MafazaSaraf Omra Al Galabat Al Gharbyah - Kassab
Ar Reif Ash Shargi
Mershing
Gharb Jabal Marrah
Al Wihda
Reifi Gharb KassalaUm Durman
Al Koma
Halfa Aj Jadeedah
Ad Du'ayn
Jebel Awlia
Foro Baranga
Port Sudan
Shamal Jabal Marrah
Medani Al Kubra
Nyala Janoub
Madeinat Kassala
IDP locations
Locality
StateThis map is for illustration purposes only. Names and boundaries on this map do not imply ocial endorsement or acceptance by IOM. This map is for planning purposes only.
High
Low
LEGENDIDP concentration
Map 2: IDP Population Density

Round Two August 2021DTM
Sudan5
The largest proportion of IDPs across Sudan are displaced from within the same state as they are currently residing. In Blue Nile and South Kordofan, displaced individuals are solely from within their own state – suggestive of logistical and security restrictions faced by IDPs when travelling far distances in search of safety. South Darfur and West Kordofan, in contrast, host a heterogeneous group of IDPs from neighbouring states and beyond.
MAIN CAUSES OF DISPLACEMENTArmed conflict was identified as the primary reason for displacement in 95 per cent of IDP locations assessed. Communal clashes, which tend to be based on tensions over ethnicity, land, or livestock, were reported to be the main reason for displacement in four per cent of IDP locations. Economic reasons – populations forced to move due to a lack of livelihoods and/or service provision – were reported to be the main reason for displacement in one per cent of locations assessed.
95%
ARMEDCONFLICT
4%COMMUNAL CLASHES
ECONOMIC REASONS
1st reason2nd reason
1%
3rd reason
PLACES OF ORIGIN OF IDPs
Diagram 3: Timeline of displacement by states with current IDP population presence7
5 Projected sex and age figures are compiled using the additional locations captured in Round Two.6 The Return Intention Indicator was added in Round Two.7 Round Two of MT only visited locations not covered in Round One. Data on Round One locations where sudden displacements occurred can be found in DTMs Emergency Event Tracking reports.
Diagram 2: Main Reasons for IDP Displacement
Data collected through the return intention indicator suggests that 447,401 IDP individuals (70%) intend to remain in their locations of displacement, whilst 189,759 IDP individuals (30%) intend to return to their locations of origin upon improvement of the security/economic situation.6 The majority of IDPs reporting intentions to remain in their locations of displacement are in North Darfur (66%). Comparatively, the majority of IDPs reporting intentions to return to their locations of origin are in Blue Nile (13%), South Kordofan (8%) and Central Darfur (7%).
RETURN INTENTION
PROJECTED SEX AND AGE DISAGGREGATION ACROSS ALL STATES5
0 to 1 Years
6 to 17 Years
18 to 59 Years
60+ Years
51%Female
49%Male
4% 4%
10% 10%
15% 15%
16% 18%
4% 4%
1 to 5 Years
West KordofanWest Darfur South Kordofan South DarfurNorth Darfur East Darfur Central Darfur Blue Nile
2003
-201
0
YEA
R O
F D
ISPL
AC
EMEN
T
TOTALIDP INDIVIDUALS PER STATE
1,753,007
West KordofanWest Darfur South Kordofan South DarfurNorth Darfur East Darfur Central Darfur Blue Nile
570,160 255,942 253,261 569,448 93,192 4,503 06,501
West KordofanWest Darfur South Kordofan South DarfurNorth Darfur East Darfur Central Darfur Blue Nile
342,064 72,949 100,877 220,368 4,180 73,883 229,083 73,449
2011
-201
7
32,333 1,32515,553 2,746 20,6673,120 4,690 3,462
2018
West KordofanWest Darfur South Kordofan South DarfurNorth Darfur East Darfur Central Darfur Blue Nile
14,598 1,0005,247 766 16,0714,090 2,060 3,566
2019
West KordofanWest Darfur South Kordofan South DarfurNorth Darfur East Darfur Central Darfur Blue Nile
2020 17,576 0296 2,899 2,4571,700 4,047 790
West KordofanWest Darfur South Kordofan South DarfurNorth Darfur East Darfur Central Darfur Blue Nile
4,232 00 854 00 162 426
2021
1,116,853
83,896
47,398
29,765
0.18%
57.7%
36.7%
2.7%
1.5%
29,765
5,674
0.98%
5,674

Round Two August 2021DTM
Sudan 6
NorthernRed Sea
North Darfur
River Nile
North Kordofan
Gedaref
West Kordofan
Kassala
South Darfur
Sennar
South KordofanEast Darfur
Blue Nile
White Nile
Al Jazirah
Khartoum
Central Darfur
West Darfur
Abyei PCA
Halfa
Al Malha
Soudari
Delgo
Al Golid
Al Ganab
Hala'ib
Dongola
Haya
Ad Dabbah Ad Damar
Gebrat Al Sheikh
Melit
Abu Hamad
Bara
Jubayt Elma'aadin
Al Radoum
Merwoe
Kutum
Barbar
Um Baru
Al Buhaira
Al Butanah
Agig
Shendi
Baw
Tawkar
Bahr Al Arab
Dordieb
Abu Jubayhah
Keilak
Ad Dinder
Sinkat
Kernoi
Atbara
An Nuhud
Al Leri
Al Idia
Ad Dali
Sheikan
Al Dibab
Kas
Um Kadadah
At Tawisha
Gharb Bara
Al KhiwaiUm Rawaba
Zalingi
Al Kurmuk
Al Fasher
Yassin
Wad Bandah
Mukjar
Al Matama
At Tina
Sennar
Abyei
As Sunut
Guli
Ghubaish
Ghadeer
Adila Al Lagowa
As Serief
Abyei PCA area
Bendasi
Sharg An Neel
KereneikKelemando
Ar Rahad
Bahri Reifi Khashm Elgirba
Dilling
Delami
Habila - SK
Azum
Assalaya
Tawila
Ad Diwaim
Abu JabrahBuram
Al Meiram
Shia'ria
Geisan
Al Fashaga
Abu Zabad
Abassiya
Talawdi
Heiban
At Tadamon - BN
Um Dafoug
Nitega
Al Lait
Kulbus
Karrari
Kebkabiya
Beliel
As Salam / Ar Rawat
Sharg Aj Jazirah
As Sunta
Sirba
Abu Hujar
Basundah
Sinja
Al FaoJebel Moon
Beida
Um Rimta
Al Qureisha
Gereida Kadugli
Rabak
As Salam - WK
Al GitainaWasat Al Gedaref
Tendal�
Rehaid Albirdi
Reifi Aroma
Reifi Telkok
Kubum
Tulus
As Suki
Um Bada
Kateila
As Salam - SD
Um Algura
Aj Jabalain
Al Hasahisa
Ar Rusayris
Ed Al Fursan
Reifi Shamal Ad Delta
Al Manaqil
Al Quoz
Kos�
Wadi Salih
Al Qurashi
Al Firdous
Wad Al Mahi
Reifi Wad Elhilaiw
Reifi Kassla
Gala'a Al Nahal
Sawakin
Damso
Um Dam Haj Ahmed
Nyala Shimal
Sharg Sennar
Babanusa
Ag Geneina
Abu Kershola
Ar RahadDar As Salam
Um Dukhun
Sha�aya
Sharg Aj Jabal
At Tadamon - SK
Janub Aj Jazirah
Reifi Hamashkureib
Abu Karinka
Al Kamlin
Um Durein
Habila - WD
Galabat Ash-Shargiah
Al Buram
Ar Rashad
Al Burgaig
Ed Damazine
Reifi Nahr Atbara
Al MafazaSaraf Omra Al Galabat Al Gharbyah - Kassab
Ar Reif Ash Shargi
Mershing
Gharb Jabal Marrah
Al Wihda
Reifi Gharb KassalaUm Durman
Al Koma
Halfa Aj Jadeedah
Ad Du'ayn
Jebel Awlia
Foro Baranga
Port Sudan
Shamal Jabal Marrah
Medani Al Kubra
Nyala Janoub
Madeinat Kassala
IDP locations
Locality
StateThis map is for illustration purposes only. Names and boundaries on this map do not imply ocial endorsement or acceptance by IOM. This map is for planning purposes only.
High
Low
LEGENDIDP concentration
RETURNEES FROM INTERNAL DISPLACEMENT OVERVIEW
DTM estimates a total accumulative number of 969,397 permanent returnees from internal displacement (180,550 households) across eight states in Sudan. Through DTM’s expansion into Blue Nile, DTM captured 9,702 permanent returnees across seven newly identified locations. Overall, 265,801 permanent returnee individuals (47,568 households) were identified in Round Two.
The lowest proportion of returns occurred during 2020 and over the first three months of 2021, while 2011 to 2015 saw the highest return rate – reflective of a mass influx of individuals returning to their habitual residences at the end of the Darfur crisis. Subsequently, an estimated 253,554 returnees (26%) returned between 2011 and 2015, followed by 190,308 returnees (20%) in 2018, 164,841 returnees (17%) in 2017 and 138,017 returnees (14%) in 2016. This steady decrease in returns suggests a correlation between the increased length of protracted displacement and the diminishing likelihood of returns – families forging new lives for themselves as they become settled into what were originally ‘temporary’ sites of displacement.
In terms of population presence, the state with the highest number of permanent returnees is North Darfur, where the total population presence is 305,315 individuals (31% of the total individual count). Blue Nile, in comparison, estimates a total number of 9,702 permanent returnees (1%) – the lowest proportion of total returnees, attributed to Blue Nile hosting the lowest percentage of IDPs or the lowest percentage of people displaced from the area.
North Darfur has the greatest number of returnee locations – consisting of 718 locations (70% of the total), followed by West Darfur (7%) and South Kordofan (6%). Blue Nile and East Darfur have the fewest number of returnee locations, each representing two per cent of the total location count. Returnees are highly concentrated in East, Central and South Darfur, with East Darfur hosting an average of 4,451 returnees, Central Darfur hosting 3,740 returnees and South Darfur hosting 3,437 returnees per location. West Kordofan currently has the lowest returnee population count per location, with an average of 411 individuals per location, followed by North Darfur (424 individuals per location).
SHELTER TYPES IN WHICH PERMANENT RETURNEE HOUSEHOLDS ARE RESIDING
PERMANENT RETURNEES OVERVIEW
84.2% 0.2%1.2%1.8% 0.4%12.2%
Abandoned buildings or critical shelters
Gathering sites (informal settlements)
Host communities / families or on host community land
Schools or other public buildings (no rent)
Other shelter typesPlace of habitual residence (returned home)
152,086 2802,1523,203 80722,022
305,315Individuals
246,292Individuals
194,480 Individuals
65,362Individuals
182,157Individuals
138,582Individuals
102,365Individuals
95,284Individuals
85,810Individuals
78,829Individuals
78,874Individuals
68,720Individuals
10,694Individuals
10,527Individuals
9,702Individuals
Not CoveredBlue Nile
Central Darfur
East Darfur
North Darfur
South Darfur
South Kordofan
West Darfur
West Kordofan
Round One Round Two Acumulative Total
31%
20%
19%
11%
9%
8%
1%
1%
STATE
59,023Individuals
129,118Individuals
43,575Individuals
7,081Individuals
6,981Individuals
10,154Individuals
167Individuals
9,702Individuals
Map 3: Permanent Returnee Population Density
Diagram 4: Returnees per state by MT Round

Round Two August 2021DTM
Sudan7
Chart 1 illustrates the population movement between states where permanent returnees were originally displaced from, and states where those permanent returnees have returned. North Darfur hosts the largest proportion of permanent returnees originally displaced from locations within other states. South Darfur hosts the second largest proportion of returnees originally displaced from locations within other states. Almost all permanent returnees within Central Darfur and West Darfur were originally displaced from locations within the same state. Field teams estimate that all permanent returnees captured in West Kordofan, South Kordofan, Blue Nile, and East Darfur were originally displaced from locations within the same state.
PERMANENT RETURNEE LOCATIONS OF PREVIOUS DISPLACEMENT
PROJECTED SEX AND AGE DISAGGREGATION FOR PERMANENT RETURNEES ACROSS ALL STATES6
52%Female
48%Male
15%
15%
11%
14%
14%
15%
15%
6% 4%3%
11% 8%8%
18%17%
18%16%
4%4%
0 to 1 Years
6 to 17 Years
18 to 59 Years
60+ Years
1 to 5 Years
South Darfur
Central Darfur
West Darfur
North Darfur
Blue Nile
South Kordofan
West Kordofan
East Darfur
North Darfur
South Darfur
West Darfur
Blue Nile
South Kordofan
West Kordofan
East Darfur
Central Darfur
SEASONAL RETURNEES OVERVIEW DTM estimates a total accumulative number of 141,495 seasonal returnees (27,532 households) across seven states in Sudan. In Round Two, DTM teams observed 3,625 seasonal returnees (820 households) who returned to their habitual residence on an impermanent basis – due to seasonal changes and cultivation, harvesting and livestock purposes. These population figures are expected to remain influx and observe drastic changes over the course of each year, as people continue to move with the seasons.
North DarfurNorth Kordofan
West Kordofan
South DarfurSouth Kordofan
East Darfur
White Nile
Central Darfur
West Darfur
Abyei PCA
Khartoum
Al Jazirah
Soudari
Al Malha
Melit
Bara
Gebrat Al Sheikh
Al Radoum
Kutum
Bahr Al Arab
Abu Jubayhah
Keilak
Um BaruKernoi
An Nuhud
Al Leri
Al Idia
Sheikan
Al Dibab
Kas
Um Kadadah
At Tawisha
Gharb Bara
Al KhiwaiUm RawabaZalingi
Al Fasher
Yassin
Wad Bandah
Mukjar
Abyei
Ghubaish
Adila Al Lagowa
As Serief
Guli
Abyei PCA area
Delami
Azum
Tawila
Tendal�
Shia'riaAbu Zabad
Um Dafoug
Al Lait
At Tina
As Sunut
Ghadeer
Bendasi
KereneikKelemando
As Salam - WK
Ar Rahad
Dilling Habila - SK
Assalaya
Ad Diwaim
Abu JabrahBuram
Rehaid Albirdi
Al Gitaina
Al Meiram
Abassiya
Talawdi
Heiban
Nitega
Kulbus
Kebkabiya
BelielKubum
Tulus
As Sunta
Sirba
Kateila
As Salam - SDEd Al Fursan
Al Quoz
Jebel Moon
Beida
Um Rimta
Wadi Salih
GereidaAl Firdous
Kadugli
Damso
Um Dam Haj Ahmed
Nyala Shimal
Babanusa
Ag Geneina
Abu Kershola
Dar As Salam
Um Dukhun
Sha�aya
Sharg Aj Jabal
At Tadamon - SK
Abu Karinka
Um Durein
Habila - WD
Al Buram
Ar Rashad
Saraf Omra
Ar Reif Ash Shargi
Mershing
Al Wihda
Al Koma
Ad Du'ayn
Foro Baranga Nyala Janoub
North Darfur
South Darfur
Central Darfur
East Darfur
Al Fasher
Tawila
Kebkabiya
Dar As SalamKelemando
Sharg Aj Jabal
Al Wihda Nitega
Shamal Jabal Marrah
Shia'ria
KutumAs Serief Melit
Kas
This map is for illustration purposes only. Names and boundaries on this map do not imply ocial endorsement or acceptance by IOM. This map is for planning purposes only.
State
Locality
2 - 418
419 - 1,620
1,621 - 5,472
5,473 - 20,000
SeasonalReturnees (Ind.)
SHELTER TYPE IN WHICH SEASONAL RETURNEES HOUSEHOLDS ARE RESIDING9
PROJECTED SEX AND AGE DISAGGREGATION FOR SEASONAL RETURNEES ACROSS ALL STATES8
11% 1%2%86%
Host communities / families or on host community land
Other shelter types Place of habitualresidence
Abandoned buildings or critical shelters
88 1317702
52%Female
48%Male
0 to 1 Years
1 to 5 Years
6 to 17 Years
18 to 59 Years
60+ Years
6%6%
13%11%
15%14%
15%14%
3%3%
8 Projected sex and age figures are compiled using the additional locations captured in Round Two.9 Shelter figures are compiled using the additional locations captured in Round Two, thereby covering 808 households in total.
Chart 1: States of previous displacement and permanent return
Map 4: Seasonal returnee population density

Round Two August 2021DTM
Sudan 8
RETURNEES FROM ABROAD OVERVIEWDTM estimates a total accumulative number of 92,696 returnees from abroad (18,169 households) across seven states in Sudan. The estimated figures of returnees from abroad were lower than returnees from internal displacement, representing just eight per cent of the total returnee count (consisting of 1,203,588 individuals and 226,251 households respectively). Overall, 53,613 returnee from abroad individuals (10,071 households) were identified in Round Two.
The highest proportion of returnees from abroad (an estimated 17,398 individuals, 19%) returned to Sudan between 2011 to 2015 – reflective of a mass influx of individuals returning to their habitual residences at the end of the Darfur crisis – followed by 10,669 returnees (12%) in 2017.
Most returnees from abroad returned from Chad (44%), followed by Ethiopia (21%) and South Sudan (10%). Predominantly, they are located in North Darfur (27,500 individuals) and Blue Nile (23,533 individuals), which can be explained in relation to the proximity to the borders of Chad and Ethiopia.
COUNTRIES OF DISPLACEMENT OF RETURNEES FROM ABROAD
SEX AND AGE DISAGGREGATION FOR RETURNEES FROM ABROAD ACROSS ALL STATES10
52%Female
48%Male
0 to 1 Years
1 to 5 Years
6 to 17 Years
18 to 59 Years
60+ Years
6%6%
13%11%
15%14%
15%14%
3%3%
Chad OtherEthiopia
South Sudan9,584 (10%)
19,46523,31040,337
(44%) (25%)
(21%)
10 Projected sex and age figures are compiled using the additional locations captured in Round Two.11 Shelter figures are compiled using the additional locations captured in Round Two, thereby covering 10,111 households in total.
SHELTER TYPE IN WHICH RETURNEE FROM ABROAD HOUSEHOLDS ARE RESIDING11
7,323 1,592 1,196Host communities / families or on host community land
Place of habitual residence (returned home)
Gathering sites (informal settlements)
72% 16% 12%
North Darfur North Kordofan
West Kordofan
South Darfur
Sennar
South Kordofan
Gedaref
East DarfurBlue Nile
Al Jazirah
River Nile
Khartoum
Northern
Kassala
White Nile
Central Darfur
West Darfur
Abyei PCA
Soudari
Al Malha
Melit
Gebrat Al Sheikh
Bara
Al Radoum
Kutum
Um Baru
Shendi
Baw
Al Butanah
Bahr Al Arab
Keilak
Ad Dabbah
Sheikan
Al LeriAl Dibab
Um Kadadah
At Tawisha
Gharb Bara
Al Khiwai
Zalingi
Yassin
Al Fasher
Mukjar
Abyei
Ad Damar
Ghubaish
Adila
Al Golid Al Matama
Al Lagowa
As Serief
Abu Jubayhah
Kernoi
Ad Dinder
Al Idia
An Nuhud
Ad DaliKas
Um RawabaWad Bandah
Al Kurmuk
Sennar
At Tina
As Sunut
Ghadeer
Guli
Bendasi
Kereneik
Sharg An Neel
Abyei PCA area
Kelemando
Bahri
Ar Rahad
Dilling
As Salam - WK
Assalaya Delami
Tawila
Al Gitaina
Tendalti
Habila - SK
Abu Jabrah
Azum
Buram
Shia'ria
Rehaid Albirdi
Al Meiram
Ad Diwaim
Geisan
Abassiya
Talawdi
Heiban
Abu Zabad
Beliel
Nitega
Kebkabiya
At Tadamon - BN
Um Dafoug
Kulbus
Al Lait
Karrari
Sharg Aj Jazirah
As Salam / Ar Rawat
Tulus
Kubum
Sirba
Aj Jabalain
As Sunta
Kateila
Sinja
Um Bada
As Suki
Abu Hujar
Al Hasahisa
Um AlguraAl Manaqil
As Salam - SD
Ar RusayrisEd Al Fursan
Jebel Moon
Beida
Al Fao
Um Rimta
KostiAl Quoz
Kadugli
Al Firdous
Wad Al Mahi
Rabak
Nyala Shimal
Sharg Sennar
Damso
Ag Geneina
Um Dam Haj Ahmed
Abu Kershola
Ar Rahad
Shattaya
Dar As Salam
Um Dukhun
Sharg Aj Jabal
At Tadamon - SK
Al Kamlin
Al Buram
Ar RashadEd Damazine
Al Mafaza
Um Durman
Al Koma
Foro Baranga
Rei� Nahr Atbara
This map is for illustration purposes only. Names and boundaries on this map do not imply o�cial endorsement or acceptance by IOM. This map is for planning purposes only.
State
Locality
SeasonalReturnees (Ind.)
1 - 762
763 - 2,000
2,001 - 4,850
4,851 - 10,728
Map 5: Returnees from Abroad Population Density
Chart 2: Countries from which Returnees Have Returned10
Round Two August 2021DTM
Sudan9
12 Projected sex and age figures are compiled using the additional locations captured in Round Two.13 Shelter figures are compiled using the additional locations captured in Round Two, thereby covering 54,290 households in total.
FOREIGN NATIONALS OVERVIEW
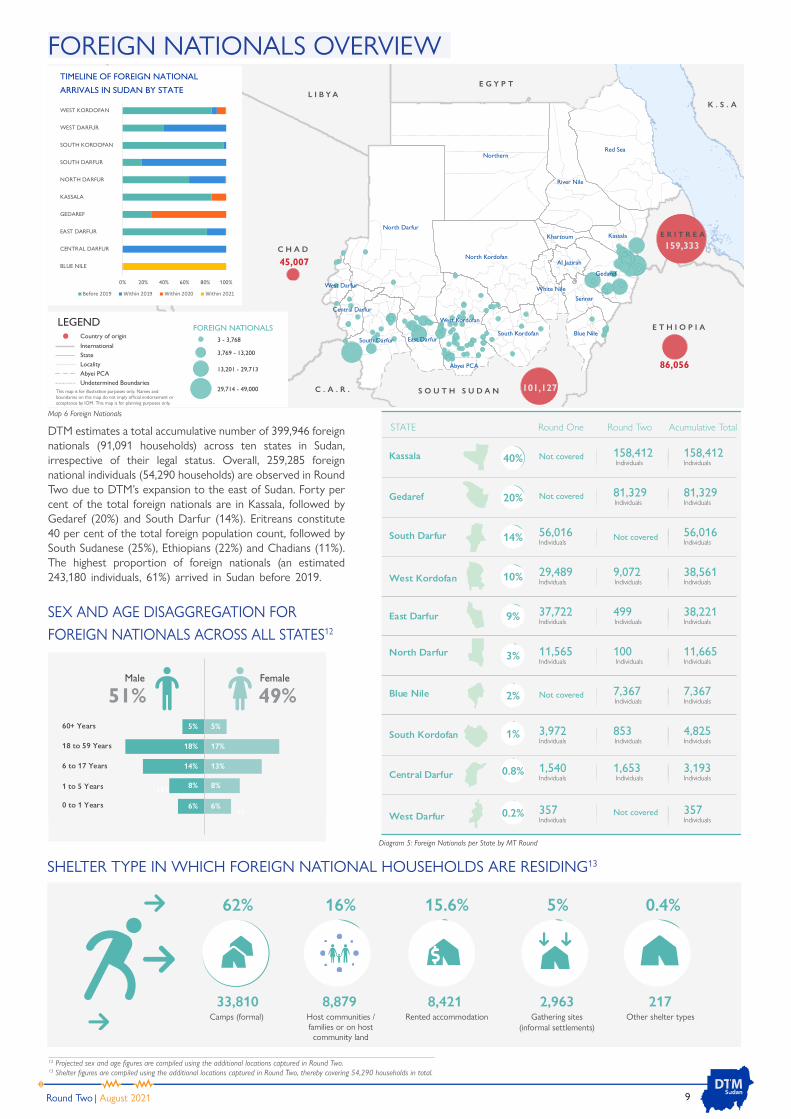
DTM estimates a total accumulative number of 399,946 foreign nationals (91,091 households) across ten states in Sudan, irrespective of their legal status. Overall, 259,285 foreign national individuals (54,290 households) are observed in Round Two due to DTM’s expansion to the east of Sudan. Forty per cent of the total foreign nationals are in Kassala, followed by Gedaref (20%) and South Darfur (14%). Eritreans constitute 40 per cent of the total foreign population count, followed by South Sudanese (25%), Ethiopians (22%) and Chadians (11%). The highest proportion of foreign nationals (an estimated 243,180 individuals, 61%) arrived in Sudan before 2019.
SEX AND AGE DISAGGREGATION FOR FOREIGN NATIONALS ACROSS ALL STATES12
52%Female
48%Male
0 to 1 Years
1 to 5 Years
6 to 17 Years
18 to 59 Years
60+ Years
6%6%
13%11%
15%14%
15%14%
3%3%
SHELTER TYPE IN WHICH FOREIGN NATIONAL HOUSEHOLDS ARE RESIDING13
45,007
86,056
101,127
159,333C H A D
N I G E R
L I B Y A
E T H I O P I A
E G Y P T
N I G E R I A
K . S . A
E R I T R E A
C A M E R O O N C . A . R . S O U T H S U D A N
0% 20% 40% 60% 80% 100%
BLUE NILE
CENTRAL DARFUR
EAST DARFUR
GEDAREF
KASSALA
NORTH DARFUR
SOUTH DARFUR
SOUTH KORDOFAN
WEST DARFUR
WEST KORDOFAN
TIMELINE OF FOREIGN NATIONAL
ARRIVALS IN SUDAN BY STATE
Before 2019 Within 2019 Within 2020 Within 2021
C . A . R .
NorthernRed Sea
North Darfur
River Nile
North Kordofan
Gedaref
West Kordofan
Kassala
South Darfur
Sennar
South KordofanEast Darfur
Blue Nile
Al Jazirah
Khartoum
White Nile
Central Darfur
West Darfur
Abyei PCA
3 - 3,768
3,769 - 13,200
13,201 - 29,713
29,714 - 49,000
FOREIGN NATIONALS
This map is for illustration purposes only. Names and boundaries on this map do not imply ocial endorsement or acceptance by IOM. This map is for planning purposes only.
InternationalStateLocalityAbyei PCAUndetermined Boundaries
LEGENDCountry of origin
158,412Individuals
Not covered
81,329Individuals
Not covered
Not covered56,016Individuals
9,072Individuals
29,489Individuals
499Individuals
37,722Individuals
100Individuals
11,565Individuals
7,367Individuals
Not covered
853Individuals
3,972Individuals
Blue Nile
Central Darfur
East Darfur
North Darfur
South Darfur
South Kordofan
West Darfur
West Kordofan
Round One Round Two Acumulative Total
40%
20%
14%
10%
9%
3%
2%
1%
STATE
Kassala
Gedaref
1,653Individuals
1,540Individuals
0.8%
Not covered357Individuals
0.2%
158,412Individuals
81,329Individuals
56,016Individuals
38,561Individuals
38,221Individuals
11,665Individuals
7,367Individuals
4,825Individuals
3,193Individuals
357Individuals
49%Female
51%Male
6%0 to 1 Years
1 to 5 Years 11%
6 to 17 Years 15%14% 15%
18 to 59 Years 15%
60+ Years
6% 6%
8% 8%
14% 13%
15%24%23% 15%18% 17%
5% 5%
Camps (formal) Gathering sites (informal settlements)
62% 5%
Other shelter typesHost communities / families or on host community land
16%
Rented accommodation
15.6% 0.4%
33,810 2,9638,879 8,421 217
Map 6 Foreign Nationals
Diagram 5: Foreign Nationals per State by MT Round

Round Two August 2021DTM
Sudan10
An overview of the geographical distribution of population presence illustrates that 1,692,869 IDPs (56%) are in urban areas and 1,343,724 IDPs (44%) in rural areas across the eight states assessed by DTM. In comparison, 894,839 returnees from internal displacement (92%) have returned to their rural habitual place of origin, while only 74,558 (8%) have returned to urban settings.
Both Blue Nile, North and Central Darfur and West Kordofan predominantly host rural IDPs, whereas IDPs in East, South and West Darfur and South Kordofan are mostly found in urban locations. Neither Blue Nile, Central Darfur nor West Darfur (apart from 150
individuals) have urban returnees, however, rural returnees from internal displacement are consistently distributed across all states assessed.
Furthermore, while most returnees from internal displacement are in rural villages, there is a far wider variety in IDP location types. In North, East and South Darfur, IDPs are predominantly located in urban camps. IDPs in Central Darfur are found in rural camps, and IDPs in West Kordofan tend to be found in rural villages. Finally, both West Darfur and South Kordofan observe the majority of IDPs to be in urban neighbourhoods or admin units.
GEOGRAPHICAL CLASSIFICATIONS OF INTERNALDISPLACEMENT AND RETURN
North Darfur North Kordofan
West Kordofan
South Darfur
Sennar
Gedaref
South Kordofan
NorthernRiver Nile
East DarfurBlue Nile
White Nile
Al Jazirah
Khartoum Kassala
Abyei PCA
Central Darfur
West Darfur
.This map is for illustration purposes only. Names and boundaries on this map do not imply o�cial endorsement or acceptance by IOM. This map is for planning purposes only.
Urban
Rural
Locality
State
44% 56%
Lorem ipsum
High
Low
IDP concentration
0% 20% 40% 60% 80% 100%
Blue Nile
Central Darfur
East Darfur
North Darfur
South Darfur
South Kordofan
West Darfur
West Kordofan
Rural Urban
IDPs
North Darfur North Kordofan
West Kordofan
South Darfur
Sennar
Gedaref
South Kordofan
NorthernRiver Nile
East DarfurBlue Nile
White Nile
Al Jazirah
Khartoum Kassala
Abyei PCA
Central Darfur
West Darfur
.This map is for illustration purposes only. Names and boundaries on this map do not imply o�cial endorsement or acceptance by IOM. This map is for planning purposes only.
Urban
Rural
Locality
State
High
Low
Returneesconcentration8%
92%0% 20% 40% 60% 80% 100%
Blue Nile
Central Darfur
East Darfur
North Darfur
South Darfur
South Kordofan
West Darfur
West Kordofan
Rural Urban
Returnees
Map 7: IDP population density and geographical (urban-rural) location classifications
Map 8: Returnee Population Density and Geographical (Urban-Rural) Location Classifications
The credibility rating per location is ranked by the enumerators and analysed in accordance with a set of indicators. Namely, these indicators include the number of key informants interviewed per location, whether the information was provided over the phone or in person, whether the information provided by the source (key informant) matches that of other sources, whether the source referenced any records or lists and whether the information provided by the source matched the enumerator’s observations. The green, orange, and red scales (with green meaning high credibility, orange meaning medium and red meaning low) are then calculated based on analyses of the enumerator’s responses to determine the credibility per location and highlight areas for future improvement.
CREDIBILITY RATING Total LocationsRedRow Labels
2414 5Blue Nile
Grand Total
9 165
4 53
9 31
26
20
2 17
4 14
6
3 4
1 2
33 338
South Kordofan
Central Darfur
North Darfur
Blue Nile
West Kordofan
Gedaref
South Darfur
East Darfur
Orange
9
16
11
9
6
2
1
55
West Darfur
Green
147
33
11
26
19
6
4
3
1
250
Kassala
- -
1 -
1
-
-

IOM DISCLAIMERThe opinions expressed in the report are those of the authors and do not necessarily
designations employed and the presentation of material throughout the report do not imply the expression of any opinion whatsoever on the part of IOM concerning the legal status of any country, territory, city or area, or of its authorities, or concerning its frontiers or boundaries.
migrants and society. As an intergovernmental organization, IOM acts with its partners in the international community to: assist in the meeting of operational challenges of migration; advance understanding of migration issues; encourage social and economic development through migration; and uphold the human dignity and well-being of migrants.
DTM SERVICES & CONTACTS For further information, please contact IOM Sudan
Tel.: +249 157 554 600/1/2
E-mail: [email protected]
Website: www.sudan.iom.int I www.dtm.iom.int/sudan