investors presentation february 2012argaamplus.s3.amazonaws.com/5c546e70-cdba-47ff-b35f-5a...entered...
TRANSCRIPT

Investors Presentation
February 2012

1. Overview
2. Strategy and Growth
3. Financial Highlights and Projections
4. Our Intellectual Assets
Contents
2
Note: The financials for 2011 in the presentation are based on unaudited final year accounts
OVERVIEW Where we are now, and how we got here
3

Savola today
• Listed on the Saudi stock exchange
• One of the largest players in a fast growing region
• Leading brands
• Modern state of technology and design capabilities
• Well-positioned to explore strong growth in the future
• Operations covering foods, retail, plastics packaging, real estate, and strategic investments
Group snapshot
• Sales of SAR 25 billion in 2011 and SAR 21 billion in 2010
• Net Profit of SAR 1,202 million in 2011 and
SAR 887 million in 2010
• Workforce of more than 16,000 employees
• More than 120,000 shareholders
• Market Capitalization of around SAR 15.5 billion1
Diversified shareholder base1
Mesk Holding Company 12.0%
GOSI 10.9%
Abdullah Alrabiea 8.7%
A.Q. Al Muhaidib & Sons 8.5%
Others 59.9%
Among the top diversified conglomerates in Saudi Arabia
Note: 1. As at 25 January 2012
4

1979 1985 1990 1991 1995 1998 1999 2000 2002 2003 2005 2007 2008 2009 2010
History – Key stages of development
Entry into retail sector through merger with Azizia Panda
Formed Kinan in 2005 and disposed 70% stake in 2006 Acquired oil business in Iran in 2004
Acquisition of Giant and Géant by Panda Acquisition of Yudum in Turkey
Entered sugar refining business
One of the top food, retail and plastics packaging Companies in the region
1990
1991
1997
1998
2004 - 07
2008 - 09
Started Jeddah plastics factory Acquired 40% stake in Almarai
Obtained 70% of the Saudi edible oil market
Today
1979 Established in 1979 with paid up capital of SR 40m
5
Acquired Pasta business in Egypt 2011

2011 Key achievements
6
The Group achieved record SR 1 billion net income from operations, despite:
– Increase in commodity prices, raw material supply issues
– Arab Spring
Started implementing holding company structure (Project Focus)
Savola ranked No. 1 in KSA and No. 2 in the Arab World in corporate governance and
transparency, as per S&P and Hawkamah Institute
Divestment of non-core investments
Successful addition of new line of business in Foods (i.e. Pasta)
Repatriation of dividends from Iran (c. 30% of investment)
Trained and employed 135 special needs people in the Group companies

2011 Key achievements
7
• SFC net income more than doubled to SAR 490 million in 2011 despite Arab spring, Iran sanctions and FX devaluation
• Although, volume growth was moderate (1%), Arabia oil still achieved strong growth (11%)
• International start-up operations including Sudan and Algeria delivered excellent profits
• Acquired Pasta company in Egypt • Launch of Sweeva (sweetener) in KSA
Foods
Retail
• 2011 Net profit increased almost threefold to SAR 200 million
• Sales growth of SR 850 million (+12%)
• 11 new store openings
• Awarded “Asia’s Best Brand Award” for excellence in branding and marketing
• Awarded GCC “Best Training Strategy” • First Shariah compliant co-branded grocery
retail credit card in KSA (SAMBA) • Prince Naif Saudization Award
• Despite an increase in raw material prices, SPS has been able to achieve a healthy margin
• 6% to 7% growth rate of local plastic packaging
Plastics packaging
• Named as one of the top 3 converters in the ME region (SABIC)
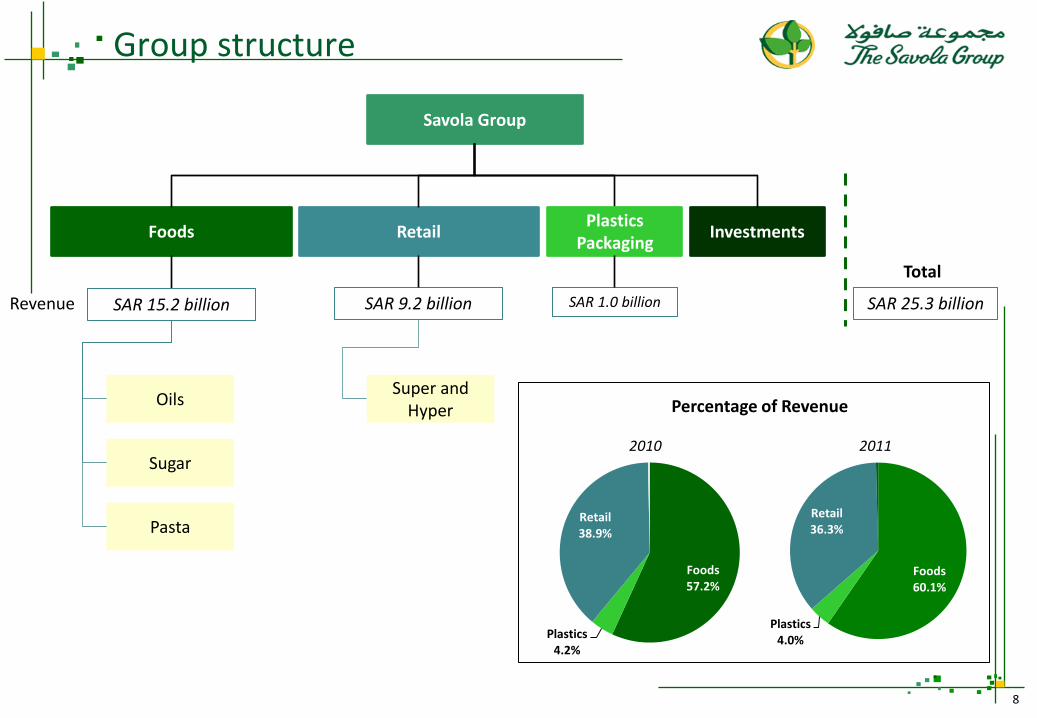
Group structure
Foods
Oils
Sugar
Pasta
Retail
Super and Hyper
Investments
Savola Group
Plastics Packaging
SAR 15.2 billion SAR 9.2 billion SAR 1.0 billion SAR 25.3 billion
Total
Revenue
8
Foods 60.1%
Plastics 4.0%
Retail 36.3%
Foods 57.2%
Plastics 4.2%
Retail 38.9%
2010 2011
Percentage of Revenue

• Established in 1979
• Manufacturing facilities in 8 countries
• Exports to 30 countries with strong marketing and distribution capabilities primarily in the GCC, CIS and African regions
• Top brands such as Afia, Arabi, Rawaby, Ladan, Yudum
• Production capacity of over 1.5 million MT pa
• Internationally recognized production and quality awards including ISO 9002 and MRP2
Afia nominated top
brand of the Arab world
by Forbes magazine
Overview
Foods - Oil
Current markets
Strong presence in all the markets that Savola is operating in
Key markets Capacity Market share
Saudi Arabia 416,000 60%
Egypt 352,000 41%
Iran 832,000 39%
Algeria 192,000 33%
Kazakhstan 64,000 26%
Morocco 96,000 10%
Sudan 96,000 33%
Turkey 96,000 15%
Turkey
Saudi Arabia
Iran
Egypt Morocco
Sudan
Algeria
Kazakhstan
9

• Established in 1997
• Strategic partnership with Tate and Lyle, England
• Raw Cane Refineries in Saudi and Egypt
• Exports to Sudan, East Africa, Levant, GCC, Sudan and Yemen
• Top brands such as Al Osra, Ziadah, Safa
• Current refining capacity of 2.0 million MT pa
• Under construction Egypt - 0.18 million MT pa (beet)
1 Ranked amongst the top three buyers of raw sugar
2 Jeddah is in top three refineries in the world
Accolades and Awards
Overview
Foods – Sugar
Current markets
Ranked amongst the top three sugar refineries in the world
Saudi Arabia
Egypt
Key markets Capacity
Saudi Arabia (Jeddah) 1.25 million
Egypt - Cane 0.75 million
Egypt – Beet (under construction)
0.18 million
10

• Established in 1995 and was 100% acquired by Savola with a transaction value of around SAR 448 million (EGP 715 million)
• Owns 2 factories with total capacity of around 124,000 MT pa
• The company is the largest pasta manufacturer in Egypt with 30% market share (out of audited branded market)
• Total of 6 brands including Al Maleka, which is the largest brand
Overview
Foods – Pasta
Current markets
One of the largest pasta producers in the region
Egypt
Key markets Capacity Market share
Egypt 124,000 30%
11

• Operates in two formats
• Supermarkets [1,800m2 ~2,500m2]
• Hypermarkets [7,000m2 ~12,000m2]
• Established in 1998; acquired by Savola in 1998, to represent the retail arm of the Group
• Widespread branch network of 90 supermarkets and 41 hypermarkets in Saudi
• Total selling area of around 462,000 m2
• Expansion plans are to operate 140 Supermarkets and 60 Hypermarkets by 2015 in Saudi Arabia
Accolades and Awards
Overview
Retail
Current markets
United Arab Emirates
Saudi Arabia
Lebanon Distribution Center
Largest retailer in Saudi Arabia in terms of sales and selling area
12
1 Asia’s Best Employer Brand Award 2011
2 Prince Naif Saudization Award
3 2nd CMO Asia award for Excellence in Branding & Marketing
4 Best Training Strategy in GCC Award

• Established in 1980
• 4 manufacturing facilities in Saudi Arabia and 2 in Egypt
• Exports to 15 countries worldwide
• Product range comprises of film, packaging materials, bottles, closures, pre-forms, industrial containers and crates
• Production capacity of 140k MT pa
1 King Abdulaziz Quality Award
2 MRPII Class A
3 ISO 9001
4 HACCP
Accolades and Awards
Overview
Plastics Packaging
Current markets
One of the leading regional plastic packaging companies
Saudi Arabia
Egypt
Key markets Capacity (MT pa)
SPS (Riyadh and Jeddah) 82,500
Al Sharq (Riyadh) 36,300
New Marina (Egypt) 23,700
13

STRATEGY AND GROWTH Where we want to go, and how we will get there
14

Holding structure
Total capital expenditure of around SAR 700 million in 2009
Focused Growth
Entering new businesses
Moving away from non-core investments
Profitability enhancement and cost rationalization
Mergers & Acquisitions
Organic expansion
+
Autonomy and Accountability
Governance system
Human resources
Management structures
OpCos to be managed independently
+
Increase shareholders’ value
15

Corporate structure evolution
Total capital expenditure of around SAR 700 million in 2009 Aspiration to transform the Group into a Financial Holding Company
16
Op
Co
Au
ton
om
y
Low
M
ediu
m
Hig
h
Time Past Model Target Model Savola’s Current Model
The Savola Group Corporate Structure Evolution
Active Management Company
Holding company monitoring closely and guiding operating companies, with involvement in operational and strategic decisions
Strategic Management Company
Holding company providing strategic guidance with no operational decision making
Financial Holding Company
Independent operating companies, with holding company focused on performance of the portfolio

New operating model
17
Foods Board
Retail Board
Plastics Board
Almarai Board
Herfy Board
Kinan Board
Other Boards
Core Businesses (OpCo) Active Investments
CEO
Other Investments
CEO CEO CEO CEO CEO CEOs
Po
rtfo
lio B
usi
nes
s Le
vel
Gro
up
Lev
el
Ho
ldin
g
Leve
l
Board of OpCo’s (7 members) to be formed as follows: Group board members (4), shareholder representative
(1) and independent subject matter experts (2)
The Savola Group CEO
CSR Committee
Investment Committee
The Savola Group Board of Directors
Audit Committee
Risk Committee
CNCG Committee
No reporting lines between portfolio businesses and Group
holding
OpCo’s to set up statutory committees as per CMA best practices

Savola Foods – a regional leader
• Large player
• Business expertise – B2B, B2C, Exports, Value addition
• Distribution network
• Repeatable success formula
• Branding power
• Operations excellence
• Logistics infrastructure
• Scale of buying
• Market and consumer knowledge
• Inspiring culture
18
1979 1981 1995 2000 2004 2005 2007 2008 2009
10.2 Bn
2.3 Bn
0.97 Bn
4.4 Bn
5.9 Bn 7.6 Bn
1.0 Bn
SF History and Sales Evolution (SAR)
1998
Revenues almost doubled with the acquisition of the 2 largest oil companies in Iran
Yudum acquisition in Turkey
Sime Oils merger in Egypt
12.0 Bn
2010 2011
15.2 Bn
Pasta acquisition in Egypt

Savola Foods - Strategic direction
Strategic Direction
Description
Focus on markets that contribute the most to Savola’s profits
De-prioritize markets where Savola has formidable challenges and cannot easily build capabilities to overcome them
Leverage strong market position in Arabia, Egypt and Iran for new categories
Rationale
Achieve business sustainability through portfolio diversification instead of upstream integration
Restrict geographies to manage complexity of broader portfolio
Consumer Cooking / Baking Experience
Ready-to-Eat Condiments Ready-to-Cook Ingredients
Cooking / Baking
Edible oil
Sugar
Pasta
Rice
Mayonnaise
Sauces
Exam
ple
C
ateg
ori
es
Savola currently plays in ingredients
Ready-to-cook and condiments are immediate adjacencies
Ready-to-eat is a relevant space for
Almarai
Portfolio diversification play with focused geographic footprint
19

Savola Foods - Future roadmap
Strategic Guidelines
Ensure dominance and sustain stable long-term growth
Launch value added B2B and B2C oil products
Maximize B2B potential by developing value added products
Leverage USCE volume predominantly for exports
Partner with global player for large scale beet play
Arabia
Egypt
Iran
Arabia
Egypt Sugar
Oil Established Markets
Entered pasta business in Egypt
Enter other ingredient and ready-to-cook categories
Create a powerhouse which will provide an attractive partner to global companies
Arabia
Egypt
Iran
New Categories
Turkey
Sudan
Kazakhstan
Morocco
Manage in a separate portfolio and P&L
Evaluating various options to improve position in these markets
Algeria
Continue to focus on growth
Manage with the core markets as the business requires operational management and expertise Oil
Value Creation Markets
20

Savola Foods - Future roadmap
A total profit pool of over SR 13 billion in rice, pasta, spices and flour in core markets
Category Prioritization 2015 Profit Pool vs. Coherence with Savola
Iran Egypt Arabia
Coherence with Savola low high
Herbs & spices
Pasta Tea
Pulses
Herbs & spices
0
Canned beans Canned vegetables
Pasta
Tea
Coffee
Rice
2015 Profit Pool (SR Mn)
500
4,500
2,000
1,500
1,000
4 3 2
Pulses
Flour
Rice
Rice
Canned beans
Pasta
Tea Pulses
Flour
De-prioritized categories
Prime Opportunities
21

• Largest and fastest growing retailer in the country
• Well established brand name with equity in produce, trust and value for money
• Indigenous brand, sensitive to local customs and culture
• Modern supply chain infrastructure
• High geographical penetration; the only national player operating in multiple formats
• High level of localization; well above statutory requirements
Panda – a regional giant
2,740
3,812
5,576
7,266
8,183
9,197
(25) (19) 36
85
127
200
2006 2007 2008 2009 2010 2011
Strong growth in sales (SAR millions)
Sales Adjusted Net Income
27% CAGR
Acquisition of Giant stores Acquisition of Géant
Excluding one off provision
Excluding extraordinary expenses
22
55 63 98 114 125 132
No. of stores
Note: Number of stores excludes Lebanon

Under penetrated grocery retail market
• The Saudi grocery market is witnessing strong growth which is expected to continue
• Within the grocery market, super and hypermarkets are gaining market share
• In spite of strong growth, super and hypermarkets are still underpenetrated, compared to other markets globally
• Apart from strong organic growth potential, there is room for acquisition growth, given the highly fragmented nature of the Saudi market
Enormous room to grow in the local market
23
72 79 88
123
2008 2009 2010 2015F
Growing Grocery retail market in Saudi [SR b]
12% 15%
19%
25% 25% 25%
2006 2010E 2015F
Super/Hypermarkets gaining market share
Hypermarkets Supermarkets
15%
33%
59%
Saudi Brazil United Kingdom
The Saudi market is highly fragmented Share of top 5 players
16% 23%
39%
57%
25%
62%
36%
24%
Saudi Spain UnitedKingdom
UAE
Super/Hypermarkets Still Underpenetrated
Hypermarkets Supermarkets

Regional retail opportunities Market size and penetration
319
118 111 94
72 45 36
23 21 20 19 15 11 9 8 8 4
17%
0%
13%
2% 8%
2% 0% 0%
30%
7% 2%
14% 5%
24%
58%
36% 33%
Significant potential in the MENA markets
Grocery retail sales [2008] in SR b Modern grocery sales penetration
Many of the regional markets are under penetrated
24
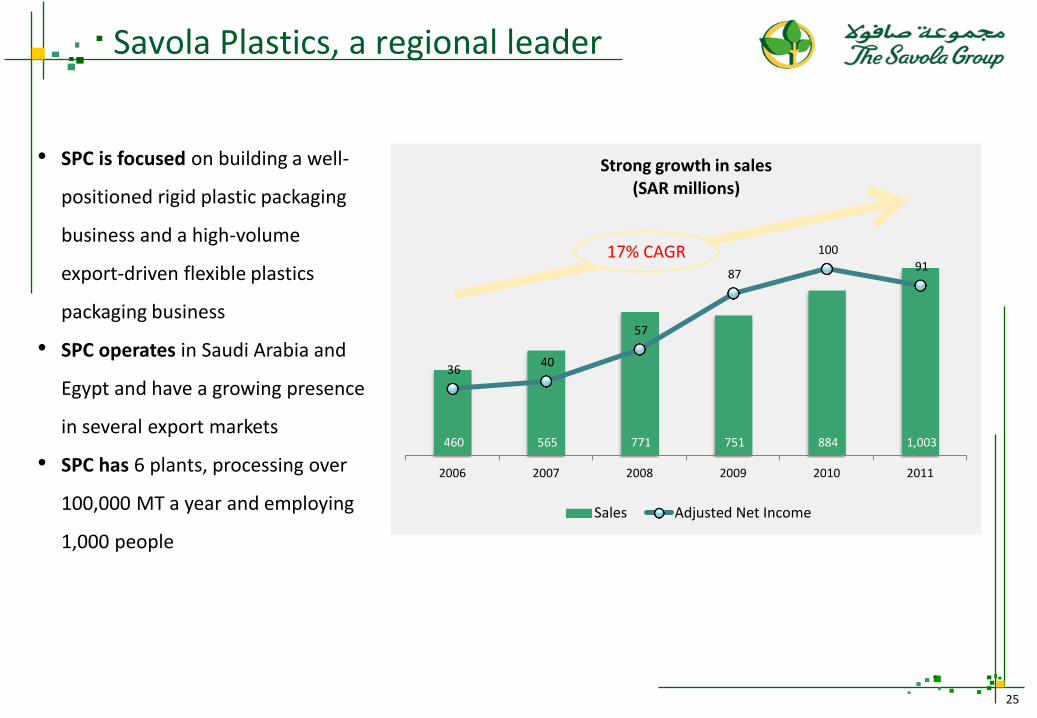
Savola Plastics, a regional leader
460 565 771 751 884 1,003
36 40
57
87
100
91
2006 2007 2008 2009 2010 2011
Strong growth in sales (SAR millions)
Sales Adjusted Net Income
• SPC is focused on building a well-
positioned rigid plastic packaging
business and a high-volume
export-driven flexible plastics
packaging business
• SPC operates in Saudi Arabia and
Egypt and have a growing presence
in several export markets
• SPC has 6 plants, processing over
100,000 MT a year and employing
1,000 people
17% CAGR
25

Savola Plastics, a regional leader
Strong Value Creation Potential
Low Resin Cost
Low
De
live
red
C
ost
Small Lead Time
Mar
ket
Dyn
amic
s
• Surplus PE and PET capacity in MEAF will give SPC an opportunity to develop stronger bargaining power
• China is 5-7% more than KSA & Egypt in terms of total delivered cost (for film)
• Lower resin and utilities cost
• Lead time from China to Western Europe 3 weeks more from KSA
• Highly fragmented market with significant growth potential
• Market growth driven by evolving consumer needs
26

Investment portfolio Strategy definition and execution
27
Total investments reduced from SAR 4.3 billion in 2009 to SAR 2.8 billion now
Investment Executed strategy
Land
Asfan - In-kind contribution to Masharef project
Yasmine Riyadh & Hanaki Jeddah
- Sold to Kinan with realized capital gain of SAR 76 million and SAR 77 million in 2011
Medina land - Agreement signed to sell to KEC with expected capital gain of SAR 231 million
Mutoun - Sale and leaseback of freehold properties with few remaining properties
Private Equity Funds (Intaj, Joussour, Swicorp)
- Ensuring to exit at the right time by maximizing returns
KEC and KAEC - Currently under lock-up period
Herfy - IPO’ed in 2010 at a P/E of around 12.5 times - Currently trading at a high P/E of above 18 times

Other investments
• Total investment portfolio reduced from SAR 4,283 million in 2009 to SAR 2,761 million in 2011 • Around 35% of the total investments have already been disposed off during 2010 and 2011
28
All numbers are in SAR millions
401
241
421
184 24
508
259
374
209 116 25 2,761
Ownership % 49% 11.4% 2.4% 5% 30% 30% 50% 14% 15% 80% 4.67%
Land Listed
entities
Kinan or managed by Kinan
Financial Services and
Funds
Other
Book Value
FINANCIAL HIGHLIGHTS AND PROJECTIONS
What we got, and what we plan to get
29

Financial results - Snapshot
30
5,766 7,027 9,351
12,027 15,224 3,815
5,611
7,359
8,183
9,198
558
772
751
884
1,004
10,034
13,329
17,366
21,030
25,322
2007 2008 2009 2010 2011
Revenue
Foods Retail Plastics
733 673
1,378 1,451
1,789
2007 2008 2009 2010 2011
EBIT
477 496
855 933
1,074
2007 2008 2009 2010 2011
Income from operations
All numbers are in SAR millions
60
70
80
90
100
110
120
130
140
150
160
Share price
Tadawul All Share Index Herfy Almarai Savola

9,312
5,861 51
9,197 1,004
(103)
25,322
37% 23% 0%
36% 4% 0%
100%
Oil Sugar Pasta Retail Packaging Others Total
Revenue - 2011
7,004
5,023 0
8,183 884
(64)
21,029
33% 24% 0%
39% 4% 0% 100%
Revenue - 2010
Revenue Percentage of total revenue
Financial results - Revenue
Others includes HQ costs and eliminations Revenue
growth of around 20% contributed by all core
sectors
31
All numbers are in SAR millions
Note: Pasta acquisition done in Q4 2011

Financial results - Profitability
Adjusted profit
growth of around 17%
32
105
129 0 66
100 7
382 61 36 887
241
(195)
933
12% 15% 0% 7% 11% 1% 43%
7% 4%
100% Net Profits - 2010
Net Profit Percentage of total profit
Impairment of SAR 165 million Net operating profit of SAR 270 million
Net of capital gain from Herfy IPO of SAR 195 million
303 179 7
200
91
(19)
340
72 30
1,202 24
(153)
1,074
25% 15% 1% 17% 8% 2% 28% 6% 3%
100% Net Profits - 2011
All numbers are in SAR millions
Note: Pasta acquisition completed in Q4 2011

Income statement by segments
33
Full year
Note: Pasta acquisition completed in Q4 2011
(all figures are in SAR millions)
Revenue Gross Profit EBIT Net Income EBITDA Revenue Gross Profit EBIT Net Income EBITDA
Food
Oil-Mature Markets 7,958 1,065 584 225 673 6,014 1,033 628 147 705
Oil-Start-up Markets* 1,354 234 109 78 136 989 124 (23) (41) 11
Total Oil 9,312 1,299 694 303 809 7,004 1,158 605 105 716
Sugar 5,861 451 327 179 417 5,023 342 216 129 309
Pasta 51 11 8 7 8 0 0 0 0 0
Total Foods 15,224 1,762 1,028 489 1,234 12,027 1,499 821 234 1,025
Retail
KSA 8,576 1,928 214 190 465 7,590 1,617 98 60 335
Gulf 622 125 13 10 18 592 107 8 7 14
Total Retail 9,197 2,053 228 200 483 8,183 1,724 107 66 349
Packaging 1,004 146 99 91 153 884 156 118 100 174
Real Estate 0 0 30 30 30 0 0 36 36 36
Franchising 47 30 7 6 9 44 26 (1) (2) 2
Herfy 0 0 72 72 72 0 0 61 256 61
Al Marai-Savola Share 0 0 340 340 340 0 0 382 382 382
HQ/Elimination/Impairments (150) (18) (14) (25) 14 (108) 9 (25) (187) (1)
Total 25,322 3,973 1,789 1,202 2,334 21,029 3,415 1,499 887 2,028
Adjustments
Impairments 24 241
Capital gains (153) (195)
Adjusted Profit 1,074 933
* Start-up markets include Algeria, Morocco and Sudan
Segment Wise Financials
December 2011 December 2010

Less reliance on non-managed businesses
34
The reliance on non-managed businesses has reduced over time
99
102
494
367
702
1,131
100
458
520
500
2007
2008
2009
2010
2011
Managed
Non Managed
Non Managed business include share of profits from Al Marai, Herfy, Kinan, capital gains, impairments and non-
core investments
42% 58%
8% 92%
41% 59%
52% 48%
50% 50%
All numbers are in SAR millions

Diminished reliance on capital gains
488 477 496
855 933 1,074
1,212
660 753
-294
97
-46
129
2006 2007 2008 2009 2010 2011 2012P
Income from Core operations Capital gains - net
Projected net profit excluding capital gains
SAR millions
35

OUR INTELLECTUAL ASSETS Its all about people, people, people
36
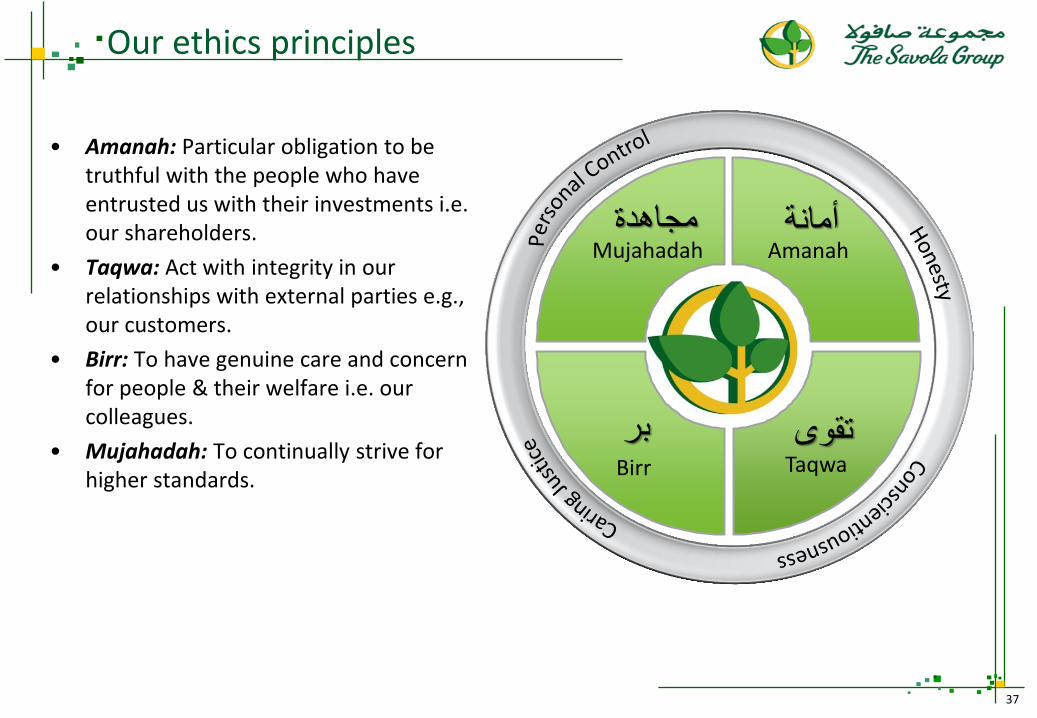
Our ethics principles
• Amanah: Particular obligation to be truthful with the people who have entrusted us with their investments i.e. our shareholders.
• Taqwa: Act with integrity in our relationships with external parties e.g., our customers.
• Birr: To have genuine care and concern for people & their welfare i.e. our colleagues.
• Mujahadah: To continually strive for higher standards.
37
أمانة
بر تقوى
مجاهدةMujahadah Amanah
Taqwa Birr

Our values framework
• Tawado: Viewing achievements without arrogance.
• Iq’tida: Accepting that we are continually learning.
• Azm: Being persistent, even in the face of adversity.
• It’qan: Maintaining high standards and striving for continuous improvement.
• Ihsan Al-Dhan: Having a trusting nature.
• Qabool: Accepting other people.
• Iq’bal: Striving to maintain strong, two-way relationships.
• Mu’azarah: Bonding with other people, particularly our team members.
38
Tawado
Iq’tid
a
Azm
It’q
an
1
2
3
4
Ihsan Al-Dhan
Iq’bal
Qab
oo
l Mu
’aza
rah

Savola’s balanced way
• We will continue to adhere to our ethics and values framework
• We will ensure that we build a live, inspiring model of our ethics and values for the future generations of Savola
• We will continue to maintain good and sincere intentions
39
Birr (Fairness)
Amanah (Honesty)
Taqwa (Empathy)
Shareholder
Community Employee
Mujahadah (Personal Control)

Recognition for the Groups intangible assets
• Savola Group has been ranked No. 2 among
Arab World public listed companies in
Corporate Governance and Transparency
based on the new index launched by
Standard & Poor’s and Hawkamah Institute
and funded by IFC. The ranking is based on
Environmental, social and Corporate
Governance (ESG) issues.
• Savola winning Transparency Award among
Saudi publicly listed companies (BMG)
• Savola winning Best Workplace Practices
Award (IIR)
• Panda ranked as one of the top 10 big
companies to receive Best Work
Environment Award for 2008
• The Saudi Public Company Award in CSR
(IIR)
40

We are a responsible corporate citizen
41
41

THANK YOU
42
This Presentation (“Presentation”), dated February 2012, has been prepared by Savola Group (“Savola’’), and is based on the business plan and related information of Savola Group (“Savola” or the “Company”). The Presentation does not constitute or form part of and should not be construed as, an offer to sell or issue or the solicitation of an offer to buy or acquire securities of the Company or any of its subsidiaries in any jurisdiction or an inducement to enter into investment activity.
The information contained in this Presentation is selective and does not include a description of any risks. It does not purport to contain all the information that the recipients of this Presentation may require and is subject to updating, expansion, revision and amendment. At the Company’s discretion, additional information about the Company will be provided to the recipients, which they may request as provided herein.
This Presentation is not a prospectus and does not constitute or form any part of any offer of securities or recommendation to subscribe for, invitation to offer, underwrite or purchase securities; nor shall it, or any part of it, be relied upon in any way in connection with any contract for the acquisition of shares in the capital of the Company. Any interested party (including the recipients) should not rely on or should not be induced to enter any agreement by any representations or warranty set out herein or otherwise.
Neither Savola, nor affiliated partnerships or corporate bodies, nor the directors, shareholders, managers, partners, employees, advisors or agents of any of them (together being referred to as “the Relevant Parties”), make any representation or provide any warranty, expressed or implied, as to the accuracy, reasonableness or completeness of the information contained in this Presentation. All Relevant Parties expressly disclaim any and all liability for, or based on or relating to any such information, including, without limitation, any information contained in, or errors in or omissions from, the Presentation or based on or relating to the recipients’ use of the Presentation.
The distribution of this document in other jurisdictions might be restricted by law, and persons into whose possession this document comes should inform themselves about, and observe, any such restrictions.
This Presentation contains certain forward-looking statements, including assumptions, opinions and views of the Company or cited from third party sources. Various known and unknown risks, uncertainties and other factors could cause the actual results, financial position, development or performance of the Company to differ materially from the estimations expressed or implied herein. The Company does not guarantee that the assumptions underlying such forward looking statements are free from errors nor do they accept any responsibility for the future accuracy of the opinions expressed in this Presentation or the actual occurrence of the forecasted developments. These forward-looking statements speak only as at the date of this Presentation. This Presentation is as of February 2012. Neither the delivery of this Presentation nor any further discussions of the Company with any of the recipients shall, under any circumstances, create any implication that there has been no change in the affairs of the Company since such date.
Disclaimer
43