investor’s meet june’16
TRANSCRIPT

Investor’s Meet
June’16
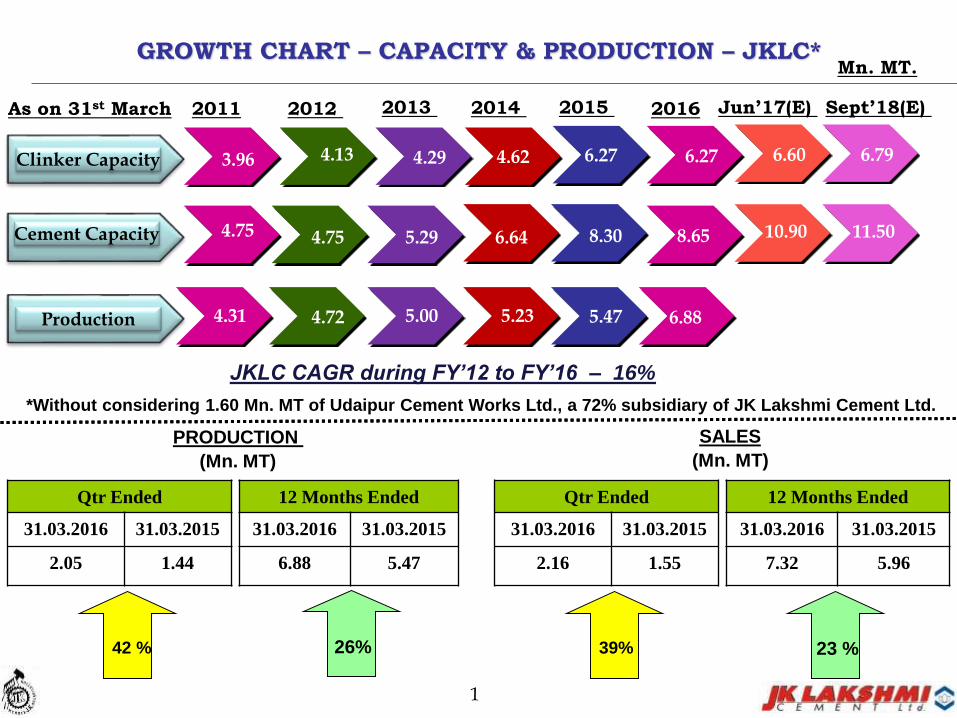
GROWTH CHART – CAPACITY & PRODUCTION – JKLC*
1
Mn. MT.
2011 2012
Clinker Capacity
Cement Capacity
Production
2013 2014 2015
JKLC CAGR during FY’12 to FY’16 – 16%
2016
4.75 4.75 5.29
4.31 4.72 5.00 5.23
3.96 4.13 4.29 4.62
6.64
6.27
8.30
6.27
8.65
*Without considering 1.60 Mn. MT of Udaipur Cement Works Ltd., a 72% subsidiary of JK Lakshmi Cement Ltd.
5.47
Jun’17(E)
6.60
10.90
As on 31st March
PRODUCTION
(Mn. MT)
SALES
(Mn. MT)
Qtr Ended
31.03.2016 31.03.2015
2.05 1.44
12 Months Ended
31.03.2016 31.03.2015
6.88 5.47
Qtr Ended
31.03.2016 31.03.2015
2.16 1.55
12 Months Ended
31.03.2016 31.03.2015
7.32 5.96
42 % 39% 23 %26%
6.88
Sept’18(E)
6.79
11.50
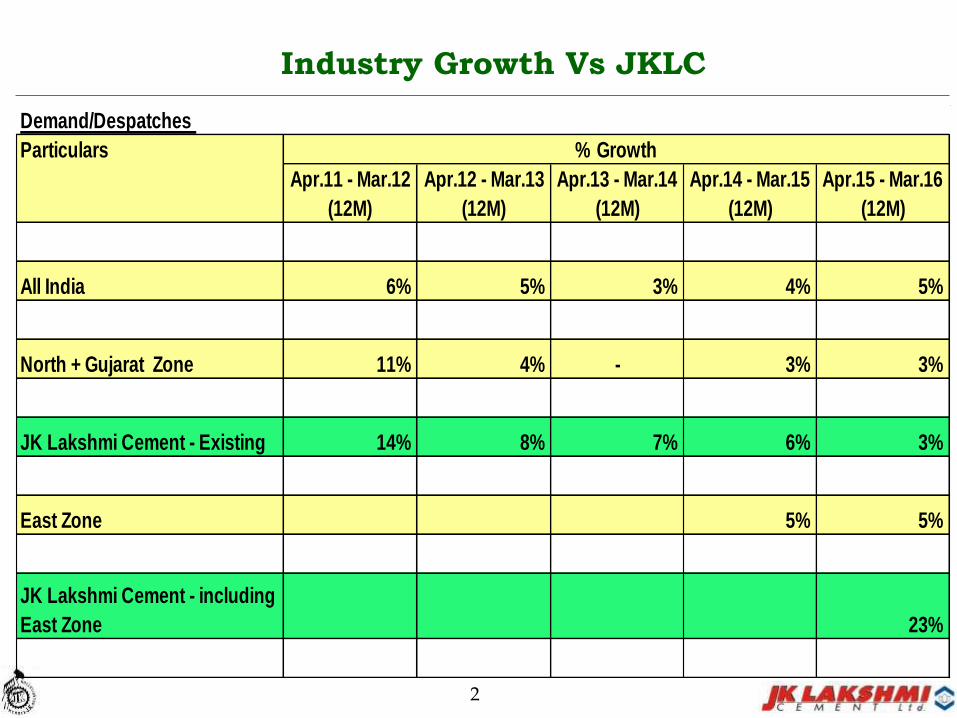
Industry Growth Vs JKLC
2
Demand/Despatches
Particulars
Apr.11 - Mar.12 Apr.12 - Mar.13 Apr.13 - Mar.14 Apr.14 - Mar.15 Apr.15 - Mar.16
(12M) (12M) (12M) (12M) (12M)
All India 6% 5% 3% 4% 5%
North + Gujarat Zone 11% 4% - 3% 3%
JK Lakshmi Cement - Existing 14% 8% 7% 6% 3%
East Zone 5% 5%
JK Lakshmi Cement - including
East Zone 23%
% Growth
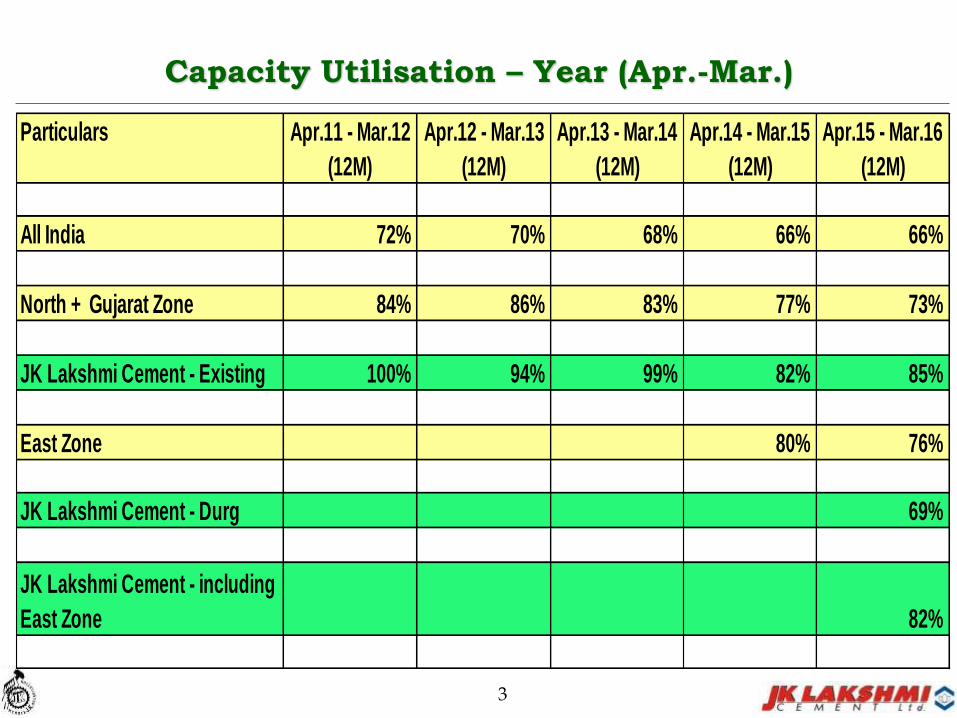
Capacity Utilisation – Year (Apr.-Mar.)
3
Particulars Apr.11 - Mar.12 Apr.12 - Mar.13 Apr.13 - Mar.14 Apr.14 - Mar.15 Apr.15 - Mar.16
(12M) (12M) (12M) (12M) (12M)
All India 72% 70% 68% 66% 66%
North + Gujarat Zone 84% 86% 83% 77% 73%
JK Lakshmi Cement - Existing 100% 94% 99% 82% 85%
East Zone 80% 76%
JK Lakshmi Cement - Durg 69%
JK Lakshmi Cement - including
East Zone 82%
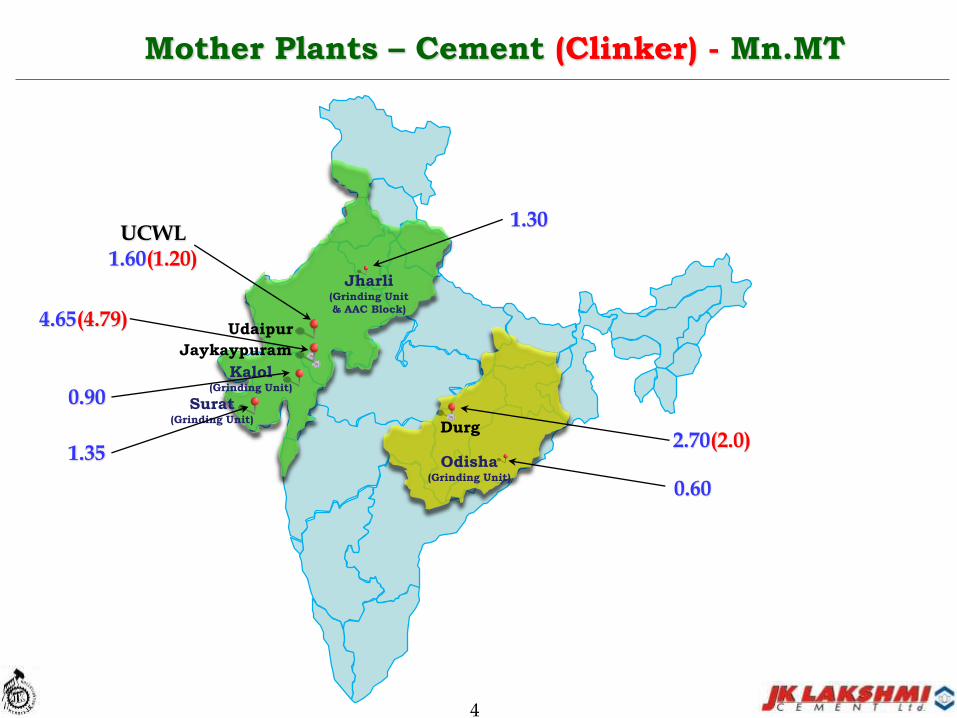
Jaykaypuram
Durg
Kalol(Grinding Unit)
Jharli(Grinding Unit
& AAC Block)
Odisha(Grinding Unit)
Mother Plants – Cement (Clinker) - Mn.MT
4
Udaipur
Surat(Grinding Unit)
UCWL1.60(1.20)
1.30
4.65(4.79)
0.90
1.352.70(2.0)
0.60
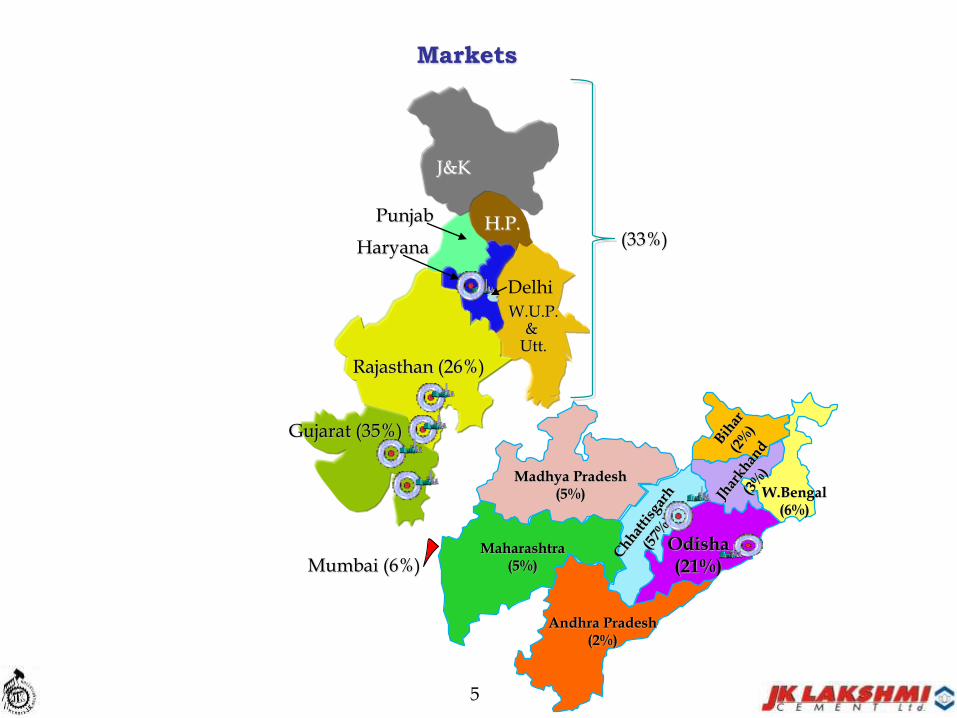
Markets
Rajasthan (26%)
Gujarat (35%)
Haryana
Delhi
Mumbai (6%)
Punjab
J&K
H.P.
W.U.P.&
Utt.
5
(33%)
Madhya Pradesh(5%)
Maharashtra(5%)
Andhra Pradesh(2%)
Odisha(21%)
W.Bengal(6%)
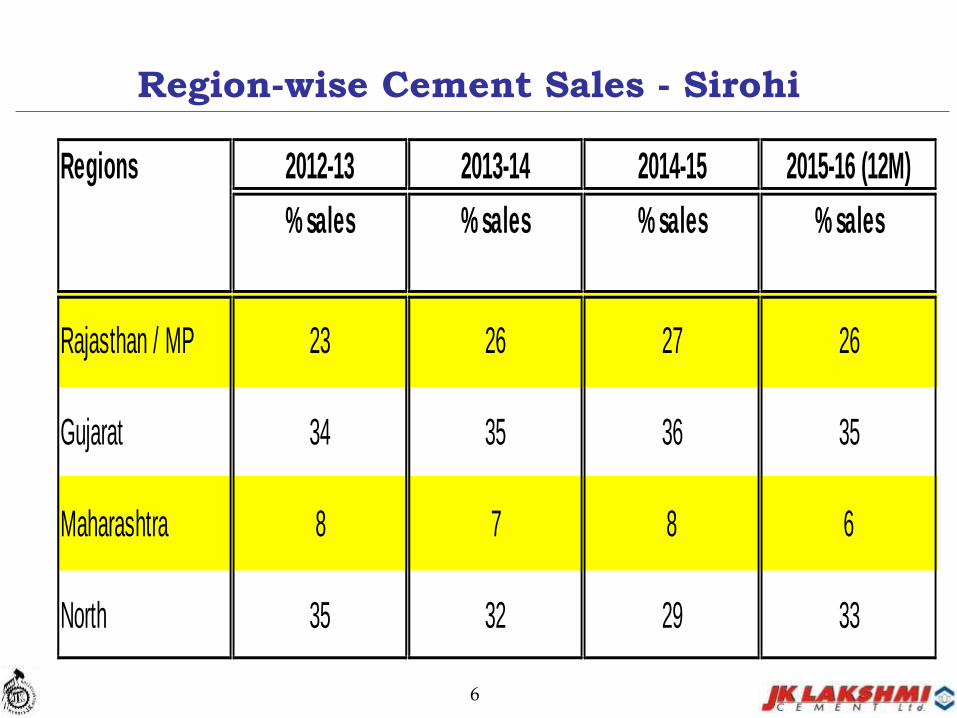
Region-wise Cement Sales - Sirohi
6
Regions 2012-13 2013-14 2014-15 2015-16 (12M)
% sales % sales % sales % sales
Rajasthan / MP 23 26 27 26
Gujarat 34 35 36 35
Maharashtra 8 7 8 6
North 35 32 29 33
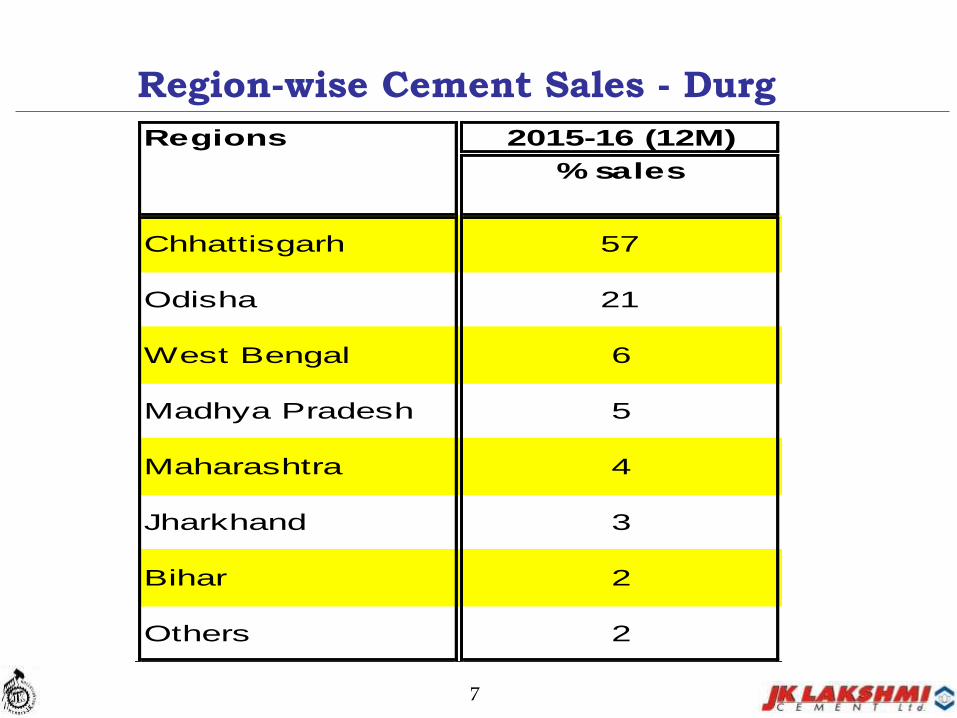
Region-wise Cement Sales - Durg
7
Regions 2015-16 (12M)
% sales
Chhattisgarh 57
Odisha 21
West Bengal 6
Madhya Pradesh 5
Maharashtra 4
Jharkhand 3
Bihar 2
Others 2

Financial Highlights – For 3 Months ended 31.03.2016
8
Sr. Particulars Unit For the IVth Qtr. ended For Twelve Months ended
No. 31.03.16 31.03.15
Figures %
1 Production (Incl. Clinker Sale) Mn. MT 2.05 1.45 0.61 42%
2 Sales Mn. MT 2.16 1.55 0.61 39%
3 Turnover Rs. Mn. 8247 6433 1814 28%
4 Net Sales Rs. Mn. 7351 5782 1569 27%
5 PBIDT (before other Income) Rs. Mn. 859 715 144 20%
6 PBIDT (after other Income) Rs. Mn. 1201 892 309 35%
7 Interest Rs. Mn. 495 256 239 94%
8 PBDT Rs. Mn. 706 637 70 11%
9 Depreciation Rs. Mn. 401 270 131 49%
10 PBT (before exceptional items) Rs. Mn. 305 367 -61 -17%
11 Exceptional Items Rs. Mn. 0 318 -318 -100%
12 PBT Rs. Mn. 305 49 256 523%
13 PAT Rs. Mn. 484 61 423 700%
14 Basic EPS (After Tax) Rs. 4.12 0.51 3.61 708%
15 OPM (On Net Sales) % 12% 12% 0%
Incr. / Decr. (-) in
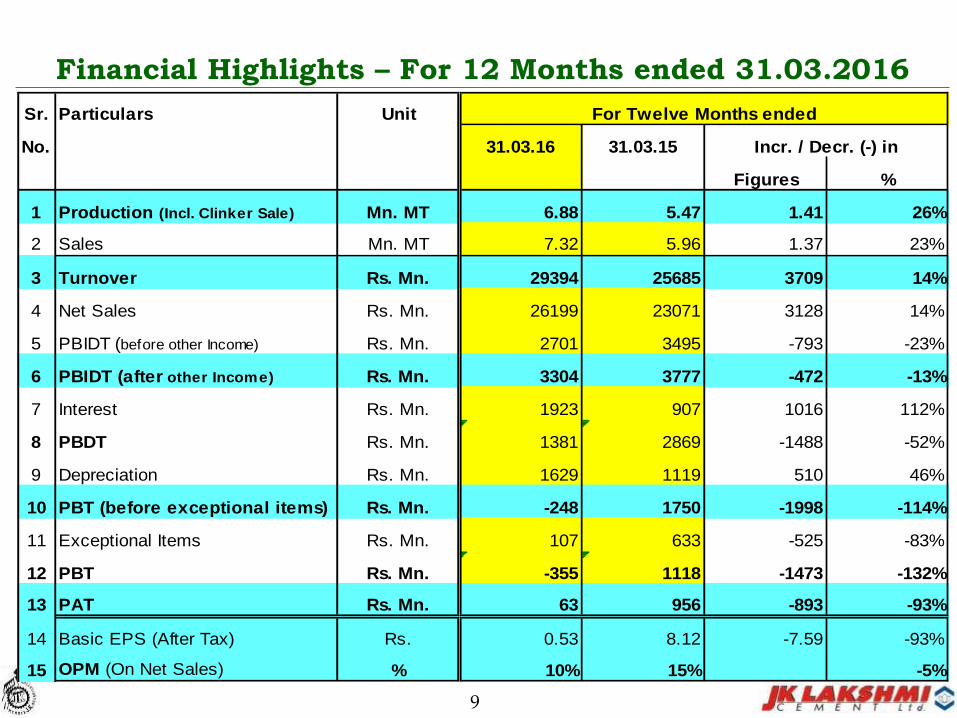
Financial Highlights – For 12 Months ended 31.03.2016
9
Sr. Particulars Unit For Twelve Months ended
No. 31.03.16 31.03.15
Figures %
1 Production (Incl. Clinker Sale) Mn. MT 6.88 5.47 1.41 26%
2 Sales Mn. MT 7.32 5.96 1.37 23%
3 Turnover Rs. Mn. 29394 25685 3709 14%
4 Net Sales Rs. Mn. 26199 23071 3128 14%
5 PBIDT (before other Income) Rs. Mn. 2701 3495 -793 -23%
6 PBIDT (after other Income) Rs. Mn. 3304 3777 -472 -13%
7 Interest Rs. Mn. 1923 907 1016 112%
8 PBDT Rs. Mn. 1381 2869 -1488 -52%
9 Depreciation Rs. Mn. 1629 1119 510 46%
10 PBT (before exceptional items) Rs. Mn. -248 1750 -1998 -114%
11 Exceptional Items Rs. Mn. 107 633 -525 -83%
12 PBT Rs. Mn. -355 1118 -1473 -132%
13 PAT Rs. Mn. 63 956 -893 -93%
14 Basic EPS (After Tax) Rs. 0.53 8.12 -7.59 -93%
15 OPM (On Net Sales) % 10% 15% -5%
Incr. / Decr. (-) in
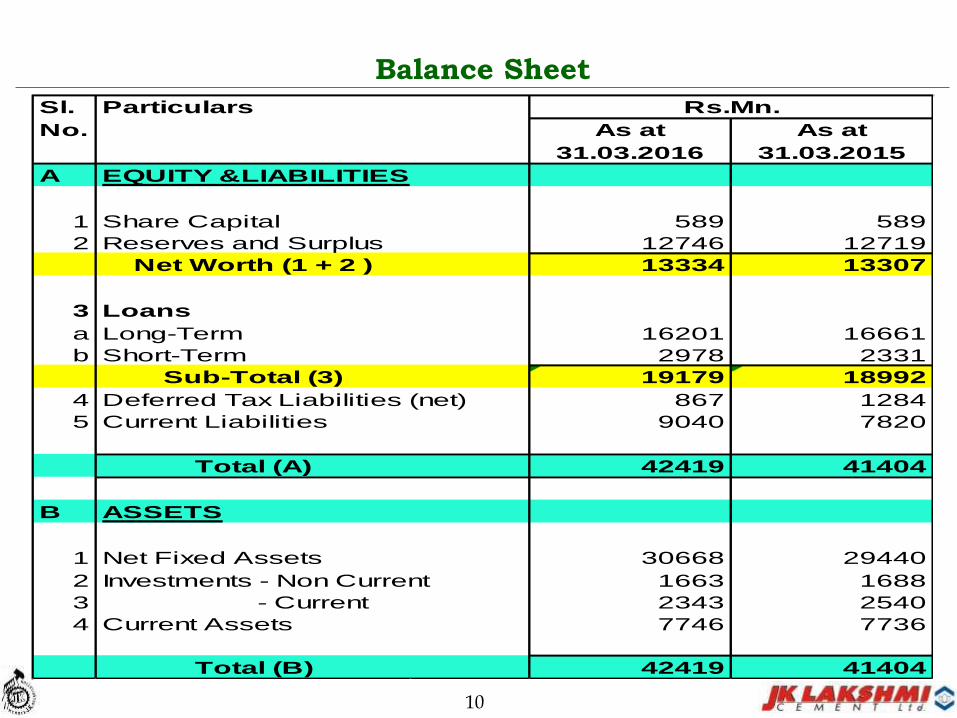
Balance Sheet
10
Sl. Particulars Rs.Mn.
No.
A EQUITY &LIABILITIES
1 Share Capital 589 589
2 Reserves and Surplus 12746 12719
Net Worth (1 + 2 ) 13334 13307
3 Loans
a Long-Term 16201 16661
b Short-Term 2978 2331
Sub-Total (3) 19179 18992
4 Deferred Tax Liabilities (net) 867 1284
5 Current Liabilities 9040 7820
Total (A) 42419 41404
B ASSETS
1 Net Fixed Assets 30668 29440
2 Investments - Non Current 1663 1688
3 - Current 2343 2540
4 Current Assets 7746 7736
Total (B) 42419 41404
As at
31.03.2016
As at
31.03.2015
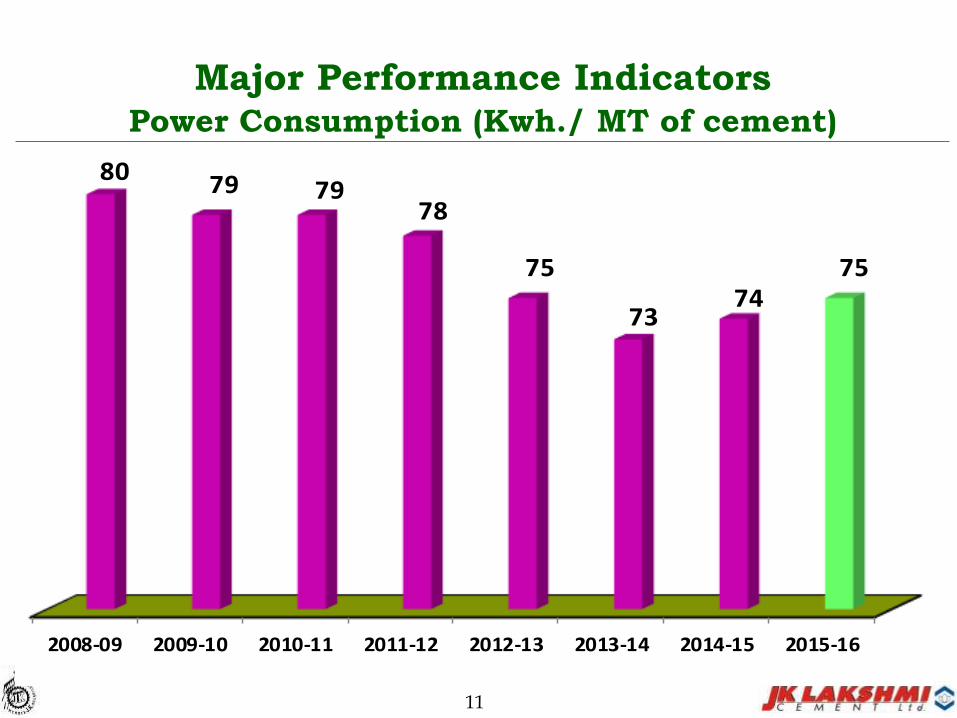
Major Performance IndicatorsPower Consumption (Kwh./ MT of cement)
11
2008-09 2009-10 2010-11 2011-12 2012-13 2013-14 2014-15 2015-16
80 79 7978
75
7374
75
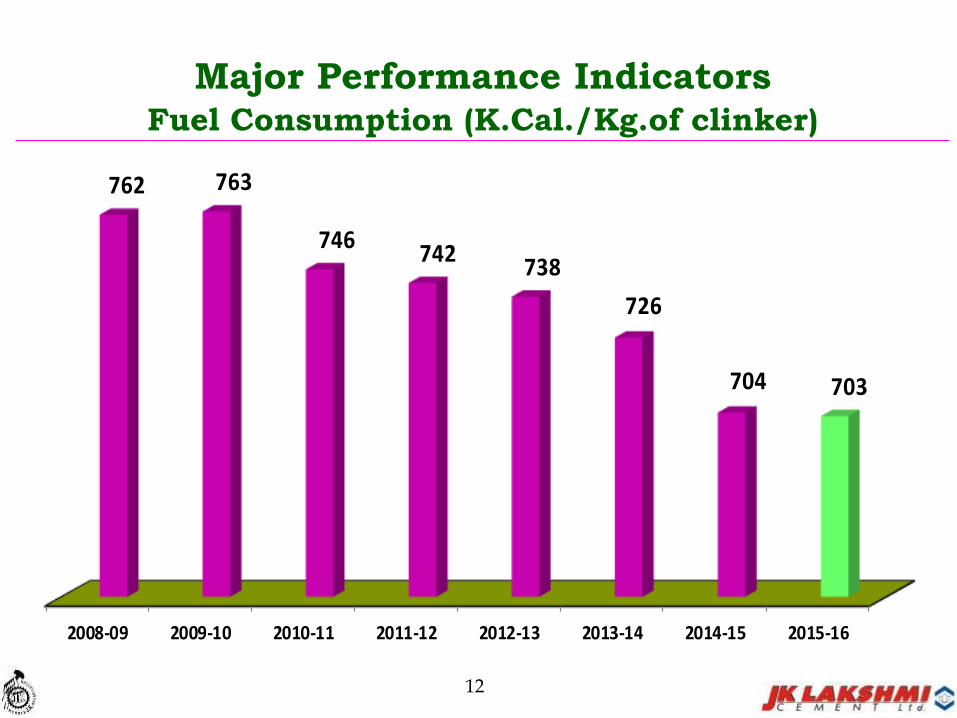
Major Performance IndicatorsFuel Consumption (K.Cal./Kg.of clinker)
12
2008-09 2009-10 2010-11 2011-12 2012-13 2013-14 2014-15 2015-16
762 763
746742
738
726
704 703

Comparative Power Consumption 2014-15
13
Kwh/MT of Cement
JKLC Shree JK Cement Ambuja ACC Ultra Tech
74 74
8480 80 79
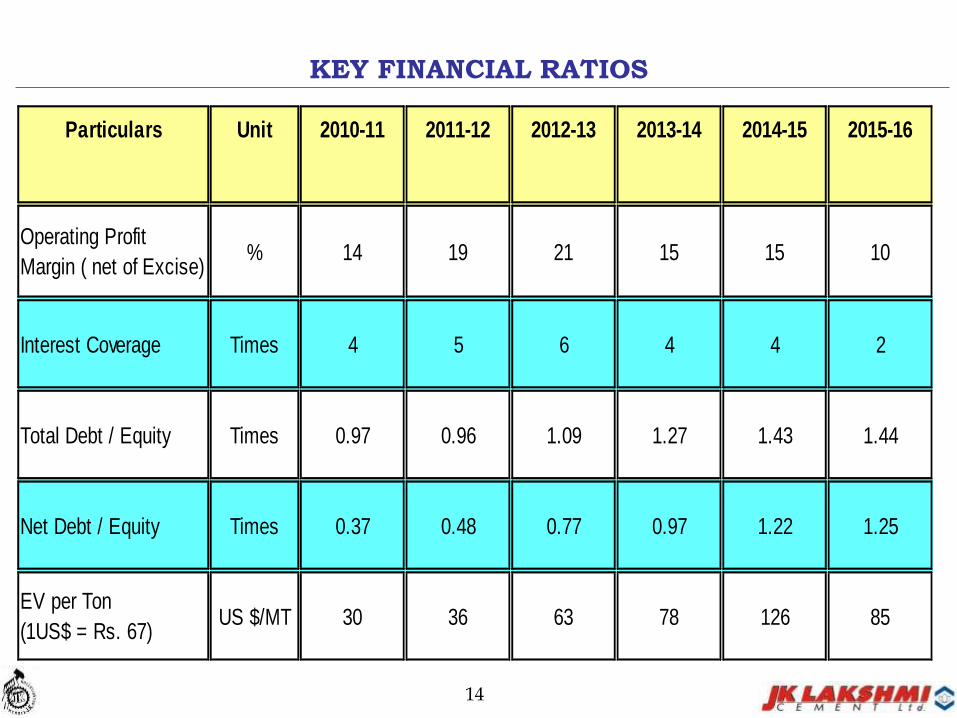
KEY FINANCIAL RATIOS
14
Particulars Unit 2010-11 2011-12 2012-13 2013-14 2014-15 2015-16
Operating Profit
Margin ( net of Excise)% 14 19 21 15 15 10
Interest Coverage Times 4 5 6 4 4 2
Total Debt / Equity Times 0.97 0.96 1.09 1.27 1.43 1.44
Net Debt / Equity Times 0.37 0.48 0.77 0.97 1.22 1.25
EV per Ton
(1US$ = Rs. 67)US $/MT 30 36 63 78 126 85
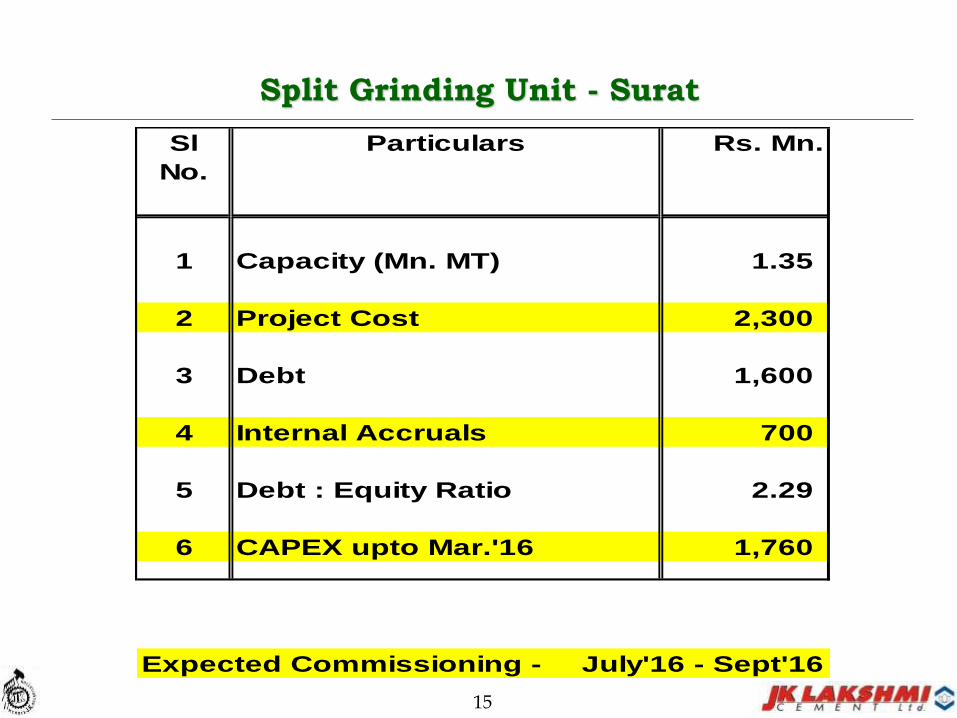
Split Grinding Unit - Surat
15
Sl
No.
Particulars Rs. Mn.
1 Capacity (Mn. MT) 1.35
2 Project Cost 2,300
3 Debt 1,600
4 Internal Accruals 700
5 Debt : Equity Ratio 2.29
6 CAPEX upto Mar.'16 1,760
Expected Commissioning - July'16 - Sept'16
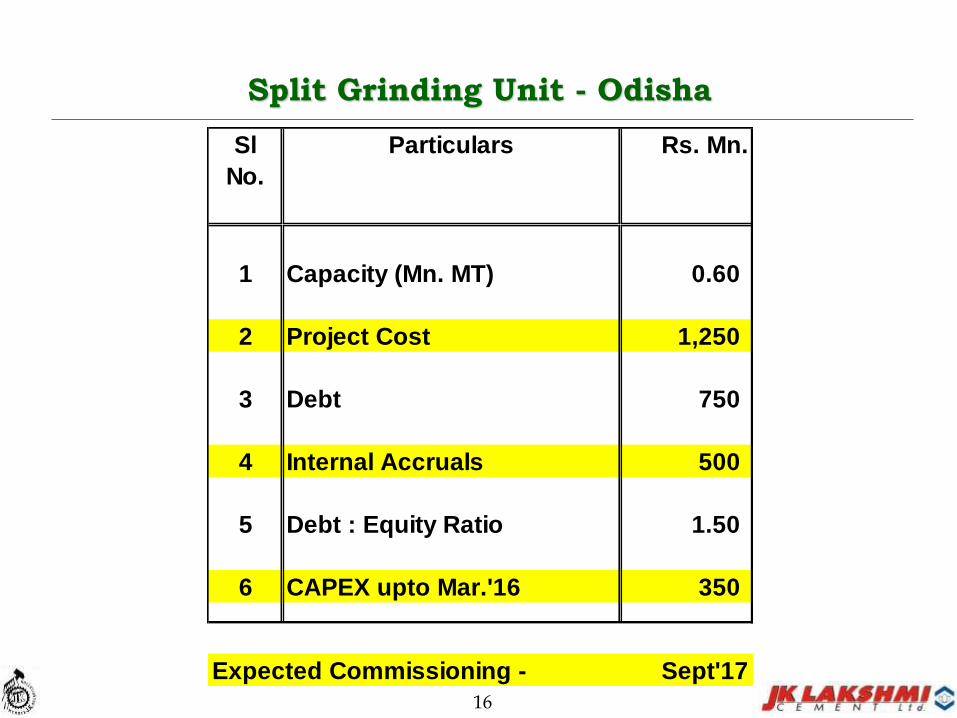
Split Grinding Unit - Odisha
16
Sl
No.
Particulars Rs. Mn.
1 Capacity (Mn. MT) 0.60
2 Project Cost 1,250
3 Debt 750
4 Internal Accruals 500
5 Debt : Equity Ratio 1.50
6 CAPEX upto Mar.'16 350
Expected Commissioning - Sept'17
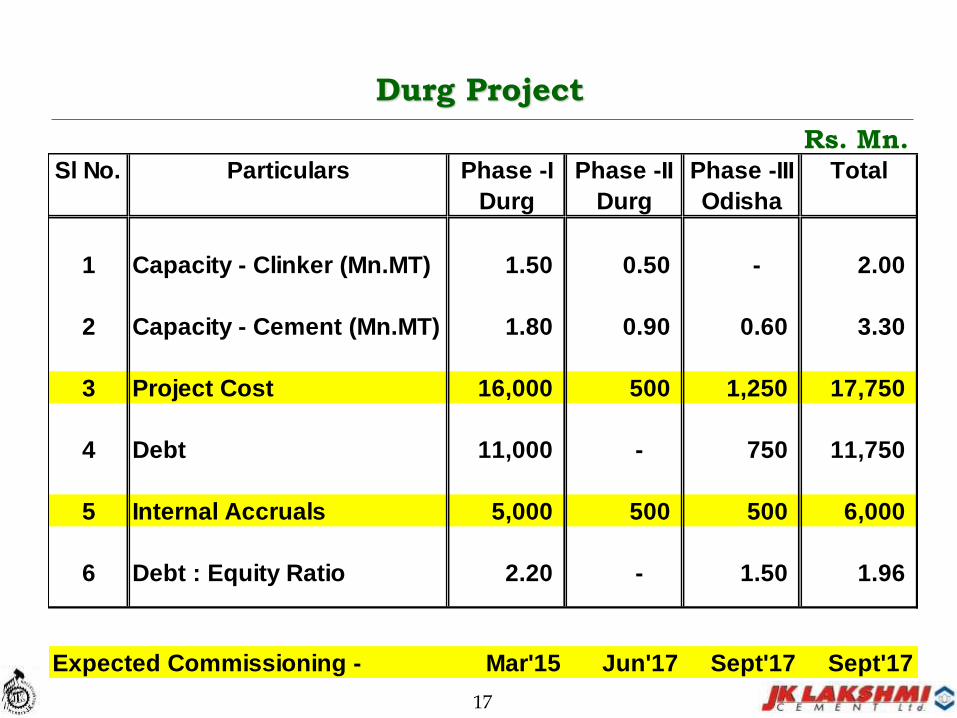
Durg Project
17
Rs. Mn.Sl No. Particulars Phase -I Phase -II Phase -III Total
Durg Durg Odisha
1 Capacity - Clinker (Mn.MT) 1.50 0.50 - 2.00
2 Capacity - Cement (Mn.MT) 1.80 0.90 0.60 3.30
3 Project Cost 16,000 500 1,250 17,750
4 Debt 11,000 - 750 11,750
5 Internal Accruals 5,000 500 500 6,000
6 Debt : Equity Ratio 2.20 - 1.50 1.96
Expected Commissioning - Mar'15 Jun'17 Sept'17 Sept'17
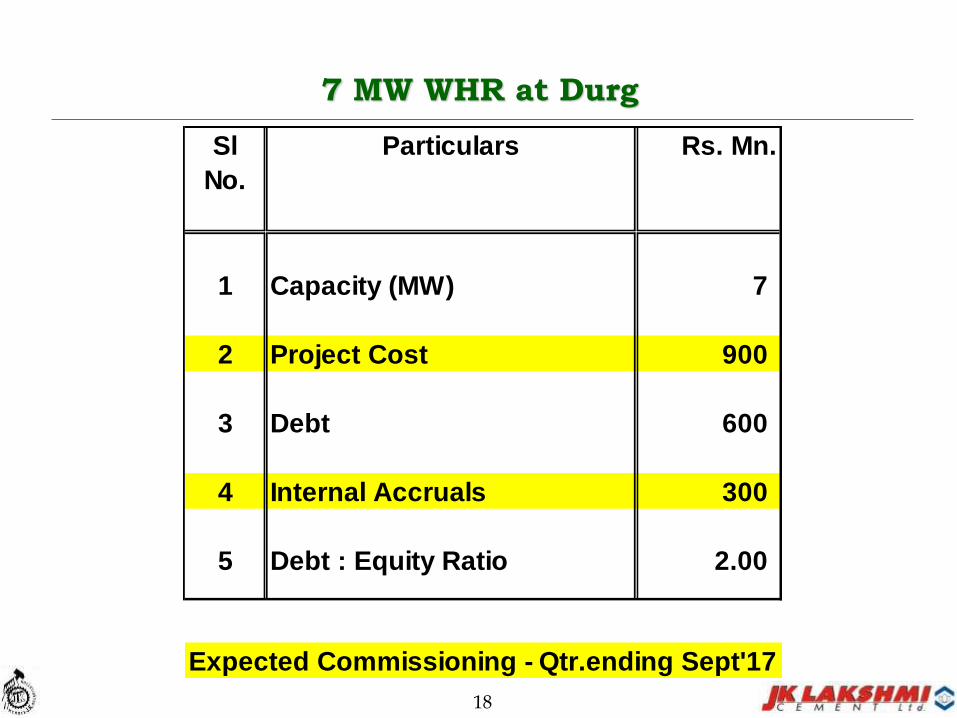
7 MW WHR at Durg
18
Sl
No.
Particulars Rs. Mn.
1 Capacity (MW) 7
2 Project Cost 900
3 Debt 600
4 Internal Accruals 300
5 Debt : Equity Ratio 2.00
Expected Commissioning - Qtr.ending Sept'17

Growth Opportunity - UCWL
19
S.No. Particulars Rs. Mn.
1 Capacity (Mn. MT) 1.60
2 Project Cost - Rs.Mn 7,000
- Rs / MT 4,375
3 Term Loan from Bank/FI's 4,750
4 Internal Accruals (JKLC's 2,250
Contribution Rs. 1500 Mn.
5 Debt : Equity Ratio 2.11
Expected Commissioning - Dec'16
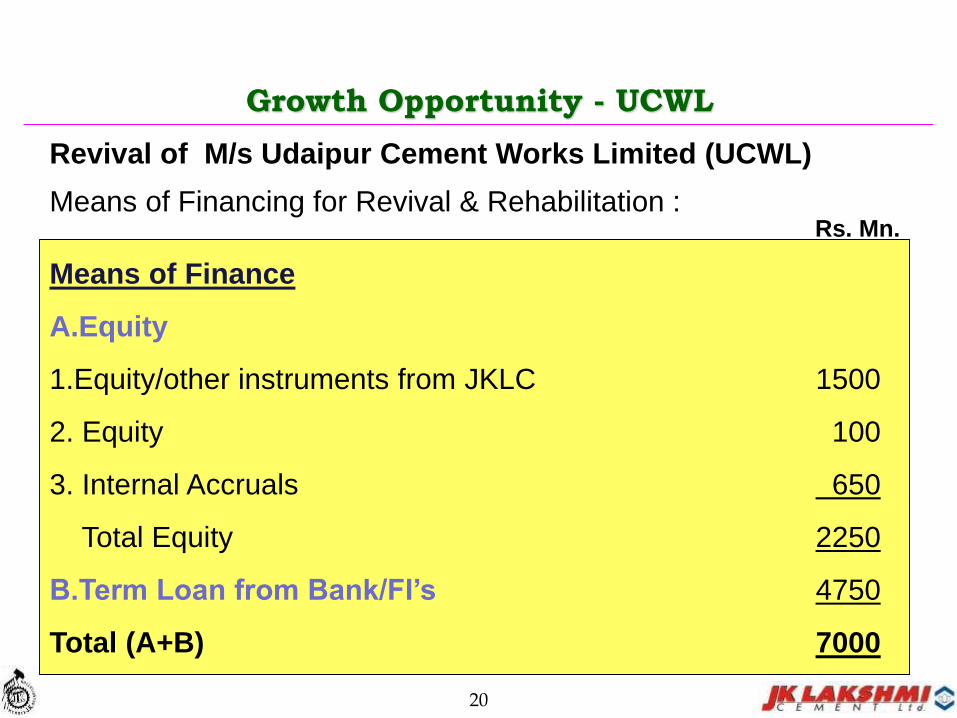
Means of Financing for Revival & Rehabilitation :
Revival of M/s Udaipur Cement Works Limited (UCWL)
Growth Opportunity - UCWL
Means of Finance
A.Equity
1.Equity/other instruments from JKLC 1500
2. Equity 100
3. Internal Accruals 650
Total Equity 2250
B.Term Loan from Bank/FI’s 4750
Total (A+B) 7000
Rs. Mn.
20
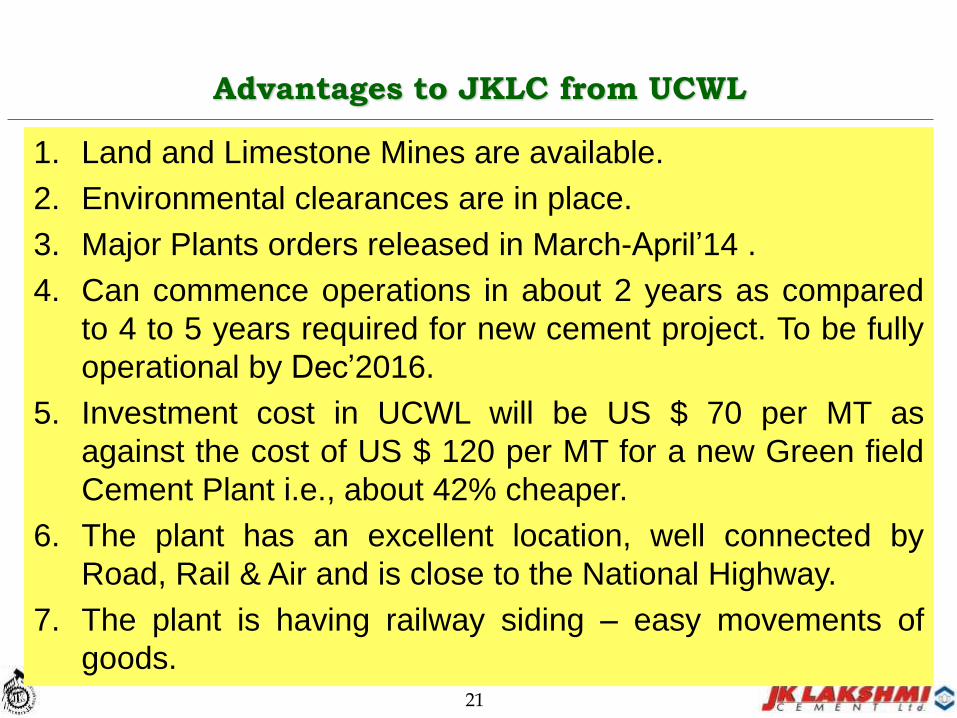
Advantages to JKLC from UCWL
21
1. Land and Limestone Mines are available.
2. Environmental clearances are in place.
3. Major Plants orders released in March-April’14 .
4. Can commence operations in about 2 years as compared
to 4 to 5 years required for new cement project. To be fully
operational by Dec’2016.
5. Investment cost in UCWL will be US $ 70 per MT as
against the cost of US $ 120 per MT for a new Green field
Cement Plant i.e., about 42% cheaper.
6. The plant has an excellent location, well connected by
Road, Rail & Air and is close to the National Highway.
7. The plant is having railway siding – easy movements of
goods.
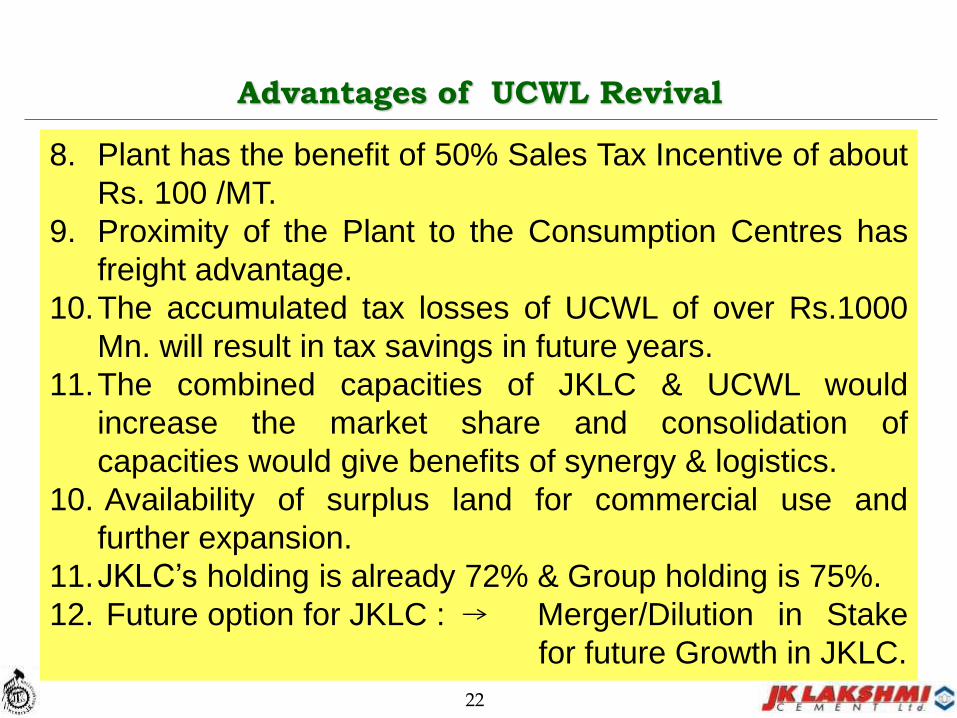
8. Plant has the benefit of 50% Sales Tax Incentive of about
Rs. 100 /MT.
9. Proximity of the Plant to the Consumption Centres has
freight advantage.
10.The accumulated tax losses of UCWL of over Rs.1000
Mn. will result in tax savings in future years.
11.The combined capacities of JKLC & UCWL would
increase the market share and consolidation of
capacities would give benefits of synergy & logistics.
10. Availability of surplus land for commercial use and
further expansion.
11.JKLC’s holding is already 72% & Group holding is 75%.
12. Future option for JKLC : Merger/Dilution in Stake
for future Growth in JKLC.
Advantages of UCWL Revival
22
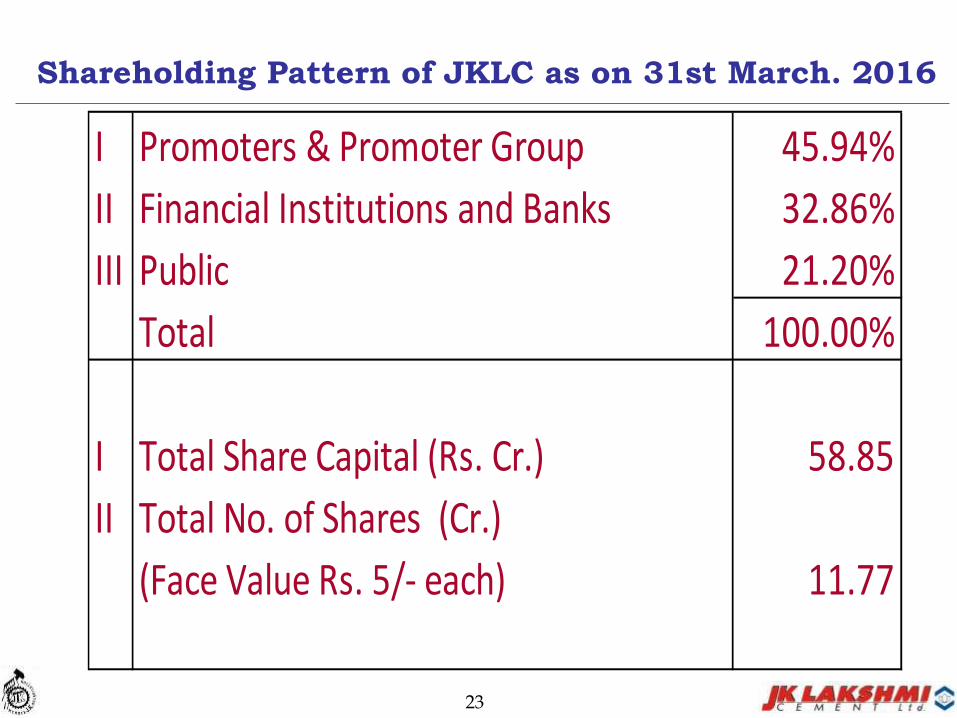
Shareholding Pattern of JKLC as on 31st March. 2016
23
I Promoters & Promoter Group 45.94%
II Financial Institutions and Banks 32.86%
III Public 21.20%
Total 100.00%
I Total Share Capital (Rs. Cr.) 58.85
II Total No. of Shares (Cr.)
(Face Value Rs. 5/- each) 11.77

1. Buy-back upto Rs. 975 Mn. at a Cap of Rs. 70/- per share inFeb’2012.
Cap of Rs. 70/- per share represents :
57% Premium over 12 months average price.
68% Premium over 6 months average price.
67% Premium over 3 months average price.
66% Premium over 1 months average price.
43% Premium over 15 days average price.
The Company Utilised only Rs. 304.7 Mn. for the Buy-back
2. Share Split from - Rs. 10/- per share into 2 Shares of Rs. 5/- each.
Shareholder’s friendly Initiatives
24
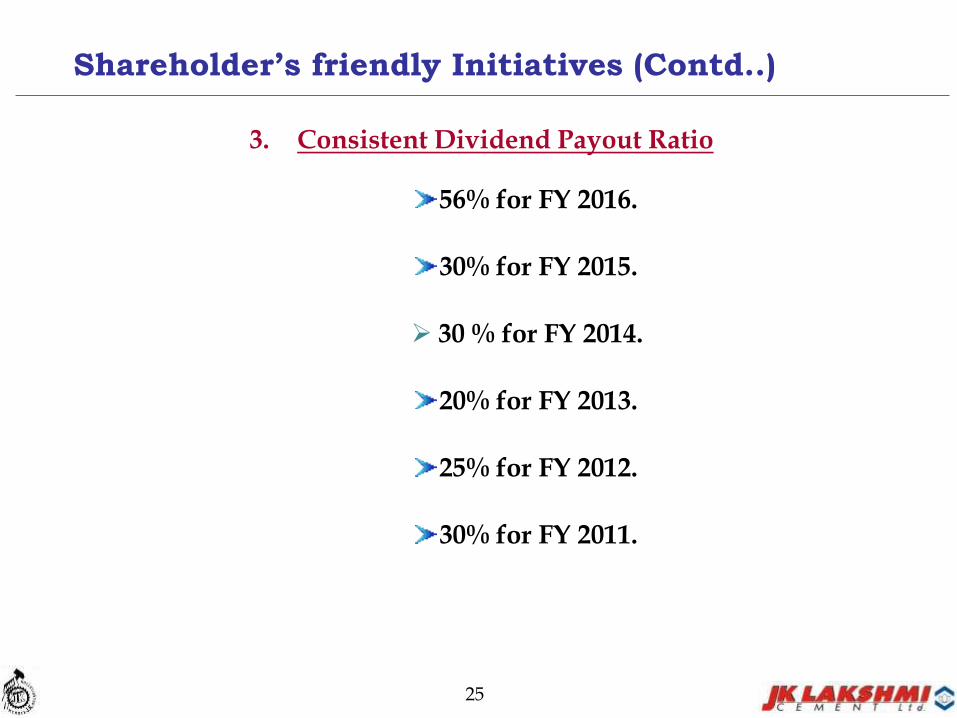
3. Consistent Dividend Payout Ratio
56% for FY 2016.
30% for FY 2015.
30 % for FY 2014.
20% for FY 2013.
25% for FY 2012.
30% for FY 2011.
Shareholder’s friendly Initiatives (Contd..)
25
26
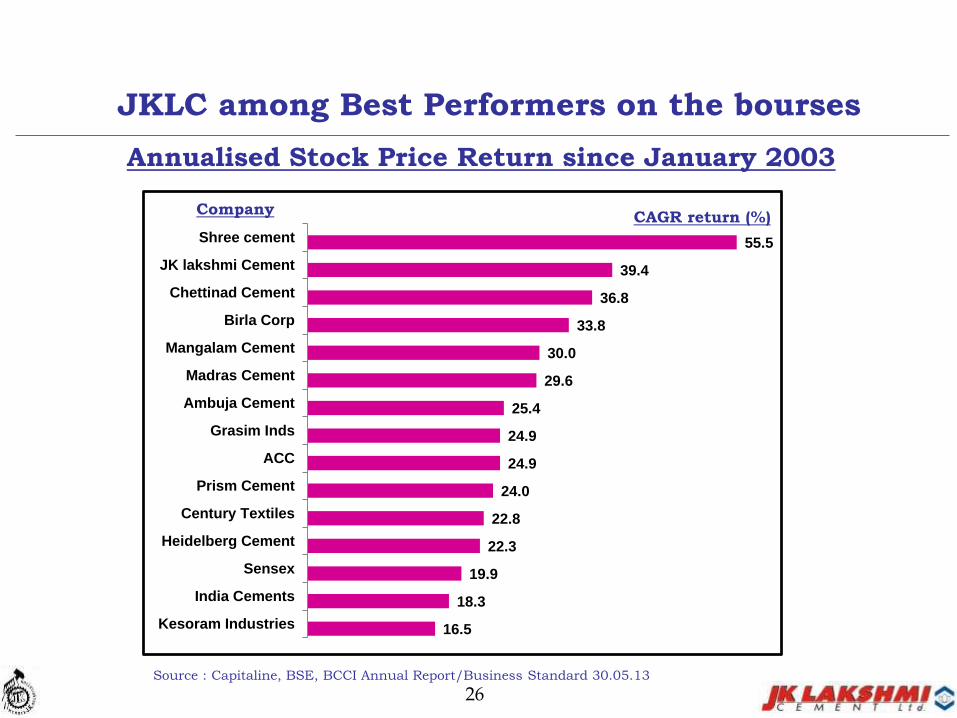
JKLC among Best Performers on the bourses
Annualised Stock Price Return since January 2003
55.5
39.4
36.8
33.8
30.0
29.6
25.4
24.9
24.9
24.0
22.8
22.3
19.9
18.3
16.5
Shree cement
JK lakshmi Cement
Chettinad Cement
Birla Corp
Mangalam Cement
Madras Cement
Ambuja Cement
Grasim Inds
ACC
Prism Cement
Century Textiles
Heidelberg Cement
Sensex
India Cements
Kesoram Industries
CompanyCAGR return (%)
Source : Capitaline, BSE, BCCI Annual Report/Business Standard 30.05.13
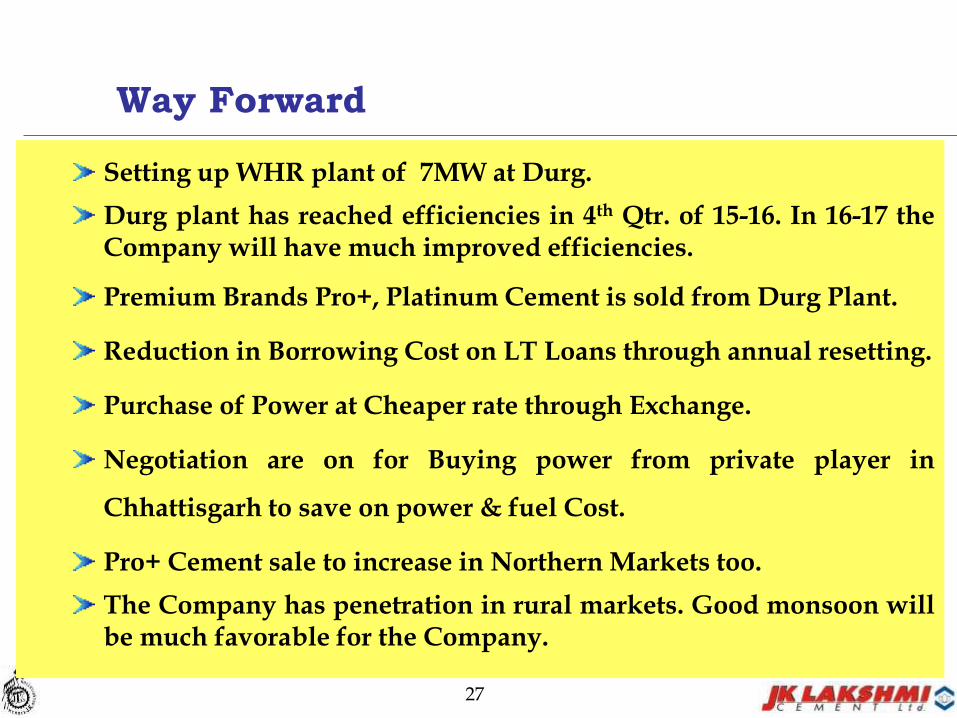
Setting up WHR plant of 7MW at Durg.
Durg plant has reached efficiencies in 4th Qtr. of 15-16. In 16-17 theCompany will have much improved efficiencies.
Premium Brands Pro+, Platinum Cement is sold from Durg Plant.
Reduction in Borrowing Cost on LT Loans through annual resetting.
Purchase of Power at Cheaper rate through Exchange.
Negotiation are on for Buying power from private player in
Chhattisgarh to save on power & fuel Cost.
Pro+ Cement sale to increase in Northern Markets too.
The Company has penetration in rural markets. Good monsoon willbe much favorable for the Company.
Way Forward
27
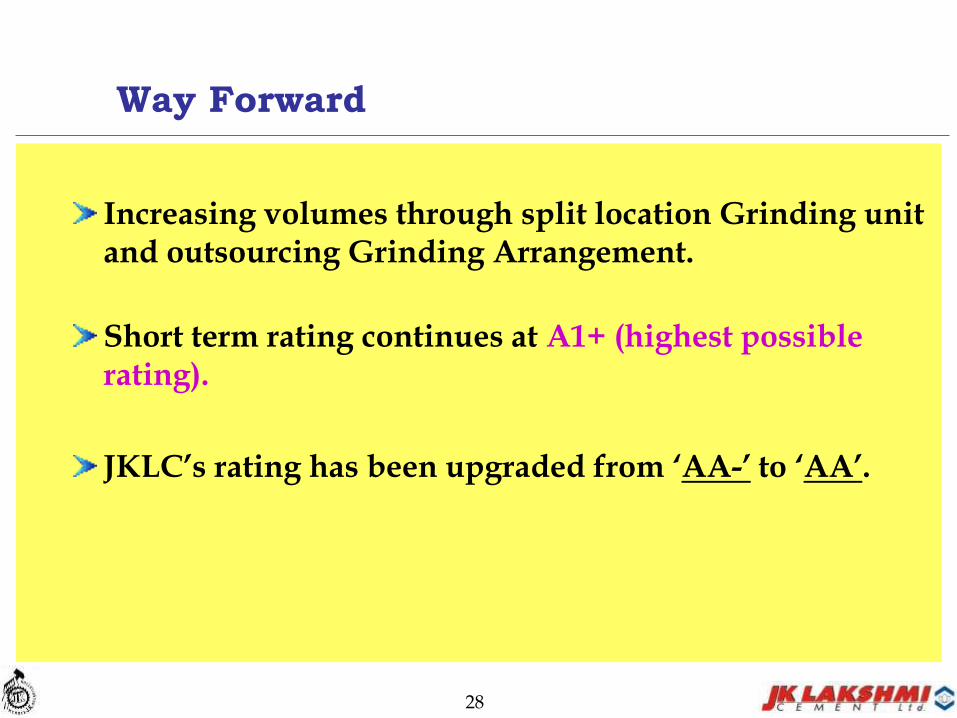
Increasing volumes through split location Grinding unit and outsourcing Grinding Arrangement.
Short term rating continues at A1+ (highest possible rating).
JKLC’s rating has been upgraded from ‘AA-’ to ‘AA’.
Way Forward
28
Would become a 11 Mn MT Cement Company during 2016-17.
Cement Capacity (including UCWL) to go up from 9.35 Mn. MT in Mar’16 to over 13 Mn. MT during 2017-18.
Efficiency Parameters amongst best in Industry.
Key Financial Ratios well within accepted Norms.
Become PAN India Player (Barring South).
JKLC to breach 10 Mn MT by Jun’16.
29
Thank You