investor update february 2018 final
TRANSCRIPT

Investor UpdateFebruary 2018

Cautionary Statement for the Purpose of the “Safe Harbor” Provisions of the Private Securities Litigation Reform Act of 1995
This presentation includes “forward-looking statements” within the meaning of Section 27A of the Securities Act of 1933 and Section 21E of the Securities Exchange Act of 1934. All statements included in this presentation other than statements of historical fact, including, but not limited to, forecasts or expectations regarding the Company’s business and statements or information concerning the Company’s future operations, performance, financial condition, production and reserves, schedules, plans, timing of development, rates of return, budgets, costs, business strategy, objectives, and cash flows, are forward-looking statements. When used in this presentation, the words “could,” “may,” “believe,” “anticipate,” “intend,” “estimate,” “expect,” “project,” “budget,” “plan,” “continue,” “potential,” “guidance,” “strategy,” and similar expressions are intended to identify forward-looking statements, although not all forward-looking statements contain such identifying words.
Forward-looking statements are based on the Company’s current expectations and assumptions about future events and currently available information as to the outcome and timing of future events. Although the Company believes these assumptions and expectations are reasonable, they are inherently subject to numerous business, economic, competitive, regulatory and other risks and uncertainties, most of which are difficult to predict and many of which are beyond the Company’s control. No assurance can be given that such expectations will be correct or achieved or the assumptions are accurate. The risks and uncertainties include, but are not limited to, commodity price volatility; the geographic concentration of our operations; financial, market and economic volatility; the inability to access needed capital; the risks and potential liabilities inherent in crude oil and natural gas exploration, drilling and production and the availability of insurance to cover any losses resulting therefrom; difficulties in estimating proved reserves and other revenue-based measures; declines in the values of our crude oil and natural gas properties resulting in impairment charges; our ability to replace proved reserves and sustain production; the availability or cost of equipment and oilfield services; leasehold terms expiring on undeveloped acreage before production can be established; our ability to project future production, achieve targeted results in drilling and well operations and predict the amount and timing of development expenditures; the availability and cost of transportation, processing and refining facilities; legislative and regulatory changes adversely affecting our industry and our business, including initiatives related to hydraulic fracturing; increased market and industry competition, including from alternative fuels and other energy sources; and the other risks described under Part I, Item 1A Risk Factors and elsewhere in the Company’s Annual Report on Form 10-K for the year ended December 31, 2017, registration statements and other reports filed from time to time with the SEC, and other announcements the Company makes from time to time.
Readers are cautioned not to place undue reliance on forward-looking statements, which speak only as of the date on which such statement is made. Should one or more of the risks or uncertainties described in this presentation occur, or should underlying assumptions prove incorrect, the Company’s actual results and plans could differ materially from those expressed in any forward-looking statements. All forward-looking statements are expressly qualified in their entirety by this cautionary statement. Except as expressly stated above or otherwise required by applicable law, the Company undertakes no obligation to publicly correct or update any forward-looking statement whether as a result of new information, future events or circumstances after the date of this presentation, or otherwise.
Readers are cautioned that initial production rates are subject to decline over time and should not be regarded as reflective of sustained production levels. In particular, production from horizontal drilling in shale oil and natural gas resource plays and tight natural gas plays that are stimulated with extensive pressure fracturing are typically characterized by significant early declines in production rates.
We use the term "EUR" or "estimated ultimate recovery" to describe potentially recoverable oil and natural gas hydrocarbon quantities. We include these estimates to demonstrate what we believe to be the potential for future drilling and production on our properties. These estimates are by their nature much more speculative than estimates of proved reserves and require substantial capital spending to implement recovery. Actual locations drilled and quantities that may be ultimately recovered from our properties will differ substantially. EUR data included herein remain subject to change as more well data is analyzed.
Forward-Looking Information
2
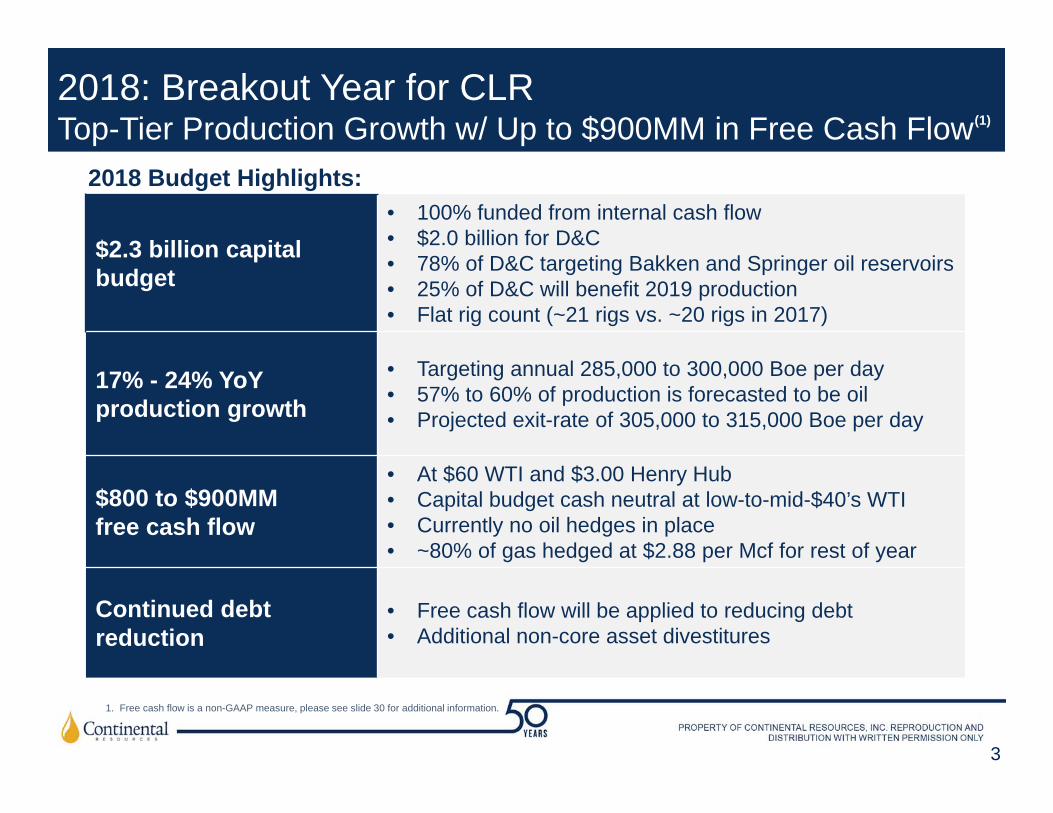
2018: Breakout Year for CLRTop-Tier Production Growth w/ Up to $900MM in Free Cash Flow
$2.3 billion capital budget
• 100% funded from internal cash flow• $2.0 billion for D&C • 78% of D&C targeting Bakken and Springer oil reservoirs• 25% of D&C will benefit 2019 production• Flat rig count (~21 rigs vs. ~20 rigs in 2017)
17% - 24% YoY production growth
• Targeting annual 285,000 to 300,000 Boe per day • 57% to 60% of production is forecasted to be oil • Projected exit-rate of 305,000 to 315,000 Boe per day
$800 to $900MMfree cash flow
• At $60 WTI and $3.00 Henry Hub• Capital budget cash neutral at low-to-mid-$40’s WTI• Currently no oil hedges in place• ~80% of gas hedged at $2.88 per Mcf for rest of year
Continued debt reduction
• Free cash flow will be applied to reducing debt• Additional non-core asset divestitures
3
2018 Budget Highlights:
(1)
1. Free cash flow is a non-GAAP measure, please see slide 30 for additional information.

-$526-$845
-$1,393
-$999-$1,329
-$875
$79$96 $95 $97 $95
$50
$43$51
$0
$20
$40
$60
$80
$100
-$2,000-$1,500-$1,000
-$500$0
$500$1,000$1,500$2,000
2010 2011 2012 2013 2014 2015 2016 2017 2018E
CLR Has Transitioned to Sustainable PositiveCash-Flow Growth
4
0
50,000
100,000
150,000
200,000
250,000
300,000
350,000
2010 2011 2012 2013 2014 2015 2016 2017 2018E
STACKSCOOPBakkenLegacy
242,637
Annual Production Chart
Boe p
er d
ay
285,000-300,000
$ in
MM
$800-$900
Outspend Asset divestiture proceedsFree cash flow Projected free cash flow
2010-2014• Growing Bakken and SCOOP 2015-2016• Growing STACK and SCOOP • Building Bakken DUCs2017• Optimized completions• Begin completing Bakken DUCs• 12% YoY growth• ~70% net reservoir acres HBP’d2018• 17%-24% projected growth• Harvest Bakken DUCs• Begin Springer development
2010-2014• Outspent to grow/secure assets 2015-2017• Transitioned to free cash flow• Adjusted to market conditions• Operating efficiency gains• Non-strategic asset sales2018• $800-$900 MM of free cash flow • Cash from non-strategic asset
sales
1. Free cash flow / outspend is a non-GAAP measure. See slide 30 for a definition of this measure and a reconciliation of the historical amounts to the most comparable U.S. GAAP measure. Also, with respect to projected amounts, please see slide 30 for an explanation of the factors that make a quantitative reconciliation of this forward-looking estimate to U.S. GAAP not possible. 2016 & 2017 totals are inclusive of asset divestiture proceeds of $631 million and $144 million, respectively.
2. Average WTI price is the SEC price used for reserve calculations; rounded to the nearest dollar
Annual Free Cash Flow vs. Outspend(1)
$845$227
Avg. WTI Price (2)

CLR Restoring Historical Returns and Debt Metrics
5
23.1% 21.9%
16.9%18.8%
16.1%
-1.6% -0.7%
3.8%
$79
$96 $95 $97$95
$50
$43
$51
$0
$20
$40
$60
$80
$100
-5%
0%
5%
10%
15%
20%
25%
30%
2010 2011 2012 2013 2014 2015 2016 2017 2018E
10.0%-15.0%
Return on Capital Employed (ROCE)(1)
Net Debt / TTM EBITDAX(2)
1.8x1.6x 1.6x
3.6x 3.5x
2.7x
$79
$96 $95 $97 $95
$50
$43
$51
$0
$20
$40
$60
$80
$100
0.0
1.0
2.0
3.0
4.0
2010 2011 2012 2013 2014 2015 2016 2017 2018E1. See the calculation of ROCE on slide 362. Net Debt and EBITDAX are non-GAAP measures. See slides 31-33 for definitions and reconciliations of
these measures to the most comparable U.S. GAAP financial measures. 3. Average WTI price is the SEC price used for reserve calculations; rounded to the nearest dollar
1.1x 0.9x
Avg. WTI Price (3)
2015-2017• No equity dilution to fund
growth / reduce debt• Build operating efficiencies and
lower costs: • LOE• G&A• Differentials
2018• Projecting ROCE back in line
with historical average
2010-2014• Grew/secured assets• Net-debt-to-EBITDAX well
below 2x2015 -2017• Paid down debt by ~$800
million• Net-debt-to-annualized 4Q
2017 EBITDAX produces a leverage ratio of 1.9x
2018• Leverage ratio expected to
improve with further debt reduction/higher crude prices
Avg. WTI Price (3)
4Q EBITDAX annualized 1.9x

CLR
$0
$2
$4
$6
$8
$10
0% 20% 40% 60% 80% 100%LO
E/B
oe
Oil Production Percentage (Excludes Liquids)
CLR: Low-Cost, Oil-Weighted Producer
6
Select peers include: APC, CXO, DVN, EOG, MRO, NFX, OAS, PXD, WLL, WPX, XEC
LOE and Oil % vs. Peers (4Q’17)(Source: Public company filings)
$0
$1
$2
$3
$4
$5
$6
$7
2Q'1
23Q
'12
4Q'1
21Q
'13
2Q'1
33Q
'13
4Q'1
31Q
'14
2Q'1
43Q
'14
4Q'1
41Q
'15
2Q'1
53Q
'15
4Q'1
51Q
'16
2Q'1
63Q
'16
4Q'1
61Q
'17
2Q'1
73Q
'17
4Q'1
7
Sustained Downward Shift in Production Expense per Boe
Asset Optimization
Exploration
4Q’17 production expense $3.17 per Boe, down 17% from 3Q’17
Guiding to $3.00 to $3.50 for full-year 2018
LOE among the lowest of select peers

CLR: Low Costs Generate Strong Margins(1)
7
1. Margin presented on this slide represents the Company’s average sales price for a period expressed in barrels of oil equivalent (Boe) less production expenses, production taxes, G&A expenses (exclusive of non-cash equity compensation expenses), and interest expense, all expressed on a per-Boe basis. Margin does not reflect all activities of the Company that give rise to cash inflows and outflows and specifically excludes income and costs associated with derivative settlements, service operations, exploration activities, asset dispositions, litigation settlement and various non-operating activities. These items are excluded from the computation of Margin because they can vary significantly from period to period in a manner that does not correlate with changes in the Company’s production and sales volumes. Therefore, these items are not typically utilized by management on a per-Boe basis in assessing the performance of the Company’s E&P operations from period to period. See “Continuing to Deliver Strong Margins” on slide 29 for additional details on the method for calculating margin.
2. See “Cash G&A Reconciliation to GAAP” on slide 35 for a reconciliation of GAAP Total G&A per Boe to Cash G&A per Boe, which is a non-GAAP measure.3. Based on average oil equivalent price (excluding derivatives and including natural gas.)4. Margins calculated as E&P revenue less LOE, TT&O, cash G&A and interest expense per Boe 5. Recycle ratio calculated as margins per footnote 4, divided by F&D per Boe 6. Select peers include: APC, CXO, DVN, EOG, NBL, NFX, OAS, PXD, WLL, WPX, XEC
$4.30 $3.65 $3.66 $3.17$1.70 $1.53 $1.64 $1.80
$2.47 $1.79 $2.35 $2.78
$3.86$4.04 $3.32 $2.85
$19.15
$14.54
$22.68
$27.67$31.48
$25.55
$33.65
$38.27
$0
$10
$20
$30
$40
$50
$60
2015 2016 2017 4Q 2017
Margin(1)
InterestProduction/Severance TaxCash G&A(2)
Production Expense
61%57%
Avg
. Rea
lized
$/B
oe(3
)
4Q’17: Select Cash Costs of $10.60 per Boe
67%72%
CLR
$-
$5
$10
$15
$20
$25
$30
0% 100% 200% 300% 400%A
vg. U
nhed
ged
Mar
gins
(4) p
er B
oe(2
014
–20
17E)
Average Unhedged Recycle Ratio(5) (2014-2016)
Margin(4) and Recycle Ratio(5) vs. Peers(6)
(Source: Stephens, Inc. August 2017)

CLR: 4Q 2017 Highlights
8
Bakken: • 39 gross operated wells completed with avg. 24-hour IP of 2,180 Boe per well • 5 wells were record 30-day Bakken producers for CLR, avg. 2,230 Boepd • 4Q 2017 production up 58% over 4Q 2016, all time high
SCOOP Springer: • Initial density testing complete; beginning full-field development with 5 rigs • Type curve uplifted 28% to 1,200 MBoe for a 7,500-foot lateral unit well
STACK Meramec: • Preliminary economic model to maximize net present value for unit development
announced in over-pressured oil window
Production
Operations
• 4Q 2017: 286,985 Boe per day (59% oil); up 37% over 4Q 2016• Oil production up 44% over 4Q 2016
• FY 2017: 242,637 Boe per day (57% oil); up 12% over FY 2016
Financial Metrics• $3.17 production expense per Boe• $4.23 per Bo oil differential; +$0.37 per Mcf gas premium• Upgraded to Investment Grade by S&P to BBB- in February 2018

CLR’s Superior Oil-Weighted Assets Provide the Foundation for Future Growth
9
Play Net ReservoirAcres(1)
HBP(1)
Bakken: 802,000 90%
STACK:
Meramec 212,500 58%
Woodford 197,000 63%
SCOOP:
Springer 170,000 64%
Sycamore 277,000 56%
Woodford 277,000 56%
1. Acreage and HBP numbers are approximate
4Q 2017 Production: 286,985 Boe per day (59% oil)
NORTH175,563 Boepd
SOUTH111,422 Boepd
1.9 Million Net Reservoir Acres
~70% HBP

10
20 Miles
CLR 30‐Day Record WellsCLR Acreage
Tarentaise Fed. 1-19H
Tarentaise Fed. 3-19H
Tarentaise Fed. 5-19H
Tarentaise Fed. 12-19H2
Holstein Fed 8-25H
Monroe 6-2H
Monroe 7-2H
Akron Fed 7-27H
Radermecher 2-22H1
Wiley 7-25H
Well 30-Day Avg, Boepd % Oil Formation Quarter
Monroe 6-2H 2,869 79% MB 4Q17
Tarentaise Federal 1-19H 2,126 79% MB 4Q17
Tarentaise Federal 3-19H 2,074 80% MB 4Q17
Monroe 7-2H 2,055 80% MB 4Q17
Tarentaise Federal 5-19H 2,034 79% MB 4Q17
Holstein Federal 8-25H 2,015 83% MB 2Q17
Wiley 7-25H 1,966 76% MB 3Q17
Akron Federal 7-27H 1,853 79% MB 1Q17
Tarentaise Federal 12-19H2 1,848 79% TF2 4Q17
Radermecher 2-22H1 1,833 79% TF1 1Q17
Bakken Continues to Deliver Record Results39 gross operated wells turned to production in 4Q’17• Average 24-Hr IP: 2,180 Boe per day
• Top 5 all-time 30-day rate Bakken wells

0
50,000
100,000
150,000
200,000
250,000
300,000
0 30 60 90 120 150 180 210 240 270 300
Cum
ulat
ive
Prod
uctio
n B
oe
Days
ND Bakken Well Production
11
Bakken Optimized Completions Continue to Uplift Performance & Economics Across Our Acreage
1. 134 optimized completions for MB, TF1 and TF2 through 4Q’17 in Mountrail, Williams, McKenzie and Dunn counties; down days removed
2. ROR, PV-10 & payout are based on $60 WTI and $3.00 gas, see ROR footnote on slide 23 or 24
CLR Leasehold
CLR Larger Optimized Completion
Optimized completions successful across broad area
All optimized completions(1)
1,100 MBoe TC
~40 miles
1,100 MBoe type curve supported by 134 optimized completions • Generates ~125% ROR(2)
• 10 month(2) payout period• PV-10 up 47% per well(2) compared to previous
type curve

12
• 4Q’17 Bakken differential improved $4.54 from 2015 average
• Revised Bakken transportation contract - lowered oil differential to $3.75 per Bo on ~30% of production through Oct. 2024 (starting in January 2018)
• As a result, CLR Bakken differentials expected to remain low in 2018
• 4Q’17 corporate differential improved $3.10 from 2016 average
• 2018 corporate differential expected to be ($3.50) to ($4.50) per Bo
Bakken Differentials Continued to Improve in 4Q 2017 Benefiting Corporate Netbacks
Rai
lPi
pelin
e
$10.81
$8.33 $7.33 $7.09
$6.31 $4.98
$4.23
$0
$2
$4
$6
$8
$10
$12
2014 2015 2016 1Q'17 2Q'17 3Q'17 4Q'17
Corporate Oil Differentials to WTI
$11.83
$9.21 $8.26 $8.10
$7.13 $5.54 $4.67
$0$2$4$6$8
$10$12$14
2014 2015 2016 1Q'17 2Q'17 3Q'17 4Q'17
Bakken Oil Differentials to WTI

STACK Density Results Providing Template for Future Development
Blurton
Compton
Over-Pressured
Normally-Pressured
Bernhardt
Intermediate pipe required
Ludwig
CLR LeaseholdCLR RigsIndustry Meramec wellCLR Meramec producing wells CLR Meramec wells drilling / completing
13
STACKSCOOP
Angus Trust
Gillilan
Verona
CLR Density Results
Unit name Average 24-hour IP per well
# of wells per zone
Zones tested
Bernhardt (5-well unit)
752 Boe (78% oil)
5 Lower
Ludwig (8-well unit)
2,669 Boe (70% oil)
4 Upper, Middle
Blurton (8-well unit)
1,314 Boe (78% oil)
3-5 Upper, Lower
Verona (8-well unit)
2,281 Boe (68% oil)
4 Upper, Lower
Compton (10-well unit)
2,203 Boe (75% oil)
5 Upper, Lower
Gillilan (10-well unit)
1,102 Boe (64% oil)
5 Upper, Lower
Angus Trust (12-well equivalentunit)
2,659 Boe (39% oil)
6 Upper, Lower
CLR Density Tests Completed• 6 full-unit tests in over-pressured oil window• 1 half-unit test in condensate window (Angus Trust)

$0
$20
$40
$60
$80
$100
$120
$140
$50 $60 $70
PV-1
0 ($
in M
M)
WTI Oil Price, $/BBL
Maximizing Unit Value in STACK Over-Pressured Oil
0%
50%
100%
150%
200%
$0
$20
$40
$60
$80
$100
Uni
t RO
R%
Uni
t PV-
10($
in M
M)
Maximizing Unit Value
Taking STACK to Next Level: Introducing Unit Economic Model for Over Pressured Meramec Oil
14
Objective: Maximizing the Net PV-10 (PV-10)(1) of Unit
Preliminary Unit Economic Model for Meramec Oil • Maximum PV-10 achieved with 8 wells
• Estimate $87 MM PV-10 for unit• 96% ROR(1) for unit• 9,600 MBoe unit EUR• $9.5MM CWC for a 9,800’ lateral• 2 targeted Meramec reservoirs/unit on avg.• 4 wells per zone, 8 total Meramec wells/unit• Based on 6 full density tests
Over 40 operated units in inventory to develop in de-risked portion of the over-pressured oil window
Well Count 1 2 4 6 8 10Unit EUR(2) 1,700 3,400 6,000 8,000 9,600 10,500Unit PV-10 $20 MM $40 MM $64 MM $80 MM $87 MM $80 MMUnit ROR 175% 175% 140% 115% 96% 78%
1. All references to ROR & PV-10 are based on $60 WTI and $3.00 gas, see ROR footnote on slide 23 or 242. EUR in MBoe
$67 MM increase in PV-10
Unit PV-10: $87 MMParent well PV-10: $20 MM
10
100
1,000
10,000
0 365 730 1095 1460 1825 2190 2555 2920 3285 3650
Prod
uctio
n B
oe p
er d
ay
Years
Unit vs. Parent Well Type Curves in Over-Pressured Oil
Unit average Parent well
1 2 3 4 5 6 7 8 9 10

SCOOP Springer: Moving to Full Field Development in 2018, Guided by Density Test Results
15
Three Density Pilots Completed• Tested 4, 5 and 6 wells per unit
Third density test completed in 4Q 2017 • Celesta Unit
• 6-wells, average ~9,400 lateral
• 6,014 Boe (81% oil) - combined IP
• Early performance indicates fewer wells are needed to maximize PV-10
Conclusion: 4 wells per unit on average should maximize PV-10 for Springer units
Moving to full-field development in 2018• Currently 6 rigs drilling Springer, plan to average 5
rigs during the year
12 Miles
Celesta Density (6-well unit)
SCOOP Springer Fairway
Jeanna Density (4-well unit)
CLR Leasehold OSO SPRG HZCLR Leasehold OSO SPRG HZCLR SPRG HZ
6 Miles
Hartley Density(5-well unit)

0%
50%
100%
150%
200%
$0
$20
$40
$60
$80
Uni
t RO
R%
Uni
t PV-
10($
in M
M)
Maximizing Springer Unit Value
SCOOP Springer: Introducing Unit Economic Model Type Curve EUR up 28%, 175% ROR
16
1. All references to ROR & PV-10 are based on $60 WTI and $3.00 gas, see ROR footnote on slide 23 or 24
2. EUR in MBoe
Well Count 1 2 3 4 5 6Unit EUR(2) 1,700 3,300 4,200 4,800 5,100 5,300 Unit PV-10 $24MM $46MM $59MM $68MM $62MM $53MMUnit ROR 195% 188% 181% 175% 127% 82%
Updated Springer type curve for unit wells• 1,200 MBoe (~75% oil), 7500’ lateral• ~175% ROR(1) at $9.5 MM CWC• 2.6X ROR of legacy 940MBoe type curve for 4,500’ lateral• Payout(1) 11 months• $4 million incremental first year gross cash flow per well
Preliminary Unit Economic Model for Springer Oil • Maximum PV-10 achieved with 4 wells
• Estimate $68 MM PV-10 for unit• 4,800 MBoe unit EUR
50100150200250300350400
0 30 60 90 120 150 180 210 240 270 300 330 360 389
MB
oe
Days
1,200 MBoe Springer Type Curve
0%25%50%75%
100%125%150%175%200%
$50 $60 $70
RO
R
WTI Oil Price, $/BBL
Springer Unit Well 2.6X Legacy ROR
~175% ROR
~65% ROR

SCOOP Woodford OilEnhanced Completions Increase EUR 13%
17
30+ enhanced completions outperform legacy offsets• ~13% increase in EUR to 1,520 MBoe per
well for 2-mile lateral • ~55% ROR(1) for $12.7 million CWC
Recent completion with Pyle 1-36-25XH: • 1,812 Boe per day (81% oil)• 9,800-foot lateral
SCOOP Woodford Enhanced Completions
CLR Leasehold
Woodford HZ Producing Well
CLR Enhanced Completion
Gas Condensate Oil
12 Miles
1. ROR is based on $60 WTI and $3.00 gas, see ROR footnote on slide 23 or 24
Pyle 1-36-25XH
0
10
20
30
40
50
60
0 6 12 18 24 30 3610
100
1,000
10,000
Wel
l Cou
nt
Producing Months
Boe
per
day
SCOOP Oil Type CurveWell Count
1,520 MBOE Type Curve (Normalized to 9800' LL)
Actual Production (Normalized to 9800' LL)

Dicksion Project(1): Testing the Future of SCOOPSimultaneous Drilling & Completing Springer/Woodford/Sycamore
18
Aerial photograph of Dicksion Unit
Potential Efficiency Gains• 30% cycle time(2) reduction for
Woodford and Sycamore wells• 15% cycle time(2) reduction of
Springer wells
Reduced Cycle Times = Accelerated Production = Value Creation
DrillingSpringer
CompletingSycamore & Woodford
Drilling RigStimulation Crew
Total thickness 1,700’
Drilling WellProducing WellCompleting Well
Template for full-unit development:
1. Dicksion project is currently testing a half-unit with 9 wells2. Cycle time is referring to spud to first production

J. Warren HenryVice President, Investor Relations & ResearchPhone: 405-234-9127Email: [email protected]
Alyson L. GilbertManager, Investor Relations Phone: 405-774-5814Email: [email protected]
Website:www.CLR.com/Investors
CONTACT INFORMATION
19

REFERENCE MATERIALS
20

0
300
600
900
1,200
1,500
2010 2011 2012 2013 2014 2015 2016 2017
STACK
SCOOP
Bakken
Legacy
MM
Boe
1,331
37%
48%
2%
52%48%
Natural
Gas OilFor YE 2017:
21
Proved Reserves up 4% over YE 2016
13%
Total Proved ReservesYear-end 2017:• Proved reserves were 1,331 MMBoe,
up 4% over YE 2016 proved reserves of 1,275 MMBoe
• PV-10: $11.83 billion(1), up 78% over YE 2016 of $6.65 billion
• 45% PDP• 89% operated
SEC price deck: • Year-end 2017: $51.34 per Bo and
$2.98 per MMbtu gas
1. At December 31, 2017, Continental had a Standardized Measure of discounted future net cash flows of $10.47 billion. PV-10 is a non-GAAP financial measure and generally differs from Standardized Measure, the most directly comparable GAAP financial measure, because it does not include the effects of income taxes on future net revenues of approximately $1.36 billion.

2018 Guidance Builds on Successful 2017
Production & Capital Full-Year 2017 Performance
2018 Guidance as of 2/21/18
Capital expenditures (non-acquisition) $1.995 billion $2.3 billion
Production (Boe per day) 242,637 285,000 – 300,000
Exit rate production (Boe per day) 283,857 305,000 – 315,000
Operating ExpensesProduction expense ($ per Boe) $3.66 $3.00 - $3.50
Production tax (% of oil & gas revenue) 7.0% 7.6% - 8.0%
Cash G&A expense(1) ($ per Boe) $1.64 $1.25 - $1.75
Non-cash equity compensation ($ per Boe) $0.52 $0.45 - $0.55
DD&A ($ per Boe) $18.89 $17.00 - $19.00
Average Price Differentials NYMEX WTI crude oil ($ per barrel of oil) $(5.50) ($3.50) - ($4.50)Henry Hub natural gas(2) ($ per Mcf) $(0.16) $0.00 - +$0.50
1. Cash G&A is a non-GAAP measure and excludes the range of values shown for non-cash equity compensation per Boe in the item appearing immediately below. Guidance for total G&A (cash and non-cash) is an expected range of $1.70 to $2.30 per Boe. See “Cash G&A Reconciliation to GAAP” on slide 35 for a reconciliation of 2017 GAAP total G&A per Boe to cash G&A per Boe.2. Includes natural gas liquids production in differential range
22

0%
25%
50%
75%
100%
125%
150%
175%
200%
$50 $55 $60 $65 $70
RO
R
WTI Oil Price, $/BBL
SCOOP Springer
0%
40%
80%
120%
160%
200%
$50 $55 $60 $65 $70
RO
R
WTI Oil Price, $/BBL
Bakken
$7.9MM Budget 20180%
25%
50%
75%
100%
125%
150%
175%
200%
$50 $55 $60 $65 $70
RO
R
WTI Oil Price, $/BBL
STACK Over-Pressured Oil
1. Pre-tax rate of return (ROR) is based on projected cash flow and time value of money; costs include completed well cost, production expense, severance tax and variable operating costs. $3.00 Henry Hub is the gas price used for oil price sensitivities and $60 WTI is used for gas price sensitivities. The description of the ROR calculation applies to any ROR reference appearing in this presentation.
23
2018 Drilling Program: CLR Oil Assets
Target EUR: 1,100 MBoeAvg. Lateral: 9,800’
~100% ROR
~175% ROR
$9.5MM Budget 2018 – unit well$10.0MM Budget 2018 – parent well
Target EUR for unit: 1,200 MBoeAvg. Lateral:9,800’
0%
25%
50%
75%
100%
125%
150%
175%
200%
$50 $55 $60 $65 $70
RO
R
WTI Oil Price, $/BBL
SCOOP Woodford Oil
$12.7MM Budget 2018
Target EUR: 1,520 MBoeAvg. Lateral: 9,800’
~55% ROR
Target EUR for parent wells: 1,700 MBoeAvg. Lateral:9,800’
~125% ROR
~175% ROR
Target EUR: 1,200 MBoeAvg. Lateral: 7,500’
$9.5MM Budget 2018

0%
25%
50%
75%
100%
125%
150%
175%
200%
$2.50 $3.00 $3.50 $4.00
RO
R
Gas Price, $/MCF
SCOOP Woodford Condensate
$10.8MM Budget 2018
~85% ROR
Target EUR: 2,300 MBoeAvg. Lateral: 7,500’
1. Pre-tax rate of return (ROR) is based on projected cash flow and time value of money; costs include completed well cost, production expense, severance tax and variable operating costs. $3.00 Henry Hub is the gas price used for oil price sensitivities and $60 WTI is used for gas price sensitivities. The description of the ROR calculation applies to any ROR reference appearing in this presentation.
24
2018 Drilling Program: CLR Condensate Assets
0%
25%
50%
75%
100%
125%
150%
175%
200%
$2.50 $3.00 $3.50 $4.00
RO
R
Gas Price, $/MCF
STACK Condensate
~75% ROR
Target EUR: 2,400 MBoeAvg. Lateral: 9,800’
$10.6MM Budget 2018

0
20
40
60
80
100
120
140
160
0 6 12 18 24 30 3610
100
1,000
10,000
Producing Months
Boe
per
day
STACK Over-Pressured Oil Type CurveWell Count
Actual Production (Normalized to 9800' LL)
1,700 MBOE Parent Type Curve
1,200 MBOE Child Curve
25
Optimized Oil Completions Type Curves
0
25
50
75
100
125
150
10
100
1,000
10,000
0 6 12 18 24 30 36
Wel
l Cou
nt
BO
E pe
r day
Producing Months
Bakken Production
Well Count1,100 Mboe Type Curve
Act. Production (Normalized to 9,800’ LL)1,200 MBOE Unit Curve
0
10
20
30
40
50
60
0 6 12 18 24 30 3610
100
1,000
10,000
Wel
l Cou
nt
Producing Months
Boe
per
day
SCOOP Oil Type CurveWell Count1,520 MBOE Type Curve (Normalized to 9800' LL)Actual Production (Normalized to 9800' LL)
0
10
20
30
40
50
60
70
80
90
100
0 6 12 18 24 30 3610
100
1,000
10,000
Wel
l Cou
nt
Producing Months
Boe
per
day
Springer Oil Type Curve940 Curve Well CountUnit Well 1,200 MBOE Type Curve (Normalized to 7,500 LL)Cash, Trammell, Strassle, Robinson Avg (Normalized to 7,500' LL)Actual Production (Normalized to 4,500' LL)Parent 940 MBOE Type Curve (Normalized to 4,500' LL)Enhanced Well Count
Actual Production (Normalized to 9,800’ LL)
Wel
l Cou
nt

26
Optimized Condensate Completions Type Curves
0
10
20
30
40
50
60
0 6 12 18 24 30 3610
100
1,000
10,000
Wel
l Cou
nt
Producing Months
Boe
per
day
SCOOP Woodford Condensate Type CurveWell Count
2,300 MBOE Type Curve (Normalized to 7500' LL)
Actual Production (Normalized to 7500' LL)
0
10
20
30
40
50
60
0 6 12 18 24 30 3610
100
1,000
10,000
Wel
l Cou
nt
Producing Months
Boe
per
day
STACK Condensate Type CurveWell Count
Actual Production (Normalized to 9800' LL)
Previous 2,400 MBOE Type Curve2,400 MBoe Type Curve (Normalized to 9,800’ LL)

0%10%20%30%40%50%60%70%80%90%
100%110%120%130%140%150%
$40 $50 $60 $70 $80
RO
R(2
)
WTI Oil Price, $/BBL
Evolution of Bakken Type Curves
Optimized Completions Unlock Bakken Value Generating ~$2.6MM First Year Incremental Cash Flow per Well(1)
27
.
1,100 MBoe vs. 980 MBoe Type Curves
• More than doubled ROR(2) to ~125%
• Payout period down to 10 months(2)
• PV-10 up 47% per well(2)
• Both type curves deliver 80% oil
1. Compared to the 980 MBoe type curve; cash flow per well is on a gross basis 2. ROR, PV-10 & payout are based on $60 WTI and $3.00 gas, see ROR footnote on slide 23 or 24
2018
20112014
2015
1H 2017
1,100 MBoe; $7.9MM CWC980 MBoe; $7.0MM CWC800 MBoe; $6.8MM CWC603 MBoe; $7.8MM CWC430 MBoe; $6.5MM CWC

Upgraded to IG by S&P to BBB-
Financial Metrics
• 1.9x: net debt(1) / 4Q 2017 annual EBITDAX(1)
• 2.7x: net debt(1) / TTM EBITDAX(1)
Financial Strength
• Earliest debt maturity is revolver balance in May 2019
• 4.2% average interest rate in 4Q’17
Unsecured Credit Facility
• Ample liquidity with $2.75 billion revolver
• Projecting to pay off revolver in 2018
$93
$2,000 $1,500
$1,000 $1,000 $700
$2,657
0
500
1,000
1,500
2,000
2,500
3,000
2017 2018 2019 2020 2021 2022 2023 2024 2028 2044
4.375%
($M
M)
Debt Maturities Summary
5.0%
4.5%
3.8%4.9%
Undrawn
Continued Focus on Debt Reduction
28
($M
M)
Long-Term Debt(2) Declining
Callable3/15/17
Balance1/31/18
$7,116 $6,578 $6,351 $6,000$5,000
01,0002,0003,0004,0005,0006,0007,000
YE 2015 YE 2016 YE 2017 Near TermTarget
Long TermTarget
Drawn
1. Net Debt and EBITDAX are non-GAAP measures. See slides 31-33 for definitions and reconciliations of these measures to the most comparable U.S. GAAP financial measures. 2. Net of current portion of long-term debt

1. Margin represents the Company’s average sales price for a period expressed in barrels of oil equivalent (Boe) less production expenses, production taxes, G&A expenses (exclusive of non-cash equity compensation expenses), and interest expense, all expressed on a per-Boe basis. Margin does not reflect all activities of the Company that give rise to cash inflows and outflows and specifically excludes income and costs associated with derivative settlements, service operations, exploration activities, asset dispositions, litigation settlement and various non-operating activities. These items are excluded from the computation of Margin because they can vary significantly from period to period in a manner that does not correlate with changes in the Company’s production and sales volumes. Therefore, these items are not typically utilized by management on a per-Boe basis in assessing the performance of the Company’s E&P operations from period to period.
2. See “EBITDAX reconciliation to GAAP” on slide 33 for a reconciliation of GAAP net income and net cash provided by operating activities to EBITDAX, which is a non-GAAP measure. 3. Average costs per Boe have been computed using sales volumes and exclude any effect of derivative transactions.4. See “Cash G&A Reconciliation to GAAP“ on slide 35 for a reconciliation of GAAP Total G&A per Boe to Cash G&A per Boe, which is a non-GAAP measure.
2015 2016 4Q 2017 2017
Realized oil price ($/Bbl) $40.50 $35.51 $51.16 $45.70
Realized natural gas price ($/Mcf) $2.31 $1.87 $3.30 $2.93
Oil production (Bopd) 146,622 128,005 168,066 138,455
Natural gas production (Mcfpd) 450,558 533,442 713,518 625,093
Total production (Boepd) 221,715 216,912 286,985 242,637
EBITDAX ($000's)(2) $1,978,896 $1,881,889 $837,887 $2,363,617 Key Operational Statistics (per Boe)(3)
Average oil equivalent price (excludes derivatives) $31.48 $25.55 $38.27 $33.65
Production expense $4.30 $3.65 $3.17 $3.66Production tax and other $2.47 $1.79 $2.78 $2.35Cash G&A(4) $1.70 $1.53 $1.80 $1.64Interest $3.86 $4.04 $2.85 $3.32Total of selected costs $12.33 $11.01 $10.60 $10.97
Margin(1) $19.15 $14.54 $27.67 $22.68Margin % 61% 57% 72% 67%
Continuing to Deliver Strong Margins(1)
29

Free cash flow/outspend is a non-GAAP measure. We define free cash flow/outspend as cash flows from operations before changes in working capital items less capital expenditures excluding acquisitions and divestitures. Free cash flow is not a measure of net income (loss) or cash flows as determined by U.S. GAAP. Management believes that these measures are useful to management and investors as a measure of a company’s ability to internally fund its capital expenditures and to service or incur additional debt. These measures eliminate the impact of certain items that management does not consider to be indicative of the Company’s performance from period to period. This presentation includes forward-looking free cash flow estimates for 2018; however, the Company is unable to provide a quantitative reconciliation of the forward-looking non-GAAP measure to its most directly comparable forward-looking GAAP measure because management cannot reliably quantify certain of the necessary components of such forward-looking GAAP measure. The reconciling items in future periods could be significant.
The following table reconciles historical net cash provided by operating activities as determined under U.S. GAAP to free cash flow (outspend) amounts for the periods presented.
(1) Capital expenditures are calculated as follows:
Free Cash Flow/Outspend Reconciliation to GAAP
30
In thousands 2010 2011 2012 2013 2014 2015 2016 2017Net cash provided by operating activities (GAAP) $653,167 $1,067,915 $1,632,065 $2,563,295 $3,355,715 $1,857,101 $1,125,919 $2,079,106 Exclude: Changes in working capital items 50,667 109,949 13,015 10,875 126,679 (228,622) 162,216 (1,415)Less: Capital expenditures (1) (1,229,851) (2,023,165) (3,038,405) (3,573,573) (4,811,647) (2,503,317) (1,074,345) (1,995,246)Free cash flow (outspend) (non-GAAP) ($526,017) ($845,301) ($1,393,325) ($999,403) ($1,329,253) ($874,838) $213,790 $82,445
In thousands 2010 2011 2012 2013 2014 2015 2016 2017Cash paid for capital expenditures $1,083,401 $2,035,642 $4,118,105 $3,739,431 $4,716,787 $3,080,255 $1,164,514 $1,953,198 Less: Total acquisitions (7,337) (200,931) (1,143,778) (268,200) (203,948) (60,975) (35,911) (40,007)Plus: Change in accrued capital expenditures 147,997 173,591 49,039 89,482 290,782 (519,949) (59,062) 79,222 Plus: Exploratory seismic costs 5,790 14,863 15,039 12,860 8,026 3,986 4,804 2,833 Capital expenditures $1,229,851 $2,023,165 $3,038,405 $3,573,573 $4,811,647 $2,503,317 $1,074,345 $1,995,246

Net debt is a non-GAAP measure. We define net debt as total debt less cash and cash equivalents as determined under U.S. GAAP. Management uses net debt to determine the Company’s outstanding debt obligations that would not be readily satisfied by its cash and cash equivalents on hand. We believe this metric is useful to analysts and investors in determining the Company’s leverage position since the Company has the ability to, and may decide to, use a portion of its cash and cash equivalents to reduce debt.
The following table reconciles total debt as determined under U.S. GAAP to net debt for the periods presented.
Net Debt Reconciliation to GAAP
31
In thousands 2010 2011 2012 2013 2014 2015 2016 2017Total debt (GAAP) $ 907,264 $ 1,236,909 $ 3,491,994 $ 4,650,889 $ 5,928,878 $ 7,117,788 $ 6,579,916 $ 6,353,691 Less: Cash and cash equivalents (7,916) (53,544) (35,729) (28,482) (24,381) (11,463) (16,643) (43,902)Net debt (non-GAAP) $ 899,348 $ 1,183,365 $ 3,456,265 $ 4,622,407 $ 5,904,497 $ 7,106,325 $ 6,563,273 $ 6,309,789
We use a variety of financial and operational measures to assess our performance. Among these measures isEBITDAX. We define EBITDAX as earnings (net income (loss)) before interest expense, income taxes, depreciation,depletion, amortization and accretion, property impairments, exploration expenses, non-cash gains and lossesresulting from the requirements of accounting for derivatives, non-cash equity compensation expense, and losses onextinguishment of debt. EBITDAX is not a measure of net income (loss) or net cash provided by operating activitiesas determined by GAAP.
Management believes EBITDAX is useful because it allows us to more effectively evaluate our operating performanceand compare the results of our operations from period to period without regard to our financing methods or capitalstructure. Further, we believe that EBITDAX is a widely followed measure of operating performance and may also beused by investors to measure our ability to meet future debt service requirements, if any. We exclude the items listedabove from net income (loss) and net cash provided by operating activities in arriving at EBITDAX because thoseamounts can vary substantially from company to company within our industry depending upon accounting methodsand book values of assets, capital structures and the method by which the assets were acquired.
EBITDAX should not be considered as an alternative to, or more meaningful than, net income (loss) or net cashprovided by operating activities as determined in accordance with GAAP or as an indicator of a company’s operatingperformance or liquidity. Certain items excluded from EBITDAX are significant components in understanding andassessing a company’s financial performance, such as a company’s cost of capital and tax structure, as well as thehistoric costs of depreciable assets, none of which are components of EBITDAX. Our computations of EBITDAX maynot be comparable to other similarly titled measures of other companies.
See the following page for reconciliations of our net income (loss) and net cash provided by operating activities toEBITDAX for the applicable periods.
EBITDAX Reconciliation to GAAP
32

The following tables provide reconciliations of our net income (loss) and net cash provided by operating activities to EBITDAX for the periods presented:
In thousands 2010 2011 2012 2013 2014 2015 2016 4Q 2017 2017
Net income (loss) $ 168,255 $ 429,072 $ 739,385 $ 764,219 $ 977,341 $ (353,668) $ (399,679) $ 841,914 $ 789,447 Interest expense 53,147 76,722 140,708 235,275 283,928 313,079 320,562 75,823 294,495
Provision (benefit) for income taxes 90,212 258,373 415,811 448,830 584,697 (181,417) (232,775) (608,317) (633,380)
Depreciation, depletion, amortization and accretion 243,601 390,899 692,118 965,645 1,358,669 1,749,056 1,708,744 476,732 1,674,901 Property impairments 64,951 108,458 122,274 220,508 616,888 402,131 237,292 27,552 237,370
Exploration expenses 12,763 27,920 23,507 34,947 50,067 19,413 16,972 2,802 12,393
Impact from derivative instruments:
Total (gain) loss on derivatives, net 130,762 30,049 (154,016) 191,751 (559,759) (91,085) 67,099 (8,417) (90,432)
Total cash received (paid), net 35,495 (34,106) (45,721) (61,555) 385,350 69,553 89,522 15,867 32,401
Non-cash (gain) loss on derivatives, net 166,257 (4,057) (199,737) 130,196 (174,409) (21,532) 156,621 7,450 (58,031)
Non-cash equity compensation 11,691 16,572 29,057 39,890 54,353 51,834 48,097 13,377 45,868
Loss on extinguishment of debt -- -- -- -- 24,517 -- 26,055 554 554
EBITDAX (non-GAAP) $ 810,877 $ 1,303,959 $ 1,963,123 $ 2,839,510 $ 3,776,051 $ 1,978,896 $ 1,881,889 $ 837,887 $ 2,363,617
In thousands 2010 2011 2012 2013 2014 2015 2016 4Q 2017 2017
Net cash provided by operating activities $ 653,167 $ 1,067,915 $ 1,632,065 $ 2,563,295 $ 3,355,715 $ 1,857,101 $ 1,125,919 $ 731,125 $ 2,079,106 Current income tax provision (benefit) 12,853 13,170 10,517 6,209 20 24 (22,939) (7,781) (7,781)Interest expense 53,147 76,722 140,708 235,275 283,928 313,079 320,562 75,823 294,495 Exploration expenses, excluding dry hole costs 9,739 19,971 22,740 25,597 26,388 11,032 12,106 2,783 12,217 Litigation Settlement -- -- -- -- -- -- -- (59,600) (59,600)Gain on sale of assets, net 29,588 20,838 136,047 88 600 23,149 304,489 54,420 55,124 Tax benefit (deficiency) from stock-based compensation 5,230 -- 15,618 -- -- 13,177 (9,828) -- --Other, net (3,513) (4,606) (7,587) (1,829) (17,279) (10,044) (10,636) 723 (8,529)Changes in assets and liabilities 50,666 109,949 13,015 10,875 126,679 (228,622) 162,216 40,394 (1,415)EBITDAX (non-GAAP) $ 810,877 $ 1,303,959 $ 1,963,123 $ 2,839,510 $ 3,776,051 $ 1,978,896 $ 1,881,889 $ 837,887 $ 2,363,617
EBITDAX Reconciliation to GAAP
33

ADJUSTED Earnings Reconciliation to GAAP
34
Our presentation of adjusted earnings and adjusted earnings per share that exclude the effect of certain items are non-GAAP financial measures. Adjusted earnings and adjusted earnings per share represent earnings and diluted earnings per share determined under U.S. GAAP without regard to non-cash gains and losses on derivative instruments, property impairments, losses on certain litigation settlements, gains and losses on asset sales, losses on extinguishment of debt and the impact of U.S. tax reform legislation. Management believes these measures provide useful information to analysts and investors for analysis of our operating results. In addition, management believes these measures are used by analysts and others in valuation, comparison and investment recommendations of companies in the oil and gas industry to allow for analysis without regard to an entity’s specific derivative portfolio, impairment methodologies, and property dispositions. Adjusted earnings and adjusted earnings per share should not be considered in isolation or as a substitute for earnings or diluted earnings per share as determined in accordance with U.S. GAAP and may not be comparable to other similarly titled measures of other companies. The following table reconciles earnings and diluted earnings per share as determined under U.S. GAAP to adjusted earnings and adjusted diluted earnings per share for the periods presented.
4Q 2017 4Q 2016 YTD 2017 YTD 2016
In thousands, except per share data $ Diluted EPS $ Diluted EPS $ Diluted EPS $ Diluted EPS
Net income (loss) (GAAP) $ 841,914 $ 2.25 $ 27,670 $ 0.07 $ 789,447 $ 2.11 $(399,679) $ (1.08)Adjustments:
Non-cash (gain) loss on derivatives 7,450 51,612 (58,031) 156,621 Property impairments 27,552 34,564 237,370 237,292
Litigation settlement 59,600 -- 59,600 --
Gain on sale of assets (54,420) (201,315) (55,124) (304,489)Loss of extinguishment of debt 554 26,055 554 26,055 Total tax effect of adjustments(1) (15,335) 33,998 (69,358) (42,448)Tax benefit from US tax reform legislation (713,655) -- (713,655) --
Total adjustments, net of tax (688,254) (1.84) (55,086) (0.14) (598,644) (1.60) 73,031 0.20 Adjusted net income (loss) (Non-GAAP) $ 153,660 $ 0.41 $ (27,416) $ (0.07) $ 190,803 $ 0.51 $(326,648) $ (0.88)
Weighted average diluted shares outstanding 373,764 370,539 373,768 370,380Adjusted diluted net income (loss) per share (Non-GAAP) $0.41 $ (0.07) $0.51 ($0.88)
1. Computed by applying a combined federal and state statutory tax rate of 38% in effect for 2017 and 2016 to the pre-tax amount of adjustments associated with our operations in the United States other than the tax benefit adjustment related to US tax reform.

Cash G&A Reconciliation to GAAP
35
Our presentation of cash general and administrative (“G&A”) expenses per Boe is a non-GAAP measure. We define cash G&A per Boe as total G&A determined in accordance with U.S. GAAP less non-cash equity compensation expenses, expressed on a per-Boe basis. We report and provide guidance on cash G&A per Boe because we believe this measure is commonly used by management, analysts and investors as an indicator of cost management and operating efficiency on a comparable basis from period to period. In addition, management believes cash G&A per Boe is used by analysts and others in valuation, comparison and investment recommendations of companies in the oil and gas industry to allow for analysis of G&A spend without regard to stock-based compensation programs which can vary substantially from company to company. Cash G&A per Boe should not be considered as an alternative to, or more meaningful than, total G&A per Boe as determined in accordance with U.S. GAAP and may not be comparable to other similarly titled measures of other companies.
The following table reconciles total G&A per Boe as determined under U.S. GAAP to cash G&A per Boe for the periods presented.
2015 2016 4Q 2017 2017 2018 GuidanceTotal G&A per Boe (GAAP) $2.34 $2.14 $2.30 $2.16 $1.70 - $2.30Less: Non-cash equity compensation per Boe ($0.64) ($0.61) ($0.50) ($0.52) ($0.45) – ($0.55)Cash G&A per Boe (non-GAAP) $1.70 $1.53 $1.80 $1.64 $1.25 - $1.75

Calculation of Return on Capital Employed (ROCE)
36
In thousands, except per share data 2010 2011 2012 2013 2014 2015 2016 2017
Net income (loss) $ 168,255 $ 429,072 $ 739,385 $ 764,219 $ 977,341 $ (353,668) $ (399,679) $ 789,447 Impact from derivative instruments:
Total (gain) loss on derivatives, net 130,762 30,049 (154,016) 191,751 (559,759) (91,085) 67,099 (90,432)Total cash received (paid), net 35,495 (34,106) (45,721) (61,555) 385,350 69,553 89,522 32,401
Non-cash (gain) loss on derivatives, net 166,257 (4,057) (199,737) 130,196 (174,409) (21,532) 156,621 (58,031)
Provision (benefit) for income taxes 90,212 258,373 415,811 448,830 584,697 (181,417) (232,775) (633,380)
Non-cash equity compensation 11,691 16,572 29,057 39,890 54,353 51,834 48,097 45,868
Interest expense 53,147 76,722 140,708 235,275 283,928 313,079 320,562 294,495
Loss on extinguishment of debt -- -- -- -- 24,517 -- 26,055 554
Adjusted EBIT $ 489,562 $ 776,682 $ 1,125,224 $ 1,618,410 $ 1,750,427 $ (191,704) $ (81,119) $ 438,953
Total equity $ 1,208,155 $2,308,126 $ 3,163,699 $ 3,953,118 $ 4,967,844 $ 4,668,900 $4,301,996 $5,131,203Total long term debt 907,264 1,236,909 3,491,994 4,650,889 5,928,878 7,117,788 6,579,916 6,353,691Capital employed $ 2,115,419 $3,545,035 $6,655,693 $ 8,604,007 $10,896,722 $11,786,688 $ 10,881,912 $11,484,894
ROCE 23.1% 21.9% 16.9% 18.8% 16.1% -1.6% -0.7% 3.8%
The following table shows the calculation of ROCE: