investor roadshow - gaslog ltd a global leader in lng transportation 3 2001 international owner and...
TRANSCRIPT

Not For Redistribution
Investor Roadshow
February 2017
All statements in this presentation that are not statements of historical fact are “forward-looking statements” within the meaning of the U.S. Private Securities Litigation Reform Act of 1995. Forward-looking statements include statements that address activities, events or developments that the Company expects, projects, believes or anticipates will or may occur in the future, particularly in relation toour operations, cash flows, financial position, liquidity and cash available for dividends or distributions, plans, strategies and business prospects, and changes and trends in our business and the markets inwhich we operate. We caution that these forward-looking statements represent our estimates and assumptions only as of the date of this press release, about factors that are beyond our ability to controlor predict, and are not intended to give any assurance as to future results. Any of these factors or a combination of these factors could materially affect future results of operations and the ultimateaccuracy of the forward-looking statements. Accordingly, you should not unduly rely on any forward-looking statements.
Factors that might cause future results and outcomes to differ include, but are not limited to the following:
general LNG shipping market conditions and trends, including spot and long-term charter rates, ship values, factors affecting supply and demand of LNG and LNG shipping and technological advancements;
continued low prices for crude oil and petroleum products; our ability to enter into time charters with new and existing customers; Increased exposure to spot market and fluctuations in spot charter rates; changes in the ownership of our charterers; our customers’ performance of their obligations under our time charters; our future operating performance, financial condition, liquidity and cash available for dividends and distributions; our ability to obtain financing to fund capital expenditures, acquisitions and other corporate activities, funding by banks of their financial commitments, and our ability to meet our restrictive covenants
and other obligations under our credit facilities; future, pending or recent acquisitions of or orders for ships or other assets, business strategy, areas of possible expansion and expected capital spending or operating expenses; the time that it may take to construct and deliver newbuildings and the useful lives of our ships; number of off-hire days, drydocking requirements and insurance costs; fluctuations in currencies and interest rates; our ability to maintain long-term relationships with major energy companies; our ability to maximize the use of our ships, including the re-employment or disposal of ships not under time charter commitments; environmental and regulatory conditions, including changes in laws and regulations or actions taken by regulatory authorities; the expected cost of, and our ability to comply with, governmental regulations and maritime self-regulatory organization standards, requirements imposed by classification societies and standards
imposed by our charterers applicable to our business; risks inherent in ship operation, including the discharge of pollutants; availability of skilled labor, ship crews and management; potential disruption of shipping routes due to accidents, political events, piracy or acts by terrorists; potential liability from future litigation; any malfunction or disruption of information technology systems and networks that our operations rely on or any impact of a possible cybersecurity breach; and other risks and uncertainties described in the Company’s Annual Report on Form 20-F filed with the SEC on March 14, 2016 and available at http://www.sec.gov.
We undertake no obligation to update or revise any forward-looking statements contained in this press release, whether as a result of new information, future events, a change in our views or expectations or otherwise, except as required by applicable law. New factors emerge from time to time, and it is not possible for us to predict all of these factors. Further, we cannot assess the impact of each such factor on our business or the extent to which any factor, or combination of factors, may cause actual results to be materially different from those contained in any forward-looking statement.
The declaration and payment of dividends are at all times subject to the discretion of our board of directors and will depend on, amongst other things, risks and uncertainties described above, restrictions in our credit facilities, the provisions of Bermuda law and such other factors as our board of directors may deem relevant.
Forward-Looking Statements2

GasLog: A Global Leader In LNG Transportation3
2001 International owner and operator of LNG carriers since 2001 2017
~1,100 employees
onshore and on the vessels
GasLog Ltd.April 2012 IPO
GasLog PartnersMay 2014 IPO
$3.6 billion Q4 16 consolidated
revenue backlog
MonacoAthens
London
Busan (South Korea)
New York
28 VesselsConsolidated fleet
Singapore

Strategy Of Long Term Charters4
1. Charters may be extended for certain periods at charterer’s option. The period shown reflects the expiration maximum optional period. In addition, the charterer of the Methane Shirley Elisabeth, the Methane Heather Sally and the Methane Alison Victoriahas a unilateral option to extend the term of two of the related time charters for a period of either three or five years at its election. The charterer of the Methane Rita Andrea and the Methane Jane Elizabeth may extend either or both of these charters for one extension period of three or five years
2. The GasLog Skagen has a seasonal charter for the last 5 years of its firm period (each year: 7 months on hire, and 5 months opportunity for GasLog to employ)3. On February 24, 2016, GasLog completed the sale and leaseback of the Methane Julia Louise with Lepta Shipping Co., Ltd., a subsidiary of Mitsui Co. Ltd. GasLog Partners retains its option to purchase the special purpose entity that controls the charter
revenues from this vessel
Ship Built
Capacity
(cbm) 2017 2018 2019 2020 2021 2022 2023 2024 2025
GasLog Partners LP
GasLog Shanghai 2013 155,000 -
GasLog Santiago 2013 155,000 -
GasLog Sydney 2013 155,000 -
Methane Jane Elizabeth(1) 2006 145,000 -
Methane Alison Victoria(1) 2007 145,000 -
Methane Rita Andrea(1) 2006 145,000 -
Methane Shirley Elisabeth(1) 2007 145,000 -
Methane Heather Sally(1) 2007 145,000 - -
GasLog Seattle 2013 155,000 -
GasLog Ltd.
Methane Lydon Volney 2006 145,000 - -
GasLog Skagen(2) 2013 155,000 -
Solaris 2014 155,000 -
GasLog Geneva 2016 174,000 - - - - - - - - - - - - - - - - - - - - - - - - - - - - - - - -
GasLog Gibraltar 2016 174,000 - - - - -
Methane Becki Anne 2010 170,000 -
HHI Hull 2801 2018 174,000 -
Methane Julia Louise(3) 2010 170,000 - -
GasLog Greece 2016 174,000 -
GasLog Glasgow 2016 174,000 - - - - - - - - - - - - - - - - - - - - - - - - - - - - - - -
Hull No. 2212 2019 180,000 -
Hull No. 2130 2018 174,000 - - - -
Hull No. 2800 2018 174,000 - - - -
Hull No. 2131 2019 174,000 -
GasLog Ltd. Vessels in The Cool Pool
GasLog Singapore 2010 155,000
GasLog Chelsea 2010 153,600
GasLog Savannah 2010 155,000
GasLog Saratoga 2014 155,000
GasLog Salem 2015 155,000
Firm Charter Charterer Optional Period Under Discussions/Available

SELECTED Q416 RESULTS

6
2
2016: Execution Of Our Strategic Objectives
3 Participation In Two FSRU Opportunities By Year End
Delivery Of Four Newbuildings On-Time / On-Budget
1 Diversify Customer Base With New Charter Wins
4 Continue Dropdown Activity – Recycle Capital To GLOG
6 Maintain Dividend During Downturn
5 Re-Finance Near Term Debt Maturities
Financial Highlights7
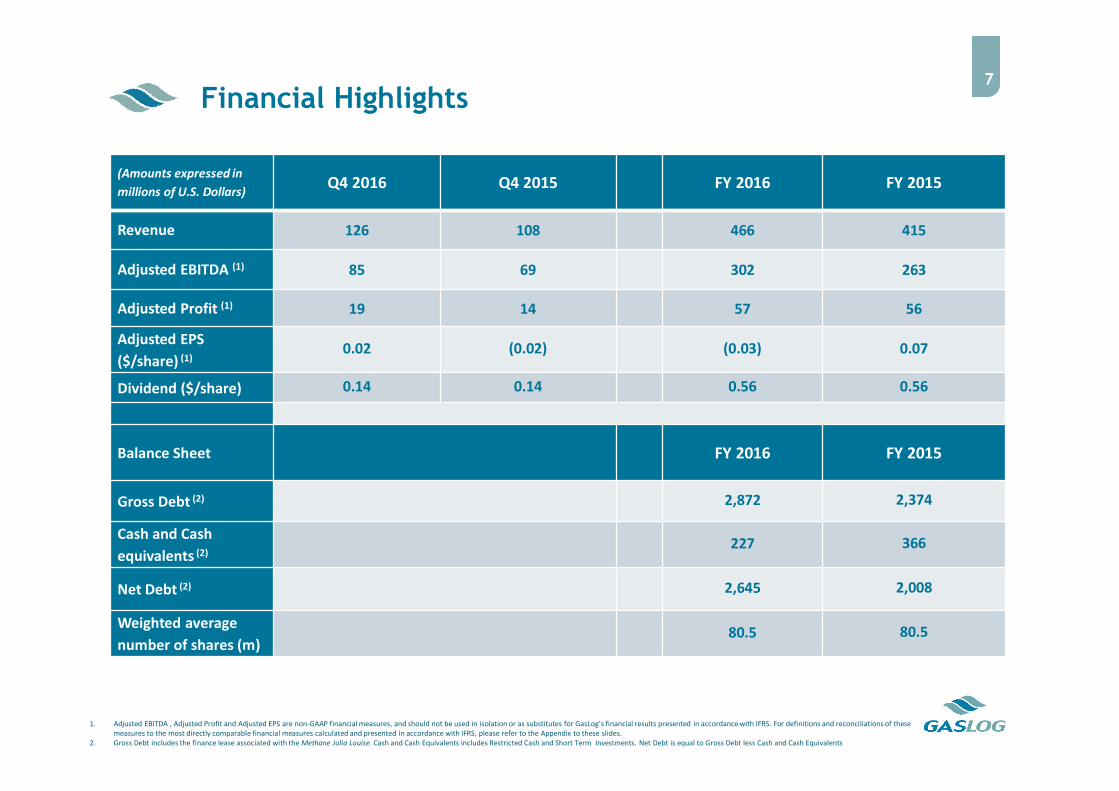
(Amounts expressed in
millions of U.S. Dollars)Q4 2016 Q4 2015 FY 2016 FY 2015
Revenue 126 108 466 415
Adjusted EBITDA (1) 85 69 302 263
Adjusted Profit (1) 19 14 57 56
Adjusted EPS
($/share) (1)0.02 (0.02) (0.03) 0.07
Dividend ($/share) 0.14 0.14 0.56 0.56
Balance Sheet FY 2016 FY 2015
Gross Debt (2) 2,872 2,374
Cash and Cash
equivalents (2)227 366
Net Debt (2) 2,645 2,008
Weighted average
number of shares (m)80.5 80.5
1. Adjusted EBITDA , Adjusted Profit and Adjusted EPS are non-GAAP financial measures, and should not be used in isolation or as substitutes for GasLog’s financial results presented in accordance with IFRS. For definitions and reconciliations of these measures to the most directly comparable financial measures calculated and presented in accordance with IFRS, please refer to the Appendix to these slides.
2. Gross Debt includes the finance lease associated with the Methane Julia Louise. Cash and Cash Equivalents includes Restricted Cash and Short Term Investments. Net Debt is equal to Gross Debt less Cash and Cash Equivalents
100
200
300
400
500
Q1 Q2 Q3 Q4 Q1 Q2 Q3 Q4 Q1 Q2 Q3 Q4 Q1 Q2 Q3 Q4
2017 2018 2019 2020
($m
)
Amortization Other Balloon Repayment NOK Bond Maturity
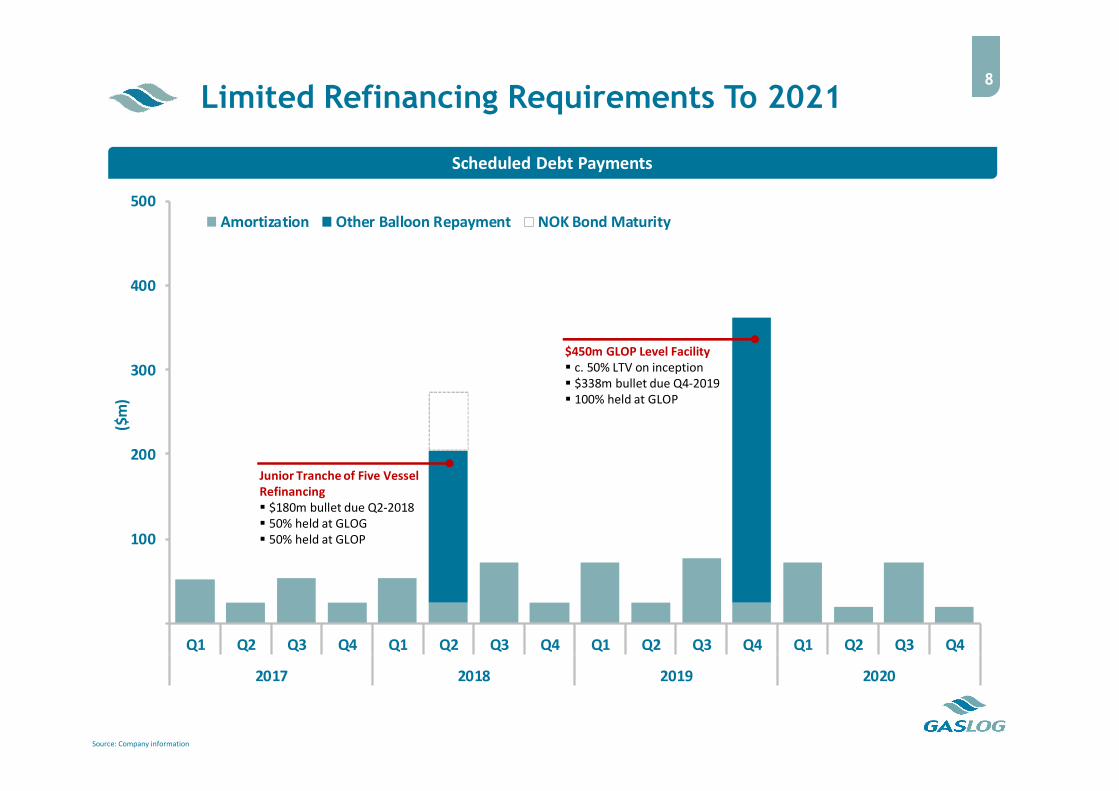
Limited Refinancing Requirements To 20218
Source: Company information
Scheduled Debt Payments
$450m GLOP Level Facility c. 50% LTV on inception $338m bullet due Q4-2019 100% held at GLOP
Junior Tranche of Five Vessel Refinancing $180m bullet due Q2-2018 50% held at GLOG 50% held at GLOP

9
Date November 1, 2016
Price $189 million, including $1 million of positive net working capital
Size / Propulsion 155,000 cbm / tri-fuel diesel electric (“TFDE”)
Time Charter Period December 2020 with Shell; Shell has two consecutive 5-year extension options
Estimated NTM EBITDA(1) $20 million
Multiple 9.4x Estimated NTM EBITDA(2)
Distribution Increase Per Unit Approximately 5% annualized
Dropdown Pipeline 13 Vessels (includes Centrica charter awarded during Q416)
Dropdown Of GasLog Seattle To GasLog Partners
1. For the first 12 months after the closing. Estimated NTM EBITDA and distributable cash flow are non-GAAP financial measures. Please refer to appendix for a definition of these measures2. Acquisition multiple is calculated using net purchase price of $188 million
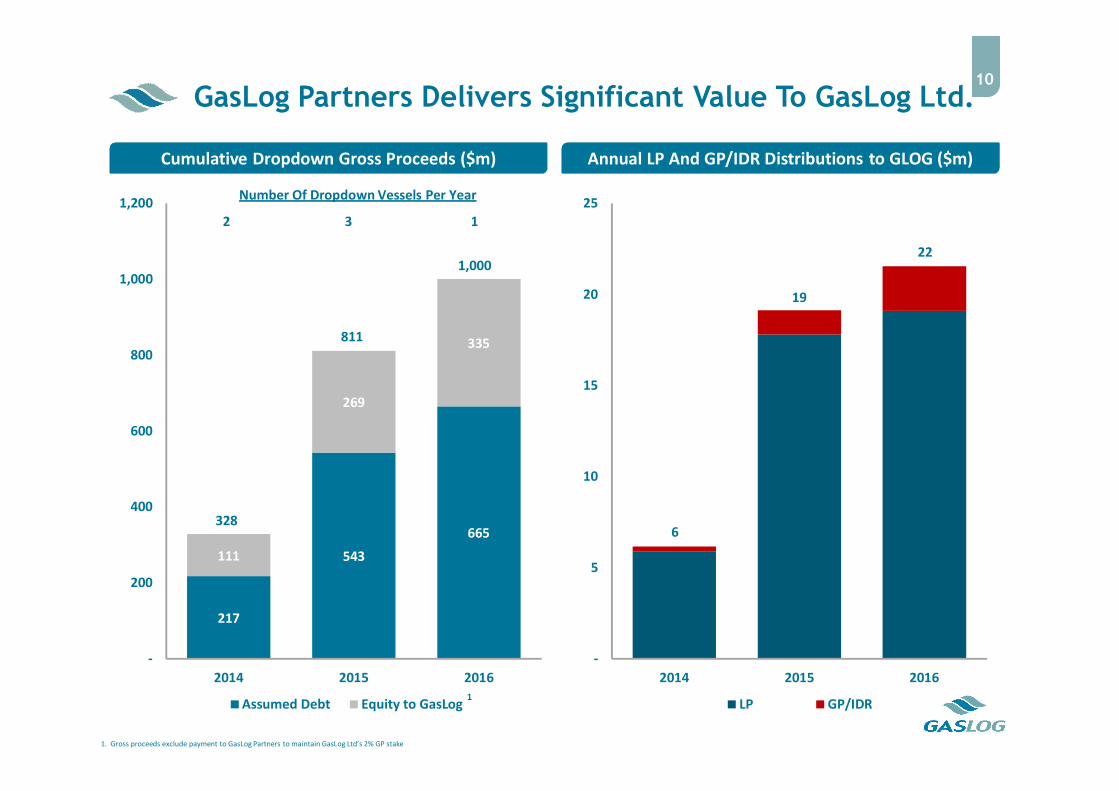
Number Of Dropdown Vessels Per Year
2 3 1
217
543
665
111
269
335
-
200
400
600
800
1,000
1,200
2014 2015 2016
Assumed Debt Equity to GasLog
-
5
10
15
20
25
2014 2015 2016
LP GP/IDR
GasLog Partners Delivers Significant Value To GasLog Ltd.10
Cumulative Dropdown Gross Proceeds ($m) Annual LP And GP/IDR Distributions to GLOG ($m)
1,000
811
3286
19
22
1. Gross proceeds exclude payment to GasLog Partners to maintain GasLog Ltd’s 2% GP stake
1
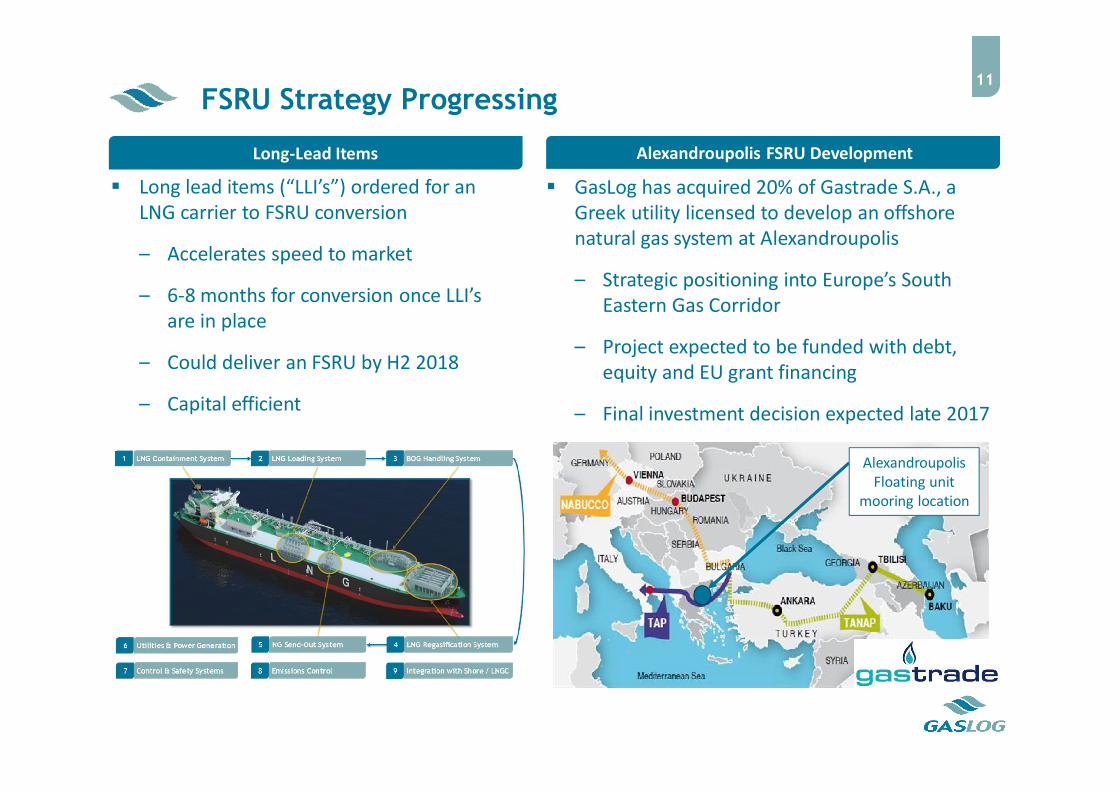
FSRU Strategy Progressing11
Alexandroupolis FSRU DevelopmentLong-Lead Items
Long lead items (“LLI’s”) ordered for an LNG carrier to FSRU conversion
– Accelerates speed to market
– 6-8 months for conversion once LLI’s are in place
– Could deliver an FSRU by H2 2018
– Capital efficient
GasLog has acquired 20% of Gastrade S.A., a Greek utility licensed to develop an offshore natural gas system at Alexandroupolis
– Strategic positioning into Europe’s South Eastern Gas Corridor
– Project expected to be funded with debt, equity and EU grant financing
– Final investment decision expected late 2017
Alexandroupolis Floating unit
mooring location

12
Improving Industry Fundamentals
1 Wave Of New LNG Supply Coming Online
4 Greater Trading Optionality Increasing Ton Miles And Ton Time
5 Multi-Year Low In Vessel Orders
2 Significant Increase In Demand From New & Existing Markets
6 Spot Rates Increasing (+54% YoY / +72% From 2016 Low)
3 FSRUs Opening Up New Demand Centres

0
30
60
90
120
150
0
2
4
6
Au
stralia
Pacific T
1
Au
stralia
Pacific T
2
Gla
dsto
ne
Sab
ine P
ass T1
Go
rgon
Ma
laysia
LNG
T9
Petro
na
s FLNG
1
Sab
ine P
assT2
Go
rgon T2
Go
rgon T3
Ichth
ys T1
Sab
ine P
ass T3
Sen
gkan
g LNG
Whe
atstone
T1
Cam
ero
n LN
G T1
Cam
ero
on
Go
FLNG
Co
ve Poin
t T1
Ichth
ys T2
Pre
lud
e FLNG
Sab
ine P
ass T4
Whe
atstone
T2
Elba
Island
Yam
al T1
Cam
ero
n T2
Cam
ero
n T3
Co
rpu
s Ch
risti T1
Free
po
rt T1
Free
po
rt T2
Sab
ine P
ass T5
Yam
al T2
Co
rpu
s Ch
risti T2
Free
po
rt Train T
3
Yam
al T3
Tanggu
h T3
Petro
na
s FLNG
2
Mill
ion
to
nn
es
pe
r a
nn
um
Mill
ion
to
nn
es
pe
r a
nn
um
2016 2017 2018 2019 2020 Cumulative (Right hand axis)
An LNG Train Every Two Months On Average (2016-20)13
Source: Wood Mackenzie; Poten
~146 million tons per annum of new FID’d liquefaction production coming online 2016-20
All LNG facilities due to start up in 2016 came online during the year
New LNG Supply By Project Start Date
2016 Facilities Operational 2017 Progress

US Volumes Expanding Ton Miles And Ton Time14
Source: Poten
60 shipments from Sabine Pass to 17 different countries
1.75 ships needed for every million tonnes of US exports, based on voyages so far
Applying the multiplier to yet-to-deliver US FID exports (53mtpa) would require 90+ ships
GasLog was the most active shipowner at Sabine Pass in 2016 transporting 8 cargoes
The number of cargoes imported in each country is highlighted
1
4
5
6
2
2
59
10
31
1
41
13
2
Country # Cargos Total Volume (Tonnes)Ave Laden
Duration (Days)
Equivalent # 160k m3
vessels Required Per MTPA
Argentina 6 366,357 23 1.73
Brazil 4 217,299 13 0.96
Chile 10 619,083 21 1.55
China 5 352,308 32 2.39
Dom. Republic 1 58,181 22 1.69
Egypt 1 75,561 27 2.03
India 5 347,240 28 2.13
Italy 1 67,899 16 1.21
Japan 3 222,205 28 2.08
Jordan 4 273,845 20 1.54
Kuwait 2 144,548 32 2.44
Mexico 9 629,751 16 1.22
Portugal 1 75,957 11 0.82
South Korea 2 139,502 33 2.49
Spain 2 119,779 17 1.26
Turkey 3 179,217 17 1.24
UAE 1 67,711 31 2.37
Totals 60 3,956,444 22.8
Volume Weighted Vessel Multiplier 1.75
Sabine Pass

Visible Demand For ~50 LNG Carriers Yet To Be Secured
Vessels yet to be secured are mainly offtakers of US LNG volumes
Requirements are expected to be filled with a combination of newbuildings and existing tonnage
Source: Wood Mackenzie
Additional Vessel Demand – Selected FID Liquefaction Projects Under Construction
15
2017 2018 2019 2020
43
12
2
4 4
12
32
7
-
2
4
6
8
10
12
14
Sabine PassPhase 2(2017)
WheatstoneLNG
(2017)
CameronLNG
(2018)
CameroonGoFLNG(2018)
Cove Point(2018)
YamalLNG
(2018)
CorpusChristi
LNG(2019)
FreeportTrain 1(2019)
Sabine PassTrain 5(2019)
FreeportTrain 3(2020)

16
Source: Poten
Five new LNG carrier orders placed since September 2015
LNG vessels take ~2.5 years to build: An order placed now likely delivers H2 2019+
Some vessel deliveries being pushed back to match project start-up dates
FiveNew LNG
Carrier OrdersSince Sep 2015
New LNG Carrier Orders Placed
New Vessel Orders Continue At Multi-Year Low
57
28
40
66
21
5 --
20
40
60
80
2011 2012 2013 2014 2015 2016 2017 YTD

173
273
0
50
100
150
200
250
300
350
2015 2016
The LNG Spot Market Is Growing And Evolving17
Spot Fixtures
Cool Pool Customers
The LNG shipping spot market continues to evolve as more spot cargoes become available
273 LNG shipping spot fixtures in 2016
– An increase of 53% over 2015 (173 fixtures)
– 88% over 2014 (146 fixtures)
~40 different charterers active in the spot market in 2016
– O&G majors, traders, and LNG projects have all been participants
– More participants expected in 2017
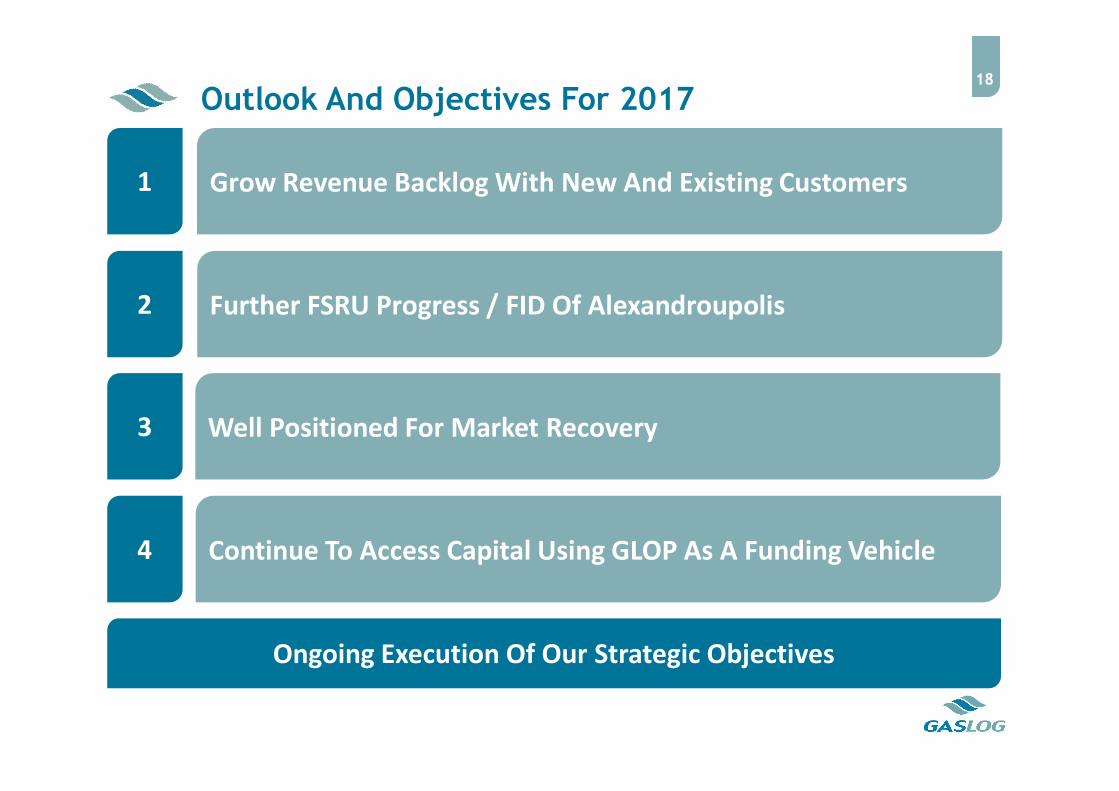
18
Outlook And Objectives For 2017
3 Well Positioned For Market Recovery
1 Grow Revenue Backlog With New And Existing Customers
4 Continue To Access Capital Using GLOP As A Funding Vehicle
2 Further FSRU Progress / FID Of Alexandroupolis
Ongoing Execution Of Our Strategic Objectives
FSRU

20
LITHUANIAKlaipeda (Hoegh)
UKRAINEOdessa
ISRAELHadra-buoy (Excelerate)
LEBANON
JORDANAqaba (Golar)
MALTA
ITALYLivorno (OLT)TritonFalconara
TURKEY
UKP Meridian-buoy
CANARY ISLANDS
BENIN
KENYA
SOUTH AFRICASaldhana BayRichards Bay
BRAZILPecem VT2 (Golar)Bahia Salvador VT1 (Golar)Guanabara Bay VT3 (Excelerate)
BRAZIL
CHILEMejillonesOctopus LNG (Hoegh) URUGUAY
Montevideo (MOL)
ARGENTINAEscobar (Excelerate)Bahia Blanca (Excelerate)
COLUMBIACartagena (Hoegh)
ARUBA
DOMINICAN REPUBLICSan Pedro de Macoris
PUERTO RICOAguirre
EL SALVADOR
PANAMA
JAMAICA
USANE Gateway-buoys (Excelerate)
MYANMAR
KUWAITAhmadi (Golar)
BAHRAINUAEDusup (Golar)Dusup (Excelerate)
PAKISTANPort Kasim (Excelerate)Port Kasim 2Port Kasim 3
INDIAJagradDigha
Kakinada Gangavaram
Ennore/ChennaiSRI LANKAHambantota
BANGLADESHMaheskhali x 2
CHINATianjin (Hoegh)
China 1China 2
PHILIPPINESTabangao Batangas Bay
MarivelesVIETNAMSon Mai
THAILAND
MARTINQUE/GUADELOUPE
GHANATema (Golar)G1000
MALAYSIAMelaka JRU (Petronas)
LNG floating terminals
In Operation Under Construction Planned or possible
EGYPTAin Sokhna x 2(Hoegh, BW Gas)
SENEGAL
MAURITIUS
IVORY COAST
NAMIBIA
INDONESIALampung (Hoegh)Jakarta Bay (Golar)Java 1CiilacapJava SaipemSmall Scale (9 or more)
GREECEAlexandroupolisCrete
HAWAII
KALININGRADGazprom
CROATIA
SINGAPORE
HONG KONG
Floating Storage And Regasification Units (“FSRUs”) To Open Up New Markets

0.0
4.0
8.0
12.0
16.0
20.0
MiddleEast
Africa Europe Americas Asia PacificM
illio
n t
on
ne
s p
er
ann
um
0.0
5.0
10.0
15.0
20.0
25.0
30.0
Supplydiversification
Reduce reliance onoil
Indigenousproduction
replacement
Mill
ion
to
nn
es
pe
r an
nu
m
FSRU: A Key Enabler For Emerging Market Demand21
New LNG Importers By 2025 – Demand By Key Driver New LNG Importers By 2025 – Demand By Region
7 markets
18markets
7 markets
27 markets
3markets
7markets
47markets
8markets
Source: Wood Mackenzie,
Wood Mackenzie predicts up to 60 additional LNG importing nations by 2025 (~35 importing nations in 2016)

20 - 22 months
250 – 750 mmscfd
145,000 – 170,000 m3
Time to market
Lower upfront capex
Candidates available
$70-90 million + vessel
Possible FSRU Opportunities For GasLog
28 - 32 months
500 – 1000 mmscfd
170,000 – 266,000 m3
Purpose built
Low technical risk
Compatible with newer tonnage
$250-300 million
22
Delivery Time
Conversion Newbuilding
Key Aspects
Capacity
Barge and FSU
18 months
100 – 750 mmscfd
20,000 – 170,000 m3
Built at most shipyards
Scalable as market grows
FSU candidates available
$60-80 million + FSU
Designed For
Protected sites0.5 – 1 mtpa
+ Calm sites2.0 – 3.5 mtpa
+ Harsh weather sites3.5 – 5.0 mtpa
Source: Company view
Cost

GASLOG PARTNERS

24Successful Execution Delivers Highest-Ever Quarterly Partnership Performance Results…
1. EBITDA and distributable cash flow are non-GAAP financial measures and should not be used in isolation or as a substitute for GasLog Partners’ financial results presented in accordance with IFRS. For definitions and reconciliations of these measures to the most directly comparable financial measures calculated and presented in accordance with IFRS, please refer to the Appendix to these slides
% Change from
Q4
2016
Q3
2016
Q4
2015
Q3
2016
Q4
2015
Revenues $56 $51 $52 9% 8%
EBITDA(1) $42 $37 $38 12% 9%
Distributable cash flow(1) $24 $21 $23 10% 4%
Cash distributions declared $20 $17 $16 14% 24%
Annualized cash distribution per unit $1.96 $1.91 $1.91 3% 3%
(In millions of USD, except per unit data)
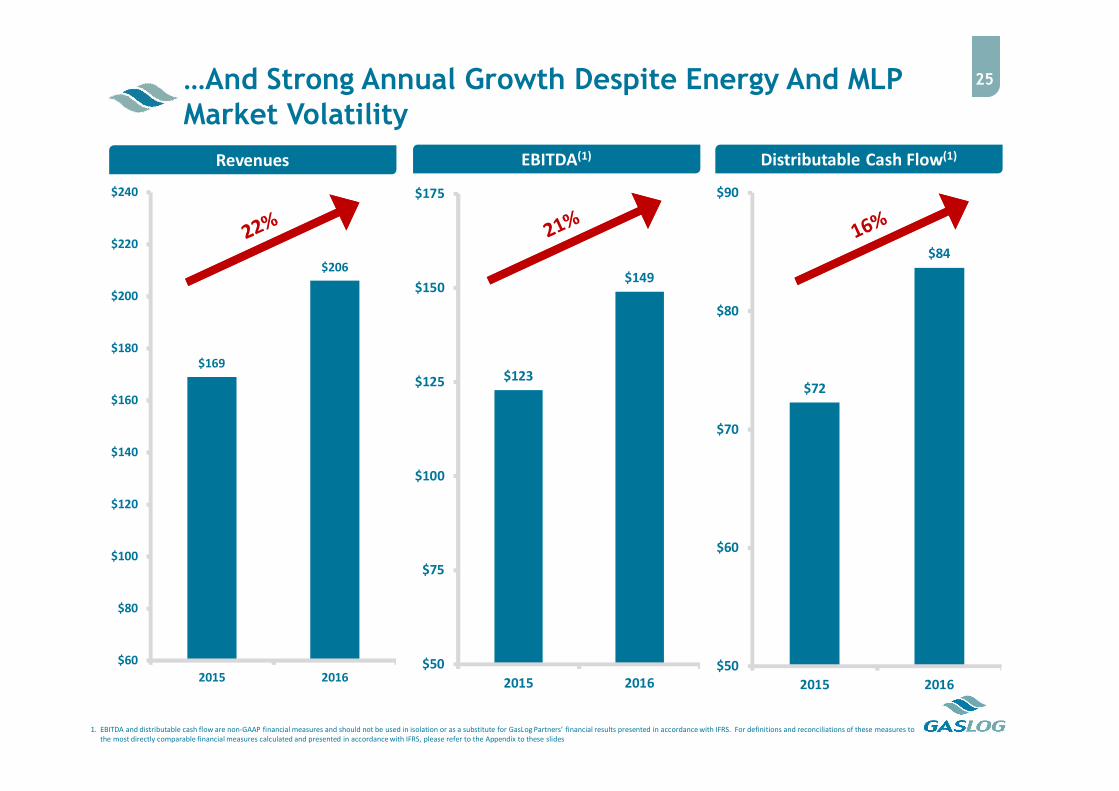
$169
$206
$60
$80
$100
$120
$140
$160
$180
$200
$220
$240
2015 2016
…And Strong Annual Growth Despite Energy And MLP Market Volatility
25
$123
$149
$50
$75
$100
$125
$150
$175
2015 2016
1. EBITDA and distributable cash flow are non-GAAP financial measures and should not be used in isolation or as a substitute for GasLog Partners’ financial results presented in accordance with IFRS. For definitions and reconciliations of these measures to the most directly comparable financial measures calculated and presented in accordance with IFRS, please refer to the Appendix to these slides
$72
$84
$50
$60
$70
$80
$90
2015 2016
EBITDA(1) Distributable Cash Flow(1)Revenues

26Substantial Liquidity And Strong Balance Sheet To Finance Additional Growth
Cash and Credit Metrics Adjusted For Equity Offering(1)
1. Adjusted for net proceeds from January 2017 equity offering, related GP unit issuance, and scheduled January 2017 debt amortization2. EBITDA is a non-GAAP financial measure and should not be used in isolation or as a substitute for GasLog Partners’ financial results presented in accordance with IFRS. For definitions and reconciliations of this measures to the most directly comparable
financial measures calculated and presented in accordance with IFRS, please refer to the Appendix to these slides3. Excludes amortization of loan fees
(In millions of USD)
Q4 2016
As Adjusted
Cash and cash equivalents $119
Credit Metrics
Total Debt / Total Book Capitalization 53%
Net Debt / EBITDA(2)
(annualized) 4.1x
EBITDA(2)
(annualized)/ cash interest expense(3)
(annualized) 5.2x

$1.50
$1.96
$1.00
$1.20
$1.40
$1.60
$1.80
$2.00
$2.20
Q22014
Q42016
$1.69
$2.28
$1.00
$1.20
$1.40
$1.60
$1.80
$2.00
$2.20
$2.40
$2.60
Q22014
Q42016
Track Record Of Growing Cash Flows And Meeting Distribution Guidance
27
1. Distributable cash flow is non-GAAP financial measure and should not be used in isolation or as a substitute for GasLog Partners’ financial results presented in accordance with IFRS. For a definition and reconciliation of this measure to the most directly comparable financial measure calculated and presented in accordance with IFRS, please refer to the Appendix to these slides
Annualized Distributable Cash Flow(1) Per Unit Annualized Cash Distribution Per Unit

28
1. On February 24, 2016, GasLog completed the sale and leaseback of the Methane Julia Louise with Lepta Shipping Co., Ltd., a subsidiary of Mitsui Co. Ltd. GasLog Partners retains its option to purchase the special purpose entity that controls the charter revenues of this vessel
2. The vessel is chartered to Total Gas & Power Chartering Limited, a subsidiary of Total3. The vessel is chartered to Pioneer Shipping Limited, a subsidiary of Centrica plc
Dropdown Pipeline
13 Vessel Dropdown Pipeline Provides Visibility For Cash Distribution Growth

$1.50
$2.09
$0.00
$0.25
$0.50
$0.75
$1.00
$1.25
$1.50
$1.75
$2.00
$2.25
$2.50
$2.75
Q22014
Q42017E
$1.50
$2.00
$0.00
$0.25
$0.50
$0.75
$1.00
$1.25
$1.50
$1.75
$2.00
$2.25
$2.50
$2.75
Q22014
Q12017E
Recent Equity Financing Supports Distribution Guidance For 2017
29
Annualized Distribution Per Unit to Q1 2017E Annualized Distribution Per Unit to Q4 2017E
$2.09Or GreaterApproximately
$2.00

APPENDIX
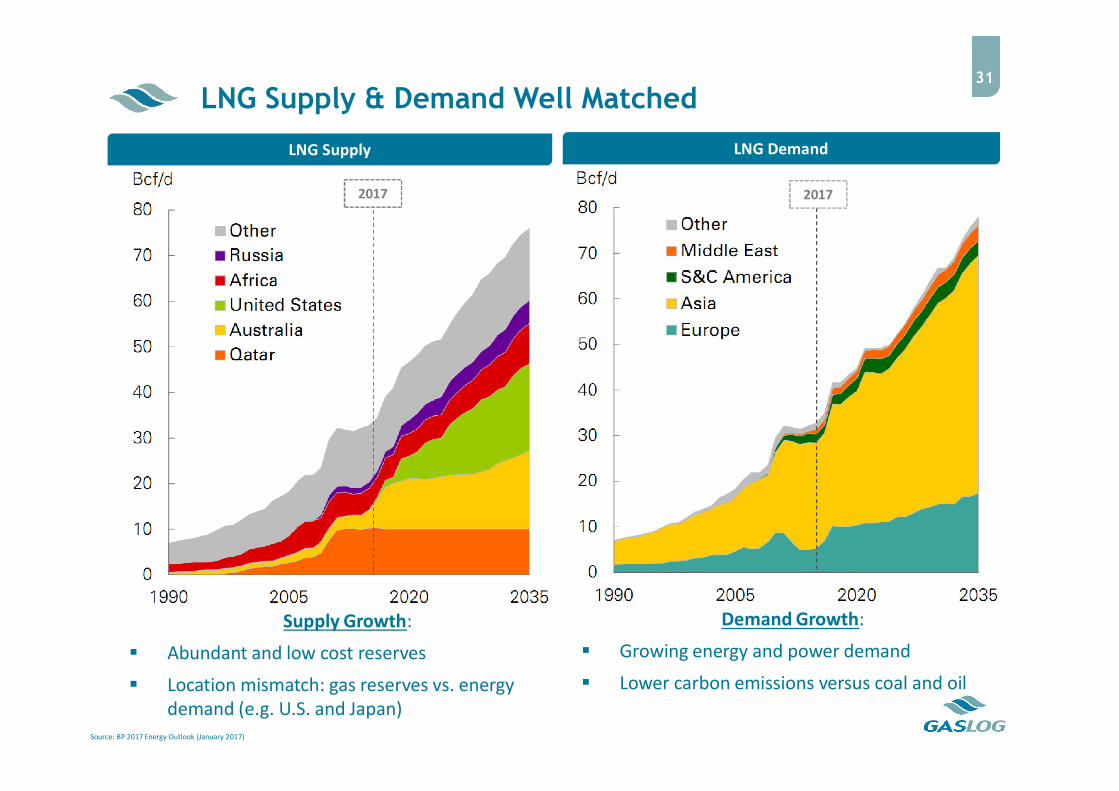
LNG Supply & Demand Well Matched31
Source: BP 2017 Energy Outlook (January 2017)
Supply Growth:
Abundant and low cost reserves
Location mismatch: gas reserves vs. energy demand (e.g. U.S. and Japan)
Demand Growth:
Growing energy and power demand
Lower carbon emissions versus coal and oil
LNG Supply LNG Demand
2017 2017

-
10
20
30
40
50
60
70
2006 2016 2026
Nu
mb
er
of
LN
G I
mp
ort
ing
Na
tio
ns
Number Of Importers Expected To Rise Sharply32
LNG is becoming an increasingly attractive alternative to coal and oil (climate/emissions targets)
Significant increases in LNG demand from China (+40%) and India (+29%) in 2016
New importers in the last 2 years: Poland, Lithuania, Pakistan, Jordan, Egypt, Columbia, Jamaica
Expected importers in the near future include Bahrain, South Africa, Bangladesh etc.
Source: Wood Mackenzie; Poten
Already Identified
Risked potential
LNG Importing Countries

0
50
100
150
200
250
300
Dec-70 Dec-75 Dec-80 Dec-85 Dec-90 Dec-95 Dec-00 Dec-05 Dec-10 Dec-15 Dec-20
Cap
acit
y (c
bm
)
Delivery Date
Global Fleet (excl. GasLog) GasLog Fleet
Global Fleet Evolving With New Technology33
Source: Wood Mackenzie, Company information
Ship technology continues to evolve with vessels increasing in size and becoming more efficient with lower boil off
Major technological advancements since 2000 (steam / modern steam / TFDE / MEGI / XDF)
A number of older vessels have been scrapped (8 vessels in 2014-16) or put into layup
“First Generation” Steam VesselsBuilt pre-2000
Global LNG Fleet Including Firm Newbuild Order Pipeline
$0
$25
$50
$75
$100
$125
$150
$175
$200
$225
Q1 Q2 Q3 Q4 Q1 Q2 Q3 Q4 Q1 Q2 Q3 Q4 Q1 Q2 2H
2016 2017 2018 2019
Incr
eme
nta
l EB
ITD
A (
$m)
HullNo. 2073
HullNo. 2102
HullNo. 2103
HullNo. 2130
HullNo. 2801
HullNo. 2800
HullNo. 2072
HullNo. 2131
HullNo. 2212
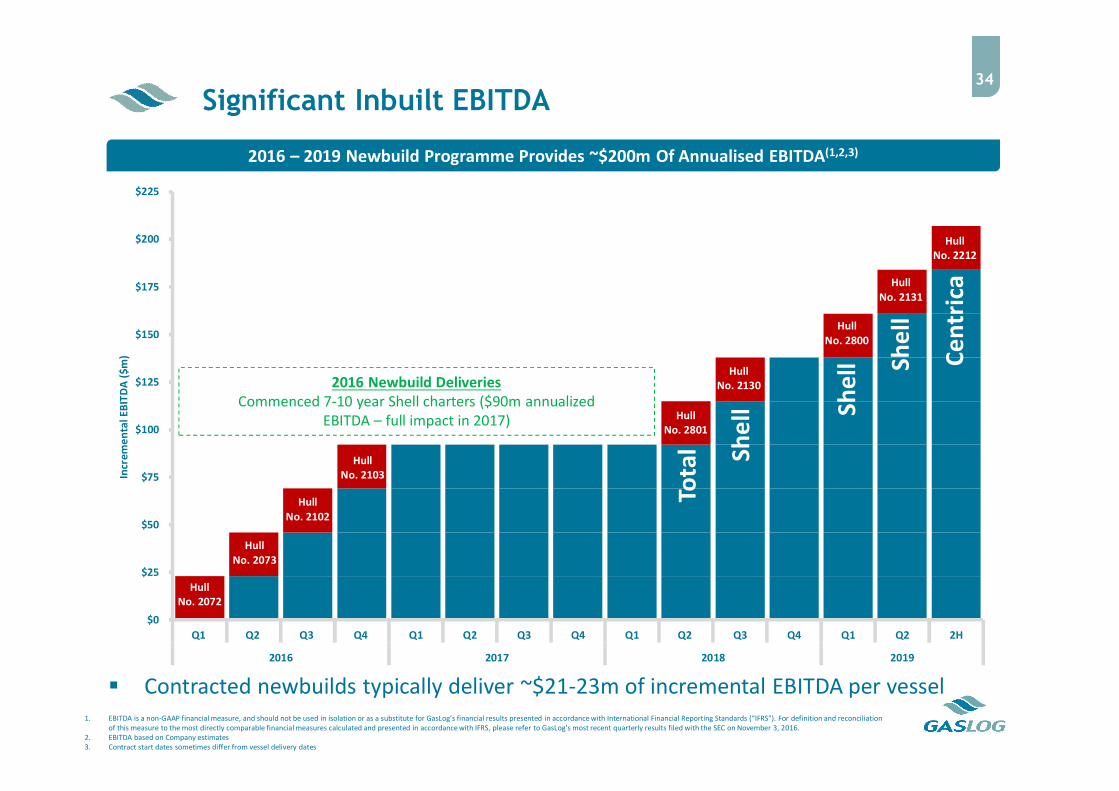
Significant Inbuilt EBITDA34
2016 – 2019 Newbuild Programme Provides ~$200m Of Annualised EBITDA(1,2,3)
1. EBITDA is a non-GAAP financial measure, and should not be used in isolation or as a substitute for GasLog’s financial results presented in accordance with International Financial Reporting Standards (“IFRS”). For definition and reconciliation of this measure to the most directly comparable financial measures calculated and presented in accordance with IFRS, please refer to GasLog’s most recent quarterly results filed with the SEC on November 3, 2016.
2. EBITDA based on Company estimates3. Contract start dates sometimes differ from vessel delivery dates
2016 Newbuild DeliveriesCommenced 7-10 year Shell charters ($90m annualized
EBITDA – full impact in 2017)
Tota
l She
ll She
ll She
ll
Ce
ntr
ica
Contracted newbuilds typically deliver ~$21-23m of incremental EBITDA per vessel

-
100
200
300
400
500
-
100
200
300
400
500
Q4 Q1 Q2 Q3 Q4 Q1 Q2 Q3 Q4 Q1 Q2 Q3 Q4
2016 2017 2018 2019
Cu
mu
lati
ve P
aym
ents
Fro
m C
ash
($
m)
Cap
ital
Pay
me
nts
In-Q
ua
rte
r ($
m)
Payments From Cash
Anticipated Debt Financing
Committed Debt Financed
Cumulative Payments From Cash
Capital Expenditure35
SHI Hull 2212: Centrica NewbuildTo be funded through
bank debt(1) and balance sheetcash / dropdown proceeds
Good appetite from banks to fund the debt element of the Centrica vessel
The equity will be funded by operational cashflow and/or dropdown proceeds
1. Illustrative leverage of 70%
Future Committed Capital Expenditure