investor relations, information asymmetry and … relations, information asymmetry and market ......
TRANSCRIPT

1
Investor relations, information asymmetry and market value
Vineet Agarwal (Cranfield School of Management)
Xijuan Bellotti (Independent)
Richard J. Taffler* (Warwick Business School)
Elly A. Nash (Independent)
Version: 12.1
7 January 2014
*Corresponding author: Richard Taffler
Professor of Finance and Accounting Warwick Business School University of Warwick
Warwickshire CV4 7AL
Tel: + 44 (0) 2476 524153 Fax: + 44 (0) 2476 150376
E-mail: [email protected]
1
Investor relations, information asymmetry and market value
Abstract
Evidence to date on the market value of investor relations (IR) strategies is limited. We test
the market relevance of IR activity directly employing a proprietary database measuring
investor relations quality across all firms listed on NYSE, Amex and NASDAQ. Although, in
theory, “repackaging” and communicating existing information should have no market
impact, we find firms with higher quality IR strategies are rewarded with significantly higher
valuation multiples. In addition, increase in IR quality is associated with increases in analyst
following and liquidity. Overall, our findings are strongest for smaller firms which are more
likely to be ‘neglected’. Our evidence is consistent with good IR successfully raising firm
visibility leading to enhanced recognition and reduced information asymmetry in line with
Merton (1987) and thus “fairer” firm valuation as argued by IR professionals.
Keywords: firm valuation, market pricing, investor recognition, investment analysts, stock liquidity
JEL classification: G14, G34

2
Investor relations, information asymmetry and market value
1. Introduction
Firm investor relations programmes seek to raise a company’s profile and familiarity with
fund managers and institutional investors and enhance the credibility of its management, as
well as attracting investment analysts to follow the firm (Marston, 2004; 2008). Wide
visibility, large institutional holding and a significant analyst following, it is argued, should
lead to an increased demand for a firm’s securities and thus enhanced market value,
particularly in the case of medium size and smaller firms (Lev, 2012, p. 53). On the other
hand, in perfect markets, there is no justification for expenditure that increases firm visibility
without providing new information relevant to investors in valuing of the firm. Simply
“repackaging” and communicating existing disclosures should have no incremental value
and, in fact, if the cost is significant, adversely impact market value. Hong and Huang (2005)
and Doukas, Kim and Pantzalis (2005;2008) even suggest that increasing firm liquidity and
analyst coverage, main goals of investor relations programmes (Brennan and Tamarowski,
2000), may well be detrimental to shareholder interests.
There have been relatively few studies to date that focus directly on the market
relevance of investor relations programmes and empirical evidence of a clear link between a
firm’s investor relations activity and its market pricing is limited and conflicting. This study
sets out to provide more definitive evidence on whether investor relations activity is value
relevant or not in practice and if so, its actual market impact. In particular, we are able to
draw on a proprietary database of IR quality ratings which allows us to measure industry
perceptions of investor relations quality directly for all firms listed on the NYSE, Amex and
NASDAQ. This database consists of all nominations by fund managers and investment
analysts for ‘best overall IR’ awards in the annual IR Magazine survey.

3
Most studies exploring the value relevance of IR activity to date employ the
Association of Investment Management Research Corporate Information Committee (AIMR)
firm disclosure quality ratings which are available from 1979 to 1996 and cover around 400
firms a year. Although separate quality ratings for the firm’s10-K, quarterly published
information and its investor relations programme are provided, most studies concentrate on
the composite disclosure score to which its IR component only contributes 20 – 30%.1
In an early study employing the AIMR total disclosure score ratings, for example,
Healy, Hutton and Palepu (1999) find that 97 stocks “with sustained and material increases in
disclosure ratings” over a 3-year period earned industry-adjusted returns of approximately
8.4% over the following year. On the other hand, using the same survey data Botosan and
Plumlee (2002) find no significant relationship between firms’ overall AIMR corporate
communications ratings and cost of equity capital, nor for its investor relations component
separately.
In a recent paper, Jiao (2011) considers the relationship between the separate AIMR
rating components and different measures of corporate performance, including stock returns
and Tobin’s Q, proxying for market valuation. In particular, she reports that a hedge portfolio
which goes long in firms with above median AIMR rankings for their IR programmes and
short in those with below median rankings, earns a mean return of 4.3% each year from
January 1982 to December 1996. However, since Jiao (2011) uses the AIMR ratings at the
end of year t to form portfolios at the beginning of year t, 2 she is, in effect, measuring prior
year returns rather than subsequent year returns. Jiao (2011) also reports that firms with IR
rankings above the median have Tobin’s Q 45% higher than those ranked below the median.
In a similar way, though it is not clear when her Tobin’s Q is calculated, if this is on the same
1 All four AIMR measures are highly correlated which would also be consistent with a “halo” effect operating in
the different AIMR industry committees’ rating judgments (Brown and Hillgeist, 2007; Haggard, Martin and
Pereira, 2008; Jiao, 2011). 2 See her p. 652 and p. 658 as well as footnote 16.

4
basis as her book-to-market ratio (p.652), then she is, in fact, showing that firms with higher
Tobin’s Q subsequently have higher IR rankings, not the other way around. Thus, it is
difficult to use her results to argue that firms with good IR earn higher subsequent returns, or
that their market value is greater, leaving the question of the market value of IR activity
unresolved.
Chang et al. (2008) study the relationship between firms’ investor relations activity
proxied by internet-based disclosure and information asymmetry. They report that firms with
better disclosure scores have higher analyst following, lower bid-offer spreads and higher
market capitalisation. However, the investor relations function is much broader tha n website
information disclosure alone. Also, the authors collect their disclosure information for three-
weeks in the middle of July 2005 while their proxies for information asymmetry are
measured over calendar year 2005. Therefore, their study is likely to suffer from the same
inference problems as those of Jiao (2011).
More pertinently, Bushee and Miller (2012), using data between 1998 and 2004, show
that initiating IR programmes by hiring external IR agencies is associated with a significant
increase in level of firm disclosure, media coverage and analyst following, as well as a larger
and more geographically diversified, institutional ownership.3 In addition, there is a rise in
the market-to-book ratio proxying for firm valuation effects. However, their sample is
restricted to 210 typically very small firms, 50% of which are traded on the OTC Bulletin
Board and Pink Sheets. Thus, it is not clear that Bushee and Miller’s findings can be
generalised to shed light on the value of established IR programmes of larger and more
mature firms. Although in a parallel study, Vlittis and Charitou (2012) use a sample of 146
firms listed on the main US exchanges that also initiate IR programmes and report similar
results to Bushee and Miller (2012) their sample firms are still limited in size (median market
3 Solomon (2012) also shows that firms that employ specialist IR firms generate more positive news stories and
associated event-day returns. However, there is no evidence that such firms suppress unfavourable stories. In
the case of earnings announcements, “spin” has no impact.

5
cap of $74m). Again, it is not possible to use their results to draw conclusions about the
impact of well-developed and on-going IR activities on firm value.
On the other hand, in an interesting recent paper in this journal, Peasnell, Talib and
Young (2011) test the proposition that investor relations activities help shield firms from the
adverse consequences of challenges to corporate credibility associated with high-profile
scandals, such as Enron. The authors compare a sample of 122 firms deemed to have
effective investor relations programmes by IR Magazine survey respondents with matched
firms not so rated in terms of contagion effects measured by stock price falls and other
variables typically associated positively with IR activity. Contrary to expectations, Peasnell et
al. (2011) report their high IR quality firms suffer larger stock price falls and more
pronounced declines in press coverage, trading volume and analyst following relative to their
control firms at the time of the Enron bankruptcy and as associated events unravelled during
2001 – 2002. The authors draw on these findings to question whether best practice investor
relations programmes necessarily protect firms by maintaining trust and confidence in them,
at least during periods of corporate scandal.
Our study seeks to test directly the value of firm IR programmes along a number of
different dimensions and provide more conclusive evidence on the actual market value of
investor relations activity across the generality of firms listed on the main US exchanges. It
adds to the limited extant literature directly addressing this research question in terms of the
source and characteristics of our IR quality rankings and our research design. In addition,
given the size of our sample, we are able to address additional research questions and adopt a
much richer valuation modelling approach than with the extant literature.
In particular, we draw on Merton’s (1987) Inves tor Recognition Hypothesis to test
whether if a company’s investment in investor relations activity raises its profile with market

6
participants then firm value will be enhanced, as the investor relations industry argues.
Specifically, we explore
(i) whether good IR is associated with increased analyst coverage (a key IR
constituency),
(ii) whether effective IR, proxied by being nominated for an IR Magazine ‘best
overall IR’ award, enhances firm liquidity,
(iii) the impact of investor relations on firm market value, and finally
(iv) whether such results are likely to be most pronounced in the case of smaller,
less followed, firms as Merton (1987) suggests.
First we find, not surprisingly, the more analysts reporting on the firm the more
nominations for ‘best overall IR’ award the firm receives in the following year. However,
more importantly, increase in IR quality is directly associated with significantly higher
analyst coverage and again, this is particularly prominent in the case of smaller firms.
Specifically, large firms that move from having no ‘best overall IR’ nominations to being
nominated at least once in the following year are associated with an increase in analyst
coverage in the following year of 15% compared with firms not so rated, with the equivalent
figures for smaller firms 59%, although from a lower base. We also demonstrate liquidity, as
measured by relative stock turnover, increases by 21.5% for smaller firms newly nominated
at least once for ‘best overall IR’ awards, compared with those that remain not rated.
Finally and of most interest, contrary to Hong and Huang (2005) and Doukas et al.
(2005; 2008), we show that, ceteris paribus, firms nominated for ‘best overall IR’ awards in
the annual IR Magazine survey are valued more highly by the market than those with no
survey votes, and there is also a positive relation between IR rank and market valuation for
those that are nominated. Importantly, we are able to demonstrate our results are robust to
model misspecification problems resulting from potential endogeneity issues.

7
The proprietary database we use, provided by IR Magazine, covers all firms
nominated by security analysts and fund managers for ‘best overall IR’ in the annual IR
Magazine awards surveys for 2000 to 2002.4 Most previous studies, including Jiao (2011),
use the AIMR disclosure ratings which end in 1996 and only cover a relatively small number
of large firms. Unfortunately, the data we use was not available to us outside our observation
period. Nonetheless, we believe our results are still of considerable interest. This is not just
because of the nature of our original findings, but also our 2000 -2002 observation period is
one of challenging market conditions following the bursting of the dot.com bubble in March
2000 and includes September 11 and thus is of interest in its own right.5 Also, our data period
largely postdates the implementation of Regulation Fair Disclosure in October 2000 which
prevented investment analysts having privileged access to price-sensitive information from
firm management thus, potentially, strengthening the importance of investor relations to the
firm as fund managers and analysts no longer have a privileged direct access to management,
a key source of information for them in their investment decisions (Fogarty and Rogers,
2005; Barker et al, 2012; Tuckett and Taffler, 2012). However, it goes without saying care
needs to be taken in generalizing our results outside our observation period.
In summary, we find results consistent with the arguments of Merton (1987) about the
impact of greater investor recognition on firm market value. Effective IR strategies,
represented by nomination for IR Magazine ‘best overall IR’ awards by market professionals,
appear to be rewarded by the stock market, especially in the case of smaller, less followed,
firms.
4 In contrast with Peasnell et al. (2011), who work exclusively with the subset of named award winning and
honorary mention firms which meet their data requirements from the same data source we use, we are able to
work with all firms nominated for ‘best overall IR’, whether award winners or not. 5 Peasnell et al. (2011), broadly speaking, cover a similar t ime period in their study.

8
The rest of the paper is organised as follows: section 2 presents our predictions, data
and method, section 3 presents our results and section 4 summarises our findings and
concludes.
2. Predictions, data and method
This section predominantly draws on Merton’s (1987) Investor Recognition Hypothesis
model to generate our predictions about the potential impact of good investor relations
programmes on analyst coverage, stock liquidity and market value as well as the expectation
that such relationships will be stronger for smaller, less well- followed firms. It then discusses
our firm data and our modeling approach.
The underlying assumption of Merton’s (1987) capital market equilibrium model is
that when constructing their optimal portfolios, investors only use the securities they know
about. Hence a “neglected” or less visible stock will have a higher required return to
compensate investors for the “set up” cost associated with following a new security. In
parallel, a firm information release will only be picked up by an investor who already follows
the stock unless the disclosure “generates a headline”. On this basis, Merton (1987) argues,
(i) better followed firms will have, ceteris paribus, higher valuations and (ii) the impact of
investor recognition will be greater for smaller firms. In fact, a number of recent papers (e.g.,
Lehavy and Sloan, 2008; Bodnaruk and Ostberg, 2009; Richardson, Sloan and You, 2012)
provide strong empirical support for Merton’s asymmetric information-based model and
show that investor recognition can help explain stock prices. A key purpose of IR activity is
increasing investor recognition of the firm. Thus, following Merton (1987), if an investment
in investor relations activity serves to raise a firm’s profile with market participants, then we
predict firm value will be greater, the key proposition this paper seeks to test. On the other
hand, if firms are already well-known and followed, then investment in investor relations

9
may have little incremental value and in fact could even lead to reduced firm valuation if
costs are significant (e.g., Hong and Huang, 2005; Doukas et al., 2005; 2008).
2.1 Predictions
Investment analysts are a key target audience for firm investor relations act ivity
(Brennan and Tamarowski, 2000; Guimard, 2013). Good IR should lower the cost of analyst
information gathering and raise the firm’s profile with investors (Merton, 1987) thereby
creating higher demand for analyst coverage of firms with better IR. Our first prediction is
thus:
Prediction 1: Effective IR will be associated with increased analyst coverage of the firm
In parallel, if investor relations activity serves to reduce information asymmetry
between the firm and investors, then any associated risk should be reduced leading to
increased stock liquidity. Our second prediction is thus:
Prediction 2: Effective IR leads to an increase in stock liquidity
Hong and Huang (2005) argue that the benefits of increased liquidity from investor
relations activity flow to large shareholders disproportionately, while the costs are shared by
all shareholders. As a consequence, insiders overinvest in investor relations leading to a
reduction in firm value. In a similar vein, Doukas et al. (2005; 2008) find that firms with
excessive analyst coverage are overvalued and generate lower future returns due to analyst
overoptimism. As such, investor relations strategies aimed at increasing analyst coverage will
also be market relevant, but in this case value destroying. Consequently, improving stock
liquidity and raising analyst coverage, both important targets of investor relations
professionals, may not lead to increased market value, but possibly even the opposite.
The National Investor Relations Institute (NIRI) views IR, inter alia, as enabling
“…the most effective two-way communication between a company, the financial community

10
and other constituencies, which ultimately contributes to a company’s securities achieving
fair valuation.” (NIRI Annual Report, 2009).6 Hence, if investor relations is effective in
enhancing investor communication and thus increased firm transparency to investors leading
to reduced risk, then we would expect good IR to be viewed favourably by the market. Thus,
if as investor relations professionals argue, information asymmetry for investors is reduced
by their activities, then we would expect reduced cost of capital as manifested by higher firm
market value.7 On this basis we establish our third prediction to be tested:
Prediction 3: Effective IR has a positive impact on firm market valuation ratios
Merton’s (1987) information asymmetry-based arguments lead to the conclusion that
the benefits of effective IR will be greater for firms with higher information asymmetry
between managers and investors and large and small stockholders (Brown and Hillgeist,
2007). Such firms are likely to be smaller and less well- followed by analysts, investors and
the media. On this basis we set up our final prediction:
Prediction 4: Effective IR will have a greater impact on smaller firms than larger firms.
2.2. Data
Each year, the IR Magazine commissions an independent research firm to obtain
nominations from investors and analysts for firms listed on the main US exchanges that have
performed the ‘best’ in distinct categories of IR over the previous 12 months. In the case of
our observation period covering the 2000, 2001 and 2002 surveys, nominations were
collected from the universe of fund managers and sell and buy-side analysts listed in the
Thomson Financial/Carson and WILink databases supplemented with a number of
6 Lev (2012, pp. 57-60) provides “operating instructions” for a good IR communications strategy.
7 Informat ion asymmetry does not lead to lower valuations in every case. Some firms might, in fact, be
overvalued (Jensen, 2005). Hence, achieving fair value does not mean firm market value will be greater in all
cases. However, on average, firms suffering from information asymmetry are likely to be undervalued.

11
sophisticated individual investors reached via Barron’s Online.8 Respondents covered a wide
range of investment specialisations and industry sectors and were encouraged to nominate
firms outside their specialities. The nomination collection process took place during January
and early February via e-mail and telephone using a formal survey questionnaire approach
with two follow-ups in the case of non-response. Results were published around the end of
March each year at the annual IR Magazine award ceremony. Questions covered a range of
IR categories and other issues and respondents were asked to nominate three firms for each
IR category, best and first and second runner-up.9An average of 1,746 investment
professionals responding to each of the three surveys, representing a 12% response rate.
Considering the 2001 survey, for example, 35% of respondents were fund managers, 25%
buy-side analysts, 28% sell-side analysts and 12% sophisticated retail investors.
Clearly our results depend on how reliable the underlying subjective survey data we
use is in reflecting actual firm IR quality. However, the surveys were conducted by a well-
known and highly reputable research firm with extensive experience in this area and the
completeness of our data, the very acceptable response rates and large number of respondents
from a wide range of backgrounds serves to provide some assurance that we are capturing the
perceptions of investment professionals, the main targets of IR departments, about the quality
of individual firm investor relations programmes.
Our sample consists of all firms with equity traded on the NYSE, Amex or NASDAQ
for some or all of our observation years meeting necessary data availability requirements and
eligible to be nominated for ‘best overall IR’ awards. Stock returns, market values and
trading volumes are extracted from the Center for Research in Share Prices (CRSP) database.
Book value of equity and net income are from COMPUSTAT and analyst coverage is
8 Data for other survey years was unfortunately not available to us.
9 We treat all nominations equally in our analysis.

12
obtained from the Thomson Financial I/B/E/S database. All accounting data is lagged six
months from fiscal year end to avoid look-ahead bias.
2.3. Method
Each year from 2000 to 2002, firms nominated for ‘best overall IR’ in the respective
IR Magazine survey in the ‘large firms’ category (market capitalization > $3bn) are ranked by
the number of nominations received with the firm with highest number of nominations
assigned the highest rank. All other large firms with equity traded on the NYSE, Amex and
NASDAQ, with no votes for ‘best overall IR’, are assigned a rank of 0. Similarly, firms
nominated in the ‘small firms’ category (market capitalization < $3bn) are ranked based on
the number of nominations with all firms with market cap < $3bn not nominated assigned a
rank of 0.
We test our prediction 1 relating to the association between effective IR and analyst
coverage in two ways. First, to examine the impact of prior year analyst coverage of firms on
subsequent nominations for ‘best overall IR’, we pool our sample firms across award years
and run the following ordered logistic regression with firm market value and book-to-market
at each year-end, prior-year stock returns and year and industry dummies as control variables
with t denoting award year:
t,i
76
1k
kk
2
1j
jj1t,iPYRt,iM/Bt,iMV1t,iAFt,i IDYDPYRM/B)MVln(AFIR
(1)
where:
IRi,t = Investor relations rank based on number of nominations received, 0 if the firm does not
receive any nominations,
AFi,t-1 = number of analysts publishing forecasts in the I/B/E/S database for firm i as at
December 31 immediately prior to the award year,

13
MVi,t = market value of equity of firm i at March 31 in the award year,
B/Mi,t = book value of common equity of firm i is from the most recent fiscal year ending
September 30 or earlier of the year immediately preceding the nomination year, divided by
MVi,t,
PYRi,t-1 = average monthly stock return from March 1 of year t-1 to February 28 of year t,
YDj = year dummy where j = 1 for 2000 and = 2 for 2001 with 2002 as reference year and
IDk = industry dummy based on 2-digit SIC code where k = 1 to 76.
In addition, we run a parallel Poisson regression where the dependent variable IR is
now given by the number of award nominations the firm receives as the IR rating is count
data.
Second, we use nominations for the IR Magazine’s ‘best overall IR’ award to reflect
the underlying quality of firms’ IR programme. We expect firms where IR quality improves
to be associated with a contemporaneous increase in analyst following. To test whether better
IR (measured by change from non nominated to nominated status) leads to greater analyst
coverage in the year of the nomination, we run the following pooled regression with year and
industry dummies:
)2(IDYDPYRM/B
MVlnIRDIRDIRDAFAF
t,i
76
1k
kkj1t,iPYRt,iM/B
t,iMVt,i,NNNNNNt,i,NNNNNNt,i,NNNN1t,it,i
where:
AFi,t = number of analysts publishing forecasts for firm i in the I/B/E/S database as at
March 31 of the award year,
AFi,t-1 = number of analysts publishing forecasts for firm i in the I/B/E/S database as at
March 31 of the year before the award year,
IRDN→N,i,t = 1 if the firm is nominated (N) at least once in both years t and t-1, 0 otherwise,

14
IRD NN→N,i,t = 1 if the firm is nominated at least once in year t but was not nominated(NN) in
year t-1, 0 otherwise,
IRD N→NN,i,t = 1 if the firm is not nominated in year t but was nominated at least once in year
t-1, 0 otherwise,
YD = 1 for the award year 2001, 0 for the award year 2002,
other variables are as for model (1).
To test our proposition 2 relating to the association between effective IR and stock
liquidity we explore whether stock liquidity increases during the year of IR award
nominations. Specifically, we use the stock turnover ratio as a measure of liquidity. The
monthly turnover ratio for each stock is defined as (see e.g., Korajczyk and Sadka, 2008):
j,i
j,i
j,iSO
VolTO (3)
where:
TOi,j = turnover ratio of stock i during month j,
Voli,j = total trading volume of stock i during month j and
SOi,j = number of shares outstanding for firm i at the end of month j.
Following Tkac (1999), we adjust individual firm turnover ratios for market wide
activity by:
t,m
t,i
t,iOT
OTRTO (4)
where:
t = award year,
t,iOT = average monthly turnover ratio for firm i from April 1 of year t-1 to March 31 of
year t and

15
t,mOT = average monthly turnover ratio for all firms from April 1 of year t-1 to March 31 of
year t.
The change in relative turnover (DRTO) is calculated as follows:
DRTOi,t = RTOi,t - RTOi,t-1 (5)
where :
RTOi,t = average monthly relative turnover for firm i from April 1 of year t-1 to March 31 of
year t, and
RTOi,t-1 = average monthly relative turnover for firm i from April 1 of year t-2 to March 31 of
year t-1.
Then, to test for the relationship between change in stock liquidity and change in IR
status (from not nominated to nominated), controlling for firm size, book-to-market and stock
returns, we estimate the following pooled regression with year and industry dummies:
)6(IDYDPYRM/B
MVlnIRDIRDIRDDRTO
t,i
76
1k
kkj1t,iPYRt,iM/B
t,iMVt,i,NNNNNNt,i,NNNNNNt,i,NNNNt,i
where:
IRDN→N,i,t = 1 if the firm is nominated in both, years t and t-1, 0 otherwise,
IRD NN→N,i,t = 1 if the firm is nominated in year t but was not nominated in year t-1, 0
otherwise,
IRD N→NN,i,t = 1 if the firm is not nominated in year t but was nominated in year t-1, 0
otherwise,
MVi,t = market value of equity of firm i at March 31 of the award year,
B/Mi,t = book value of common equity of firm i is from the most recent fiscal year ending
September 30 or earlier of the year immediately preceding the nomination year divided by
MVi,t,
16
YD = 1 for the award year 2001, 0 for the award year 2002, and
IDk = industry dummy based on 2-digit SIC code where k = 1 to 76.
Finally, to test directly our third prediction relating to the value relevance of effective
investor relations, we employ the well-established Ohlson (1995) valuation model.10 This is a
variant of Tobin’s Q which explicitly takes into account the market value of current earnings
to provide an appropriate framework to measure the incremental contribution to firm value of
variables other than book value and current earnings (Barth, Beaver and Landsman, 1998). In
our case, we are concerned with the impact of effective investor relations on market value.
Ohlson (1995) explicitly recognises that some value relevant information will appear
in accounting numbers with a time lag. Since investor relations reputation is built over time,11
we follow Easton (1999) and use price level rather than returns regression as in the case of
Bushee and Miller (2012). Ohlson (1995) derives his valuation function (equation 7, p. 670)
as:
Pt = b1 (Et – Dt) + b2 BVEt + b3 t (7)
where:
Pt = market value of the firm’s equity at time t,
Et = earnings of the firm for the period (t-1, t),
Dt = net dividends paid at time t,
BVEt = net book value at time t, and
t = information other than abnormal earnings.
We assume effective IR, as proxied by nominations for IR Magazine ‘best overall IR’
awards, reflects information other than that contained in current earnings and book value.
10
Prediction 4 follows from our first three. 11
Though respondents are asked to nominate firms based on their IR performance over the previous 12 months,
these firms would have been building their IR departments and policies over time.

17
Ohlson (2009) shows that dividend policy is irrelevant for this specification, hence we set
dividends to zero (as in e.g., Barth et al., 1998).
Barth and Kallapur (1996) suggest that the coefficient estimates of such price level
equations could be biased due to scale differences in the cross-section of firms. However,
Barth and Clinch (2009) show that current tests to identify the scale effect are ineffective.
Further, they test several specifications of the basic Ohlson (1995) equation used in the
literature and find that unweighted OLS regressions produce robust inferences. Hence, we
employ the following OLS regressions with interaction terms to capture the potential impact
of IR activity on market value conditional on levels of book value and net income, together
with year and industry dummies:12
)8(IDYD
IRD*NIIRD*BVEIRDNIBVEMV
t,i
76
1k
kk
2
1j
jj
t,it,iNI*IRDt,it,iBVE*IRDt,iIRDt,iNIt,iBVEt,i
)9(IDYD
IR*NIIR*BVEIRNIBVEMV
t,i
76
1k
kk
2
1j
jj
t,it,iNI*IRt,it,iBVE*IRt,iIRt,iNIt,iBVEt,i
where:
MVi,t = market value of equity of firm i at March 31 in the year of award nomination (t),
BVEi,t = book value of common equity of firm i is from the most recent fiscal year ending
September 30 or earlier of the year immediately preceding the nomination year,
NIi,t = net income before extraordinary items of firm i for year t,
IRDi,t = 1 if the firm does not receive any nominations, 0 otherwise,
IRi,t = investor relations rank based on number of nominations received,
YDj = year dummy where j = 1 for 2000 and = 2 for 2001 with 2002 as reference year and
IDk = industry dummy based on 2-digit SIC code where k = 1 to 76.
12
We are unable to use both the interaction terms in the same specification in equation (9) due to extremely
high correlations between the two. The usual method of mean-centring the variables still produces
correlations in excess of 0.90. We do not use both IRD and IR in the same equation for the same reason.
18
Note that in all our regressions, there are usually more than one observation per firm
rendering the assumption of independent observations in computing regression standard
errors incorrect. We therefore report t-statistics based on the clustered sandwich estimator
(Froot, 1989 and Williams, 2000) which accounts for the fact that observations for the same
firm may be correlated.
3. Results
This section describes the characteristics of our firm sample and explicitly tests our
predictions established in section 2.1 above. Potential endogeneity issues are also fully
explored.
3.1. Summary statistics
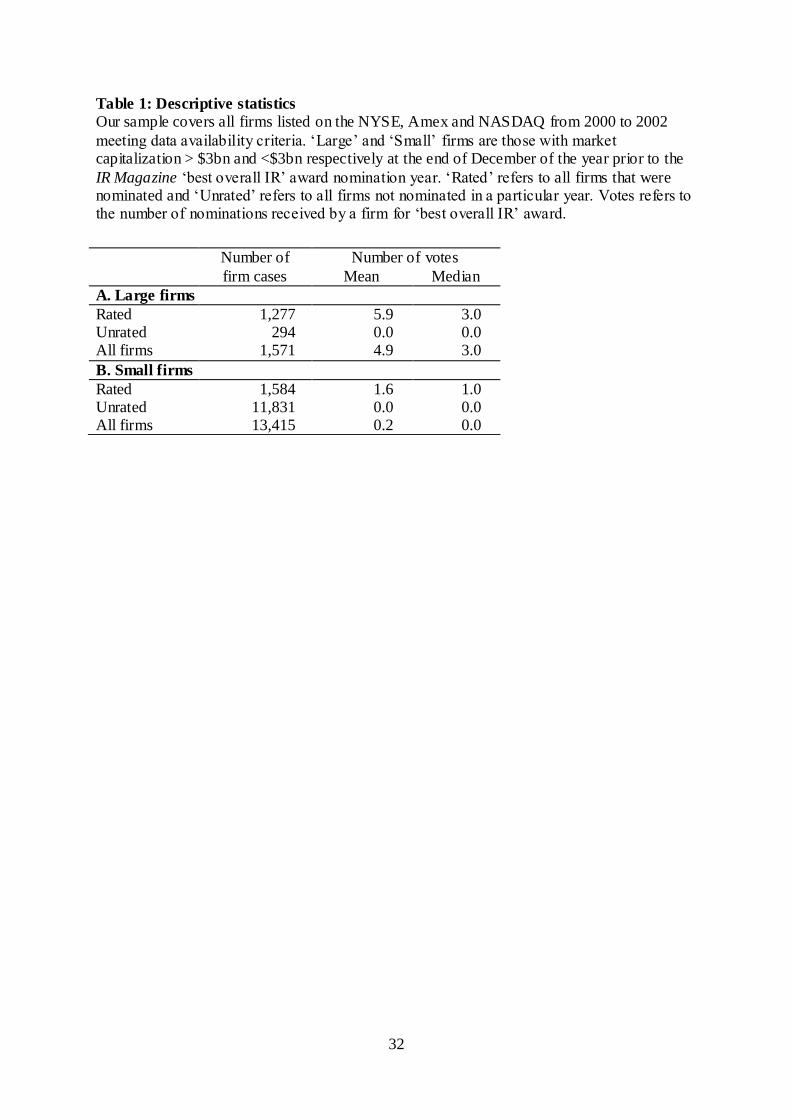
Table 1 shows that whereas 81% of ‘larger’ firms (>$3bn market capitalization) are
nominated for ‘best overall IR’ awards, only 12% of ‘smaller’ firms (<$3bn market
capitalization) are so acknowledged. Panel A shows that in the case of large firms mean
(median) number of nominations for those that are nominated is 5.9 (3.0) and panel B shows
the equivalent figures are 1.6 (1.0) for small firms.
Table 1 here
Table 2 provides descriptive statistics for our sample firms. Panel A shows that in the
case of large firms prior returns do not appear to be influential in determining IR award
nominations. In fact, those firm cases which are unrated earn higher excess returns (3.1% per
month) than those rated (1.4% per month). On the other hand, in the following year, rated
firms appear to outperform firms receiving no award nominations (-0.9% per month v -1.7%
per month), albeit the difference is not significant. Panel B of table 2 for small firms, suggests
some association between prior year excess returns and award nominations compared with
19
unrated firms (1.7% per month v 0.9% per month) although the difference is not statistically
significant and average excess returns are very similar in the following year. Further, both
panels A and B show rated firms are very significantly larger and have lower book-to-market
ratios, than those receiving no award nominations. Table 2 also shows that rated firms have
higher analyst following, both before and after the award year as well as higher relative stock
turnover than ‘unrated’ firms showing better liquidity for such firms.
Table 2 here
3.2. Analyst coverage
This sub-section tests our prediction 1 relating to effective IR leading to higher
analyst coverage. Table 2 shows that average analyst following for firms nominated for ‘best
overall IR’ in the IR Magazine survey is higher than that for those not nominated in the year
prior to the award year. In particular, for large rated firms, prior average analyst following is
16.6, while for small firms it is 6.9. In contrast, average following for large unrated firms in
the prior award year is 11.8 and for small unrated firms it is only 2.2.
Controlling for firm market value, book-to-market and prior year returns, the ordered
logistic regression in table 3 panel A further demonstrates that there is a strong positive
relationship between prior analyst coverage and IR award nomination for both large and
small firms. For large firms, a unit increase in analyst following increases the odds ratio of
the firm being assigned to the next award nomination rank by 2% (t = 2.42) and for small
firms by 5% (t = 4.85).13 The count based Poisson regression in panel B provides somewhat
similar findings in that while for large firms greater analyst following is no longer associated
with more award nominations (βAF = 0.00, t = 0.05), in the case of small firms the results are
13
We also estimate a simple binomial logistic regression with nominated and not nominated binary dependent
variable. Our conclusions are unchanged.

20
equally strong (βAF = 0.03, t = 4.46).14,15 These results show that the higher the prior year
analyst following, the greater the number of nominations received by a firm. As might be
expected, the relationship is stronger for smaller firms than for larger firms. Thus, table 3
provides evidence of a strong positive relationship between prior analyst following and IR
rating, consistent with Lang and Lundholm (1993); not surprisingly, survey respondents tend
to vote for firms with which they are familiar.
Table 3 here
However, more importantly, table 4 shows that controlling for size, book-to-market
and prior year stock return there is a strong positive contemporaneous relationship between
change in IR rating and change in analyst following. Large firms that move from being not
nominated in year t-1 to being nominated for IR Magazine ‘best overall IR’ award in year t
have a mean increase of 1.8 in analyst following compared with those firms not nominated in
consecutive years (t = 2.09), with the increase in analyst following for small firms on the
same basis 1.3 (t = 7.09).16 However, there is no change in analyst following for large firms
nominated in two consecutive years or those not nominated in year t although nominated in
year t-1 compared with those firms not nominated at all (t = 0.15 and t = 0.59, respectively).
Small firms that are nominated for IR awards in consecutive years experience a mean
increase of 0.9 in analyst coverage (t = 2.98) while those that are not nominated in year t after
being nominated in year t-1 suffer a decrease of 1.3 (t = 7.71). Thus, overall, our evidence is
consistent with effective IR leading to higher analyst following, in line with our prediction 1
which may reflect the potential lower information cost incentives.
Table 4 here
14
For a s mall firm with average (median) analyst following of 2.7 (1.0), this translates to a 1.2% (3.3%)
increase for a unit increase in IR ranking. 15
We also estimate OLS regression. Results are omitted for brevity as our conclusions are unchanged. 16
For a large (small) not nominated firm with average analyst following of 11.8 (2.2), this represents a 15%
(59%) increase.

21
3.3. Stock liquidity
The next prediction we test, prediction 2, is that effective IR leads to an increase in
stock liquidity. Table 5 clearly shows that controlling for size, book-to-market and stock
returns, there is a strong positive association between liquidity and IR quality, although for
small firms only. Specifically, for firms with market capitalization < $3bn, while there is no
change in relative stock turnover for firms that are not nominated in year t having been
nominated in year t-1 (βN→NN = 0.00, t = 0.07), those that are nominated in year t experience
higher relative stock turnover irrespective of whether they were nominated in year t-1 (βN→N
= 0.20, t = 3.77) or not (βNN→N = 0.16, t = 3.85).17 However, there is no parallel association
evident for large firms. In the case of small firms, at least, where we might expect the impact
of good IR to be stronger, these results are consistent with our prediction of increased
liquidity for nominated firms. This is on the basis that the costs associated with information
asymmetry fall in particular for small firms with better communications strategies, e.g., as
proxied by their IR award nominations.
Table 5 here
3.4. Value relevance
In this section we test our prediction 3: does effective IR have a positive impact on
market value? The results of our Ohlson (1995) model-based regressions using equations (8)
and (9) to assess value relevance of investor relations activity are presented in table 6. If
investor relations is value relevant then firms with more effective IR should have higher
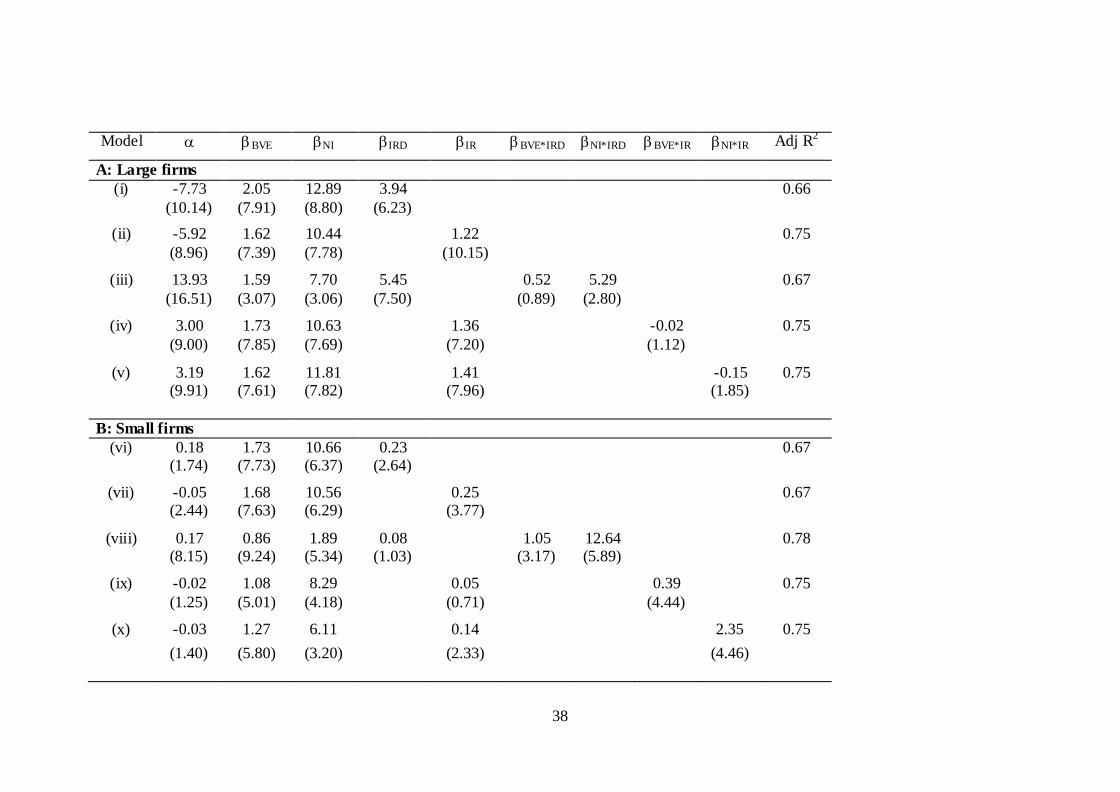
valuation multiples. Model (i) in panel A shows that for large firms, firms that are nominated
have higher valuation than those that are not nominated (βIRD = 3.94, t = 6.23) and model (ii)
17
For an average (median) nominated small firm with relative turnover of 0.93 (0.51), this translates to a 21.5%
(39.2%) increase in relat ive turnover for those nominated in consecutive years and 17.2% (31.4%) for those
nominated for the first time.

22
shows that firms with higher IR ranking have higher valuations (βIR = 1.22, t = 10.15). 18
Further, model (iii) shows that not only do nominated firms have higher market values, they
also have higher valuation multiple on net income (βNI*IRD = 5.29, t = 2.80) though the book
value of equity multiple does not differ significantly (βBVE*IRD = 0.52, t = 0.89). Models (iv)
and (v) show largely similar results with IR rankings, while firms with higher IR rankings
have higher market values, the valuation multiples on book value of equity and net income do
not differ significantly for firms with better IR ranking (βBVE*IR = -0.02, t = 1.12; βNI*IR = -
0.15, t = 1.85). Similarly, model (vi) in panel B shows that for small firms, nominated firms
have higher market valuations (βIRD = 0.23, t = 2.64) and model (vii) shows that higher
ranked firms have higher valuations (βIR = 0.25, t = 3.77). 19 Finally, models (viii), (ix) and
(x) show that for small firms both, the book value of equity as well as net income valuations
multiples are significantly higher for better ranked firms (βBVE*IRD = 1.05, t = 3.17; βNI*IRD =
12.64, t = 5.89; βBVE*IR = 0.39, t = 4.44; βNI*IR = 2.35, t = 4.46).
Table 6 here
To summarise, table 6 reports a strong positive relationship between IR rating and
market value for both large and small firms. Further, for small firms, it also shows that higher
IR ranking leads to higher valuation multiples on both book value of equity and net income.
These findings clearly demonstrate that better investor relations is associated with higher
market value. We therefore report evidence consistent with our prediction 3; effective
investor relations does appear to make an incremental contribution to firm value.
18
For a large ranked firm with average book value of $3.73bn, average net income of $0.55bn and average IR
rank of 5.31, th is translates to a 5.8% increase in market value for a unit increase in ranking. 19
For a s mall ranked firm with average book value of $547.6m, average net income of $51.9m and average IR
rank of 1.6, this translates to a 18.5% increase in market value for a unit increase in ranking.

23
3.5. Value relevance and endogeneity
Table 2 shows that firms that receive ‘best overall IR’ nominations are larger, are
growth firms and have higher analyst following. This is also confirmed directly on a
multivariate basis in table 4. However, our value relevance results could potentially suffer
from endogeneity problem as firms with higher market values, lower book-to-market ratios
and greater analyst coverage are more likely to be nominated for ‘best overall IR’ awards.
The standard approach to correct for this potential bias is to use instrumental variables and a
two-stage least squares framework (e.g. Wooldridge, 2002). However, Larcker and Rusticus
(2010) note the problems of identifying strong instrumental variables in empirical research to
control for endogeneity and provide an alternative route for assessing the robustness of the
investor relations rank OLS coefficient ( IR) in equation (8). This is by calculating its Impact
Threshold for a Confounding Variable (ITCV) using the procedure suggested by Frank
(2000). Specifically, we estimate the minimum level of correlation that the unobserved
confounding variable needs with market value (MV) and investor relations rank (IR) for it to
render the latter’s coefficient ( IR) statistically insignificant if such a confounding variable
were included in equation (8).
The (untabulated) ITCVs for the investor relations ranking coefficients in models (ii) and
(vi) of table 6 are 0.0401 and 0.0239 for large and small firms respectively. This means that a
confounding variable needs to have a partial correlation with the market value of equity and
with investor relations ranking of at least 0.20 for large firms and 0.15 for small firms for it to
render IR insignificant. Frank (2000) acknowledges that it is difficult to say whether any
particular value of ITCV is high enough to ensure an OLS estimate is robust. However, as in
Larcker and Rusticus (2010), we estimate the impact scores for the other independent
variables in table 6, models (ii) and (vi). For large firms, the impact score for the book value

24
of equity coefficient (BVE) is 0.0051, and for net income (NI) -0.0059.20 So, a confounding
variable that if included will render the coefficient on investor relations ranking insignificant
needs to have much larger impact than book value of equity and net income on market value
in equation (8) and be orthogonal to all other independent variables in the model. For small
firms, the impact scores of book value of equity and of net income are 0.0664 and -0.0126
respectively, hence, even here the confounding variable needs to have an impact more than
twice that of net income for it to render the investor relations ranking insignificant. The
chance of such a variable existing is very small. As such, we conclude that any potential self-
selection bias or endogeneity between investor relations ranking and market value is unlikely
to have a sufficiently serious impact on our results to change the tenor of our conclusions.
3.6. Large and smaller firms
To conclude this section, we review our findings in the context of prediction 4 which,
following Merton (1987), is that the benefits of good IR policies will be greater for smaller
than larger firms. As we have seen, our results are largely consistent with this expectation. In
particular, although both large and small firms nominated for ‘best overall IR’ experience a
significant increase in analyst following, there is no equivalent increase in liquidity or market
valuation multiples in the case of large firms, only small firms. We thus find evidence
consistent with our prediction 4, good IR is particularly beneficial in the case of smaller
firms. Nonetheless, it should be po inted out that our ‘small’ firms are not necessarily small
with, as table 2 shows, mean (median) market capitalization of $1.7bn ($1.0bn) and all are
listed on the main US exchanges. This is in contrast to the typically very small and micro-cap
stocks which initiate IR activity that are the focus of Bushee and Miller (2012) and Vlittis and
Charitou (2012).
20
A negative value for the impact score of a variable shows that its inclusion would make the coefficient on
quality of investor relat ions more positive.

25
4. Summary and conclusions
In this study, we seek to test two alternative views in the literature about the value of investor
relations activity to firms. Traditional finance theory argues that simply “repackaging” and
communicating an existing information set will have no value as such information will
already be priced by the market. In addition, Hong and Huang (2005) and Doukas, Kim and
Pantzakis (2005; 2008) suggest that the costs of investor relations could well outweigh the
benefits leading to reduced market value. On the other hand, Merton’s (1987) investor
recognition theory suggests that effective investor relations activity will enhance the
‘visibility’ of a stock. This may be manifest in greater analyst coverage, improved liquidity
and higher market valuation multiples. In addition, since smaller firms are more likely to be
‘neglected’, investor relations should have a grea ter impact in such cases. To test these
conflicting views on the market value of the investment in the intangible asset IR potentially
represents, we employ a new proprietary database measuring IR quality that covers all firms
listed on NYSE, Amex and NASDAQ. This database, compiled by the IR Magazine, consists
of all firms nominated by security analysts and fund managers for ‘best overall IR’ in its
annual investor relations surveys.
The most important contribution of our paper is that, in line with Merton (1987) but
contra Hong and Huang (2005) and Doukas et al. (2005; 2008), both large and smaller firms
nominated for ‘best overall IR’ awards have significantly higher market valuation multiples
than those that not so nominated. This result is further emphasised when we consider firms
ranked on the basis of number of ‘best overall IR’ nominations received in which case an
increase in ranking by one step translates to a 5.8% increase in the market capitalisation for
the average large ranked firm and 18.5% in the case of the average small ranked firm. Using
the ITCV method of Larker and Rusticus (2010), we also show that these results are robust to

26
issues of potential endogeneity. In addition, controlling for a range of risk factors, we show
that firms receiving ‘best overall IR’ award nominations experience increased analyst
following, as well as improved liquidity in the case of smaller firms, in the year subsequent to
these nominations. Finally, consistent with the predictions of Merton (1987), the majority of
our results are much stronger for smaller companies which is likely due to their lower
visibility and hence their likelihood of suffering more from issues of asymmetric information
and lower management credibility.
We thus conclude that good IR has clear market impact; this has important
implications for firms’ communication and other information dissemination strategies with
the financial markets and market participants. In particular, we complement the findings of
Bushee and Miller (2012) and Vlittis and Charitou (2012) who work with very small and
micro-cap stocks which initiate IR activity, and extend these significantly. Our results
demonstrate that the benefits of effective IR equally apply across a large cross-section of
main exchange- listed firms with established IR programmes, not just for very small firms.
Good investor relations policies appear to be value relevant and may be viewed as akin to
investments in other firm intangible assets such as management quality (Agarwal, Taffler and
Brown, 2011) and company brands (e.g., Wyatt, 2008) that produce long term benefits
leading to higher market valuations
Our results, however, are subject to some limitations. First, broadly speaking, they
pertain to the generality of firms engaged in investor relations activity. This is in contrast
with Peasnell et al. (2011) who focus on a different research question relating to the extent to
which IR prize-winning firms are shielded from the adverse impact of corporate misdeeds on
their credibility with investors. Second, there may be issues associated with the use of analyst
and institutional investor subjective IR ratings as measures of firm overall IR quality and the
problems inherent with all such survey-based data. However, we would argue that whether or

27
not IR Magazine survey respondents’ ‘best overall IR’ award nominations proxy for true IR
quality, since such market specialists are the main targets of firms’ investor relations
strategies, it is their subjective perceptions of IR quality that are key whether valid or not.
Finally, our data is restricted to a relatively short time span ending in 2002 and was
not available to us for subsequent years. Nonetheless, it covers the first two years of the
implementation of Regulation Financial Disclosure, the collapse of the dot.com bubble and
September 11 and thus our results are of intrinsic interest in their own right. In addition, it
should be noted that most other directly relevant studies use data from the AIMR database of
large firms which ends in 1996. However, clearly, caution must be taken in generalising from
what we find out of sample.

28
References
Agarwal, V., R. Taffler and M. Brown. 2011. Is Management Quality Value Relevant?,
Journal of Business Finance and Accounting 38(9-10): 1184-1208.
Barker, R., J. Hendry, J. Roberts and P. Sanderson. 2012. Can Company-Fund Manager
Meetings Convey Informational Benefits? Exploring the Rationalisation of Equity
Investment Decision Making by UK Fund Managers, Accounting, Organizations and
Society 37(4): 207-222
Barth, M.E and S. Kallapur. 1996. Effects of Cross-sectional Scale Differences on Regression
Results in Empirical Accounting Research, Contemporary Accounting Research 13(2):
527-567.
Barth, M.E and G. Clinch. 2009. Scale Effects in Capital Markets-based Accounting
Research, Journal of Business Finance and Accounting 36(3-4): 253-288.
Barth, M., W. Beaver and W. Landsman. 1998. Relative Valuation Roles of Equity Book
Value and Net Income as a Function of Financial Health, Journal of Accounting and
Economics 25(1): 1-34.
Bodranuk, A. and P. Ostberg. 2009. Does Investor Recognition Predict Returns?, Journal of
Financial Economics 91(2): 208-226.
Botosan, C.A. and M.A. Plumlee. 2002. A Re-examination of Disclosure Level and the
Expected Cost of Equity Capital, Journal of Accounting Research 40(1): 21-41.
Brennan, M.J. and C. Tamarowski. 2000. Investor Relations, Liquidity and Stock Prices,
Journal of Applied Corporate Finance 12(4): 26-37.
Brown, S. and S.A. Hillgeist. 2007. How Disclosure Quality Affects the Level of Information

29
Asymmetry. Review of Accounting Studies 12(4): 443-477.
Bushee, B.J. and G.S. Miller. 2012. Investor Relations, Firm Visibility and Investor
Following, The Accounting Review 87(3): 867-897.
Chang, M., G. D’Anna, I. Watson and M. Wee. 2008. Does Disclosure Quality via Investor
Relations Affect Information Asymmetry?, Australian Journal of Management 33(2):
375-390.
Doukas, J.A., C. Kim and C. Pantzalis. 2005. The Two Faces of Analyst Coverage, Financial
Management 34(2): 99-126.
Doukas, J.A., C. Kim and C. Pantzalis. 2008. Do Analysts Influence Corporate Financing and
Investment, Financial Management 37(2): 303-339.
Easton, P. D. 1999. Security Returns and the Value Relevance of Accounting Data.
Accounting Horizons, 13(4): 399-412.
Fogarty, T.J. and R.K. Rogers. 2005. Financial Analysts' Reports: An Extended Institutional
Theory Evaluation, Accounting, Organizations and Society 30(4): 331-356.
Frank, K.A. 2000. Impact of a Confounding Variable on a Regression Coefficient.
Sociological Methods and Research, 29: 147-194.
Froot, K. A. 1989. Consistent covariance matrix estimation with cross-sectional dependence
and heteroskedasticity in financial data. Journal of Financial and Quantitative Analysis,
24: 333–355.
Guimard, A. 2013. Investor Relations: Principles and International Best Practices of
Financial Communications, 2nd edition, Basingstoke, Hants: Palgrave Macmillan.
Haggard, K.S., X. Martin and R. Pereira. 2008. Does Voluntary Disclosure Improve Stock
Price Informativeness? Financial Management 37(4): 747-768.

30
Healy, P.M., A.P. Hutton and K.G. Palepu. 1999. Stock Performance and Intermediation
Changes Surrounding Sustained Increases in Disclosure, Contemporary Accounting
Research 16(3): 486-520.
Hong, H. and M. Huang. 2005. Talking up Liquidity: Insider Trading and Investor Relations,
Journal of Financial Intermediation 14(1): 1-31.
Jensen, M. 2005. Agency Costs of Overvalued Equity, Financial Management 34(1): 5-19.
Jiao, Y. 2011. Corporate Disclosure, Market Valuation and Firm Performance. Financial
Management 40(3): 647-676.
Korajczyk, R.A. and R. Sadka. 2008. Pricing the Commonality Across Alternative Measures
of Liquidity, Journal of Financial Economics 87(1): 45-72.
Lang, M.H. and R.J. Lundholm. 1993. Cross-sectional Determinants of Analyst ratings of
Corporate Disclosures, Journal of Accounting Research 31(2): 246-271.
Larcker, D. and T. Rusticus. 2010. On the Use of Instrumental Variables in Accounting
Research. Journal of Accounting and Economics 49: 186-206.
Lehavy, R. and R. Sloan. 2008. Investor Recognition and Stock Returns, Review of
Accounting Studies 13(2-3): 327-361.
Lev, B. 2012. Winning Investors Over, Boston,Mass: Harvard Business Review Press.
Marston, C. 2004. A Survey of European Investor Relations. Edinburgh: Research
Committee of the Institute of Chartered Accountants of Scotland.
Marston, C. 2008. Investor Relations Meetings: Evidence from the Top 500 UK Companies.
Accounting and Business Research 38(1):21-48.
Merton, R. 1987. A Simple Model of Capital Market Equilibrium with Incomplete
Information, Journal of Finance 42(3): 483-510.

31
Ohlson, J. 1995. Earnings, Book Values and Dividends in Equity Valuation, Contemporary
Accounting Research 11(2): 661-687.
Ohlson, J. 2009. Accounting Data and Value: The Basic Results, Contemporary Accounting
Research 26(1): 231-259.
Peasnell, K., S. Talib and S. Young. 2011. The Fragile Returns to Investor Relations:
Evidence from a Period of Declining Market Confidence. Accounting and Business
Research 41(1): 69-90
Richardson, S, R. Sloan and H. You. 2012. What Makes Stock Prices Move? Fundaments vs.
Investor Recognition. Financial Analysts Journal 68(2): 30-50.
Solomon, D.H. 2012. Selective Publicity and Stock Prices. Journal of Finance 67(2): 599-
637.
Tkac, P. 1999. A Trading Volume Benchmark: Theory and Evidence, Journal of Financial
and Quantitative Analysis 34(1): 89-114.
Tuckett, D. and R.J. Taffler. 2012. Fund Management: An Emotional Finance Perspective,
CFA Institute
Vlittis, A. and M. Charitou. 2012. Valuation Effects of Investor Relations Investments,
Accounting and Finance 52(3): 941-970.
Williams, R. L. 2000. A note on robust variance estimation for cluster-correlated data.
Biometrics, 56: 645–646.
Wooldridge, J.M. 2002. Econometric Analysis of Cross Section and Panel Data. MIT Press,
Cambridge.
Wyatt, A. 2008. What Financial and Non-financial Information in Intangibles is Value
Relevant? A Review of the Evidence, Accounting and Business Research 38(3): 217-
256.
32
Table 1: Descriptive statistics
Our sample covers all firms listed on the NYSE, Amex and NASDAQ from 2000 to 2002
meeting data availability criteria. ‘Large’ and ‘Small’ firms are those with market capitalization > $3bn and <$3bn respectively at the end of December of the year prior to the
IR Magazine ‘best overall IR’ award nomination year. ‘Rated’ refers to all firms that were nominated and ‘Unrated’ refers to all firms not nominated in a particular year. Votes refers to the number of nominations received by a firm for ‘best overall IR’ award.
Number of
firm cases
Number of votes
Mean Median
A. Large firms
Rated 1,277 5.9 3.0 Unrated 294 0.0 0.0 All firms 1,571 4.9 3.0
B. Small firms
Rated 1,584 1.6 1.0 Unrated 11,831 0.0 0.0 All firms 13,415 0.2 0.0

33
Table 2: Descriptive statistics
Our sample covers all firms listed on the NYSE, Amex and NASDAQ from 2000 to 2002 meeting data availability criteria. ‘Large’ and ‘Small’
firms are those with market capitalization > $3bn and <$3bn respectively at the end of December of the year prior to the IR Magazine ‘best overall IR’ award nomination year. Prior year monthly average excess returns refers to the monthly returns from March of the year prior to the
award year to February of the award year. Similarly, following year monthly average excess returns refers to the monthly returns from April of the award year to March of the year after the award year. Market capitalization is the market value of equity as at March 31 of the award year and book-to-market is computed using the book value of equity from the most recent fiscal year ending September 30 or earlier of the year
immediately preceding the nomination year divided by the market value of equity as at March 31 of the award year. Prior year and following year analyst following refer to the number of analysts publishing forecasts in I/B/E/S as at the end of December of the year prior to the
nomination year and as at the end of December of the year of the award nomination respectively. Prior year relative turnover refers to the average monthly turnover adjusted for market-wide turnover from March of the year prior to the award year to February of the award year. Similarly, following year relative turnover refers to the average monthly turnover adjusted for market-wide turnover from April of the award
year to March of the year after the award year. ‘Rated’ refers to all firms that were nominated and ‘Unrated’ refers to all firms not nominated in a particular year.
Monthly average
excess returns (%)
Market
capitalizat ion ($bn) Book-to-market
Prior year analyst
following
Following year
analyst following
Prior year relat ive
turnover
Following year
relative turnover
Prior
year
Following
year mean median mean median mean median mean median mean median mean median
A. Large firms
All rated 1.39 -0.88 18.26 8.40 0.30 0.21 16.55 16.00 16.20 16.00 1.94 1.13 2.07 1.28
Unrated 3.09 -1.70 7.12 4.99 0.43 0.35 11.76 12.00 11.28 12.00 1.73 0.96 2.05 1.05
B. Small firms
All rated 1.72 -0.21 1.70 1.00 0.56 0.35 6.93 6.00 7.27 7.00 1.92 1.31 1.95 1.38
Unrated 0.89 -0.25 0.29 0.09 1.13 0.67 2.21 1.00 1.77 0.00 1.13 0.59 0.89 0.49

34
Table 3: Analyst coverage regression estimation
Our sample covers all firms listed on the NYSE, Amex and NASDAQ from 2000 to 2002 meeting data availability criteria. ‘Large’ and ‘Small’ firms are those with market
capitalization > $3bn and <$3bn respectively at the end of December of the year prior to the IR Magazine ‘best overall IR’ award nomination year. The following regression with year dummies {YDj} and industry dummies based on 2-digit
SIC codes {IDk} is estimated:
)1(IDYDPYRM/B)MVln(AFIR t,i
76
1k
kk
2
1j
jj1t,iPYRt,iM/Bt,iMV1t,iAFt,i
Panel A reports the results of the ordinal logistic regression where IRi,t is the rank based on
number of votes received in year t. Panel B reports the Poisson regression results for all sample firms where IRi,t is number of votes received in year t. For both panels, AFi,t-1 is the number of analysts publishing forecasts in the I/B/E/S database for firm i as at December 31
immediately prior to the award year, MVi,t is the market value of equity of firm i as at March 31 of the award year, B/Mi,t is computed using the book value of equity from the most recent
fiscal year ending September 30 or earlier of the year immediately preceding the nomination year divided by the market value of equity as at March 31 of the award year and PYR i,t-1 is the average monthly stock return from March 1 of year t-1 to February 28 of year t. The ranks
are computed each year for ‘Small’ and ‘Large’ firms separately. Intercepts are omitted for brevity in panel A as they represent the cut-off scores for different categories and the number
of such cut-offs is one less than the number of categories. Figures in brackets are the asymptotic t-statistics adjusted for clustering.
α AF MV B/M PYR Pseudo/
Adj-R2
A. Ordered logistic regression
Large 0.02 1.59 -0.50 -0.31
0.13 (2.42) (22.67) (2.33) (2.59)
Small 0.05 1.09 -0.03 -0.04
0.25 (4.85) (27.74) (0.55) (0.77)
B. Poisson regression
Large -12.11 -0.00 0.79 -0.10 -0.08 0.55
(22.38) (0.05) (23.01) (0.80) (0.06)
Small -27.61 0.03 0.97 -0.06 -0.06 0.34 (1.02) (4.46) (26.34) (1.07) (1.36)

35
Table 4: Investor relations rankings and analyst following
Our sample covers all firms listed on the NYSE, Amex and NASDAQ from 2000 to 2002
meeting data availability criteria. ‘Large’ and ‘Small’ firms are those with market capitalization > $3bn and <$3bn respectively at the end of December of the year prior to the
IR Magazine ‘best overall IR’ award nomination year. The following regression with year dummies {YDj} and industry dummies based on 2-digit SIC codes {IDk} is estimated:
)2(IDYDPYRM/B
)MVln(IRDIRDIRDAFAF
t,i
76
1k
kkj1t,iPYRt,iM/B
t,iMVt,i,NNNNNNt,i,NNNNNNt,i,NNNN1t,it,i
Where IRDN→N,i,t is 1 if the firm is nominated in both, year t and t-1, IRD NN→N,i,t is 1 if the firm is nominated in year t but not in year t-1 and IRD N→NN,i,t is 1 if the firm is not nominated
in year t but is nominated in year t-1. AFi,t and AFi,t-1 are the number of analysts publishing forecasts in the I/B/E/S database for firm i as at December 31 of the award year and December 31 of the year immediately prior to the award year respectively, MVi,t is the
market value of equity of firm i as at March 31 of the award year, B/Mi,t is computed using the book value of equity from the most recent fiscal year ending September 30 or earlier of
the year immediately preceding the nomination year divided by the market value of equity as at March 31 of the award year and PYR i,t-1 is the average monthly stock return from March 1 of year t-1 to February 28 of year t. The ranks are computed each year for ‘Small’ and
‘Large’ firms separately. Figures in brackets are the asymptotic t-statistics adjusted for clustering.
α N
N NN
N N
NN MV B/M PYR Adj-R2
Large 13.92 0.11 1.84 -0.47 -0.65 -1.21 -3.61
0.20 (3.53) (0.15) (2.09) (0.59) (2.52) (1.66) (4.42)
Small 1.18 0.91 1.31 -1.33 -0.10 -0.46 -0.00
0.11 (4.05) (2.98) (7.09) (7.71) (4.10) (14.98) (0.06)

36
Table 5: Relative turnover regression analysis
Our sample covers all firms listed on the NYSE, Amex and NASDAQ from 2000 to 2002
meeting data availability criteria. ‘Large’ and ‘Small’ firms are those with market capitalization > $3bn and <$3bn respectively at the end of December of the year prior to the
IR Magazine ‘best overall IR’ award nomination year. The following regression with year dummies {YDj} and industry dummies based on 2-digit SIC codes {IDk} is estimated:
)6(IDYDPYR
M/B)MVln(IRDIRDIRDDRTO
t,i
76
1k
kkjt,iPYR
t,iM/Bt,iMVt,i,NNNNNNt,i,NNNNNNt,i,NNNNt,i
Where DRTOi,t for firm i is the difference between the average monthly turnover ratio
adjusted for market-wide activity from April 1 of year t-1 to March 31 of year t (award year) and the average monthly turnover ratio adjusted for market-wide activity from April 1 of year t-2 to March 31 of year t-1. IRDN→N,i,t is 1 if the firm is nominated in both, year t and t-1,
IRDNN→N,i,t is 1 if the firm is nominated in year t but not in year t-1 and IRDN→NN,i,t is 1 if the firm is not nominated in year t but is nominated in year t-1. MVi,t is the market value of
equity of firm i as at March 31 of the award year, B/Mi,t is computed using the book value of equity from the most recent fiscal year ending September 30 or earlier of the year immediately preceding the nomination year divided by the market value of equity as at March
31 of the award year and PYR i,t-1 is the average monthly stock return from March 1 of year t-1 to February 28 of year t. Figures in brackets are the asymptotic t-statistics adjusted for
clustering.
α N
N NN
N N
NN MV B/M PYR Adj-R2
Large 2.25 -0.04 0.10 0.11 -0.06 -0.18 -0.54
0.13 (5.10) (0.49) (0.92) (0.95) (1.92) (1.67) (4.77)
Small -1.28 0.20 0.16 0.00 0.10 -0.03 0.02
0.09 (16.26) (3.77) (3.85) (0.07) (13.30) (2.72) (1.43)

37
Table 6: Value relevance of IR activity
Our sample covers all firms listed on the NYSE, Amex and NASDAQ from 2000 to 2002 meeting data availability criteria. ‘Large’ and ‘Small’ firms are those with market capitalization > $3bn and <$3bn respectively at the end of December of the year prior to the IR Magazine ‘best
overall IR’ award nomination year. The following regressions with year dummies {YDj} and industry dummies based on 2-digit SIC codes {IDk} is estimated:
)8(IDYDIRD*NIIRD*BVEIRDNIBVEMV t,i
76
1k
k,ik
2
1j
j,ijt,it,iIRD*NIt,it,iIRD*BVEt,iIRDt,iNIt,iBVEt,i
)9(IDYDIR*NIIR*BVEIRNIBVEMV t,i
76
1k
k,ik
2
1j
j,ijt,it,iIR*NIt,it,iIR*BVEt,iIRt,iNIt,iBVEt,i
where MVi,t is the market value of equity of firm i as at 31 March in the year of nomination (t), BVEi,t is the book value of common equity for
firm i as at the end of the most recent fiscal year ending September 30 or earlier of the year immediately preceding the nomination year and NIi,t is the net income before extraordinary items for firm i for the award year. Accounting data is lagged by 6 months. IRDi,t is 1 if the firm receives at least one nomination and 0 otherwise and IRi,t is the investor relations rank of firm i based on the number of nominations received. The ranks
are computed each year for ‘Small’ and ‘Large’ firms separately. Figures in brackets are the t-statistics adjusted for clustering.
38
Model BVE NI IRD IR BVE*IRD NI*IRD BVE*IR NI*IR Adj R2
A: Large firms
(i) -7.73 2.05 12.89 3.94 0.66
(10.14) (7.91) (8.80) (6.23)
(ii) -5.92 1.62 10.44 1.22 0.75
(8.96) (7.39) (7.78) (10.15)
(iii) 13.93 1.59 7.70 5.45 0.52 5.29 0.67
(16.51) (3.07) (3.06) (7.50) (0.89) (2.80)
(iv) 3.00 1.73 10.63 1.36 -0.02 0.75
(9.00) (7.85) (7.69) (7.20) (1.12)
(v) 3.19 1.62 11.81 1.41 -0.15 0.75 (9.91) (7.61) (7.82) (7.96) (1.85)
B: Small firms
(vi) 0.18 1.73 10.66 0.23 0.67 (1.74) (7.73) (6.37) (2.64)
(vii) -0.05 1.68 10.56 0.25 0.67 (2.44) (7.63) (6.29) (3.77)
(viii) 0.17 0.86 1.89 0.08 1.05 12.64 0.78 (8.15) (9.24) (5.34) (1.03) (3.17) (5.89)
(ix) -0.02 1.08 8.29 0.05 0.39 0.75
(1.25) (5.01) (4.18) (0.71) (4.44)
(x) -0.03 1.27 6.11 0.14 2.35 0.75
(1.40) (5.80) (3.20) (2.33) (4.46)

39
Tables for the reviewers

40
Table 3A: Analyst coverage regression estimation
Our sample covers all firms listed on the NYSE, Amex and NASDAQ from 2000 to 2002 meeting data availability criteria. ‘Large’ and ‘Small’ firms are those with market
capitalization > $3bn and <$3bn respectively at the end of December of the year prior to the IR Magazine ‘best overall IR’ award nomination year. The following regression with year dummies {YDj} and industry dummies based on 2-digit
SIC codes {IDk} is estimated:
)1(IDYDPYRM/B)MVln(AFIR t,i
76
1k
kk
2
1j
jj1t,iPYRt,iM/Bt,iMV1t,iAFt,i
Panel A reports the results of logistic regression for all sample firms where IRi,t is 1 if the
firm is nominated, 0 otherwise. Panel B reports the rank regression results for nominated firms where IRi,t is the rank based on number of votes received in year t. For both panels, AFi,t-1 is the number of analysts publishing forecasts in the I/B/E/S database
for firm i as at December 31 immediately prior to the award year, MVi,t is the market value of equity of firm i as at March 31 of the award year, B/Mi,t is computed using the book value
of equity from the most recent fiscal year ending September 30 or earlier of the year immediately preceding the nomination year divided by the market value of equity as at March 31 of the award year and PYR i,t-1 is the average monthly stock return from March 1 of year t-
1 to February 28 of year t. The ranks are computed each year for ‘Small’ and ‘Large’ firms separately. Figures in brackets are the asymptotic t-statistics adjusted for clustering.
α AF MV B/M PYR Pseudo/ Adj-R2
A. Binary logistic regression
Large -14.89 0.02 1.01 -0.48 -0.28
0.16 (7.44) (2.20) (8.13) (2.47) (1.74)
Small -24.24 0.04 1.08 -0.01 -0.01
0.31 (23.83) (4.13) (27.95) (0.22) (0.19)
B. Rank regression
Large -57.91 0.02 3.97 -0.07 -0.43 0.56 (17.58) (1.24) (18.28) (0.14) (1.58)
Small -0.96 0.03 0.21 -0.02 -0.10 0.17 (1.80) (3.80) (6.40) (0.54) (2.66)

41
Table 4A: Investor relations rankings and analyst following
Our sample covers all firms listed on the NYSE, Amex and NASDAQ from 2000 to 2002 meeting data availability criteria and nominated for two consecutive years for the IR
Magazine ‘best overall IR’ award. ‘Large’ and ‘Small’ firms are those with market capitalization > $3bn and <$3bn respectively at the end of December of the year prior to the IR Magazine ‘best overall IR’ award nomination year.
The following regression with year dummies {YDj} and industry dummies based on 2-digit SIC codes {IDk} is estimated:
t,i
76
1k
kkj1t,iPYRt,iM/Bt,iMVt,iIR1t,it,i IDYDPYRM/B)MVln(IRAFAF
Where ΔIR,i,t is the difference between the IR rank in years t and t-1, AFi,t and AFi,t-1 are the number of analysts publishing forecasts in the I/B/E/S database for firm i as at December 31 of the award year and December 31 of the year immediately prior to the award year
respectively, MVi,t is the market value of equity of firm i as at March 31 of the award year, B/Mi,t is computed using the book value of equity from the most recent fiscal year ending
September 30 or earlier of the year immediately preceding the nomination year divided by the market value of equity as at March 31 of the award year and PYR i,t-1 is the average monthly stock return from March 1 of year t-1 to February 28 of year t. The ranks are computed each
year for ‘Small’ and ‘Large’ firms separately. F igures in brackets are the asymptotic t-statistics adjusted for clustering.
α ΔIR MV B/M PYR Adj-R2
Large 12.94 0.24 -1.08 -2.14 -3.99
0.16 (2.81) (4.96) (3.65) (2.52) (3.78)
Small -6.00 0.20 -0.10 -3.21 -0.54
0.15 (0.94) (3.25) (0.24) (5.15) (1.45)

42
Table 5A: Relative turnover regression analysis
Our sample covers all firms listed on the NYSE, Amex and NASDAQ from 2000 to 2002
meeting data availability criteria and nominated for two consecutive years for the IR Magazine ‘best overall IR’ award. ‘Large’ and ‘Small’ firms are those with market
capitalization > $3bn and <$3bn respectively at the end of December of the year prior to the IR Magazine ‘best overall IR’ award nomination year. The following regression with year dummies {YDj} and industry dummies based on 2-digit
SIC codes {IDk} is estimated:
t,i
76
1k
kkjt,iPYRt,iM/Bt,iMVt,iIRt,i IDYDPYRM/B)MVln(IRDRTO
Where DRTOi,t for firm i is the difference between the average monthly turnover ratio
adjusted for market-wide activity from April 1 of year t-1 to March 31 of year t (award year) and the average monthly turnover ratio adjusted for market-wide activity from April 1 of year t-2 to March 31 of year t-1. ΔIRi,t is the difference between IR ranks of firm i in years t and t-
1, MVi,t is the market value of equity of firm i as at March 31 of the award year, B/Mi,t is computed using the book value of equity from the most recent fiscal year ending September
30 or earlier of the year immediately preceding the nomination year divided by the market value of equity as at March 31 of the award year and PYR i,t-1 is the average monthly stock return from March 1 of year t-1 to February 28 of year t. Figures in brackets are the
asymptotic t-statistics adjusted for clustering.
α ΔIR MV B/M PYR Adj-R2
Large 0.89 0.01 -0.08 -0.18 -0.48
0.15 (1.90) (2.15) (2.92) (1.36) (3.96)
Small -0.12 0.01 0.01 -0.36 -0.05
-0.01 (0.11) (1.27) (0.13) (4.39) (0.45)