investor presentation - · pdf filemedium term financial objectives fiscal 2017 overview key...
TRANSCRIPT

INVESTOR PRESENTATION
FOURTH QUARTER 2017
November 28, 2017

2
CAUTION REGARDING FORWARD-LOOKING STATEMENTS
Our public communications often include oral or written forward-looking statements.
Statements of this type are included in this document, and may be included in other filings with
Canadian securities regulators or the U.S. Securities and Exchange Commission, or in other
communications. All such statements are made pursuant to the “safe harbor” provisions of the
U.S. Private Securities Litigation Reform Act of 1995 and any applicable Canadian securities
legislation. Forward-looking statements may include, but are not limited to, statements made
in this document, the Management’s Discussion and Analysis in the Bank’s 2017 Annual
Report under the headings “Outlook” and in other statements regarding the Bank’s objectives,
strategies to achieve those objectives, the regulatory environment in which the Bank operates,
anticipated financial results (including those in the area of risk management), and the outlook
for the Bank’s businesses and for the Canadian, U.S. and global economies. Such statements
are typically identified by words or phrases such as “believe,” “expect,” “anticipate,” “intent,”
“estimate,” “plan,” “may increase,” “may fluctuate,” and similar expressions of future or
conditional verbs, such as “will,” “may,” “should,” “would” and “could.”
By their very nature, forward-looking statements involve numerous assumptions, inherent risks
and uncertainties, both general and specific, and the risk that predictions and other forward-
looking statements will not prove to be accurate. Do not unduly rely on forward-looking
statements, as a number of important factors, many of which are beyond the Bank’s control
and the effects of which can be difficult to predict, could cause actual results to differ
materially from the estimates and intentions expressed in such forward-looking statements.
These factors include, but are not limited to: the economic and financial conditions in Canada
and globally; fluctuations in interest rates and currency values; liquidity and funding; significant
market volatility and interruptions; the failure of third parties to comply with their obligations to
the Bank and its affiliates; changes in monetary policy; legislative and regulatory
developments in Canada and elsewhere, including changes to, and interpretations of tax laws
and risk-based capital guidelines and reporting instructions and liquidity regulatory guidance;
changes to the Bank’s credit ratings; operational (including technology) and infrastructure
risks; reputational risks; the risk that the Bank’s risk management models may not take into
account all relevant factors; the accuracy and completeness of information the Bank receives
on customers and counterparties; the timely development and introduction of new products
and services; the Bank’s ability to expand existing distribution channels and to develop and
realize revenues from new distribution channels; the Bank’s ability to complete and integrate
acquisitions and its other growth strategies; critical accounting estimates and the effects of
changes in accounting policies and methods used by the Bank as described in the Bank’s
annual financial statements (See “Controls and Accounting Policies—Critical accounting
estimates” in the Bank’s 2017 Annual Report) and updated by quarterly reports; global capital
markets activity; the Bank’s ability to attract and retain key executives; reliance on third parties
to provide components of the Bank’s business infrastructure; unexpected changes in
consumer spending and saving habits; technological developments; fraud by internal or
external parties, including the use of new technologies in unprecedented ways to defraud the
Bank or its customers; increasing cyber security risks which may include theft of assets,
unauthorized access to sensitive information or operational disruption; anti-money laundering;
consolidation in the financial services sector in Canada and globally; competition, both from
new entrants and established competitors; judicial and regulatory proceedings; natural
disasters, including, but not limited to, earthquakes and hurricanes, and disruptions to public
infrastructure, such as transportation, communication, power or water supply; the possible
impact of international conflicts and other developments, including terrorist activities and war;
the effects of disease or illness on local, national or international economies; and the Bank’s
anticipation of and success in managing the risks implied by the foregoing. A substantial
amount of the Bank’s business involves making loans or otherwise committing resources to
specific companies, industries or countries. Unforeseen events affecting such borrowers,
industries or countries could have a material adverse effect on the Bank’s financial results,
businesses, financial condition or liquidity. These and other factors may cause the Bank’s
actual performance to differ materially from that contemplated by forward-looking statements.
For more information, see the “Risk Management” section of the Bank’s 2017 Annual Report.
Material economic assumptions underlying the forward-looking statements contained in this
document are set out in the 2017 Annual Report under the headings “Outlook”, as updated by
quarterly reports. The “Outlook” sections are based on the Bank’s views and the actual
outcome is uncertain. Readers should consider the above-noted factors when reviewing these
sections. The preceding list of factors is not exhaustive of all possible risk factors and other
factors could also adversely affect the Bank’s results. When relying on forward-looking
statements to make decisions with respect to the Bank and its securities, investors and others
should carefully consider the preceding factors, other uncertainties and potential events. The
forward-looking statements contained in this document are presented for the purpose of
assisting the holders of the Bank’s securities and financial analysts in understanding the
Bank’s financial position and results of operations as at and for the periods ended on the
dates presented, as well as the Bank’s financial performance objectives, vision and strategic
goals, and may not be appropriate for other purposes. Except as required by law, the Bank
does not undertake to update any forward-looking statements, whether written or oral, that
may be made from time to time by or on its behalf.
SCOTIABANK
3
OVERVIEW
Brian Porter
President & Chief Executive Officer

MEDIUM TERM FINANCIAL OBJECTIVES
FISCAL 2017 OVERVIEW
Key Highlights
Strong full year results
• Strong performance across business
lines
• Results in-line with medium term
objectives
• Structural cost initiatives progressing
well ahead of plan and continuing to
invest in the business
• Improved credit performance
• Capital position remains strong
• Annual dividend increased a cumulative
5 cents or 6% during the year
4
Objectives
2017
Results
EPS Growth 5-10% 8%1
ROE 14%+ 14.6%
Operating Leverage Positive -0.2%1
Capital Levels Strong Levels 11.5%
1 Adjusting for restructuring charge of $278 million after-tax ($378 million before-tax) in Q2/16
FINANCIAL
5
REVIEW
Sean McGuckin
Chief Financial Officer
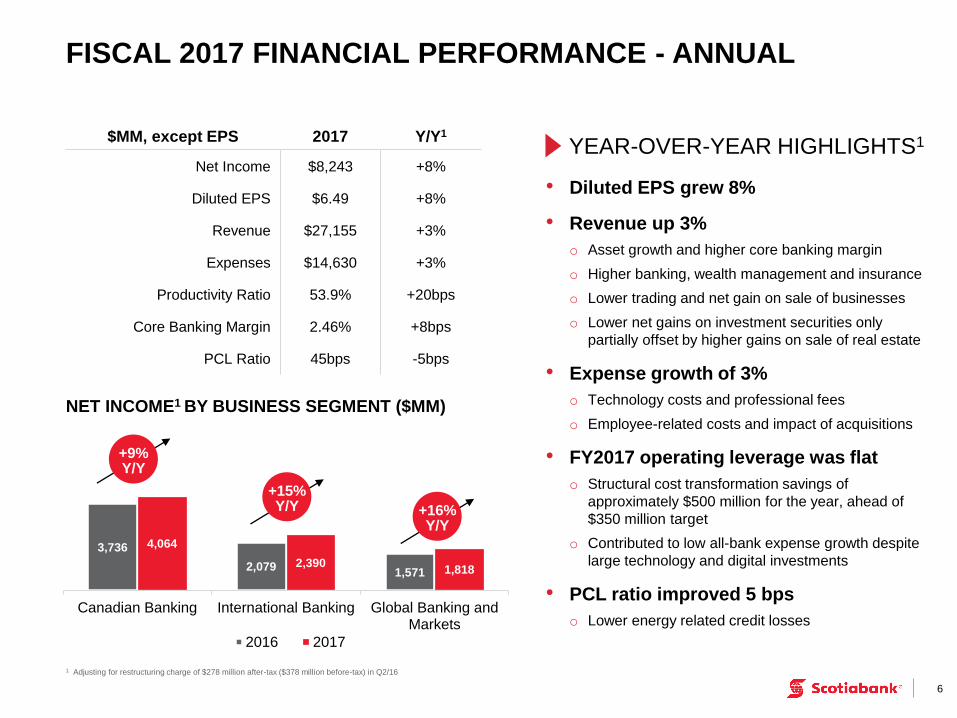
$MM, except EPS 2017 Y/Y1
Net Income $8,243 +8%
Diluted EPS $6.49 +8%
Revenue $27,155 +3%
Expenses $14,630 +3%
Productivity Ratio 53.9% +20bps
Core Banking Margin 2.46% +8bps
PCL Ratio 45bps -5bps
6
FISCAL 2017 FINANCIAL PERFORMANCE - ANNUAL
YEAR-OVER-YEAR HIGHLIGHTS1
• Diluted EPS grew 8%
• Revenue up 3%
o Asset growth and higher core banking margin
o Higher banking, wealth management and insurance
o Lower trading and net gain on sale of businesses
o Lower net gains on investment securities only
partially offset by higher gains on sale of real estate
• Expense growth of 3%
o Technology costs and professional fees
o Employee-related costs and impact of acquisitions
• FY2017 operating leverage was flat
o Structural cost transformation savings of
approximately $500 million for the year, ahead of
$350 million target
o Contributed to low all-bank expense growth despite
large technology and digital investments
• PCL ratio improved 5 bps
o Lower energy related credit losses
1 Adjusting for restructuring charge of $278 million after-tax ($378 million before-tax) in Q2/16
NET INCOME1 BY BUSINESS SEGMENT ($MM)
3,736
2,079 1,571
4,064
2,390 1,818
Canadian Banking International Banking Global Banking andMarkets
2016 2017
+9% Y/Y
+15% Y/Y +16%
Y/Y

DIVIDENDS PER COMMON SHARE
$MM, except EPS Q4/17 Y/Y Q/Q
Net Income $2,070 +3% -2%
Diluted EPS $1.64 +4% -1%
Revenue $6,812 +1% -1%
Expenses $3,668 +1% -
Productivity Ratio 53.8% -30bps +50bps
Core Banking Margin 2.44% +4bps -2bps
PCL Ratio 42bps -3bps -3bps
7
Q4 2017 FINANCIAL PERFORMANCE – QUARTERLY
YEAR-OVER-YEAR HIGHLIGHTS
• Diluted EPS grew 4%
• Revenue up 1%
o Asset growth in retail and commercial lending
o Higher core banking margin
o Higher card revenues and net gains on investment
securities
o Partly offset by lower trading, lower fee and
commission revenue from sale of HollisWealth and
lower gains on sale of real estate
• Expense growth up 1%
o Investments in technology, digital banking, and
other initiatives
o Higher employee-related costs
o Partly offset by savings from structural cost
transformation and impact from sale of HollisWealth
• PCL ratio improved 3 bps
o Improvement across all three business lines
1 Adjusting for restructuring charge of $278 million after-tax ($378 million before-tax) in Q2/16
$0.74 $0.74 $0.76 $0.76 $0.79
Q4/16 Q1/17 Q2/17 Q3/17 Q4/17
+$0.02 +$0.03
Announced dividend increase

STRONG CAPITAL POSITION
8
CET1 ratio of 11.5%
• Strong CET1 ratio of 11.5%, an increase of 20 bps Q/Q
• CET1 risk-weighted assets increased 3% or $11 billion
11.3%
+30 bps -16 bps
+4 bps +2 bps 11.5%
Q3/17 Internal CapitalGeneration
Business Growth RWA(ex. FX)
Foreign ExchangeTranslation
Other Q4/17

IFRS 9
9
Underlying credit performance remains strong, but expect greater volatility from IFRS 9
TIMING
DISCLOSURE
TRANSITION IMPACT
• Prospective adoption effective November 1, 2017
• First set of interim financial statements under IFRS 9 for the three months ended January 31, 2018 (fiscal Q1/18)
• Adjustment to opening balance sheet through retained earnings
• No restatement of prior period comparative statements
• Reduction of total shareholders equity by approximately $600 million after-tax
• A reduction of CET1 ratio of 15 bps, mainly from the transition adjustment’s impact on shareholder’s equity and deferred tax assets
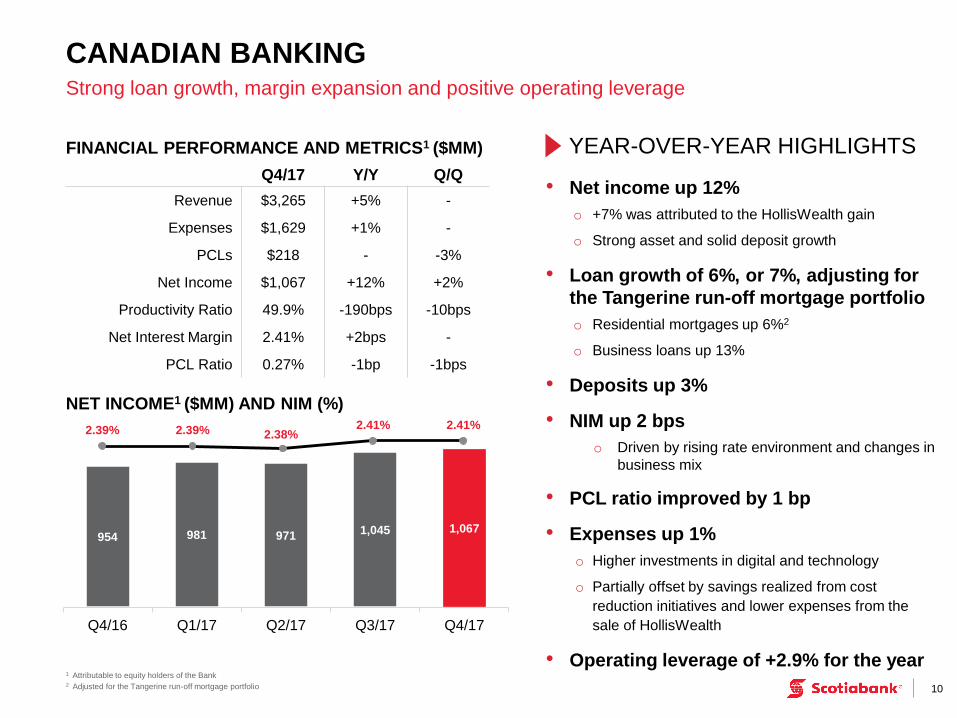
954 981 971 1,045 1,067
Q4/16 Q1/17 Q2/17 Q3/17 Q4/17
2.39% 2.39% 2.38% 2.41% 2.41%
NET INCOME1 ($MM) AND NIM (%)
• Net income up 12%
o +7% was attributed to the HollisWealth gain
o Strong asset and solid deposit growth
• Loan growth of 6%, or 7%, adjusting for
the Tangerine run-off mortgage portfolio
o Residential mortgages up 6%2
o Business loans up 13%
• Deposits up 3%
• NIM up 2 bps
o Driven by rising rate environment and changes in
business mix
• PCL ratio improved by 1 bp
• Expenses up 1%
o Higher investments in digital and technology
o Partially offset by savings realized from cost
reduction initiatives and lower expenses from the
sale of HollisWealth
• Operating leverage of +2.9% for the year
10
CANADIAN BANKING Strong loan growth, margin expansion and positive operating leverage
FINANCIAL PERFORMANCE AND METRICS1 ($MM) YEAR-OVER-YEAR HIGHLIGHTS
1 Attributable to equity holders of the Bank 2 Adjusted for the Tangerine run-off mortgage portfolio
Q4/17 Y/Y Q/Q
Revenue $3,265 +5% -
Expenses $1,629 +1% -
PCLs $218 - -3%
Net Income $1,067 +12% +2%
Productivity Ratio 49.9% -190bps -10bps
Net Interest Margin 2.41% +2bps -
PCL Ratio 0.27% -1bp -1bps

547 576 595 614 605
Q4/16 Q1/17 Q2/17 Q3/17 Q4/17
4.77% 4.73% 5.00%
4.77% 4.67%
11
FINANCIAL PERFORMANCE AND METRICS1 ($MM)
INTERNATIONAL BANKING
YEAR-OVER-YEAR HIGHLIGHTS
Solid volume growth and positive operating leverage
• Net Income up 11% or 8%2
o Strong asset and deposit growth
o Good expense control
o Lower tax benefits and lower contribution from affiliates
• Loans up 7% or 10%2
o Latin America loan growth up 15%2 Y/Y
• Deposits up 7% or 11%2
• NIM down 10 bps
o Changes in business mix, including strong commercial loan growth
o Lower net inflation impacts
• PCL ratio improved by 1 bp
• Expenses down 1% or up 2%2
o Volume growth and inflation
o Higher investments in digital and technology
o Offset by savings from cost reduction initiatives and
foreign currency translation
• Operating leverage of +3.3% for the year 1 Attributable to equity holders of the Bank 2 Adjusting for foreign currency translation
Q4/17 Y/Y Q/Q
Revenue $2,565 +3% -3%
Expenses $1,395 -1% -3%
PCLs $310 +5% -5%
Net Income $605 +11% -1%
Productivity Ratio 54.4% -210bps -10bps
Net Interest Margin 4.67% -10bps -10bps
PCL Ratio 1.14% -1bps -2bps
NET INCOME1 ($MM) AND NIM (%)
461 469 517 441 391
Q4/16 Q1/17 Q2/17 Q3/17 Q4/17
423
548 518
448
299
12
FINANCIAL PERFORMANCE AND METRICS1 ($MM)
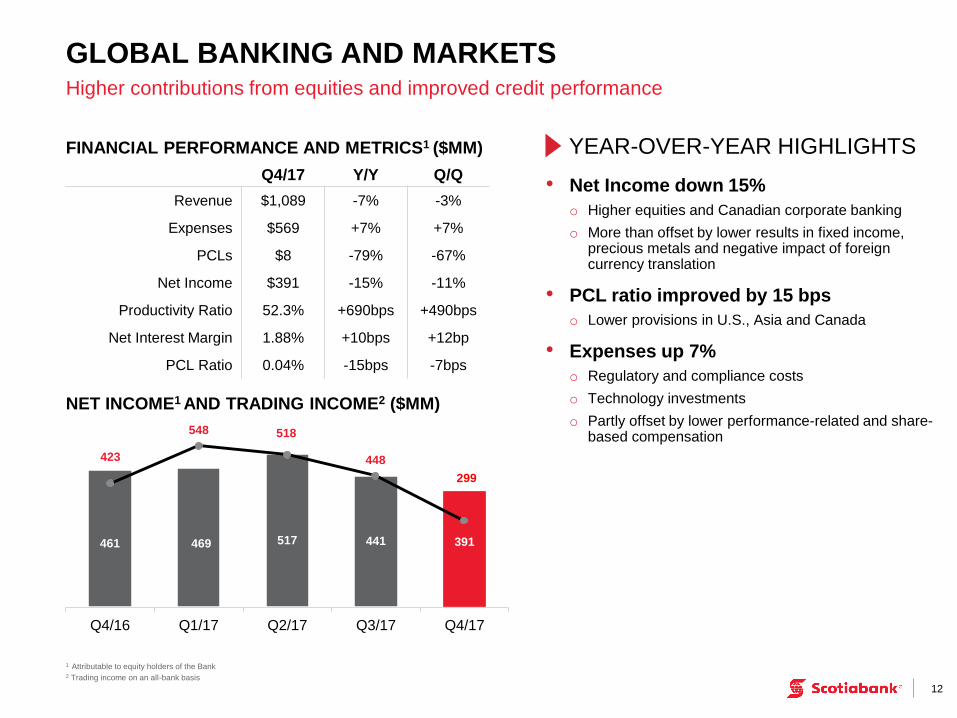
GLOBAL BANKING AND MARKETS
YEAR-OVER-YEAR HIGHLIGHTS
Higher contributions from equities and improved credit performance
• Net Income down 15%
o Higher equities and Canadian corporate banking
o More than offset by lower results in fixed income, precious metals and negative impact of foreign currency translation
• PCL ratio improved by 15 bps
o Lower provisions in U.S., Asia and Canada
• Expenses up 7%
o Regulatory and compliance costs
o Technology investments
o Partly offset by lower performance-related and share-based compensation
1 Attributable to equity holders of the Bank 2 Trading income on an all-bank basis
Q4/17 Y/Y Q/Q
Revenue $1,089 -7% -3%
Expenses $569 +7% +7%
PCLs $8 -79% -67%
Net Income $391 -15% -11%
Productivity Ratio 52.3% +690bps +490bps
Net Interest Margin 1.88% +10bps +12bp
PCL Ratio 0.04% -15bps -7bps
NET INCOME1 AND TRADING INCOME2 ($MM)

Q4/16 Q1/17 Q2/17 Q3/17 Q4/17
(23)
(78) (86)
(55) (48)
13
OTHER SEGMENT1
YEAR-OVER-YEAR HIGHLIGHTS
Results reflect lower net gains
• Lower net gain on investment securities and real estate gains
• Partly offset by lower expenses
1 Includes Group Treasury, smaller operating segments, and other corporate items which are not allocated to a business line. The results primarily reflect the net impact of asset/liability management activities 2 Attributable to equity holders of the Bank
NET INCOME2 ($MM)
RISK
14
REVIEW
Daniel Moore
Chief Risk Officer

550 553 587 573 536
Q4/16 Q1/17 Q2/17 Q3/17 Q4/17
42 bps
45 bps 49 bps 45 bps 45 bps
15
PCLs ($MM) AND PCL RATIO (bps)
RISK REVIEW
YEAR-OVER-YEAR HIGHLIGHTS
Overall credit fundamentals are within expectations
• PCLs and PCL ratio both improved, as well as Q/Q
o Canada has stabilized and delinquency rates improved across all product categories
o Improved loss rates in Canadian and International retail and commercial
o Global Banking and Markets loss rate at 4 bps
o Cumulative energy loan loss ratio of 2.1% below our committed 3% guidance through 2015 and 2017
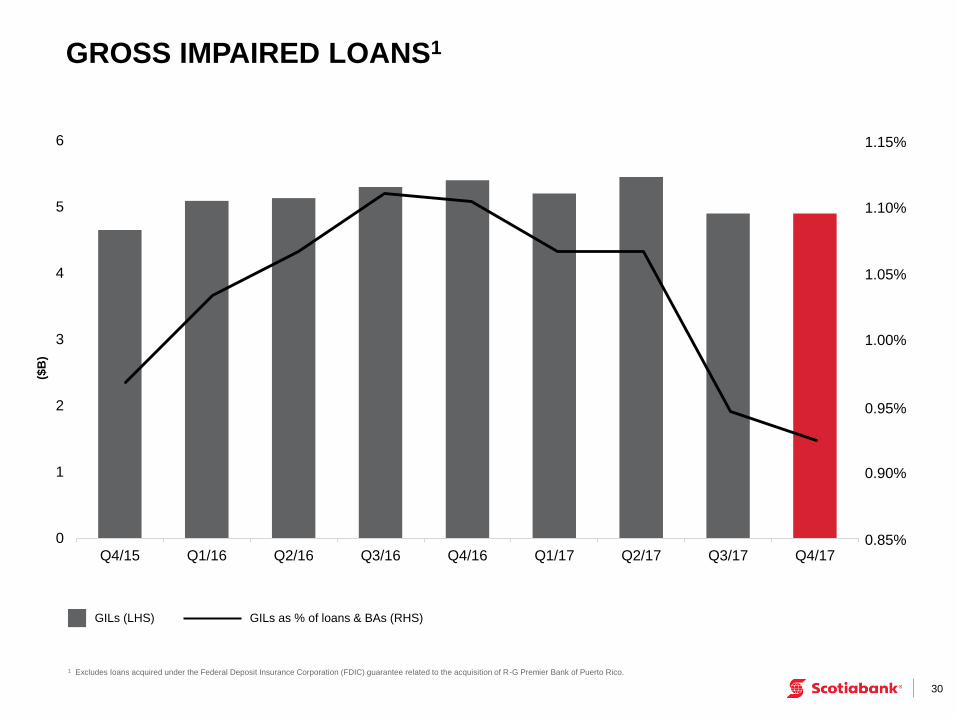
• Gross impaired loans improved 1% Q/Q1
o Net impaired loan loss ratio improved by 1 bp Q/Q to 0.43%
o Lower retail, commercial and wholesale gross impaired loans across all business lines
1 Excludes loans acquired under the Federal Deposit Insurance Corporation (FDIC) guarantee related to the acquisition of R-G Premier Bank of Puerto Rico.
5.4 5.2
5.4
4.9 4.9
Q4/16 Q1/17 Q2/17 Q3/17 Q4/17
PCLs PCL ratio
GILs1 ($B) AND NIL RATIO (bps)
GILs NIL ratio
43 bps 44 bps
49 bps 49 bps 49 bps
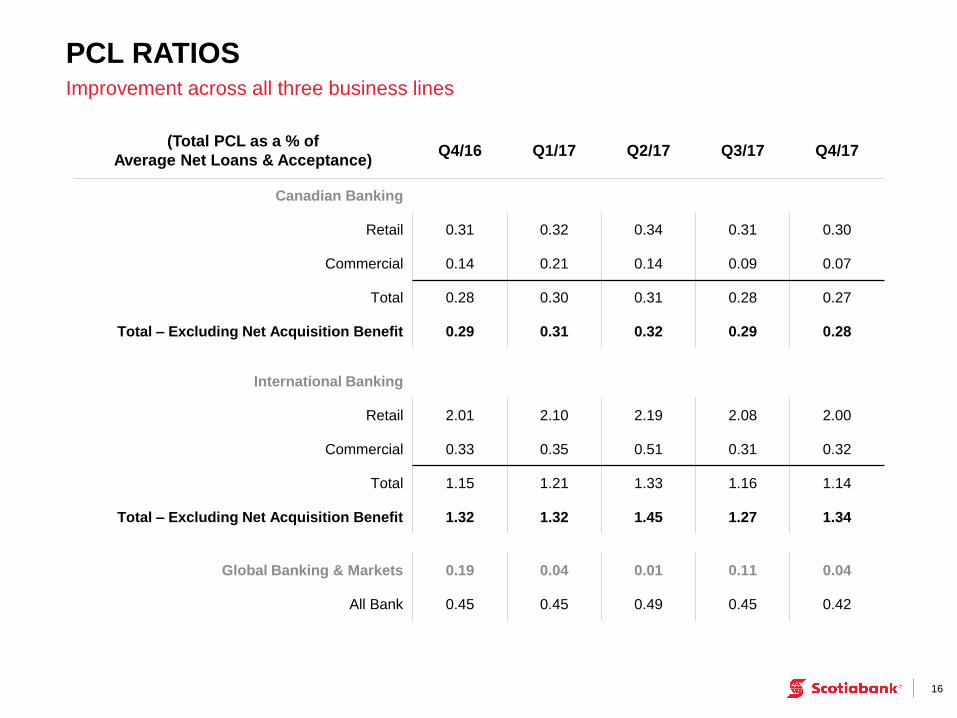
PCL RATIOS
16
Improvement across all three business lines
(Total PCL as a % of
Average Net Loans & Acceptance) Q4/16 Q1/17 Q2/17 Q3/17 Q4/17
Canadian Banking
Retail 0.31 0.32 0.34 0.31 0.30
Commercial 0.14 0.21 0.14 0.09 0.07
Total 0.28 0.30 0.31 0.28 0.27
Total – Excluding Net Acquisition Benefit 0.29 0.31 0.32 0.29 0.28
International Banking
Retail 2.01 2.10 2.19 2.08 2.00
Commercial 0.33 0.35 0.51 0.31 0.32
Total 1.15 1.21 1.33 1.16 1.14
Total – Excluding Net Acquisition Benefit 1.32 1.32 1.45 1.27 1.34
Global Banking & Markets 0.19 0.04 0.01 0.11 0.04
All Bank 0.45 0.45 0.49 0.45 0.42

17
APPENDIX
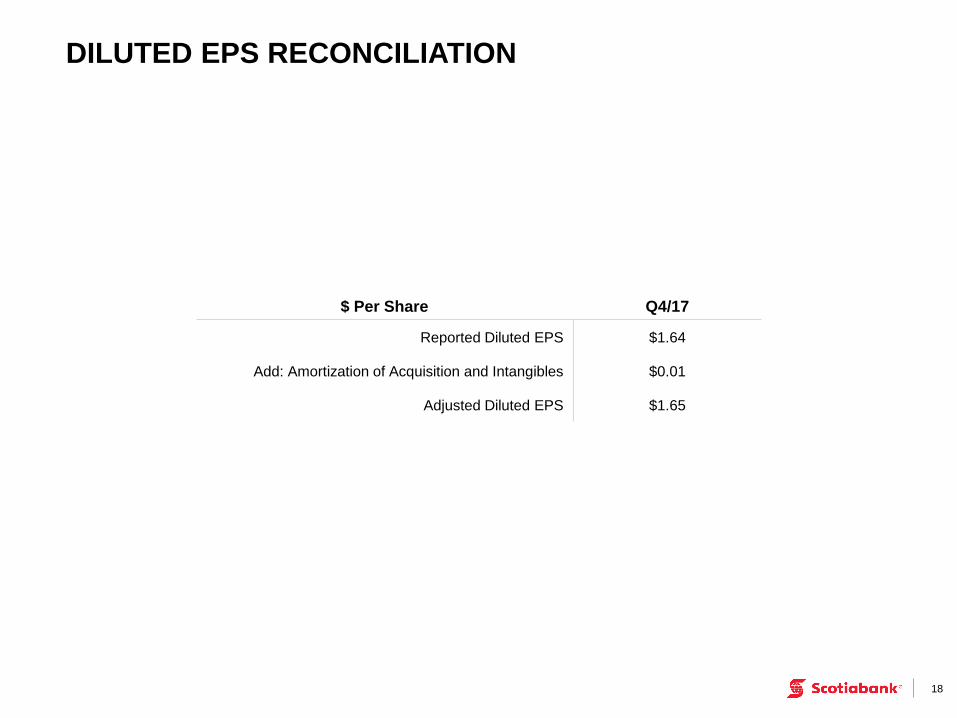
DILUTED EPS RECONCILIATION
18
$ Per Share Q4/17
Reported Diluted EPS $1.64
Add: Amortization of Acquisition and Intangibles $0.01
Adjusted Diluted EPS $1.65

CORE BANKING MARGIN
YEAR-OVER-YEAR HIGHLIGHTS
• Lower margins in International Banking given asset mix changes and lower inflation
• Partly offset by wider margins in Canadian Banking
19
2.40%
2.40%
2.54%
2.46%
2.44%
Q4/16 Q1/17 Q2/17 Q3/17 Q4/17

CANADIAN BANKING – REVENUE GROWTH AND NIM
20
Good retail and commercial revenue growth
REVENUE (TEB) ($MM) NIM (%)
Retail Commercial Wealth
1,778 1,889 1,869
521 546 581
813 831 815
Q4/16 Q3/17 Q4/17
3,266 3,112
3,265
+5%
Y/Y +5%
Y/Y
Total Canadian Banking Margin
Total Earning Asset Margin
Total Deposits Margin
2.39% 2.39% 2.38% 2.41% 2.41%
1.67% 1.64% 1.65% 1.68% 1.66%
0.94% 0.97% 0.97% 0.96% 0.99%
Q4/16 Q1/17 Q2/17 Q3/17 Q4/17
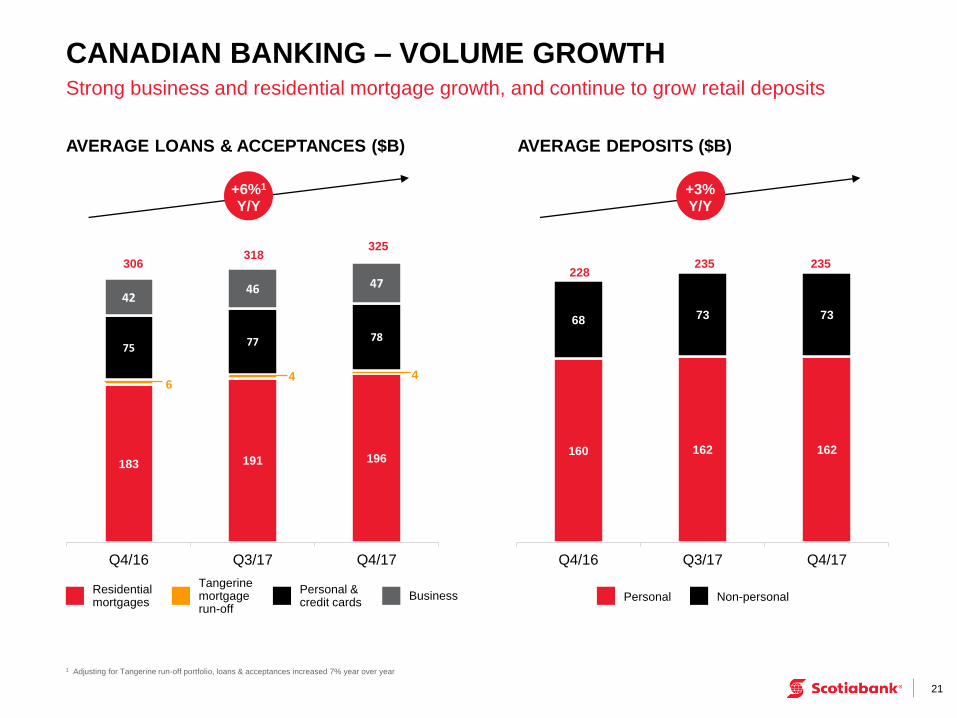
183 191 196
75 77 78
42 46 47
Q4/16 Q3/17 Q4/17
318 325
CANADIAN BANKING – VOLUME GROWTH
21
Strong business and residential mortgage growth, and continue to grow retail deposits
AVERAGE LOANS & ACCEPTANCES ($B)
1 Adjusting for Tangerine run-off portfolio, loans & acceptances increased 7% year over year
AVERAGE DEPOSITS ($B)
160 162 162
68 73 73
Q4/16 Q3/17 Q4/17
228 235 235
Personal Non-personal
6 4 4
Residential mortgages
Tangerine mortgage run-off
Personal & credit cards
Business
+6%1
Y/Y +3%
Y/Y
306
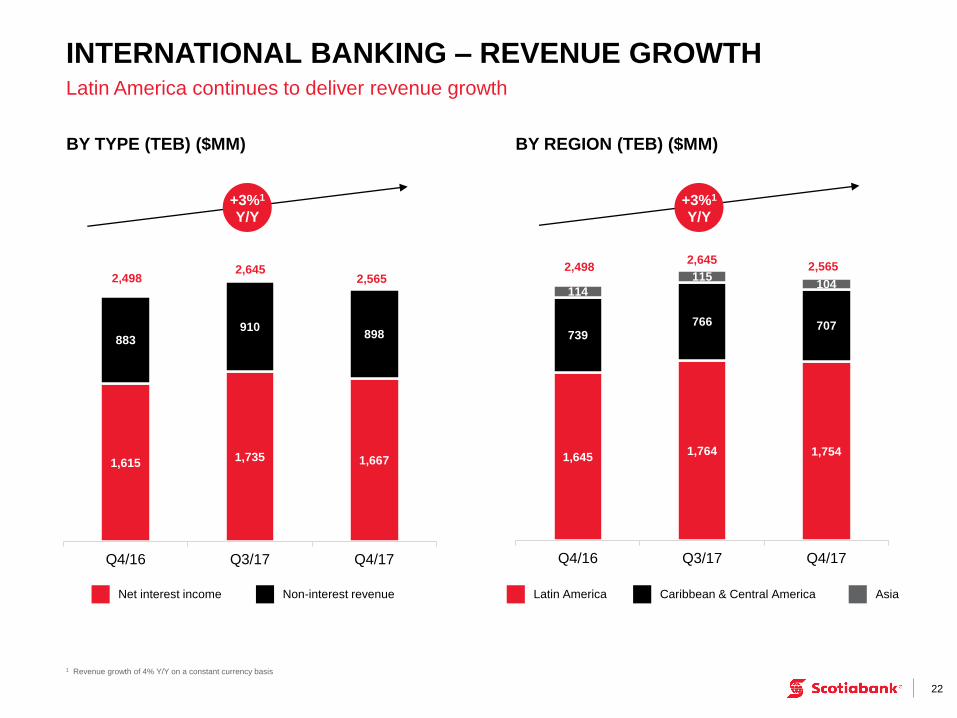
22
Latin America continues to deliver revenue growth
BY TYPE (TEB) ($MM)
1,615 1,735 1,667
883 910
898
Q4/16 Q3/17 Q4/17
Net interest income Non-interest revenue
2,498 2,645
2,565
INTERNATIONAL BANKING – REVENUE GROWTH
BY REGION (TEB) ($MM)
1,645 1,764 1,754
739 766 707
114
115 104
Q4/16 Q3/17 Q4/17
Latin America Caribbean & Central America Asia
2,498 2,645
2,565
+3%1
Y/Y +3%1
Y/Y
1 Revenue growth of 4% Y/Y on a constant currency basis

23
Balanced loan and deposit growth
INTERNATIONAL BANKING – VOLUME GROWTH
AVERAGE LOANS & ACCEPTANCES ($B)
53 58 56
27
30 29
24
25 25
Q4/16 Q3/17 Q4/17
104
113 110
1 Includes deposits from banks 2 Average loans & acceptances growth of 10% Y/Y on a constant currency basis 3 Average deposits growth of 11% Y/Y on a constant currency basis
AVERAGE DEPOSITS1 ($B)
56 62 62
34
36 34
Q4/16 Q3/17 Q4/17
90
98 96
Non- Personal Personal Business Residential mortgages
Personal & credit cards
+7%2
Y/Y +7%3
Y/Y
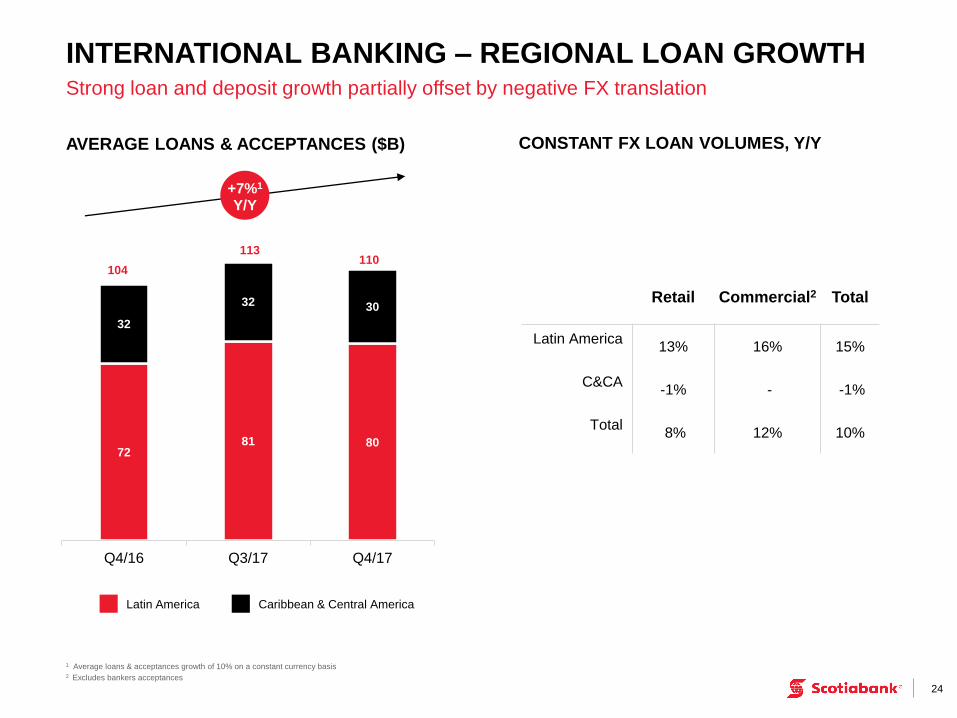
INTERNATIONAL BANKING – REGIONAL LOAN GROWTH
24
Strong loan and deposit growth partially offset by negative FX translation
72 81 80
32
32 30
Q4/16 Q3/17 Q4/17
104
113 110
Latin America Caribbean & Central America
Retail Commercial2 Total
Latin America 13% 16% 15%
C&CA -1% - -1%
Total 8% 12% 10%
AVERAGE LOANS & ACCEPTANCES ($B)
+7%1
Y/Y
CONSTANT FX LOAN VOLUMES, Y/Y
1 Average loans & acceptances growth of 10% on a constant currency basis 2 Excludes bankers acceptances
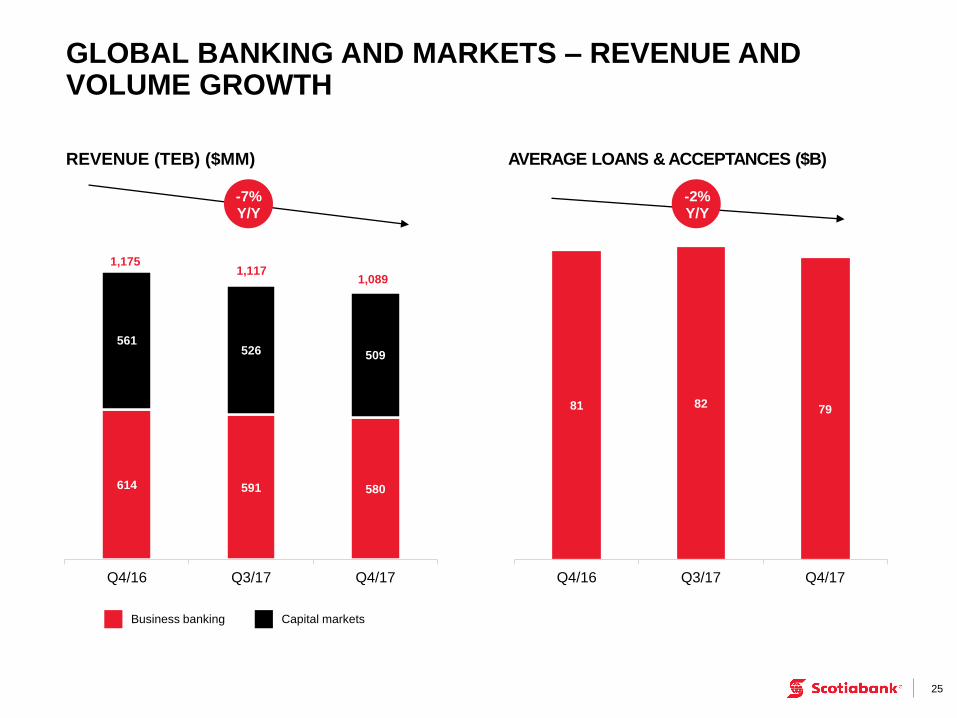
25
REVENUE (TEB) ($MM)
614 591 580
561 526 509
Q4/16 Q3/17 Q4/17
Business banking Capital markets
1,175 1,117
1,089
AVERAGE LOANS & ACCEPTANCES ($B)
GLOBAL BANKING AND MARKETS – REVENUE AND VOLUME GROWTH
-7%
Y/Y -2%
Y/Y
81 82 79
Q4/16 Q3/17 Q4/17
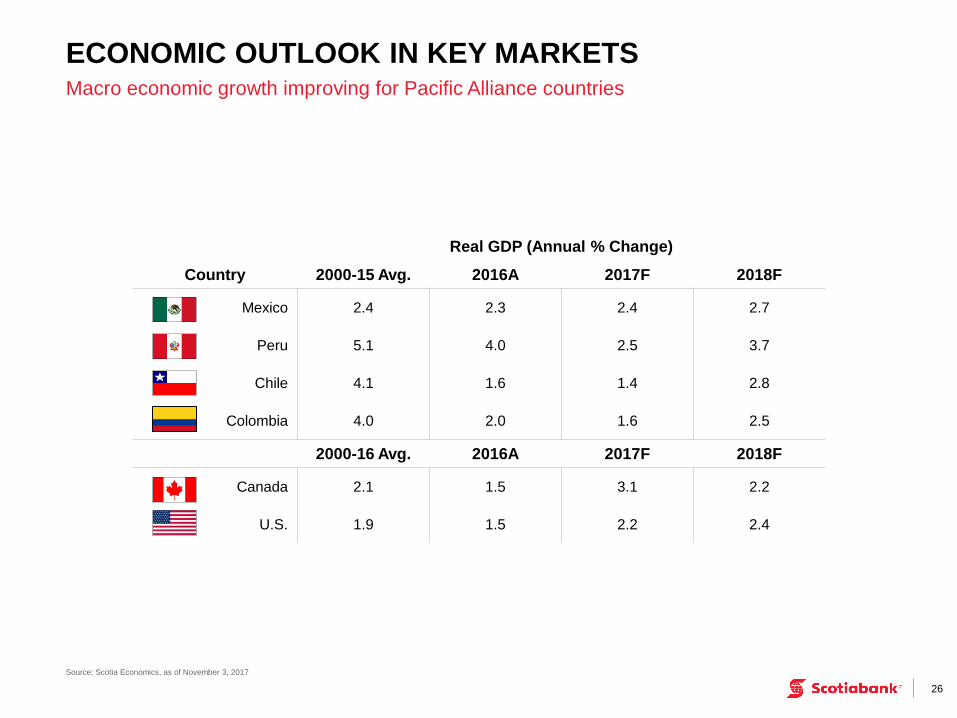
ECONOMIC OUTLOOK IN KEY MARKETS
Source: Scotia Economics, as of November 3, 2017
26
Macro economic growth improving for Pacific Alliance countries
Real GDP (Annual % Change)
Country 2000-15 Avg. 2016A 2017F 2018F
Mexico 2.4 2.3 2.4 2.7
Peru 5.1 4.0 2.5 3.7
Chile 4.1 1.6 1.4 2.8
Colombia 4.0 2.0 1.6 2.5
2000-16 Avg. 2016A 2017F 2018F
Canada 2.1 1.5 3.1 2.2
U.S. 1.9 1.5 2.2 2.4
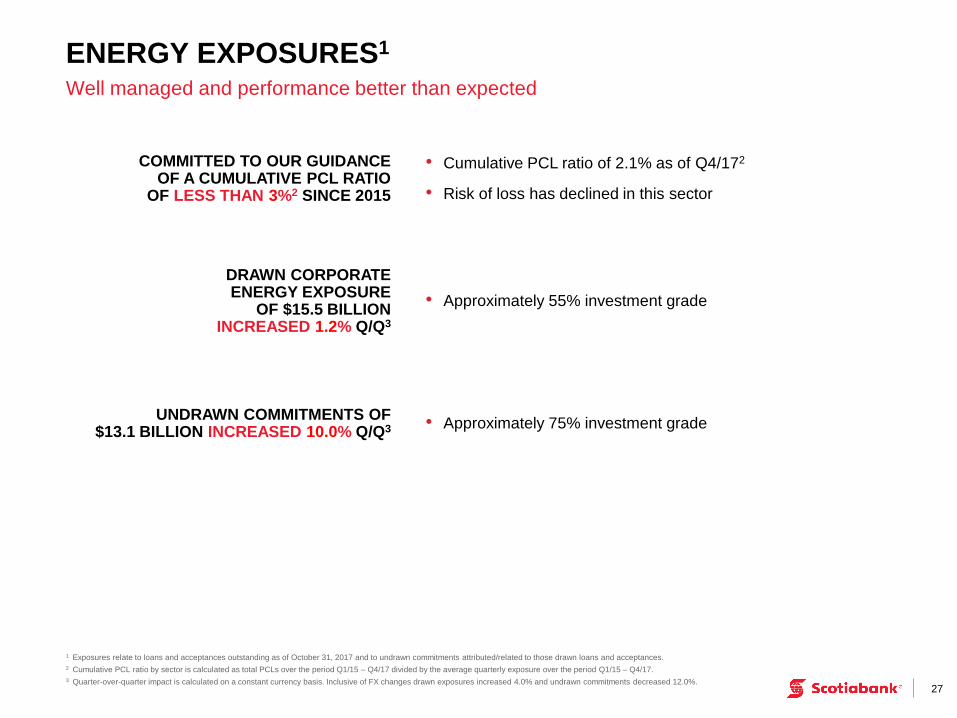
ENERGY EXPOSURES1
27
Well managed and performance better than expected
COMMITTED TO OUR GUIDANCE OF A CUMULATIVE PCL RATIO
OF LESS THAN 3%2 SINCE 2015
1 Exposures relate to loans and acceptances outstanding as of October 31, 2017 and to undrawn commitments attributed/related to those drawn loans and acceptances.
2 Cumulative PCL ratio by sector is calculated as total PCLs over the period Q1/15 – Q4/17 divided by the average quarterly exposure over the period Q1/15 – Q4/17.
3 Quarter-over-quarter impact is calculated on a constant currency basis. Inclusive of FX changes drawn exposures increased 4.0% and undrawn commitments decreased 12.0%.
DRAWN CORPORATE ENERGY EXPOSURE
OF $15.5 BILLION INCREASED 1.2% Q/Q3
UNDRAWN COMMITMENTS OF $13.1 BILLION INCREASED 10.0% Q/Q3
• Cumulative PCL ratio of 2.1% as of Q4/172
• Risk of loss has declined in this sector
• Approximately 55% investment grade
• Approximately 75% investment grade
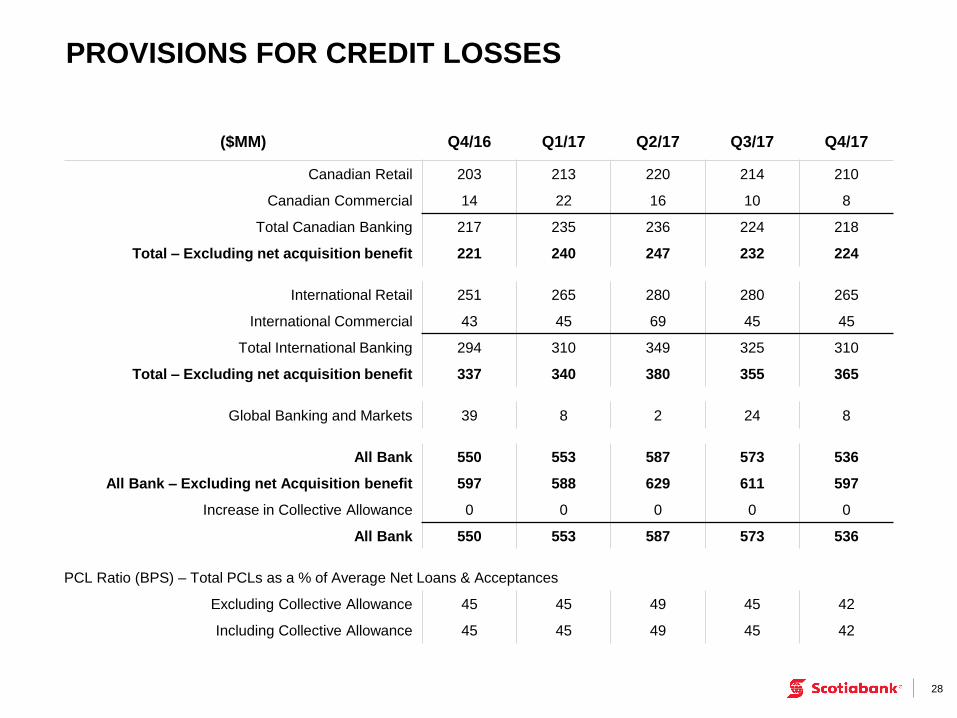
PROVISIONS FOR CREDIT LOSSES
28
($MM) Q4/16 Q1/17 Q2/17 Q3/17 Q4/17
Canadian Retail 203 213 220 214 210
Canadian Commercial 14 22 16 10 8
Total Canadian Banking 217 235 236 224 218
Total – Excluding net acquisition benefit 221 240 247 232 224
International Retail 251 265 280 280 265
International Commercial 43 45 69 45 45
Total International Banking 294 310 349 325 310
Total – Excluding net acquisition benefit 337 340 380 355 365
Global Banking and Markets 39 8 2 24 8
All Bank 550 553 587 573 536
All Bank – Excluding net Acquisition benefit 597 588 629 611 597
Increase in Collective Allowance 0 0 0 0 0
All Bank 550 553 587 573 536
PCL Ratio (BPS) – Total PCLs as a % of Average Net Loans & Acceptances
Excluding Collective Allowance 45 45 49 45 42
Including Collective Allowance 45 45 49 45 42
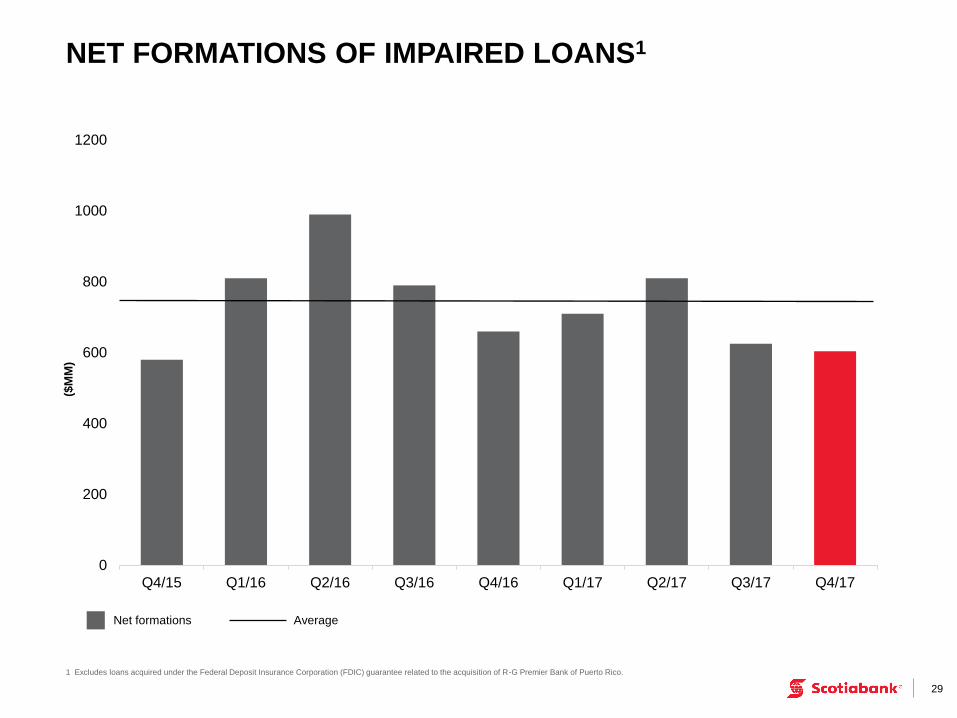
NET FORMATIONS OF IMPAIRED LOANS1
1 Excludes loans acquired under the Federal Deposit Insurance Corporation (FDIC) guarantee related to the acquisition of R-G Premier Bank of Puerto Rico.
29
0
200
400
600
800
1000
1200
Q4/15 Q1/16 Q2/16 Q3/16 Q4/16 Q1/17 Q2/17 Q3/17 Q4/17
Net formations Average
($M
M)
0
1
2
3
4
5
6
Q4/15 Q1/16 Q2/16 Q3/16 Q4/16 Q1/17 Q2/17 Q3/17 Q4/17
GROSS IMPAIRED LOANS1
30
1 Excludes loans acquired under the Federal Deposit Insurance Corporation (FDIC) guarantee related to the acquisition of R-G Premier Bank of Puerto Rico.
GILs (LHS) GILs as % of loans & BAs (RHS)
0.85%
0.90%
0.95%
1.00%
1.05%
1.10%
1.15%
($B
)
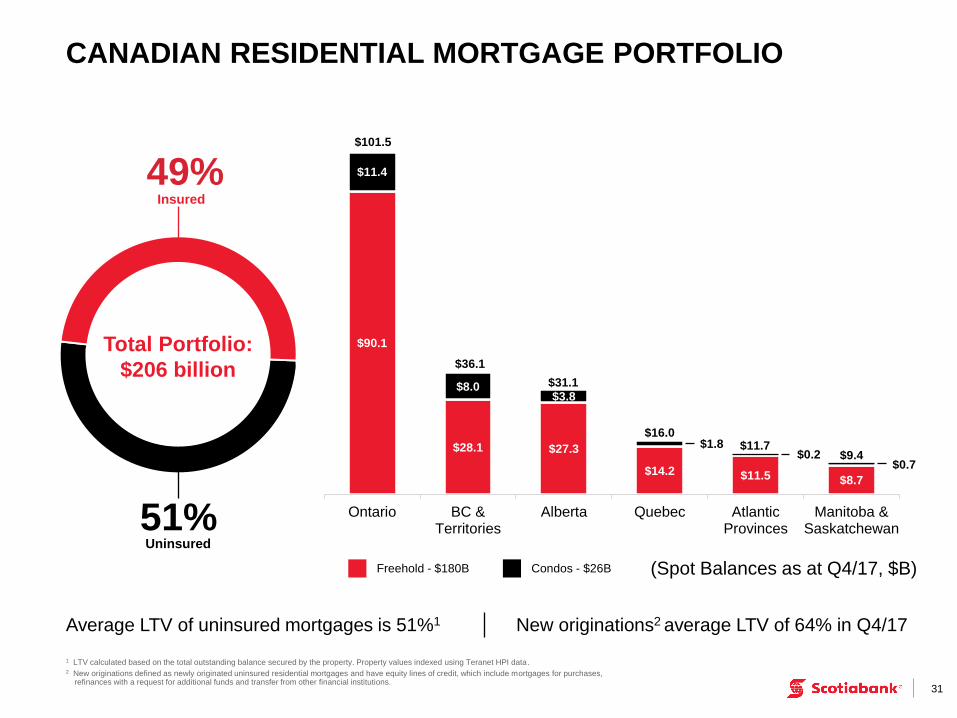
$90.1
$28.1 $27.3
$14.2 $11.5 $8.7
$11.4
$8.0 $3.8
Ontario BC &Territories
Alberta Quebec AtlanticProvinces
Manitoba &Saskatchewan
$1.8
CANADIAN RESIDENTIAL MORTGAGE PORTFOLIO
1 LTV calculated based on the total outstanding balance secured by the property. Property values indexed using Teranet HPI data. 2 New originations defined as newly originated uninsured residential mortgages and have equity lines of credit, which include mortgages for purchases, refinances with a request for additional funds and transfer from other financial institutions.
31
49%
51% Uninsured
Total Portfolio:
$206 billion
Average LTV of uninsured mortgages is 51%1 New originations2 average LTV of 64% in Q4/17
Insured
$0.2 $0.7
Freehold - $180B Condos - $26B
$101.5
$36.1
$31.1
(Spot Balances as at Q4/17, $B)
$16.0 $11.7
$9.4
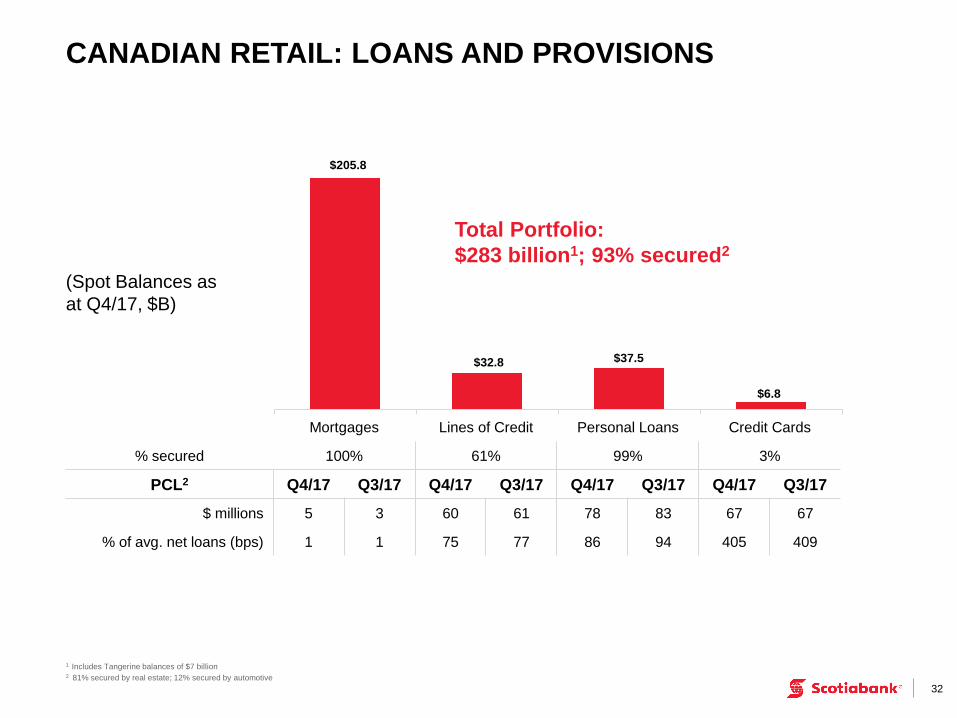
CANADIAN RETAIL: LOANS AND PROVISIONS
32
1 Includes Tangerine balances of $7 billion 2 81% secured by real estate; 12% secured by automotive
$6.8
$37.5 $32.8
$205.8
(Spot Balances as
at Q4/17, $B)
Total Portfolio:
$283 billion1; 93% secured2
Mortgages Lines of Credit Personal Loans Credit Cards
% secured 100% 61% 99% 3%
PCL2 Q4/17 Q3/17 Q4/17 Q3/17 Q4/17 Q3/17 Q4/17 Q3/17
$ millions 5 3 60 61 78 83 67 67
% of avg. net loans (bps) 1 1 75 77 86 94 405 409

$12.0
$6.9 $7.3
$2.7 $2.0
$4.3
$2.7 $3.6
$3.7
$2.0
$1.8
$1.7
$1.4
$1.6
INTERNATIONAL RETAIL: LOANS AND PROVISIONS
1 Total Portfolio includes other smaller portfolios 2 Excludes Uruguay PCLs of approximately $13 million 3 Includes the benefits from Cencosud and Citibank net acquisition benefits. Excluding the net acquisition benefits, C&CA’s rat io would be 148 bps for Q4/17 and 119 bps for Q3/17 and Chile’s ratio would be 136 bps for Q4/17 and 124 bps for Q3/17 33
C&CA3 Mexico Chile3 Peru3 Colombia
PCL2 Q4/17 Q3/17 Q4/17 Q3/17 Q4/17 Q3/17 Q4/17 Q3/17 Q4/17 Q3/17
$ millions 30 36 43 40 29 27 74 71 76 93
% of avg. net loans (bps) 70 78 168 156 96 92 405 383 571 683
$18.1
$10.1
$12.6
$7.8
$5.6
$0.5
(Spot Balances as
at Q4/17, $ B1)
Total Portfolio1:
$56 billion; 67% secured
Mortgages ($30.9B) Personal loans ($16.3B) Credit cards ($7.0B)

Q4 2017 TRADING RESULTS
34
(# o
f d
ays
in
qu
art
er)
Daily Trading Revenues ($MM)
Two trading loss days in Q4/17
0
2
4
6
8
10
12
14
-0.3 2 3 4 5 6 7 8 9 10 13 15 17 22

-15
-10
-5
0
5
10
15
20
25
Mill
ion
s
Q4 2017 TRADING RESULTS AND ONE-DAY TOTAL VAR
35
1-day total VaR Actual P&L
Average 1-Day Total VaR
Q4/17: $10.8 MM
Q3/17: $11.0 MM
Q4/16: $10.4 MM
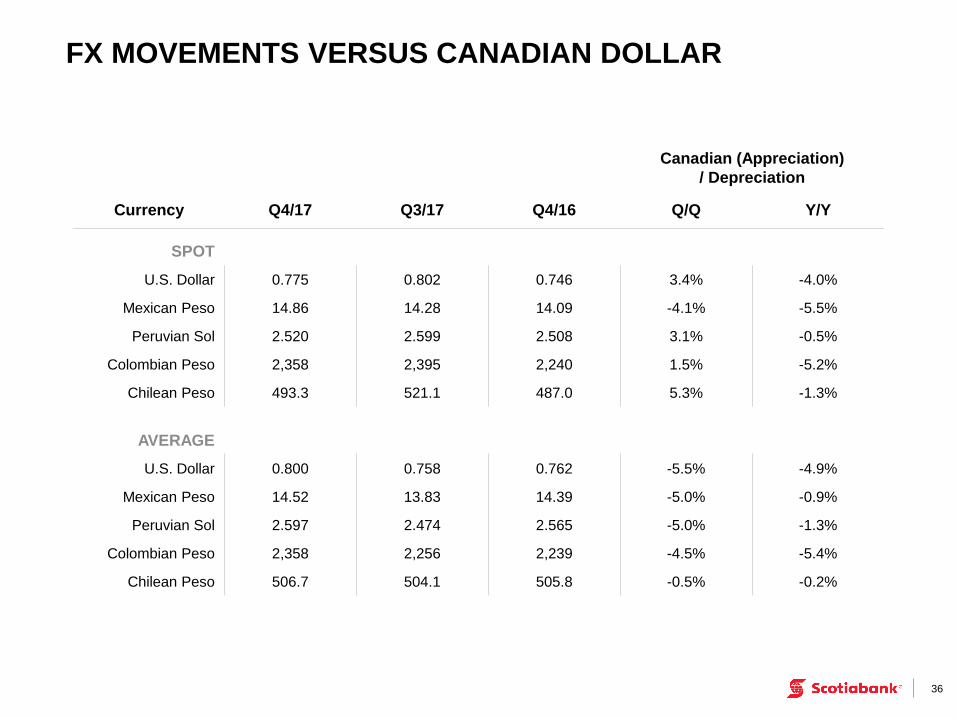
FX MOVEMENTS VERSUS CANADIAN DOLLAR
36
Canadian (Appreciation)
/ Depreciation
Currency Q4/17 Q3/17 Q4/16 Q/Q Y/Y
SPOT
U.S. Dollar 0.775 0.802 0.746 3.4% -4.0%
Mexican Peso 14.86 14.28 14.09 -4.1% -5.5%
Peruvian Sol 2.520 2.599 2.508 3.1% -0.5%
Colombian Peso 2,358 2,395 2,240 1.5% -5.2%
Chilean Peso 493.3 521.1 487.0 5.3% -1.3%
AVERAGE
U.S. Dollar 0.800 0.758 0.762 -5.5% -4.9%
Mexican Peso 14.52 13.83 14.39 -5.0% -0.9%
Peruvian Sol 2.597 2.474 2.565 -5.0% -1.3%
Colombian Peso 2,358 2,256 2,239 -4.5% -5.4%
Chilean Peso 506.7 504.1 505.8 -0.5% -0.2%

INVESTOR RELATIONS CONTACT INFORMATION
37
Adam Borgatti, Vice President 416-866-5042
Steven Hung, Director 416-933-8774