investor presentation - rci bank and services · investor presentation 2017 results february 19th,...
TRANSCRIPT

12017 RESULTSINVESTOR PRESENTATION FEBRUARY 19TH, 2018
2017 RESULTS
INVESTOR PRESENTATION

22017 RESULTSINVESTOR PRESENTATION FEBRUARY 19TH, 2018
This presentation is not, and is not intended to be, an offer to sell any security or the solicitation of an offer to purchase any security.
The following presentation has been prepared to provide information about RCI Banque; Information have been obtained from sourcesbelieved to be reliable. None warrant its completeness or accuracy.
This presentation may contain forward-looking statements, in particular statements regarding our plans, strategies, prospects andexpectations regarding our business. You should be aware that these statements and any other forward-looking statements, in thispresentation, only reflect our expectation and are not guarantees of performance near and in the future.
These statements involve risks, uncertainties and assumptions about events or conditions and is indented only to illustrate hypotheticalresults under those assumptions. Actual events or conditions are unlikely to be consistent with, and may differ materially from, thoseassumed. In addition not all relevant events or conditions may have been considered in developing such assumptions. Accordingly, actualresults will vary and the variations may be material. Prospective investors should understand such assumption and evaluate whether theyare appropriate for their purposes.
The information contained herein does not constitute an offer for sale in the United States. The securities described herein have not, and willnot, be registered under the U.S. Securities Act of 1933 or with any securities regulatory authority of any state or other jurisdiction in theUnited States and may not be offered or sold, directly or indirectly, into the United States unless the securities are so registered or anexemption from the registration requirements is available.
DISCLAIMER

32017 RESULTSINVESTOR PRESENTATION FEBRUARY 19TH, 2018
AGENDA
4 APPENDICES
3 FINANCIAL POLICY AND FUNDING
2 OPERATING HIGHLIGHTS
1 RCI BANQUE OVERVIEW

42017 RESULTSINVESTOR PRESENTATION FEBRUARY 19TH, 2018
RCI BANQUE OVERVIEW
1

52017 RESULTSINVESTOR PRESENTATION FEBRUARY 19TH, 2018
● RCI Banque identity:
● Renault-Nissan Alliance brands finance company
● 100% owned by Renault SA
● Bank status since 1991
● ECB supervision since 2016
● Retail, corporates and dealers inventory financing
● 7 brands financed (*) in 36 countries
● 2017 key figures:
● Equity: € 4.7bn
● Net customer deposits: € 14.9bn
● Penetration rate: 39.6%
● New contracts (in k units): 1,771
● Commercial assets: € 43.8bn of which:
RCI BANQUE OVERVIEW
IDENTITY AND 2017 KEY FIGURES
AMI (**); 1%
Asia-Pacific; 4%
Americas; 6%
Eurasia; 0%
Europe (excluding
France); 59%€ 43.8bn
(*) Since February 2018, commercial partnership
with Mitsubishi Motors in Netherlands
(**) AMI: Africa, Middle-East, India
France ; 30%

62017 RESULTSINVESTOR PRESENTATION FEBRUARY 19TH, 2018
RCI BANQUE OVERVIEW
RATINGS
● Moody’s ratings:
● Long-term: Baa1
● Outlook: Positive (*)
● Short-term: P-2
● Strengths: “high and stable earning stream; limited credit losses; essential to its parent’s strategy; strong profitability through the credit cycle; limited refinancing risk, increasing deposit base and adequate liquidity buffer”
● Weaknesses: “lack of business diversification; large exposures to car dealers; car market cyclical by nature; reliant on wholesale funding”
● Renault: Baa3, positive outlook (**) / P-3
● Standard and Poor’s ratings:
● Long-term: BBB
● Outlook: Stable
● Short-term: A-2
● Strengths: “strong and recurring risk-adjusted profitability; regulated bank insulated from its corporate parent; strong capitalization; striking balance between growth and profitability; low cost base and effective cost control”
● Weaknesses: “predominantly wholesale-funded; business concentration in car financing; dependence on parent’s franchise and product cycles”
● Renault: BBB, stable outlook / A-2
● Independent ratings from parent Renault SA supported by bank status and independent funding
(*) Since January 26th, 2018
(**) Since January 15th, 2018

72017 RESULTSINVESTOR PRESENTATION FEBRUARY 19TH, 2018
OPERATING HIGHLIGHTSNB: FIGURES RELATED TO COMMERCIAL ACTIVITY (PENETRATION RATE, NEW FINANCINGS, CONTRACTS PROCESSED) INCLUDE EQUITY METHOD CONSOLIDATED ENTITIES. BALANCE SHEET FIGURES (OUTSTANDINGS) EXCLUDE THESE ENTITIES
2
82017 RESULTSINVESTOR PRESENTATION FEBRUARY 19TH, 2018
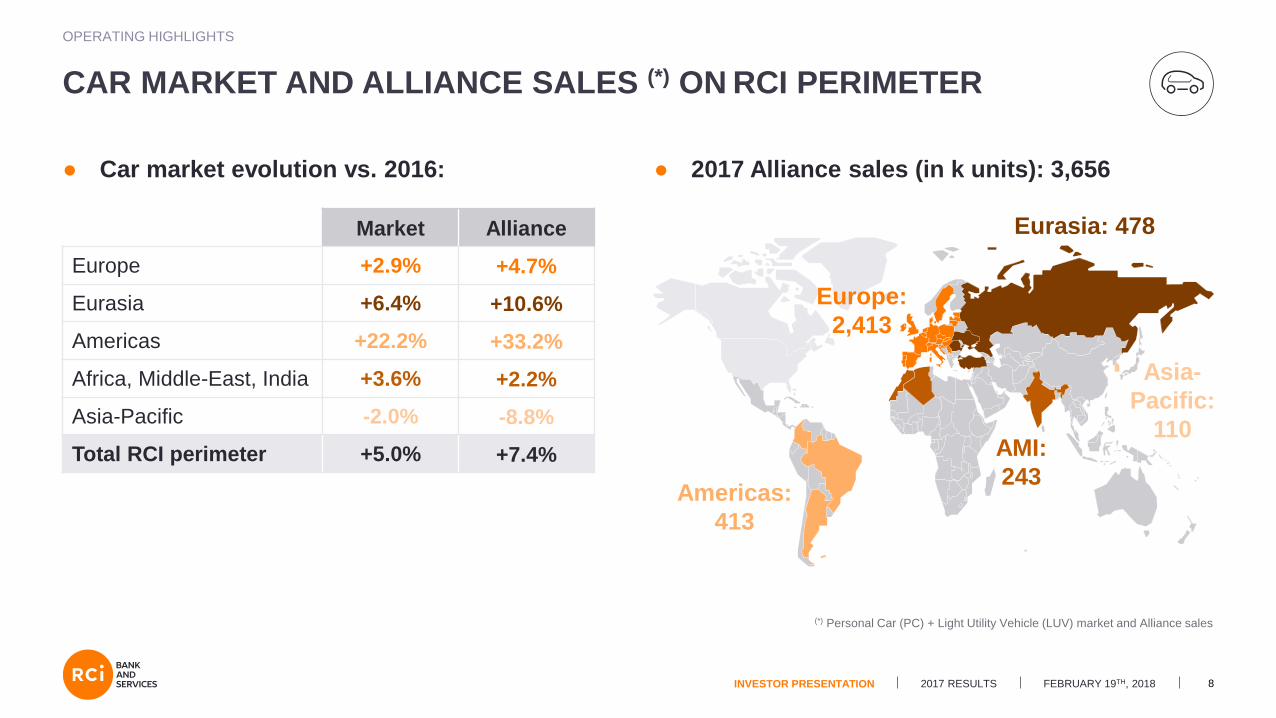
● Car market evolution vs. 2016: ● 2017 Alliance sales (in k units): 3,656
OPERATING HIGHLIGHTS
CAR MARKET AND ALLIANCE SALES (*) ON RCI PERIMETER
Europe:
2,413
Americas:
413
Eurasia: 478
Asia-
Pacific:
110AMI:
243
(*) Personal Car (PC) + Light Utility Vehicle (LUV) market and Alliance sales
Market Alliance
Europe +2.9% +4.7%
Eurasia +6.4% +10.6%
Americas +22.2% +33.2%
Africa, Middle-East, India +3.6% +2.2%
Asia-Pacific -2.0% -8.8%
Total RCI perimeter +5.0% +7.4%

92017 RESULTSINVESTOR PRESENTATION FEBRUARY 19TH, 2018
34.635.2
37.137.7
39.636.7 36.9
40.041.0
42.6
2013 2014 2015 2016 2017
RCI RCI pro forma
● Financing penetration rate at 39.6% (+1.9pts), of which:
OPERATING HIGHLIGHTS
PENETRATION RATE (*)
(*) Number of new vehicles financed / new vehicles sold in RCI Banque perimeter. In %
(**) Excluding impact of Turkey, Russia and India (entities less mature and having below-average penetration rates)
● Renault: 40.1% (+2.3pts)
● Dacia: 42.8% (+2.2pts)
● Renault Samsung Motors: 57.4% (+4.5pts)
● Nissan-Infiniti-Datsun: 34.1% (+0.5pt)
(**)

102017 RESULTSINVESTOR PRESENTATION FEBRUARY 19TH, 2018
Europe (excluding France);
49%
France; 25%
Americas; 11%
Eurasia; 8%
● New contracts geographical breakdown(in k units):
2013 2014 2015 2016 2017
Renault Dacia
Renault Samsung Motors Nissan-Infiniti-Datsun
Other brands
● New financings (*) by brand (€bn):
OPERATING HIGHLIGHTS
BREAKDOWN OF NEW PRODUCTION
11.412.6
15.617.9
AMI (**); 3%Asia-Pacific; 4%
(*) Excluding cards and personal loans
(**) AMI: Africa, Middle-East, India
+15%20.6
1,771
112017 RESULTSINVESTOR PRESENTATION FEBRUARY 19TH, 2018
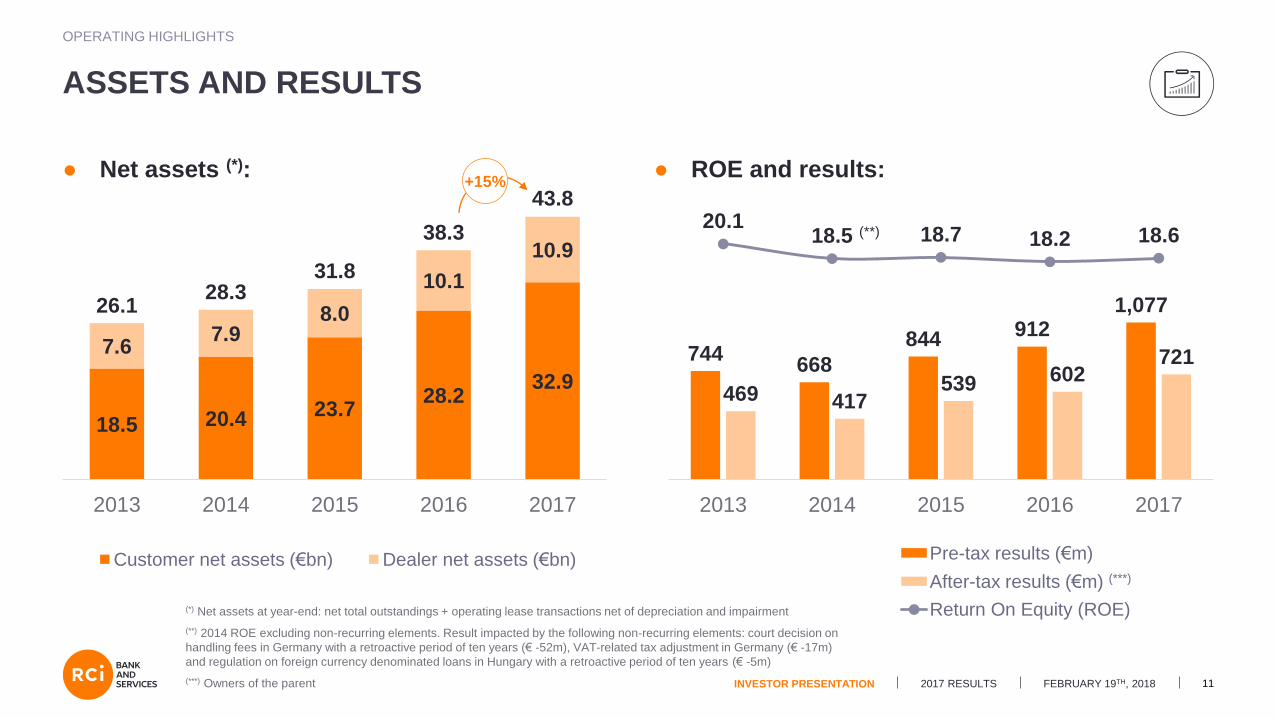
18.5 20.4 23.728.2
32.9
7.67.9
8.0
10.1
10.9
2013 2014 2015 2016 2017
Customer net assets (€bn) Dealer net assets (€bn)
● ROE and results:● Net assets (*):
744668
844 9121,077
469 417539 602
721
20.118.5 18.7 18.2 18.6
2013 2014 2015 2016 2017
Pre-tax results (€m)
After-tax results (€m)
Return On Equity (ROE)
OPERATING HIGHLIGHTS
ASSETS AND RESULTS
26.128.3
31.8
38.3
43.8
(*) Net assets at year-end: net total outstandings + operating lease transactions net of depreciation and impairment
(**) 2014 ROE excluding non-recurring elements. Result impacted by the following non-recurring elements: court decision on
handling fees in Germany with a retroactive period of ten years (€ -52m), VAT-related tax adjustment in Germany (€ -17m)
and regulation on foreign currency denominated loans in Hungary with a retroactive period of ten years (€ -5m)
(***) Owners of the parent
(***)
+15%
(**)

122017 RESULTSINVESTOR PRESENTATION FEBRUARY 19TH, 2018
● Profit and loss aggregates (1) in percentage of average performing assets:
OPERATING HIGHLIGHTS
FINANCIAL PERFORMANCE
2013 2014 2015 2016 2017
Net banking income (2) 5.04 4.98 4.75 4.41 4.11
Cost of risk (3) -0.42 -0.43 -0.33 -0.31 -0.11
Operating expenses -1.56 -1.58 -1.49 -1.39 -1.32
Operating income 3.06 2.97 2.94 2.71 2.68
OEIC and equity method (4) 0.01 -0.32 0.01 0.03 0.04
Pre-tax income 3.07 2.65 2.95 2.74 2.72
(1) Analytical breakdown derived from RCI Banque’s financial controlling system(2) Excluding non-recurring elements(3) Including country risk(4) Other exceptional income and charges and share of equity-accounted companies’ result

132017 RESULTSINVESTOR PRESENTATION FEBRUARY 19TH, 2018
0.410.43
0.33 0.31
0.11
0.46
0.50
0.40
0.33
0.19
0.26
0.20
0.13
0.21
-0.15
2013 2014 2015 2016 2017
Total cost of risk
Customer cost of risk
Dealer cost of risk
● Cost of risk in percentage of average performing assets excluding country risk (**) at 0.11% (-20bp):
OPERATING HIGHLIGHTS
COST OF RISK (*)
(*) Cost of risk = Impairment allowances - Reversal of impairment + Losses on receivables written off - Amounts recovered on loans written off
(**) Country risk = Allowances for country risk are determined on the basis of the systemic credit risk to which debtors are exposed in the
event of a continued and persistent deterioration in the economic and general situation of the states included in this base. The provision
concerns assets located in countries that are not part of the Eurozone where the sovereign S&P rating is below BBB+, and whose
outstanding risk is borne by the RCI Banque group
(***) Improvement in the economic environment, a variable used in calibrating provisions on sound Dealer outstandings, led to reversals of
provisions on the Dealer financing portfolio. The cost of risk was thus negative (income)
Charge
Income(***)

142017 RESULTSINVESTOR PRESENTATION FEBRUARY 19TH, 2018
● Residual value risk borne by RCI Banque:
● In most countries, residual value risk carried by carmakers or dealers
● Residual value exposure borne by RCI Banque mostly located in the UK
● Low overall exposure on residual values
● Increase in UK residual value exposure due to:
- Rise in UK volumes
- Internalization (July 2014) of fleet financing business, previously externalized
OPERATING HIGHLIGHTS
RESIDUAL VALUE METRICS
2013 2014 2015 2016 2017
Residual value risk (€m) 569 912 1,649 1,899 1,981
Provisions (€m) 2 6 15 36 67
Provisions (%) 0.4% 0.6% 0.9% 1.9% 3.4%

152017 RESULTSINVESTOR PRESENTATION FEBRUARY 19TH, 2018
● New services contracts:
300339
390 411
495
1.69%1.81% 1.83%
1.63% 1.66%
2013 2014 2015 2016 2017
Margin on services (€m)
Margin in % of average Customer assets
1,7562,168
2,8513,415
4,3551.51.7
2.12.2
2.5
2013 2014 2015 2016 2017
Services contracts (thousands)
Ratio of services sold per vehicle contract
● Margin on services:
OPERATING HIGHLIGHTS
SERVICES
+28%
+17%
(*) Of which 2,199k (51%) car centric, 1,529k (35%) finance centric and 627k (14%) customer centric contracts
(*)

162017 RESULTSINVESTOR PRESENTATION FEBRUARY 19TH, 2018
2,5522,856
3,3263,899
4,442
2,7663,275
3,8684,42411.7 11.5
15.1 15.7 15.0
11.1
14.7 15.4 14.714.5 14.9 14.2
2013 2014 2015 2016 2017 2014 2015 2016 2017
Core Tier 1 in €m Core Tier 1 ratio in % Core Tier 1 ratio excluding floor in %
● Core Tier 1 ratio at 15.0%:
OPERATING HIGHLIGHTS
SOLVENCY
Basel II Basel III phase-in Basel III fully loaded
(*)
0.0 Leverage ratio in %
8.68.28.58.5 8.6 8.48.6 8.6
(*) 2017: The ratio includes a recalibration of certain parameters of internal models used for risk weighted assets calculation. In addition, subject to the ongoing control and validation works, the
application of IFRS 9 should have a maximum impact on the solvency ratio estimated at -0.20%
(**) 2015: A clarification with the regulator of the methodology used to calculate the regulatory capital requirements, led RCI to exclude the additional capital requirement linked to the Basel I floor.
The Core Tier 1 ratio at 2015 end also includes a post-publication methodological adjustment
on RWA for operational risk. Excluding this adjustment, the ratio would have been 15.6%
(**) (*)(**)

172017 RESULTSINVESTOR PRESENTATION FEBRUARY 19TH, 2018
FINANCIAL POLICY AND FUNDING
3

182017 RESULTSINVESTOR PRESENTATION FEBRUARY 19TH, 2018
FINANCIAL POLICY AND FUNDING
DEBT STRUCTURE AT 2017 END
Others: € 0.1bn; -
Central banks: € 2.5bn; 6%
Banks & Schuldschein: € 2.4bn; 6%
Securitization: € 2.3bn; 5%
Retail deposits (**): € 14.9bn; 35%
Bonds & EMTN: € 17.9bn; 43%
Renault group (*): € 0.8bn; 2%
€ 42.1bn
Negotiable debt securities: € 1.2bn; 3%
(*) Renault group: of which € 700m deposit granted as collateral
to offset credit exposure on Renault owned dealers
(**) Retail deposits: of which € 11.5bn (27%) in sight deposits
and € 3.5bn (8%) in term deposits

192017 RESULTSINVESTOR PRESENTATION FEBRUARY 19TH, 2018
4,104 4,010 4,100 4,100 4,434
2,549 1,874 2,404 2,6273,580
350913
2,205 1,335
1,770530 96
193306
408
2013 2014 2015 2016 2017
Financial assets (excluding HQLA)
Liquid assets (HQLA)
ECB-eligible assets
Committed credit lines
● Liquidity reserve at € 10.2bn:
FINANCIAL POLICY AND FUNDING
LIQUIDITY RESERVE (*)
(*) European scope
7,533 6,893 8,902 8,368 10,192
(€m)

202017 RESULTSINVESTOR PRESENTATION FEBRUARY 19TH, 2018
● Static liquidity position at 2017 end: ● Assets funded with longer dated liabilities
● Deposits outflows hypothesis resulting from statistical stress on historical observation, significantly more conservative than Basel III
FINANCIAL POLICY AND FUNDING
STATIC LIQUIDITY (*)
(*) On a specific date, the static liquidity represents the sum of the outstanding financial liabilities plus equity, minus the outstanding assets
(mainly loans to Dealers and Customers); in each case assuming no balance sheet changes from the date of calculation. European scope
(€bn)
0
10
20
30
40
50
Dec-1
7
Fe
b-1
8
Apr-
18
Jun-1
8
Aug-1
8
Oct-
18
De
c-1
8
Fe
b-1
9
Apr-
19
Jun-1
9
Aug-1
9
Oct-
19
Dec-1
9
Fe
b-2
0
Apr-
20
Jun-2
0
Aug-2
0
Oct-
20
Dec-2
0
Fe
b-2
1
Apr-
21
Jun-2
1
Aug-2
1
Oct-
21
Dec-2
1
Fe
b-2
2
Apr-
22
Jun-2
2
Aug-2
2
Oct-
22
Dec-2
2
Static liquidity gap Static assets Static liabilities

212017 RESULTSINVESTOR PRESENTATION FEBRUARY 19TH, 2018
0
2
4
6
8
10
12
Dec-17 Jan-18 Feb-18 Mar-18 Apr-18 May-18 Jun-18 Jul-18 Aug-18 Sep-18 Oct-18 Nov-18 Dec-18
Liquidity reserve Stressed outflows
FINANCIAL POLICY AND FUNDING
LIQUIDITY STRESS SCENARIO (*)
● Liquidity stress scenario giving nearly 12 months of visibility: ● Stable balance sheet
● No access to new market funding
● Compliance with 100% LCR
● Stressed deposit outflows hypothesis
(*) European scope
(€bn)
10.2

222017 RESULTSINVESTOR PRESENTATION FEBRUARY 19TH, 2018
0.9 1.3 1.8 1.3 1.2 1.1
3.14.4
7.0 8.19.90.4
0.60.7
0.8
1.3
2.6
3.1
2012 2013 2014 2015 2016 2017
UK
Austria
Germany
France
● Deposits/commercial assets ratio at 34%, in line with group target set at one-third:
FINANCIAL POLICY AND FUNDING
RETAIL DEPOSITS
● Retail deposits reaching € 14.9bn:
● Of which 76.8% in sight deposits and 23.2% in term deposits
● Saving products for retail customers
● 100% on-line through dedicated websites
● Launch of deposit activity in:
● France in February 2012
● Germany in February 2013
● Austria in May 2014
● UK in June 2015
Deposits/commercial assets ratio (%) 3% 17% 23% 32% 33% 34%
0.9
4.3
6.5
10.2
12.6
14.9

232017 RESULTSINVESTOR PRESENTATION FEBRUARY 19TH, 2018
● Capital markets and ABS (€bn):
● RCI has diversified its investor base by issuing non euro-denominated bonds
● Issues in several currencies including CHF, USD and GBP
● Several 7-year bonds issued since 2014 and first 8-year tenor launched in 2017
● Two first dual-tranche bonds in EUR issued in 2017
FINANCIAL POLICY AND FUNDING
2018 FUNDING PLAN (*)
2014 2015 2016 2017 2018 (**)
Bond issuances 2.8 3.2 4.4 6.3 4.0
Other long-term senior unsecured 0.1 0.4 0.2 0.1 0.0
Total long-term senior unsecured 2.9 3.7 4.6 6.4 4.0
ABS (public or conduit) 1.1 0.8 0.9 0.2 0.7
Deposits (new collection, in €bn) 2.2 3.7 2.3 2.4(*) European scope
(**) Forecast as of February 2018

242017 RESULTSINVESTOR PRESENTATION FEBRUARY 19TH, 2018
APPENDICES
4

252017 RESULTSINVESTOR PRESENTATION FEBRUARY 19TH, 2018
171 193 204 207 216 260 240 244 241 295373
442 457 491 460 483 487
704786 773 744
668
844912
1,07710.4 11.4
10.3 10.812.7
13.911.3
12.4 11.814.4
18.4
15.416.7
15.1 14.5 15.116.7
23.5 23.822.2
20.1
16.418.7 18.2 18.6
1993 1994 1995 1996 1997 1998 1999 2000 2001 2002 2003 2004 2005 2006 2007 2008 2009 2010 2011 2012 2013 2014 2015 2016 2017
Income before tax (€m) Return on equity (ROE) (%)
● Evolution of the income before tax (*) and the ROE:
APPENDICES
LITTLE VOLATILITY ON LONG-TERM RESULTS AND PROFITABILITY
(*) IFRS since 2004

262017 RESULTSINVESTOR PRESENTATION FEBRUARY 19TH, 2018
3.4 3.4 3.6 3.8
3.2 3.3 3.3 3.4
4.45.0
4.1
3.53.2
2.82.4
1.91.6 1.4
62 60 6259
6772 72
6972
7782 82 79 79 76 74 72
65
2000 2001 2002 2003 2004 2005 2006 2007 2008 2009 2010 2011 2012 2013 2014 2015 2016 2017
Non-performing loans / total loans (%) Provisions on non-performing loans (%)
APPENDICES
PROVISIONING FOR CUSTOMER ACTIVITY

272017 RESULTSINVESTOR PRESENTATION FEBRUARY 19TH, 2018
3.1 2.8 3.0 3.1 0.9 0.8 1.2 2.2 2.8 2.1 1.9 1.7 1.5 1.5 1.4 1.6 1.6 1.3
32
39
20 2125 23 23
2530
34
4447
33
25 2823
2831
0
2,000
4,000
6,000
8,000
10,000
2000 2001 2002 2003 2004 2005 2006 2007 2008 2009 2010 2011 2012 2013 2014 2015 2016 2017
Non-impaired receivables (€m) Doubtful and compromised receivables (€m)
Provisions on non-impaired receivables (%) Provisions on doubtful and compromised receivables (%)
● The doubtful classification does not generally result from an unpaid installment but rather from an internal decision to put a dealer on watch list due to the worsening of its financial conditions (profitability, indebtedness, equity, etc.)
● RCI Banque maintains its very cautious provisioning policy on non-doubtful outstandings
PROVISIONING FOR DEALER ACTIVITY
APPENDICES

282017 RESULTSINVESTOR PRESENTATION FEBRUARY 19TH, 2018
APPENDICES
DEALERS: LOSSES ON RECEIVABLES WRITTEN OFF
3 3 4 52
4
13
74
6 6
16
12
20
1315 16
12
0.08 0.07 0.09 0.100.04 0.08
0.240.13
0.07 0.12
0.12
0.280.20
0.31
0.19
0.22
0.20
0.12
0.36
0.720.63
0.39
0.19 0.19
0.420.55
0.450.36
-0.17 -0.12
0.02
0.26
0.20
0.13
0.21
-0.15
2000 2001 2002 2003 2004 2005 2006 2007 2008 2009 2010 2011 2012 2013 2014 2015 2016 2017
Losses (€m) Losses (% of Dealer average outstandings) Dealer cost of risk (% of Dealer average outstandings)

292017 RESULTSINVESTOR PRESENTATION FEBRUARY 19TH, 2018
APPENDICES
COMMERCIAL ACTIVITY (*)
Financing
penetration
rate (%)
New vehicle
contracts
(thousands)
New
financings (**)
(€m)
Net assets at
year-end (€m)
o/w Customer
net assets at
year-end (€m)
o/w Dealer
net assets at
year-end (€m)
2016 2017 2016 2017 2016 2017 2016 2017 2016 2017 2016 2017
Europe 41.5 43.3 1,197 1,318 15,175 17,061 33,934 39,028 24,408 28,785 9,526 10,243
of which Germany 39.9 44.1 155 184 2,196 2,739 5,871 6,808 4,402 5,333 1,469 1,475
of which Spain 52.4 54.2 139 161 1,611 1,870 3,426 4,207 2,656 3,279 770 928
of which France 44.4 46.7 425 455 5,270 5,815 11,632 13,315 8,253 9,606 3,379 3,709
of which Italy 57.7 60.0 163 196 2,168 2,769 4,251 5,264 3,156 3,960 1,095 1,304
of which UK 33.5 29.1 146 129 2,132 1,803 4,548 4,787 3,635 3,897 913 890
of which other countries 29.2 31.1 170 193 1,797 2,065 4,206 4,647 2,306 2,710 1,900 1,937
Asia-Pacific (South Korea) 52.3 57.4 70 72 1,014 1,095 1,400 1,561 1,389 1,541 11 20
Americas 37.7 38.8 139 190 1,084 1,644 2,377 2,637 1,925 2,049 452 588
of which Argentina 33.6 35.9 42 54 291 388 379 499 289 344 90 155
of which Brazil 39.7 37.8 96 111 793 1,041 1,998 1,880 1,636 1,498 362 382
of which Colombia - 51.6 - 25 - 215 - 258 - 207 - 51
Africa, Middle East, India 18.2 21.8 43 53 224 253 389 416 321 331 68 85
Eurasia 24.7 26.7 115 138 437 552 159 191 149 179 10 12
TOTAL 37.7 39.6 1,564 1,771 17,933 20,604 38,259 43,833 28,192 32,885 10,067 10,948
(*) Figures refer to Personal Car (PC) + Light Utility Vehicle (LUV) market
(**) Excluding cards and personal loans

302017 RESULTSINVESTOR PRESENTATION FEBRUARY 19TH, 2018
APPENDICES
CONTACTS
RCI Banque - Finance and Treasury Division
14, avenue du Pavé Neuf - 93168 Noisy-le-Grand CEDEX - France
VP Finance & Group Treasurer Jean-Marc SAUGIER +33 1 76 88 87 99 [email protected]
Head of ALM & Corporate Finance Yann PASSERON + 33 1 76 88 69 95 [email protected]
ALM & Corporate FinanceLouis BAPTISTE
Antoine GASCHIGNARD
+33 1 76 88 65 86
+33 1 76 88 81 93
Securitization & Financial Communication Geoffroy BUCHERT +33 1 76 88 81 74 [email protected]
Capital Markets
Jean-Paul LABATE
Romain PITTAVINO
Farid SAADI
+33 1 76 88 88 06
+33 1 76 88 88 04
+33 1 76 88 87 76
Bloomberg RCIB
Reuters RCI BANQUE DIAC

THANK YOU