investor presentation qtrfy19q3 -...
TRANSCRIPT

1

2
Disclaimer
Information contained in our presentation is intended solely for your personal reference and is strictly confidential.
Such information is subject to change without prior notice, its accuracy is not guaranteed and it may not contain all
material information concerning the Company. Neither we nor our advisors make any representation regarding, and
assumes no responsibility or liability for, the accuracy or completeness of, or any errors or omissions in, any
information contained herein.
In addition, certain statements contains our future growth prospects are forward-looking statements, which
involve a number of risks and uncertainties that could cause actual results to differ materially from those in such
forward-looking statements. The risks and uncertainties relating to these statements include, but are not limited to,
risks and uncertainties regarding fluctuations in earnings, fluctuations in foreign exchange rates, our ability to
manage growth, intense competition in aviation sector including those factors which may affect our cost advantage,
wage fluctuations, our ability to attract and retain highly skilled professionals, time and cost overruns on various
parameters, our ability to manage international operations, reduced demand for air travel, liability for damages,
withdrawal or expiration of governmental fiscal incentives, political instability, legal restrictions on raising capital or
general economic conditions affecting our industry.
The words "anticipate", "believe", "estimate", "expect", "intend" and similar expressions, as they relate to us, are
intended to identify certain of such forward-looking statements. The Company may, from time to time, make
additional written and oral forward-looking statements, including statements contained in our reports to
shareholders. The Company does not undertake to update any forward-looking statements that may be made from
time to time by or on behalf of the Company unless it is required by law.

3
Operation snapshot
As on 31st Jan 2019
o 62,000 ~Pax carried per day
o 49 Boeing 737 NG, Boeing Max
o 27 Bombardier Q400 aircraft
o 01 Freighter
o 475 ~Flights per day
o 51 Domestic destinations
o 8 International destinations

4
QUARTER HIGHLIGHTS
Q3 FY19

5
Management Comments
SpiceJet clocks a net profit of INR 55.1 crore in Q3 FY 2019
Reports a 20% growth in Operational Income against the same quarter last year
For the Quarter ending December 2018
Capacity (in terms of Seat Kilometers) up by 16 %
Operating Income up by 20% over Q3 FY2018
Net profit of INR 55.1 crore
Profit of INR 135.5 crore on EBITDA basis
Key operating highlights
Passenger yields up 8% over Q3 FY2018
Average fare up 25% over Q2 FY2019
Highest Passenger Load Factor for a record 45 successive months
Record Passenger Load Factor of 91.6% in Q3
Bags 36 new sectors under UDAN III
Launched 54 new flights including ten under UDAN
GURUGRAM, February 11, 2019: SpiceJet, the country’s favourite carrier, reported a profit of INR 55.1 crore for the quarter ending December 31st,
2018 as against INR 240 crore in the same quarter last year.
A strong 8% increase in passenger yields helped partially offset record high cost due to an increase of 34% in crude oil prices and 11% depreciation of
the Indian Rupee against the USD. The combined effect of these cost escalations was approximately INR 329 crore. The Company also reversed some
portion of its provisions on its FOREX obligations taken during the previous quarter for this financial year.
Total income stood at INR 2,530.8 crore for the reported quarter as against INR 2,096.1 crore in the same quarter last year. For the same comparative
period, expenses were INR 2,475.8 crore as against INR 1,856.1 crore. On an EBITDA basis, SpiceJet reported a profit of INR 135.5 crore. On an
EBITDAR basis, the company reported a profit of INR 478.6 crore. Expenses per ASKM increased by 14% on account of 34% increase in ATF and 11%
increase in exchange rate.
SpiceJet yet again excelled on operational parameters to report the highest passenger load factor amongst all airlines in the country all through the
quarter. The average domestic load factor for the quarter was 91.6%. The airline has registered the industry’s highest load factor for a record 45
successive months.

6
Management Comments, contd…
Between October and December 2018, SpiceJet has added 12 new planes – nine Boeing 737 MAX 8 aircraft and three Q400s. At the end of the
reported quarter, SpiceJet’s fleet size stood at 74 which included 37 Boeing 737 NG aircraft, 10 737 MAX 8, 26 Q400s and one B737 freighter.
The new airplanes have and will further enable SpiceJet to open new routes, while dramatically reducing the fuel and engineering costs, besides
cutting down on noise pollution and greenhouse gas emissions. In 2019, the airline intends to carry on with its plans for aggressive network
expansion – both domestic and international – and setting new benchmarks in regional connectivity. The Company has seven Boeing MAX and one
737 freighter lined up for inductions during the last quarter of this financial year.
The macro environment has improved substantially. India remains the world’s fastest growing aviation market and has witnessed a 17% growth in
passenger traffic in the current financial year till December 2018 (as compared to the same period last year). This is on the back of around 19%
annual growth for the preceding two years. India has 100 operational airports and another 20 odd airports are likely to be added to the country’s
aviation map in the next one-and-a-half years. Crude prices have remained steady in the range of $60-65/barrel as against a peak of $80-85/barrel in
the previous two quarters.
Ajay Singh – Chairman and Managing Director, SpiceJet said, “Despite the huge cost escalation in ATF and exchange rate, SpiceJet has done
remarkably well thanks to our superior revenue performance, tight control on other costs and the continued confidence our passengers have shown
in the airline. With a strong improvement in the macro cost environment and the increasing induction of the fuel efficient MAX aircraft, the outlook
looks stronger than it has over the past year.”
“We continue to pursue our ambitious growth plans religiously as we to introduce new maiden flights, lead the government’s UDAN initiative, add
new aircraft and explore newer growth avenues while keeping our costs under check. With sector headwinds having subsided, we are bullish on our
future prospects and will continue to invest aggressively in creating capacity in line with our forecasts. The new generation 737MAX aircraft with its
cost efficiencies and increased revenue opportunities (due to superior payload performance) will become a substantial portion of our Boeing fleet
further improving our margins. The increased seating capacity on the Bombardier Q400s will also result in improved margins.”
Being the country’s largest regional player, SpiceJet has been at the forefront as the most enthusiastic supporter of UDAN and operates 23 daily
flights under the regional connectivity scheme. The airline most recently won 36 new sectors under the third round of bidding of which two cater to
the unserved markets of Ghazipur and Jharsuguda whereas nine are for the underserved markets of Adampur, Agra, Belagavi, Bhavnagar, Durgapur,
Gwalior, Kishangarh, Pantnagar, and Tanjore.

7
Management Comments, contd…
With the introduction of the Kolkata-Lakhimpur flight, SpiceJet now flies to 51 domestic destinations while Jeddah will be our ninth international
destination. SpiceXpress, the airline’s cargo arm, began services from Guwahati to Hong Kong and Dubai during the quarter. SpiceXpress will add
upto 5 more freighter aircraft in this calendar year.
About SpiceJet Limited
SpiceJet is India’s favourite airline that has made flying affordable for more Indians than ever before. SpiceJet operates 516 average daily flights to
59 destinations, including 51 domestic and 8 international ones. The airline connects its network with a fleet of 48 Boeing 737 MAX and NG jets, 27
Bombardier Q-400s and one B737 freighter. The majority of the airline’s fleet offers SpiceMax, the most spacious economy class seating in India.
SpiceJet also operates a dedicated air cargo service under the brand name SpiceXpress offering safe, on-time, efficient and seamless cargo
connectivity across India and on international routes. SpiceJet is the first Indian airline to offer end-to-end cargo services and the airline’s freighters
fleet consist of Boeing 737 aircraft.
SpiceJet’s standing as the country’s favourite airline has been further reinforced by the multiple awards and recognitions which includes the US-India
Strategic Partnership Forum Leadership Award to Ajay Singh, , Global ‘Low-Cost Leadership Award’ conferred to Mr Singh at the Airline Strategy
Awards 2018 in London, ‘BML Munjal Awards 2018’ for ‘Business Excellence through Learning and Development’, ‘Best Domestic Airline’ Award at
Wings India 2018, ‘EY Entrepreneur of the year 2017 for Business Transformation’ by Ernst & Young, The CAPA Chairman’s Order of Merit for fastest
turnaround in FY 2016, 'Asia's Greatest Brands - 2016', ‘Global Asian of the Year Award’ & 'Asia's Greatest CFO 2016' at the AsiaOne Awards held in
Singapore, ‘World Travel Leaders Award’ at WTM London, ‘Best Check- in Initiative’ award by Future Travel Experience global awards in Las Vegas,
‘Best Domestic Airline’ award at the 10th ASSOCHAM International Conference & Awards (Civil Aviation & Tourism).
For more information on the release, please contact:
Mr. Tushar Srivastava Ms. Sudipta Das
+91 98108 14874 +91 9650602489
Head, Corporate Communications Senior Manager

8
Results

9
Results, contd..

10
Results, contd..1. The standalone financial results for the quarter and year to date from April 1, 2018 to December 31, 2018 have been reviewed by
the Audit Committee and approved by the Board at their meeting held on February 11, 2019, and have been subjected to a limited
review by the statutory auditors of the Company.
2. Based on internal reporting provided to the chief operating decision maker, the standalone financial results relate to “Air transport
services” as the only segment of the Company.
3. The Company had, in earlier financial years, received amounts aggregating Rs.5,790.9 Million from Mr. Kalanithi Maran and M/s KAL
Airways Private Limited (“erstwhile promoters”) as advance money towards proposed allotment of certain securities (189,091,378
share warrants and 3,750,000 non-convertible cumulative redeemable preference shares, issuable based on approvals to be obtained),
to be adjusted at the time those securities were to be issued. Pursuant to the legal proceedings in this regard before the Hon’ble High
Court of Delhi (“Court”) between the erstwhile promoters, the present promoter and the Company, the Company was required to
secure an amount of Rs.3,290.9 Million through a bank guarantee in favour of the Registrar General of the Court (“Registrar”) and to
deposit the balance amount of Rs.2,500.0 Million with the Registrar. The Company has complied with these requirements as at March
31, 2018.
The parties to the aforementioned litigation concurrently initiated arbitration proceedings before a three member arbitral tribunal (the
“Tribunal”), and the Tribunal pronounced its final award on July 20, 2018 (the “Award”). In terms of the Award, the Company is
required to (a) refund an amount of approximately Rs.3,082.2 million to the counterparty, (b) explore the possibility of allotting
preference shares in respect of approximately Rs.2,708.7 million, failing which, refund such amount to the counterparty, and (c) pay
interest calculated to be Rs.924.7 million (being interest on the amount stated under (a) above, in terms of the Award). The amounts
referred to under (a) and (b) above, aggregating Rs.5,790.9 million, continue to be carried as current liabilities without prejudice to the
rights of the Company under law. Further, the Company is entitled to receive from the counterparty, under the said Award, an amount
of Rs.290.0 million of past interest/servicing charges.
The Company, its present promoter and the counterparty have challenged various aspects of the Award, including the aforementioned
interest obligations and rights, petitions for which have been admitted by the Court and notices issued, as a result of which the matter
is currently sub-judice. In view of the foregoing, and pending outcome of the aforesaid challenges at the Court, management is of the
view that it is not possible to determine the effect of any such obligations and rights (including any additional/consequential
obligations and rights). Accordingly, no adjustments have been made in this regard, to these results. Also refer Note 5 below.

11
Results, contd..In view of the uncertainties prevailing at the relevant time, with regard to the proposed allotment of certain securities in the previous periods,
it was not possible to determine the effect thereof, if any, on Diluted Earnings per share calculation for such periods. Considering the matters
arising out of the arbitral award, and the challenge by the counterparty, no further effect on this matter to the dilutive earnings per share
calculations has been considered.
4. The effects of the matter stated in Note 3 above may attract the consequent provisions (including penal provisions) of applicable provisions
of law, including deeming provisions, relating to acceptance of deposits. Based on their assessment and legal advice obtained, management is
of the view that any possible consequential effects (including penal consequences and any compounding thereof), of past events and actions in
relation to the foregoing, will not have a material impact on the financial results of the Company. Accordingly, no adjustments have been made
for any such consequential penal effects in this regard.
5. Exceptional items (Net) in respect of the nine-month period ended December 31, 2018, of Rs.634.7 million in the statement of unaudited
financial results represent the net effect of (a) the interest payable of Rs.924.7 million and (b) interest/servicing charges receivable, of Rs.290.0
million, mentioned in Note 3 above, arising from the Award discussed therein. The Company’s accounting for the above mentioned amount of
Rs.634.7 million, net, is without prejudice to the rights and remedies the Company may have in the matter discussed in Note 3 above.
6. The Company has been consistently profitable for the last three financial years, as a result of which the negative net worth of Rs 14,852
million as at March 31, 2015 has reduced to Rs 4,075.6 million as at December 31, 2018 (after considering the year to date loss of Rs.3,893.7
million). The Company’s net current liabilities have also reduced by similar amounts. The earlier position of negative net worth and net current
liabilities was the result of historical market factors. As a result of various operational, commercial and financial measures implemented over
the last three years, the Company has significantly improved its liquidity position, and generated operating cash flows during that period. In
view of the foregoing, and having regard to industry outlook in the markets in which the Company operates, management is of the view that
the Company will be able to maintain profitable operations and raise funds as necessary, in order to meet its liabilities as they fall due.
Accordingly, these financial results have been prepared on the basis that the Company will continue as a going concern for the foreseeable
future.
7. Non-current assets include, Rs. 1,045.6 million paid under protest (including Rs. 169.1 million paid during the current quarter) representing
Integrated Goods and Services Tax and Basic Customs duty, on re-import of various aircraft equipment repaired abroad, which in the opinion of
management and based on expert advise obtained, is not subject to such levy. Accordingly, these amounts have been considered as recoverable
and no further adjustments have been made in this regard as at December 31, 2018.

12
Results, contd..8. Effective April 1, 2018, the Company has adopted Ind AS 115 Revenue from Contracts with customers under the modified
retrospective approach without adjustment of comparatives. The Standard is applied to contracts that remain in force as at April 1,
2018. The application of the standard did not have any significant impact on the retained earnings as at April 1, 2018 and financial
results for the current period.
9. Previous periods' / year's figures have been regrouped / reclassified wherever considered necessary to conform to current periods'
presentation.
For SpiceJet Limited
Place: Gurugram, Haryana Ajay SinghDate: February 11, 2019 Chairman and Managing Director

13
Executive Summary
CY: Current year ; LY: Last year ; ASKM: Available seat kilometers ; RPKM: Revenue passenger kilometers ;
RASK: Revenue per ASKM ; CASK: Cost per ASKM
CY LY FAV/-ADV
Capacity(ASKM) 5,762 4,948 16%
Profit & Loss summary
Total Income from operations 24,868 20,688 20%
Other Income 440 273 61%
Expenses 24,758 18,561 -33%
EBITDAR 4,786 5,806 -18%
EBITDA 1,355 3,155 -57%
EAT (without exceptional items) 551 2,400 -77%
Exceptional items - - -
EAT (with exceptional items) 551 2,400 -77%
Key Performance Indices *
Revenue / ASKM 4.39 4.24 4%
Expenses / ASKM 4.30 3.75 -15%
EBITDAR margin 19% 28% -8.8 pps
EBITDA margin 5% 15% -9.7 pps
EAT margin (without exceptional items) 2% 11% -9.3 pps
* Excludes exceptional items
Amt in INR million (Qtrly)
14
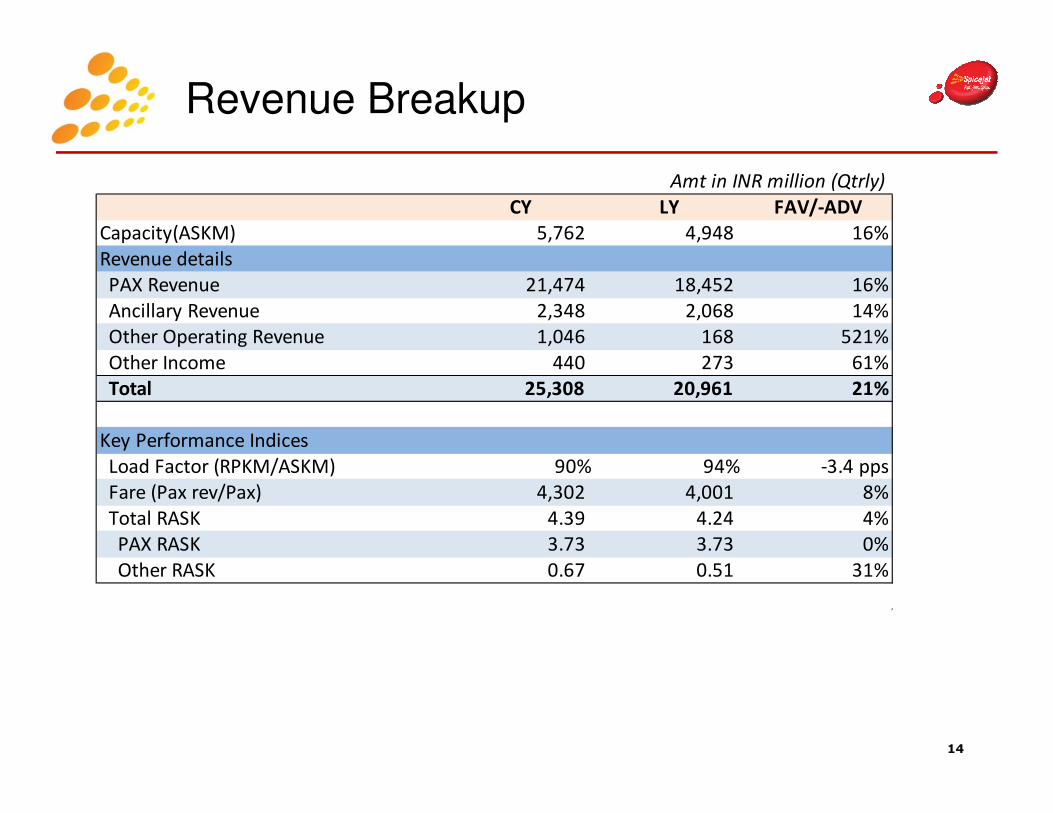
Revenue Breakup
CY LY FAV/-ADV
Capacity(ASKM) 5,762 4,948 16%
Revenue details
PAX Revenue 21,474 18,452 16%
Ancillary Revenue 2,348 2,068 14%
Other Operating Revenue 1,046 168 521%
Other Income 440 273 61%
Total 25,308 20,961 21%
Key Performance Indices
Load Factor (RPKM/ASKM) 90% 94% -3.4 pps
Fare (Pax rev/Pax) 4,302 4,001 8%
Total RASK 4.39 4.24 4%
PAX RASK 3.73 3.73 0%
Other RASK 0.67 0.51 31%
Amt in INR million (Qtrly)

15
Expense Breakup
CY LY FAV/-ADV
Capacity(ASKM) 5,762 4,948 16%
Expense details
Aircraft Fuel 9,683 6,310 -53%
Aircraft Lease Rentals 3,432 2,651 -29%
Airport Charges 1,898 1,664 -14%
Aircraft Maintenance 3,850 2,951 -30%
Other Operating Costs 786 578 -36%
Employee Benefits Expense 2,706 2,264 -20%
Depreciation and Amortisation Expense 614 586 -5%
Other Expenses 1,382 1,237 -12%
Finance Costs 407 322 -27%
Total Expenses 24,758 18,561 -33%
Key Performance Indices
Total CASK 4.30 3.75 -15%
Fuel CASK 1.68 1.28 -32%
Other CASK 2.62 2.48 -6%
Amt in INR million (Qtrly)

16
21%
23%
18%
12%11%
22%
18%
7%
FY16Q3 FY17Q3 FY18Q3 FY19Q3
% Passenger growth (YoY)
Industry pax SpiceJet pax
21,973
27,098
32,078
36,062
2,853 3,477 4,112 4,401
FY16Q3 FY17Q3 FY18Q3 FY19Q3
Passenger in thousands
Industry pax SpiceJet pax
Air India
12.1%
Jet
12.2%JetLite
1.7%
Spicejet
12.4%
Go Air
8.8%
Indigo
43.3%
Others
9.6%
As on Dec’18
12.7% 12.7%12.8%
12.4%
FY16Q3 FY17Q3 FY18Q3 FY19Q3
% Domestic market – quarter ending
SpiceJet Market Share
Source: DGCA Statistics
Aviation Market (Domestic)

17
Aviation Market (International)
7%
14% 15%
10%11%
37%
18% 18%
FY16Q3 FY17Q3 FY18Q3 FY19Q3
% Passenger growth (YoY)
Industry pax SpiceJet pax
4,627 5,273
6,072 6,685
311 425 500 592
FY16Q3 FY17Q3 FY18Q3 FY19Q3
Passenger in thousands
Industry pax SpiceJet pax
7.2%7.8% 8.1%
8.9%
FY16Q3 FY17Q3 FY18Q3 FY19Q3
% Domestic market – quarter ending
SpiceJet Market Share
Source: DGCA Statistics
Air India
41.0%
Jet
29.2%Spicejet
8.9%
Go Air
0.9%
Indigo
20.0%
As on Dec’18

18
14,742 16,704 20,961 25,308
FY16Q3 FY17Q3 FY18Q3 FY19Q3
Total Revenue
INR million
12,342 15,278 18,561 24,758
FY16Q3 FY17Q3 FY18Q3 FY19Q3
Total Expenses
INR million
5,373 4,375 5,806 4,786
FY16Q3 FY17Q3 FY18Q3 FY19Q3
EBITDAR
INR million
2,399 1,426 2,400 551
FY16Q3 FY17Q3 FY18Q3 FY19Q3
EAT
INR million
Financial Highlights

19
Key Indicators
-3%
26%
14%16%
11%16%
23% 21%23%
-24% -21%
-33%
FY16Q3 FY17Q3 FY18Q3 FY19Q3
% Growth (YoY) (Fav/-Adv)
Capacity Revenue Expenses
4.29 3.84 4.24 4.39
91%91%
94%
90%
FY16Q3 FY17Q3 FY18Q3 FY19Q3
Total RASK Passenger load factor
36%
26%28%
19%16%
9%11%
2%
FY16Q3 FY17Q3 FY18Q3 FY19Q3
% total revenue
EBITDAR margin EAT margin
1.07 1.09 1.28 1.68
2.52 2.42 2.48
2.62
FY16Q3 FY17Q3 FY18Q3 FY19Q3
INR
CASK (Fuel) CASK (Others)

20
YEAR TO DATE
HIGHLIGHTS
YTD FY19

21
Executive Summary
CY: Current year ; LY: Last year ; ASKM: Available seat kilometers ; RPKM: Revenue passenger kilometers ;
RASK: Revenue per ASKM ; CASK: Cost per ASKM
CY LY FAV/-ADV
Capacity(ASKM) 16,091 14,335 12%
Profit & Loss summary
Total Income from operations 65,820 57,361 15%
Other Income 1,042 727 43%
Expenses 69,951 52,882 32%
EBITDAR 8,218 14,582 -44%
EBITDA (744) 7,225 -110%
EAT (without exceptional items) (3,089) 5,205 -159%
Exceptional items (635)
EAT (with exceptional items) (3,724) 5,205 -172%
Key Performance Indices *
Revenue / ASKM 4.16 4.05 3%
Expenses / ASKM 4.35 3.69 -18%
EBITDAR margin 12% 25% -12.8 pps
EBITDA margin -1% 12% -13.6 pps
EAT margin (without exceptional items) -5% 9% -13.6 pps
* Excludes exceptional items
Amt in INR million (YTD)

22
Revenue Breakup
CY LY FAV/-ADV
Capacity(ASKM) 16,091 14,335 12%
Revenue details
PAX Revenue 57,809 51,311 13%
Ancillary Revenue 6,278 5,579 13%
Other Operating Revenue 1,733 471 268%
Other Income 1,042 727 43%
Total 66,862 58,087 15%
Key Performance Indices
Load Factor (RPKM/ASKM) 92% 93% -1.20 pps
Fare (Pax rev/Pax) 3,983 3,854 3%
Total RASK 4.16 4.05 3%
PAX RASK 3.59 3.58 0%
Other RASK 0.56 0.47 19%
Amt in INR million (YTD)

23
Expense Breakup
* Excludes exceptional items
CY LY FAV/-ADV
Capacity(ASKM) 16,091 14,335 12%
Expense details
Aircraft Fuel 26,259 17,077 -54%
Aircraft Lease Rentals 8,962 7,357 -22%
Airport Charges 5,458 4,818 -13%
Aircraft Maintenance 10,861 9,009 -21%
Other Operating Costs 2,116 1,752 -21%
Employee Benefits Expense 7,710 6,365 -21%
Depreciation and Amortisation Expense 1,893 1,721 -10%
Other Expenses 5,658 4,118 -37%
Finance Costs 1,034 665 -56%
Total Expenses 69,951 52,882 -32%
Key Performance Indices *
Total CASK 4.35 3.69 -18%
Fuel CASK 1.63 1.19 -37%
Other CASK 2.72 2.50 -9%
Amt in INR million (YTD)

24
Aviation Market (Domestic)
21%23%
17% 17%
-14%
26%23%
8%
YTD16 YTD17 YTD18 YTD19
% Passenger growth (YoY)
Industry pax SpiceJet pax
62.3
76.6
89.6
104.8
7.7 9.7 11.9 12.9
YTD16 YTD17 YTD18 YTD19
Passenger in millions
Industry pax SpiceJet pax
Air India
11.7%
Jet
14.2% JetLite
1.6%
Spicejet
12.0%
Go Air
8.7%
Indigo
43.5%
Others
8.3%
As on Dec’18
12.7% 12.7%12.8%
12.4%
YTD16 YTD17 YTD18 YTD19
% Domestic market – year ending
SpiceJet Market Share
Source: DGCA Statistics

25
Aviation Market (International)
8%11%
14%
10%12%
46%
16% 16%
YTD16 YTD17 YTD18 YTD19
% Passenger growth (YoY)
Industry pax SpiceJet pax
13.8 15.3
17.5 19.2
0.8 1.2 1.4 1.7
YTD16 YTD17 YTD18 YTD19
Passenger in millions
Industry pax SpiceJet pax
7.2%7.8% 8.1%
8.9%
YTD16 YTD17 YTD18 YTD19
% Domestic market – year ending
SpiceJet Market Share
Air India
41.0%
Jet
29.2%Spicejet
8.9%
Go Air
0.9%
Indigo
20.0%
As on Dec’18
Source: DGCA Statistics

26
Financial Highlights(Excludes exceptional items)
37,287 46,302 58,087 66,862
YTD16 YTD17 YTD18 YTD19
Total Revenue
INR million
33,867 42,797 52,882 69,951
YTD16 YTD17 YTD18 YTD19
Total Expenses
INR million
11,089 12,287 14,582 8,218
YTD16 YTD17 YTD18 YTD19
EBITDAR
INR million
3,419
3,505
5,205
(3,089)
YTD16 YTD17 YTD18 YTD19
EAT
INR million

27
Key Indicators(Excludes exceptional items)
-25%
33%
18%12%
-17%
24% 25%
15%
35%
-26%-24%
-32%
YTD16 YTD17 YTD18 YTD19
% Growth (YoY)
Capacity Revenue Expenses
4.08 3.80 4.05 4.16
90%91%
93%
92%
YTD16 YTD17 YTD18 YTD19
Total RASK Passenger load factor
30%27% 25%
12%
9% 8% 9%
-5%
YTD16 YTD17 YTD18 YTD19
% total revenue
EBITDAR margin EAT margin
1.16 1.07 1.19 1.63
2.54 2.44 2.50
2.72
YTD16 YTD17 YTD18 YTD19
INR
CASK (Fuel) CASK (Others)