investor presentation q3fy16 - fortis...
TRANSCRIPT
Fortis Healthcare LimitedInvestor Presentation – Q3FY16
“ Saving and Enriching Lives”
February 4, 2016
This presentation may not be copied, published, distributed or transmitted. The presentation has been prepared solely by the company.
Any reference in this presentation to “Fortis Healthcare Limited” shall mean, collectively, the Company and its subsidiaries. This presentation has
been prepared for informational purposes only. This presentation does not constitute a prospectus, offering circular or offering memorandum and isnot an offer or invitation to buy or sell any securities, nor shall part, or all, of this presentation form the basis of, or be relied on in connection with,
any contract or investment decision in relation to any securities. Furthermore, this presentation is not and should not be construed as an offer or a
solicitation of an offer to buy securities of the company for sale in the United States, India or any other jurisdiction.
Securities may not be offered or sold in the United States absent registration or an exemption from registration. Any public offering in the United
States may be made only by means of an offering document that may be obtained from the Company and that will contain detailed information
about the Company and its management, as well as financial statements. Any offer or sale of securities in a given jurisdiction is subject to the
applicable laws of that jurisdiction.
This presentation contains forward-looking statements based on the currently held beliefs and assumptions of the management of the Company,
which are expressed in good faith and, in their opinion, reasonable. Forward-looking statements involve known and unknown risks, uncertainties
and other factors, which may cause the actual results, financial condition, performance, or achievements of the Company or industry results, to
differ materially from the results, financial condition, performance or achievements expressed or implied by such forward-looking statements. Given
these risks, uncertainties and other factors, recipients of this presentation are cautioned not to place undue reliance on these forward-looking
statements.
The Company assumes no responsibility to publicly amend, modify or revise any forward-looking statements, on the basis of any subsequent
development, information or events, or otherwise. Unless otherwise stated in this presentation, the information contained herein is based on
management information and estimates. The information contained herein is subject to change without notice and past performance is not
indicative of future results. The Company may alter, modify or otherwise change in any manner the content of this presentation, without obligation
to notify any person of such revision or changes.
By attending this presentation you acknowledge that you will be solely responsible for your own assessment of the market and the market position
of the Company and that you will conduct your own analysis and be solely responsible for forming your own view of the potential future
performance of the business of the Company.
Neither the delivery of this presentation nor any further discussions of the Company with any of the recipients shall, under any circumstances,
create any implication that there has been no change in the affairs of the Company since that date.
Disclaimer
2
Discussion Points
3
Business Performance – Hospitals & Diagnostics
Highlights for the Quarter
Financial Highlights
Awards & Recognitions
Successes in Clinical Excellence

Highlights for the quarter
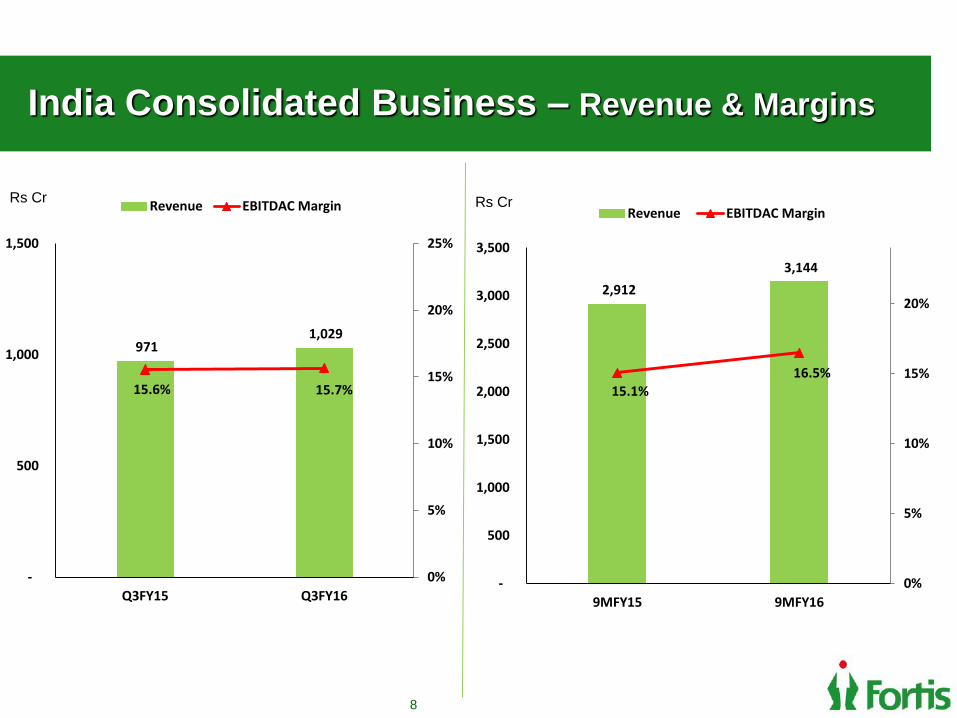
India consolidated business witnesses operating EBITDAC* Margins of 15.7% vs 15.6% in Q3FY15
Revenues at Rs 1,029 Cr vs Rs 971 Cr in corr Q.
Hospital business :
Revenue at Rs 850 Cr vs Rs 792 Cr in corr. Q
Operating EBITDAC* at Rs 122 Cr compared to Rs 119 Cr in Q3FY15.
FMRI becomes the highest ARPOB generating hospital in the network with an ARPOB of Rs 2.51 Cr
All key operating metrics ( ARPOB, ALOS and Occupancy) better than corr. Q
Diagnostic business :
Net revenue at Rs 180 Cr , similar to corr Q
Operating EBITDA growth of 21% to Rs 39 Cr vs Rs 33 Cr in Q3FY15
Operating EBITDA margin expands 370 bps to 21.9% vs 18.2% in corr. Q
4 *Refers to EBITDA before net business trust costs

Highlights for the quarter ( cont..)
5
The Company’s Board of Directors approve the acquisition of 51% economic interest in Fortis Hospotel
Limited ( FHTL) , an RHT subsidiary comprising the Fortis Hospital Shalimar Bagh, New Delhi and the
FMRI, Gurgaon Clinical Establishments
The company completes its acquisition of the Religare Health Trust Trustee Manager Pte Ltd (RHTTM),
the Trustee Manager to Religare Health Trust (RHT), of which the Company is the Sponsor.

Highlights for YTD Dec 2015
India consolidated business witnesses operating EBITDAC* Margins of 16.5% vs 15.1% reported in corr.
previous period. Revenues at Rs 3,144 Cr vs Rs 2,912 Cr in corr previous period.
India consolidated operating EBITDA grows 63% to Rs 174 Crs
Hospital business :
Revenue at Rs 2,571 Cr vs Rs 2,375 Cr, +8.3%
Operating EBITDAC* at Rs 377 Cr compared to Rs 332 Cr in corr. previous period.
Operating EBITDA margins expand to 14.7% from 14% in corr previous period.
Diagnostic business :
Net revenue at Rs 572 Cr vs Rs 537 Cr in corr Q
Operating EBITDA growth of 31% to Rs 141 Cr vs Rs 107 Cr in the corr previous period
Operating EBITDA margin expands to 24.6% vs 19.9% in corr previous period
6 *Refers to EBITDA before net business trust costs
Acquisition of 51% Economic Interest in FHTL
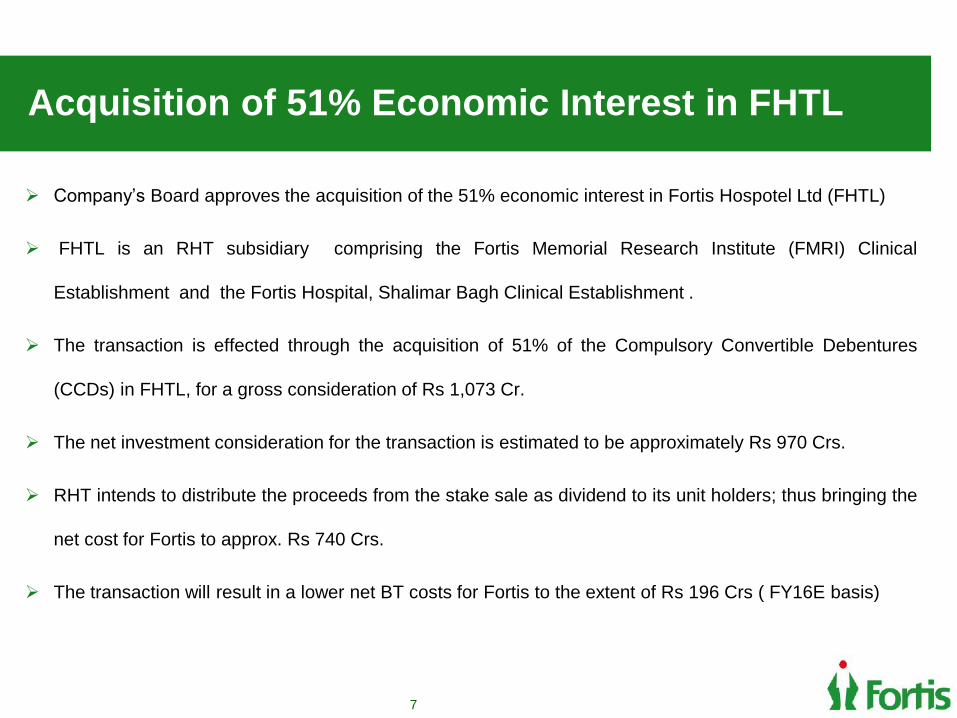
Company’s Board approves the acquisition of the 51% economic interest in Fortis Hospotel Ltd (FHTL)
FHTL is an RHT subsidiary comprising the Fortis Memorial Research Institute (FMRI) Clinical
Establishment and the Fortis Hospital, Shalimar Bagh Clinical Establishment .
The transaction is effected through the acquisition of 51% of the Compulsory Convertible Debentures
(CCDs) in FHTL, for a gross consideration of Rs 1,073 Cr.
The net investment consideration for the transaction is estimated to be approximately Rs 970 Crs.
RHT intends to distribute the proceeds from the stake sale as dividend to its unit holders; thus bringing the
net cost for Fortis to approx. Rs 740 Crs.
The transaction will result in a lower net BT costs for Fortis to the extent of Rs 196 Crs ( FY16E basis)
7
India Consolidated Business – Revenue & Margins
8
2,912
3,144
15.1%16.5%
0%
5%
10%
15%
20%
-
500
1,000
1,500
2,000
2,500
3,000
3,500
9MFY15 9MFY16
Revenue EBITDAC Margin
971 1,029
15.6% 15.7%
0%
5%
10%
15%
20%
25%
-
500
1,000
1,500
Q3FY15 Q3FY16
Revenue EBITDAC MarginRs Cr Rs Cr

Key Awards and Recognitions
9
FMRI Gurgaon, won two awards under the “Process Innovation” and “Safety” categories of Frost &
Sullivan’s Project Evaluation & Recognition Program 2015
Fortis Hospital, Noida, won the Comprehensive Neurosciences Service Provider of the Year award
at the Frost & Sullivan 7th Annual India Healthcare Excellence Awards 2015
Fortis Escorts Hospital, Jaipur, has won the Rajasthan State Productivity Council’s Productivity
Excellence Award for reducing Hospital Acquired Pressure Ulcers (bed sores) to Zero
Fortis Vashi won the “Best Green Project in HealthCare” in the Healthcare Leadership award
presented by ABP news associated with CMO Asia in November 2015
Fortis Escorts Heart Institute ranked as the best private cardiac care hospital by the WEEK-NIELSEN
survey. In overall rankings, it was ranked No.2 after AIIMS.
Successes in Clinical Excellence
10
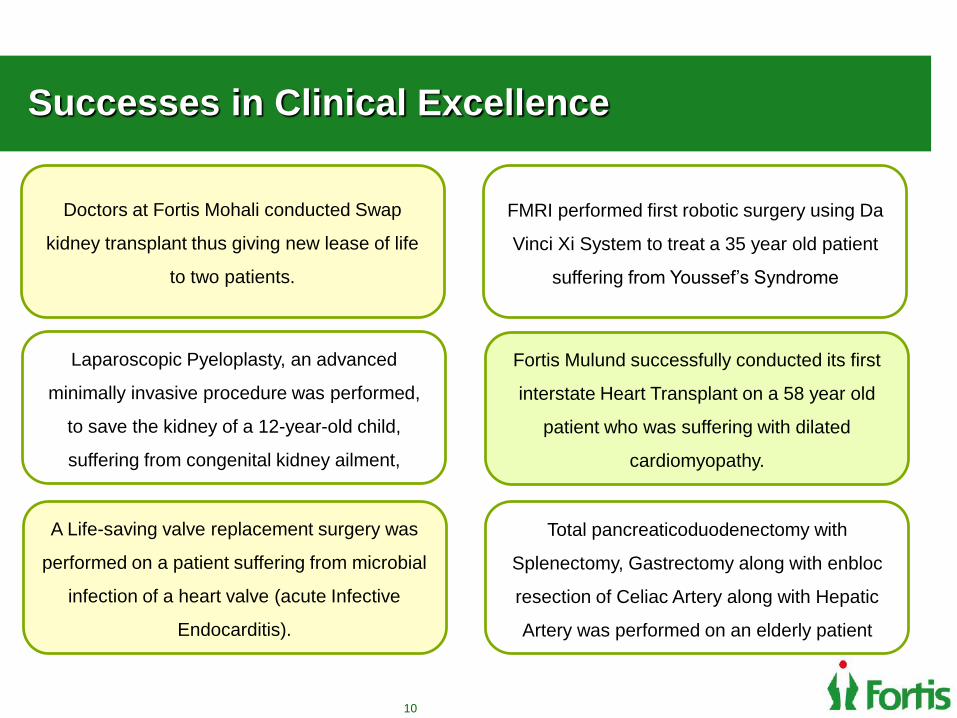
Doctors at Fortis Mohali conducted Swap
kidney transplant thus giving new lease of life
to two patients.
FMRI performed first robotic surgery using Da
Vinci Xi System to treat a 35 year old patient
suffering from Youssef’s Syndrome
Laparoscopic Pyeloplasty, an advanced
minimally invasive procedure was performed,
to save the kidney of a 12-year-old child,
suffering from congenital kidney ailment,
Fortis Mulund successfully conducted its first
interstate Heart Transplant on a 58 year old
patient who was suffering with dilated
cardiomyopathy.
A Life-saving valve replacement surgery was
performed on a patient suffering from microbial
infection of a heart valve (acute Infective
Endocarditis).
Total pancreaticoduodenectomy with
Splenectomy, Gastrectomy along with enbloc
resection of Celiac Artery along with Hepatic
Artery was performed on an elderly patient

Financial Highlights
11
152161
0
50
100
150
200
Q3FY15 Q3FY16Consol EBITDAC
9711,029
0
400
800
1,200
Q3FY15 Q3FY16
Consol Revenue
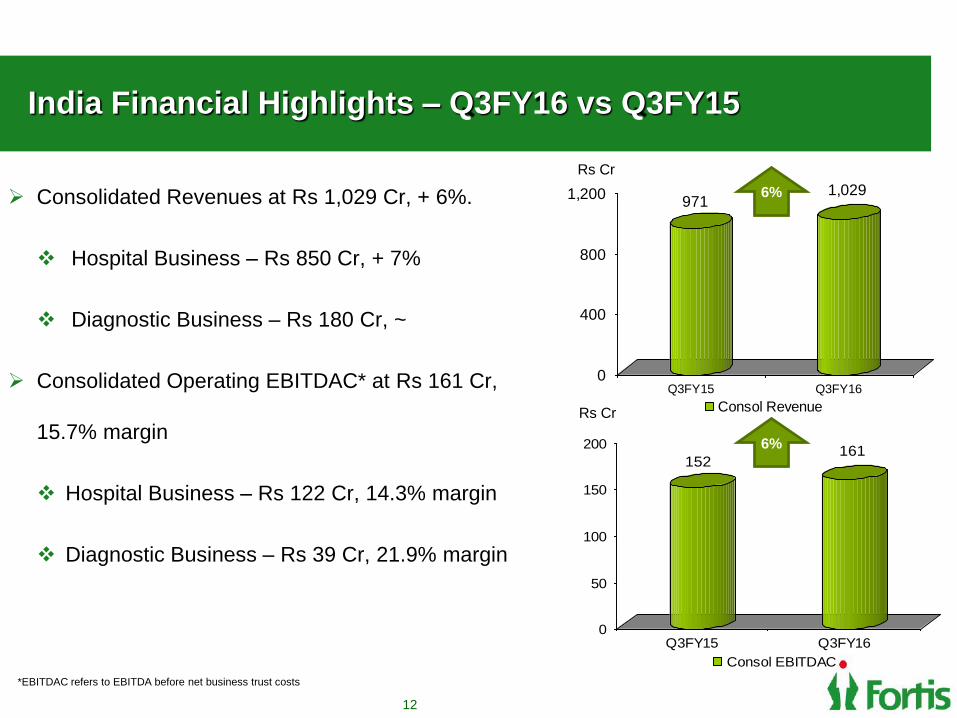
India Financial Highlights – Q3FY16 vs Q3FY15
Consolidated Revenues at Rs 1,029 Cr, + 6%.
Hospital Business – Rs 850 Cr, + 7%
Diagnostic Business – Rs 180 Cr, ~
Consolidated Operating EBITDAC* at Rs 161 Cr,
15.7% margin
Hospital Business – Rs 122 Cr, 14.3% margin
Diagnostic Business – Rs 39 Cr, 21.9% margin
12
Rs Cr
Rs Cr
*EBITDAC refers to EBITDA before net business trust costs
6%
6%
439
518
0
100
200
300
400
500
9MFY15 9MFY16Consol EBITDAC
2,9123,144
0
1,000
2,000
3,000
9MFY15 9MFY16
Consol Revenue
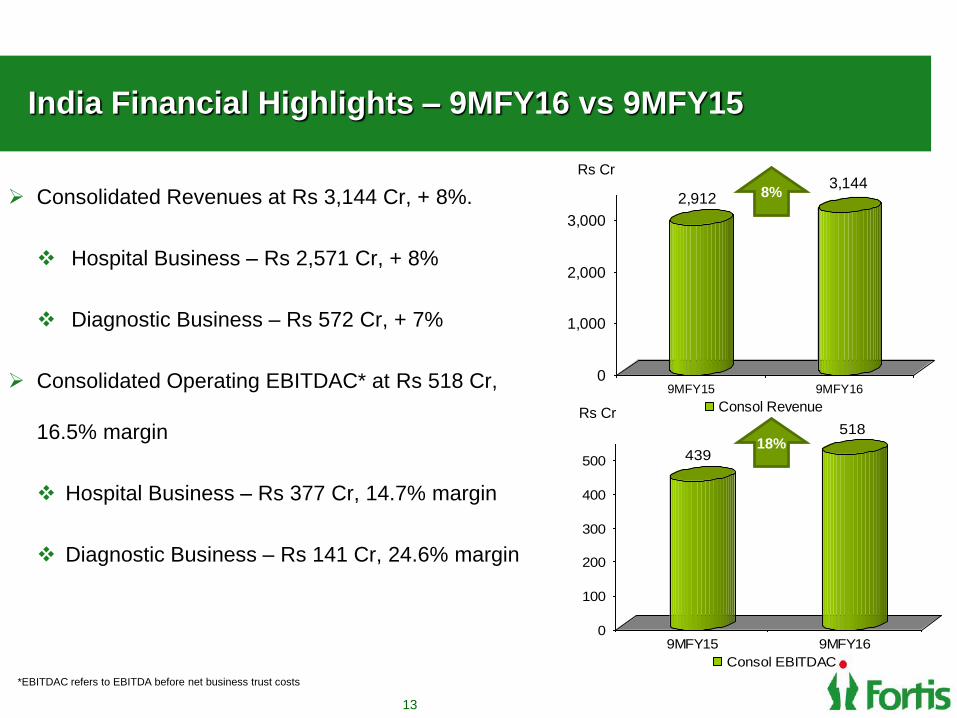
India Financial Highlights – 9MFY16 vs 9MFY15
Consolidated Revenues at Rs 3,144 Cr, + 8%.
Hospital Business – Rs 2,571 Cr, + 8%
Diagnostic Business – Rs 572 Cr, + 7%
Consolidated Operating EBITDAC* at Rs 518 Cr,
16.5% margin
Hospital Business – Rs 377 Cr, 14.7% margin
Diagnostic Business – Rs 141 Cr, 24.6% margin
13
Rs Cr
Rs Cr
*EBITDAC refers to EBITDA before net business trust costs
8%
18%

India Consolidated P&L – Q3FY16
*EBITDAC refers to EBITDA before net business trust (BT) costs
**Exceptional item in Q2FY16 is wrt the exit of company’s Kangra operations (Rs 12.6 Cr) and SRL’s exit from select laboratories (Rs 7.6 Cr)
**Exceptional item in Q3FY16 is due to the amendment with retrospective effect in Payment of Bonus Act. (Rs 16.4 Cr) and exit from select labs (Rs 15.7 Cr)
Particulars ( Rs Crs) Q3FY15 Q2FY16 Q3FY16
Operating Revenue 970.6 1,086.6 1,029.4
Operating EBITDAC* 151.5 190.2 161.2
Operating EBITDAC margin 15.6% 17.5% 15.7%
Net BT Costs 113.0 116.2 113.0
Other Income 14.6 20.5 12.1
EBITDA 53.1 94.5 60.3
Finance Costs 35.3 27.5 28.9
Depreciation & Amortization 64.5 51.4 53.2
PBT before Foreign Exchange (Loss) / Gain (46.7) 15.7 (21.8)
Foreign Exchange (Loss)/ Gain 4.5 5.4 3.8
PBT before Exceptional Item (42.2) 21.1 (18.0)
Exceptional (Loss)/ Gain** (0.0) (20.2) (32.1)
Tax Expense (1.9) 16.2 10.0
PAT before minority interest and share in associates (40.3) (15.3) (60.1)
Share in Associates 13.5 12.3 12.3
PAT after minority interest and share in associates (26.2) (10.7) (50.3)
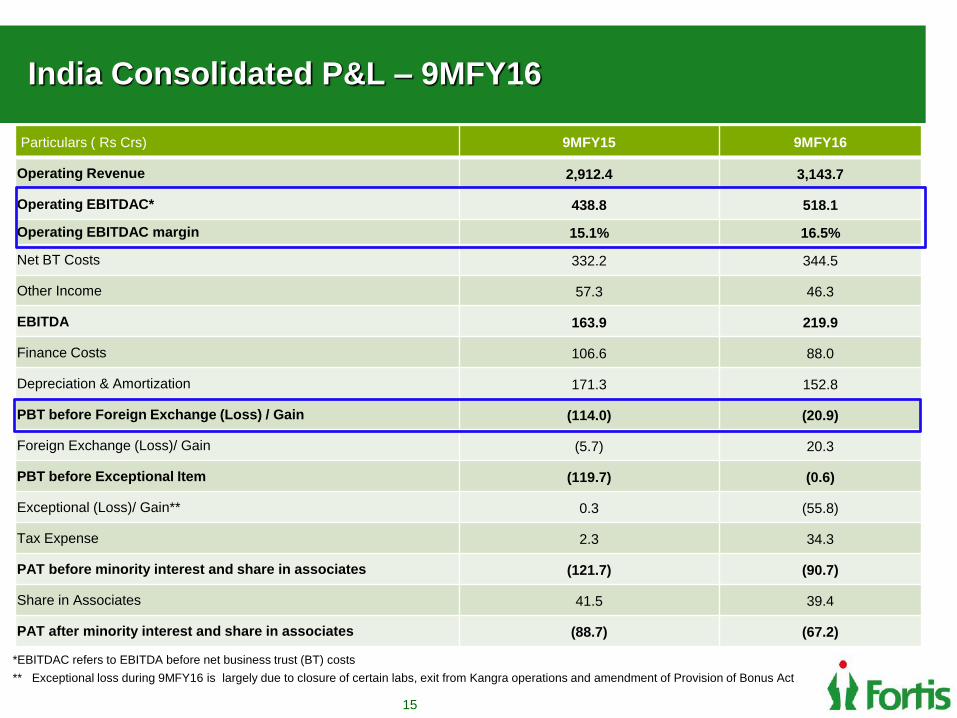
India Consolidated P&L – 9MFY16
15
*EBITDAC refers to EBITDA before net business trust (BT) costs
** Exceptional loss during 9MFY16 is largely due to closure of certain labs, exit from Kangra operations and amendment of Provision of Bonus Act
Particulars ( Rs Crs) 9MFY15 9MFY16
Operating Revenue 2,912.4 3,143.7
Operating EBITDAC* 438.8 518.1
Operating EBITDAC margin 15.1% 16.5%
Net BT Costs 332.2 344.5
Other Income 57.3 46.3
EBITDA 163.9 219.9
Finance Costs 106.6 88.0
Depreciation & Amortization 171.3 152.8
PBT before Foreign Exchange (Loss) / Gain (114.0) (20.9)
Foreign Exchange (Loss)/ Gain (5.7) 20.3
PBT before Exceptional Item (119.7) (0.6)
Exceptional (Loss)/ Gain** 0.3 (55.8)
Tax Expense 2.3 34.3
PAT before minority interest and share in associates (121.7) (90.7)
Share in Associates 41.5 39.4
PAT after minority interest and share in associates (88.7) (67.2)

Group Consolidated P&L – Q3FY16
* EBITDAC refers to EBITDA before net business trust (BT) costs
**Exceptional item in Q2FY16 is wrt the exit of company’s Kangra operations (Rs 12.6 Cr) and SRL’s exit from select laboratories (Rs 7.6 Cr)
**Exceptional item in Q3FY16 is due to the amendment with retrospective effect in Payment of Bonus Act. (Rs 16.4 Cr) and exit from select labs (Rs 15.7 Cr)
Particulars ( Rs Crs) Q3FY15 Q2FY16 Q3FY16
Operating Revenue 1,024.5 1,097.0 1,041.1
Operating EBITDAC* 146.8 187.1 159.0
Operating EBITDAC margin 14.3% 17.1% 15.3%
Net BT Costs 113.0 116.2 113.0
Other Income 15.3 21.2 12.7
EBITDA 49.1 92.2 58.7
Finance Costs 38.7 27.6 28.9
Depreciation & Amortization 74.6 53.1 54.9
PBT before Foreign Exchange (Loss) / Gain (64.2) 11.5 (25.1)
Foreign Exchange (Loss)/ Gain 23.5 51.6 (0.1)
PBT before Exceptional Item (40.7) 63.1 (25.3)
Exceptional (Loss)/ Gain** (0.0) (20.6) (32.1)
Tax Expense (1.9) 16.3 10.3
PAT before minority interest and share in associates (38.8) 26.2 (67.7)
Share in Associates 16.0 15.4 14.9
PAT after minority interest and share in associates (22.3) 34.0 (55.3)

Group Consolidated P&L – 9MFY16
* EBITDAC refers to EBITDA before net business trust (BT) costs
**Exceptional gain during 9MFY16 is the net gains arising due to divestment of RadLink and Fortis Surgical Hospital, Singapore (Rs 84 Cr) and losses
due to closure of certain labs and amendment of Provision of Bonus Act
Particulars ( Rs Crs) 9MFY15 9MFY16
Operating Revenue 3,076.4 3,187.5
Operating EBITDAC* 424.6 512.0
Operating EBITDAC margin 13.8% 16.1%
Net BT Costs 332.2 344.5
Other Income 59.3 47.6
EBITDA 151.8 215.1
Finance Costs 116.0 88.3
Depreciation & Amortization 201.8 159.1
PBT before Foreign Exchange (Loss) / Gain (166.1) (32.4)
Foreign Exchange (Loss)/ Gain 4.3 69.8
PBT before Exceptional Item (161.8) 37.5
Exceptional (Loss)/ Gain** 0.3 31.0
Tax Expense 2.3 35.0
PAT before minority interest and share in associates (163.7) 33.5
Share in Associates 45.9 48.5
PAT after minority interest and share in associates (126.2) 66.0
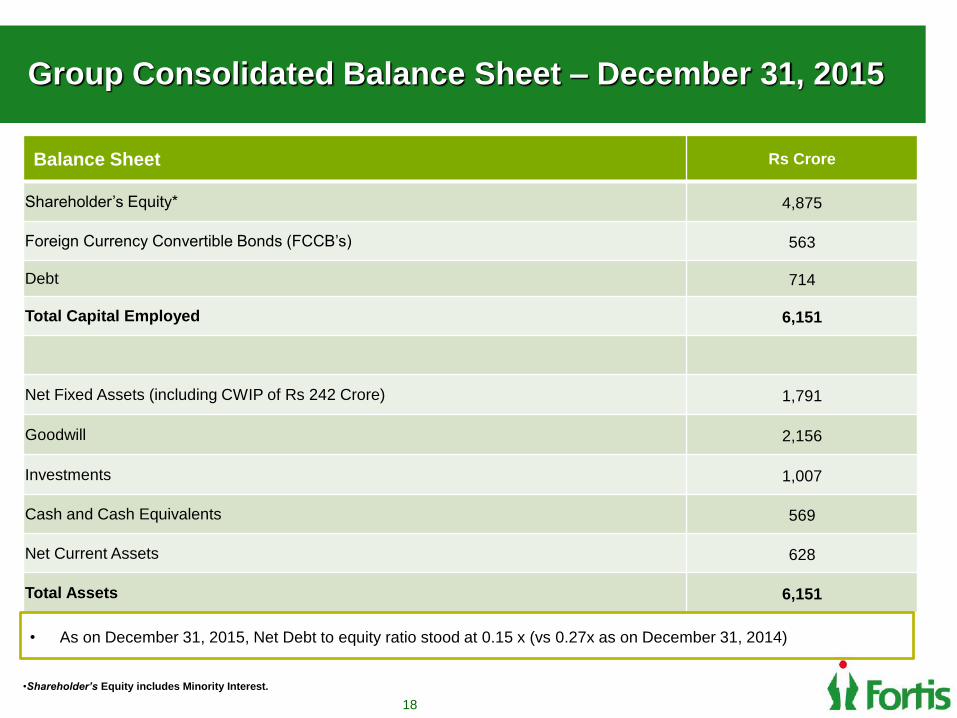
Group Consolidated Balance Sheet – December 31, 2015
18
Balance Sheet Rs Crore
Shareholder’s Equity* 4,875
Foreign Currency Convertible Bonds (FCCB’s) 563
Debt 714
Total Capital Employed 6,151
Net Fixed Assets (including CWIP of Rs 242 Crore) 1,791
Goodwill 2,156
Investments 1,007
Cash and Cash Equivalents 569
Net Current Assets 628
Total Assets 6,151
•Shareholder’s Equity includes Minority Interest.
• As on December 31, 2015, Net Debt to equity ratio stood at 0.15 x (vs 0.27x as on December 31, 2014)

Business Performance – Hospitals & Diagnostics
19

0
200
400
600
800
1000
1200
Q3FY15 Q3FY16
9711029
India Business
Revenue
20
Q3FY16 – Consolidated
Operating Revenue - Rs. 1,029 Cr 6%
Hospital business -Rs. 850 Cr 7%
Diagnostics business -Rs. 180 Cr ~
9MFY16 – Consolidated
Operating Revenue - Rs. 3,144 Cr 8%
Hospital business -Rs. 2,571 Cr 8%
Diagnostics business -Rs. 572 Cr 7%
India Business - Snapshot
Rs Cr
Key Metrics Q3FY15 Q3FY16
Occupancy 70% 72%
ARPOB (Annualized - Rs. Lacs) 132 138
ALOS (Days) 3.58 3.55
6%

India Hospital Business P&L
21
Q3FY15 Q2FY16 Q3FY16 9MFY15 9MFY16
Particulars (Rs Cr.) (Rs Cr.) (Rs Cr.) (Rs Cr.) (Rs Cr.)
Operating Revenue 791.6 883.1 849.6 2,375.2 2,571.3
Operating EBITDAC* 118.9 132.2 121.8 331.6 377.4
Operating EBITDAC margin 15.0% 15.0% 14.3% 14.0% 14.7%
Net BT Costs 113.0 116.2 113.0 332.2 344.5
Other Income 14.1 19.9 9.2 51.9 40.5
EBITDA 19.9 35.9 18.0 51.3 73.4
* EBITDAC refers to EBITDA before net business trust (BT) costs

India Hospital Business
22
Operating revenue at Rs 850 Cr, +7%
Operating EBITDAC* margins at 14.3%, vs
15.0%.
International patient revenue at Rs 80 Cr,
representing 9.4% of overall hospital business
FMRI continues to score high; reports highest
ARPOB in the Fortis network at Rs 2.51 Cr for the
quarter. Its revenue grew 14% to Rs 104 Cr.
Rs Cr
*EBITDAC refers to EBITDA before net business trust costs
792 850
-
200
400
600
800
1,000
Q3FY15 Q3FY16
Revenue
119 122
0
50
100
150
Q3FY15 Q3FY16
EBITDAC

New Initiatives
Fortis Memorial Research Institute (FMRI), Gurgaon, has acquired and launched a Da Vinci Xi System,
the most advanced robotic surgical technology, for performing minimally invasive surgery. The system
allows surgeons to operate with pinpoint accuracy, causing very little damage to surrounding tissues.
To strengthen its core value of Patient Centricity, Fortis became the first, privately held, Indian healthcare
chain to introduce monitoring of its clinical outcomes – starting with Fortis Escorts Heart Institute (FEHI),
New Delhi. This initiative reinforces organizational accountability and transparency towards both, its
patients as well as the payers.
During the quarter, Fortis Central Infection Prevention and Control Manual was released. The objectives
are a) to standardize infection prevention and control practices across Fortis hospitals, b) to standardize
infection prevention and control related forms/ formats/ documents and c) to provide a framework for
infection risk identification and mitigation.
23
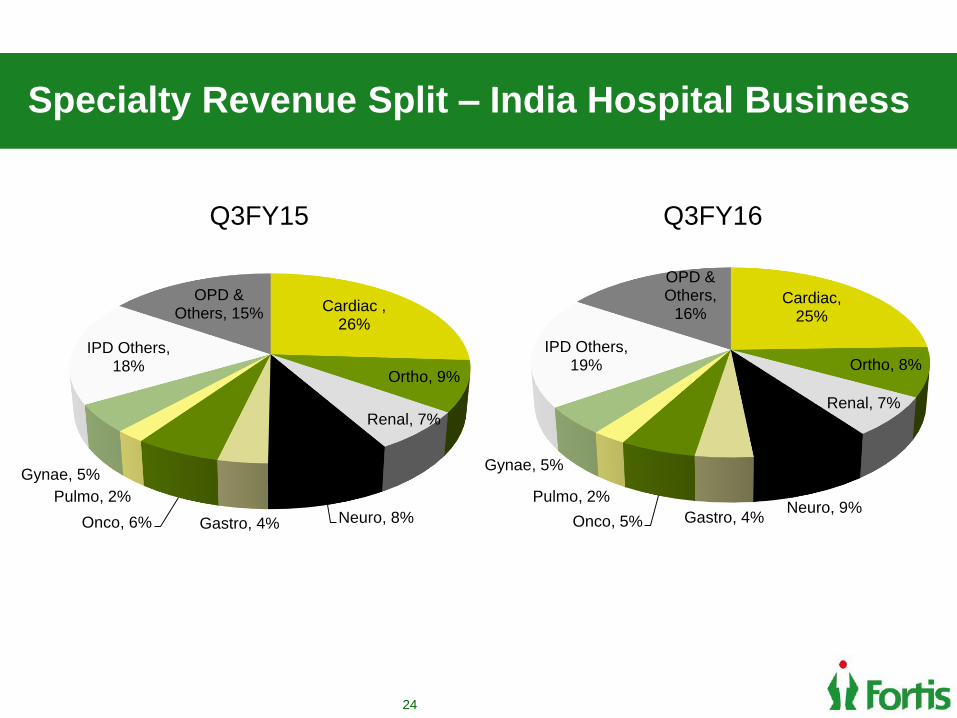
Cardiac, 25%
Ortho, 8%
Renal, 7%
Neuro, 9%Gastro, 4%Onco, 5%
Pulmo, 2%
Gynae, 5%
IPD Others, 19%
OPD & Others,
16%
24
Specialty Revenue Split – India Hospital Business
Q3FY16Q3FY15
Cardiac , 26%
Ortho, 9%
Renal, 7%
Neuro, 8%Gastro, 4%Onco, 6%
Pulmo, 2%Gynae, 5%
IPD Others, 18%
OPD & Others, 15%
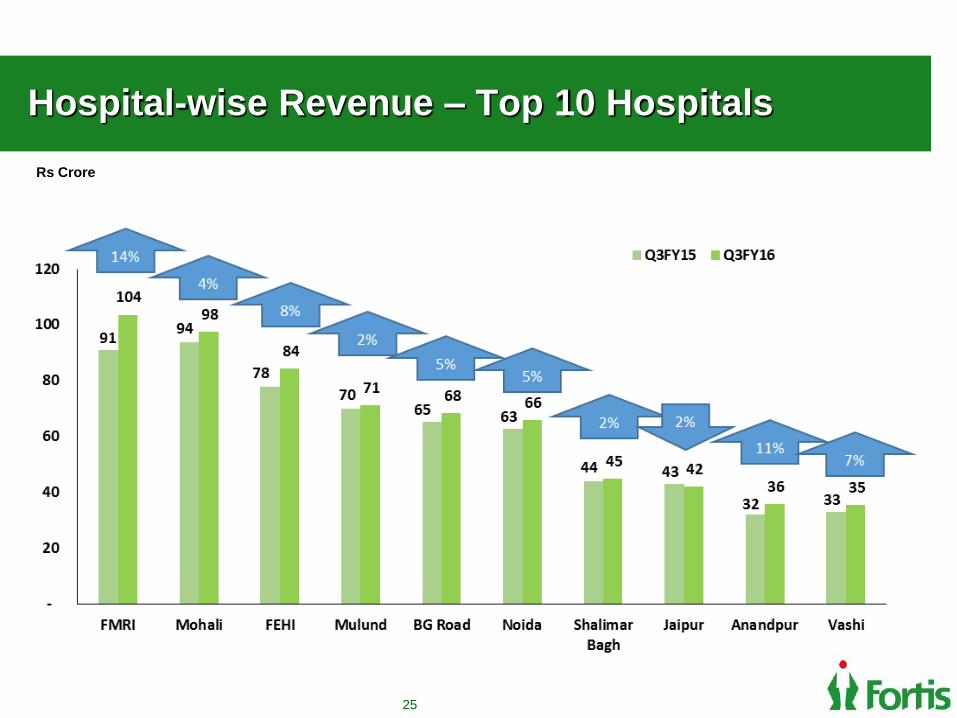
Hospital-wise Revenue – Top 10 Hospitals
25
Rs Crore

Hospital-wise Revenue – Top 10 Hospitals
26
Rs Crore
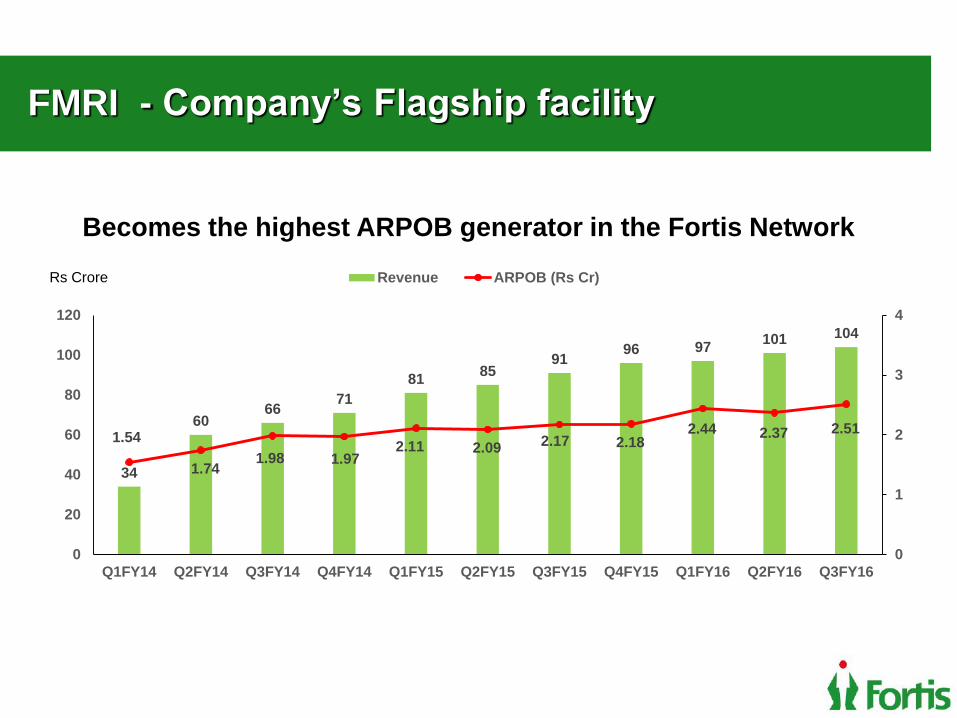
FMRI - Company’s Flagship facility
Becomes the highest ARPOB generator in the Fortis Network
34
6066
7181 85
9196 97 101 104
1.54
1.741.98 1.97
2.11 2.09 2.17 2.182.44 2.37 2.51
0
1
2
3
4
0
20
40
60
80
100
120
Q1FY14 Q2FY14 Q3FY14 Q4FY14 Q1FY15 Q2FY15 Q3FY15 Q4FY15 Q1FY16 Q2FY16 Q3FY16
Revenue ARPOB (Rs Cr)Rs Crore
179 180
18.2%
21.9%
0%
6%
12%
18%
24%
30%
-
50
100
150
200
Q3FY15 Q3FY16
Net Revenue EBITDA margin
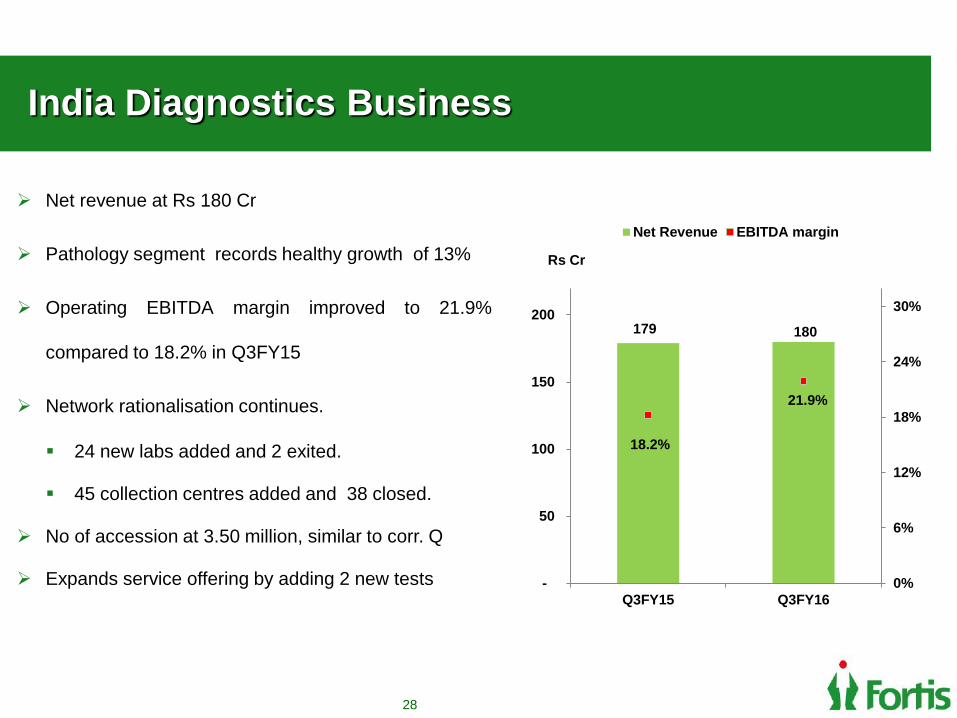
India Diagnostics Business
Net revenue at Rs 180 Cr
Pathology segment records healthy growth of 13%
Operating EBITDA margin improved to 21.9%
compared to 18.2% in Q3FY15
Network rationalisation continues.
24 new labs added and 2 exited.
45 collection centres added and 38 closed.
No of accession at 3.50 million, similar to corr. Q
Expands service offering by adding 2 new tests
28
Rs Cr

India Diagnostics Business
29
Lab medicine business also includes a small proportion ( ~ 6% ) from clinical trials, wellness and the international segment

Thank You…