investor presentation q2 2021 - ml-eu.globenewswire.com
TRANSCRIPT
Investor presentationQ2 2021
12 August 2021
DISCLAIMERThis presentation contains certain forward-looking statements, including but not limited to, the statements and expectations contained in the
“Financial Outlook” section of this presentation. Statements herein, other than statements of historical fact, regarding our future results of operations,
financial condition, cash flows, business strategy, plans and future objectives are forward-looking statements. Words such as “targets”, “believe”,
“expect”, “aim”, “intend”, “plan”, “seek”, “will”, “may”, “should”, ”anticipate”, “continue”, “predict” or variations of these words, as well as other
statements regarding matters that are not historical facts or regarding future events or prospects, constitute forward-looking statements.
Ørsted have based these forward-looking statements on its current views with respect to future events and financial performance. These views involve
a number of risks and uncertainties, which could cause actual results to differ materially from those predicted in the forward-looking statements and
from the past performance of Ørsted. Although, Ørsted believes that the estimates and projections reflected in the forward-looking statements are
reasonable, they may prove materially incorrect and actual results may materially differ due to a variety of factors, including, but not limited to
changes in temperature, wind conditions, wake and blockage effects, and precipitation levels, the development in power, coal, carbon, gas, oil,
currency and interest rate markets, changes in legislation, regulation or standards, the renegotiation of contracts, changes in the competitive
environment in our markets and reliability of supply. As a result you should not rely on these forward-looking statements. Please also refer to the
overview of risk factors in “Risk and Management” on p. 70 of the 2020 annual report, available at www.orsted.com.
Unless required by law, Ørsted is under no duty and undertakes no obligation to update or revise any forward-looking statement after the distribution
of this presentation, whether as a result of new information, future events or otherwise.
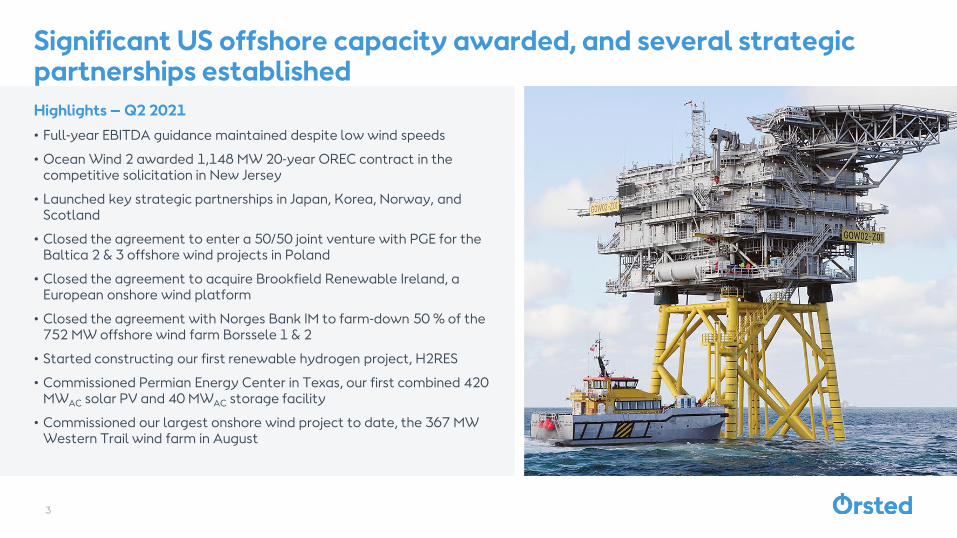
Significant US offshore capacity awarded, and several strategic partnerships established
Highlights – Q2 2021
• Full-year EBITDA guidance maintained despite low wind speeds
• Ocean Wind 2 awarded 1,148 MW 20-year OREC contract in the competitive solicitation in New Jersey
• Launched key strategic partnerships in Japan, Korea, Norway, and Scotland
• Closed the agreement to enter a 50/50 joint venture with PGE for the Baltica 2 & 3 offshore wind projects in Poland
• Closed the agreement to acquire Brookfield Renewable Ireland, a European onshore wind platform
• Closed the agreement with Norges Bank IM to farm-down 50 % of the 752 MW offshore wind farm Borssele 1 & 2
• Started constructing our first renewable hydrogen project, H2RES
• Commissioned Permian Energy Center in Texas, our first combined 420 MWAC solar PV and 40 MWAC storage facility
• Commissioned our largest onshore wind project to date, the 367 MW Western Trail wind farm in August
3
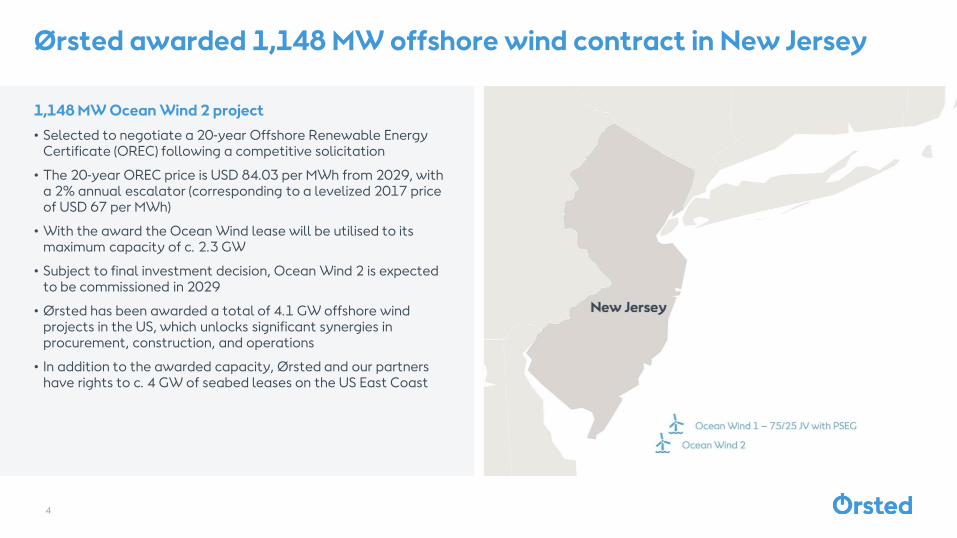
Ørsted awarded 1,148 MW offshore wind contract in New Jersey
1,148 MW Ocean Wind 2 project
• Selected to negotiate a 20-year Offshore Renewable Energy Certificate (OREC) following a competitive solicitation
• The 20-year OREC price is USD 84.03 per MWh from 2029, with a 2% annual escalator (corresponding to a levelized 2017 price of USD 67 per MWh)
• With the award the Ocean Wind lease will be utilised to its maximum capacity of c. 2.3 GW
• Subject to final investment decision, Ocean Wind 2 is expected to be commissioned in 2029
• Ørsted has been awarded a total of 4.1 GW offshore wind projects in the US, which unlocks significant synergies in procurement, construction, and operations
• In addition to the awarded capacity, Ørsted and our partners have rights to c. 4 GW of seabed leases on the US East Coast
4
7,5519,771
18,4582,455
1,320900
1,297907
4,659
1,714
2,3681,142
920
2,543
4,659
2,078
2,080
2,080
2
US Mid-Atlantic cluster2
Greater Changhua
2b & 4
German Portfolio3
Greater Changhua
1 & 2a
Baltica2 & 3
Firmcapacity
12 GW
10 GW
Substantiatedpipeline4
Installed capacityQ2 2021
Hornsea 2 Onshore wind
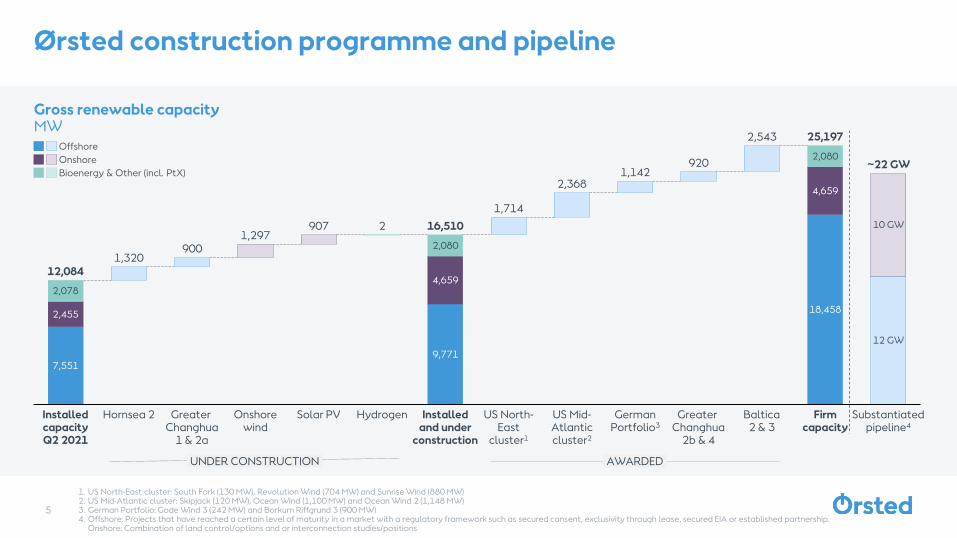
~22 GW
Installed and under
construction
Solar PV Hydrogen
25,197
US North-East
cluster1
12,084
16,510
Ørsted construction programme and pipeline
5
Gross renewable capacityMW
1. US North-East cluster: South Fork (130 MW), Revolution Wind (704 MW) and Sunrise Wind (880 MW) 2. US Mid-Atlantic cluster: Skipjack (120 MW), Ocean Wind (1,100 MW) and Ocean Wind 2 (1,148 MW)3. German Portfolio: Gode Wind 3 (242 MW) and Borkum Riffgrund 3 (900 MW)4. Offshore: Projects that have reached a certain level of maturity in a market with a regulatory framework such as secured consent, exclusivity through lease, secured EIA or established partnership.
Onshore: Combination of land control/options and or interconnection studies/positions
UNDER CONSTRUCTION AWARDED
Bioenergy & Other (incl. PtX)
Offshore
Onshore
6
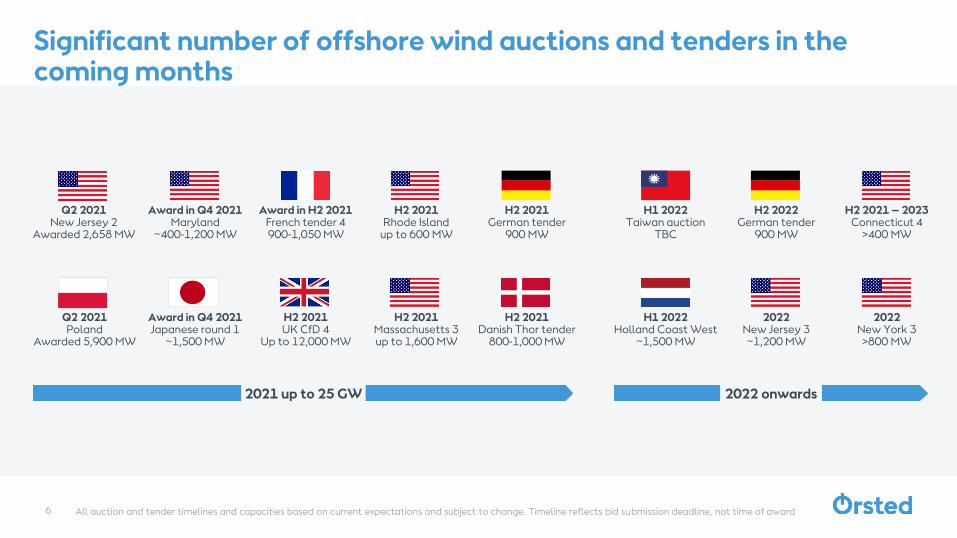
Significant number of offshore wind auctions and tenders in the coming months
H2 2021Massachusetts 3up to 1,600 MW
H2 2021German tender
900 MW
Q2 2021New Jersey 2
Awarded 2,658 MW
Award in Q4 2021Maryland
~400-1,200 MW
H2 2021Danish Thor tender
800-1,000 MW
H2 2021 – 2023Connecticut 4
>400 MW
All auction and tender timelines and capacities based on current expectations and subject to change. Timeline reflects bid submission deadline, not time of award
Award in H2 2021French tender 4 900-1,050 MW
Q2 2021Poland
Awarded 5,900 MW
H1 2022Holland Coast West
~1,500 MW
Award in Q4 2021Japanese round 1
~1,500 MW
H2 2021UK CfD 4
Up to 12,000 MW
H2 2021Rhode Island
up to 600 MW
H1 2022Taiwan auction
TBC
2021 up to 25 GW 2022 onwards
2022New Jersey 3~1,200 MW
2022New York 3>800 MW
H2 2022German tender
900 MW
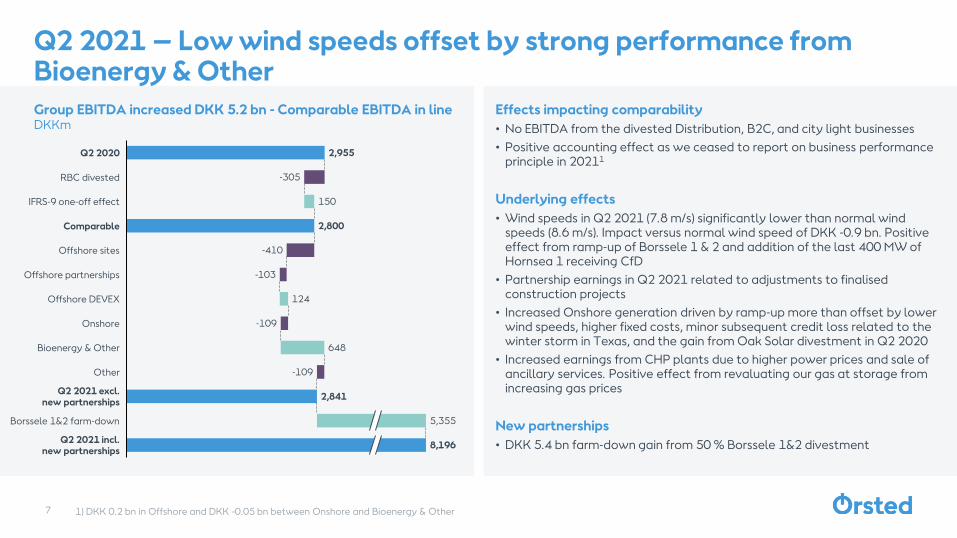
1) DKK 0.2 bn in Offshore and DKK -0.05 bn between Onshore and Bioenergy & Other
Q2 2021 – Low wind speeds offset by strong performance from Bioenergy & Other
Group EBITDA increased DKK 5.2 bn - Comparable EBITDA in line DKKm
Effects impacting comparability
• No EBITDA from the divested Distribution, B2C, and city light businesses
• Positive accounting effect as we ceased to report on business performance principle in 20211
Underlying effects
• Wind speeds in Q2 2021 (7.8 m/s) significantly lower than normal wind speeds (8.6 m/s). Impact versus normal wind speed of DKK -0.9 bn. Positive effect from ramp-up of Borssele 1 & 2 and addition of the last 400 MW of Hornsea 1 receiving CfD
• Partnership earnings in Q2 2021 related to adjustments to finalised construction projects
• Increased Onshore generation driven by ramp-up more than offset by lower wind speeds, higher fixed costs, minor subsequent credit loss related to the winter storm in Texas, and the gain from Oak Solar divestment in Q2 2020
• Increased earnings from CHP plants due to higher power prices and sale of ancillary services. Positive effect from revaluating our gas at storage from increasing gas prices
New partnerships
• DKK 5.4 bn farm-down gain from 50 % Borssele 1&2 divestment
2,955
2,800
2,841
150
124
648
Onshore
Offshore sites
Other
5,355
Bioenergy & Other
Offshore DEVEX
Comparable
RBC divested
IFRS-9 one-off effect
Offshore partnerships -103
-305
-410
8,196
Borssele 1&2 farm-down
-109
Q2 2021 excl.new partnerships
-109
Q2 2020
Q2 2021 incl.new partnerships
7
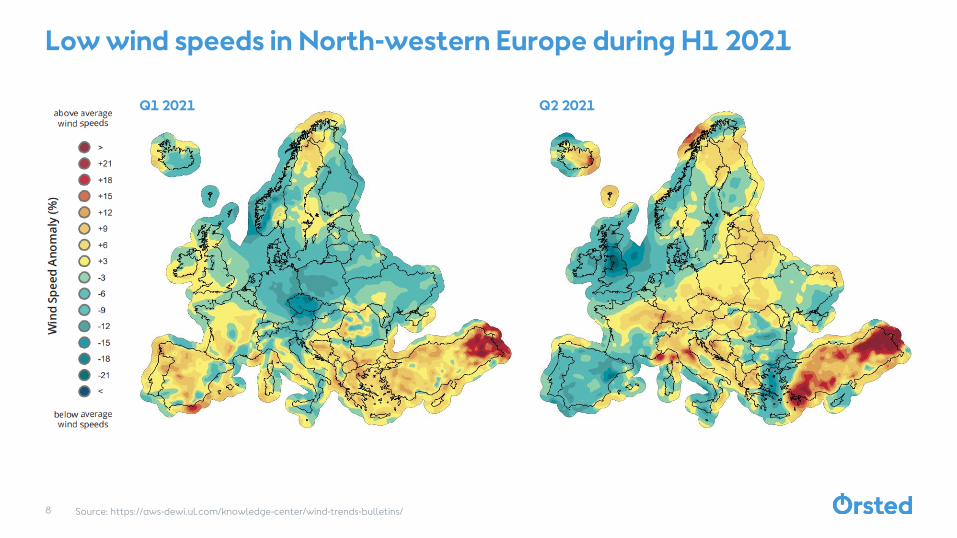
Source: https://aws-dewi.ul.com/knowledge-center/wind-trends-bulletins/
Low wind speeds in North-western Europe during H1 2021
8
Q1 2021 Q2 2021
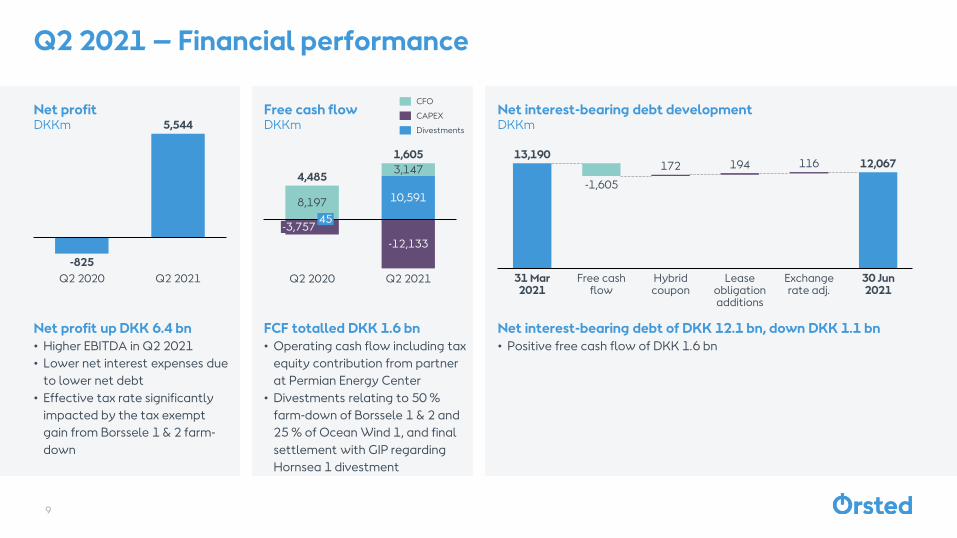
Q2 2021 – Financial performance
9
Net profitDKKm
Net profit up DKK 6.4 bn
• Higher EBITDA in Q2 2021
• Lower net interest expenses due
to lower net debt
• Effective tax rate significantly
impacted by the tax exempt
gain from Borssele 1 & 2 farm-
down
Free cash flowDKKm
FCF totalled DKK 1.6 bn
• Operating cash flow including tax
equity contribution from partner
at Permian Energy Center
• Divestments relating to 50 %
farm-down of Borssele 1 & 2 and
25 % of Ocean Wind 1, and final
settlement with GIP regarding
Hornsea 1 divestment
10,5918,197
3,147
-12,133
Q2 2020
-3,75745
1,605
Q2 2021
4,485
CFO
Divestments
CAPEX
-825
5,544
Q2 2020 Q2 2021
Net interest-bearing debt developmentDKKm
Net interest-bearing debt of DKK 12.1 bn, down DKK 1.1 bn
• Positive free cash flow of DKK 1.6 bn
13,19012,067172 194 116
31 Mar2021
Free cash flow
Hybrid coupon
Lease obligation additions
Exchange rate adj.
30 Jun2021
-1,605
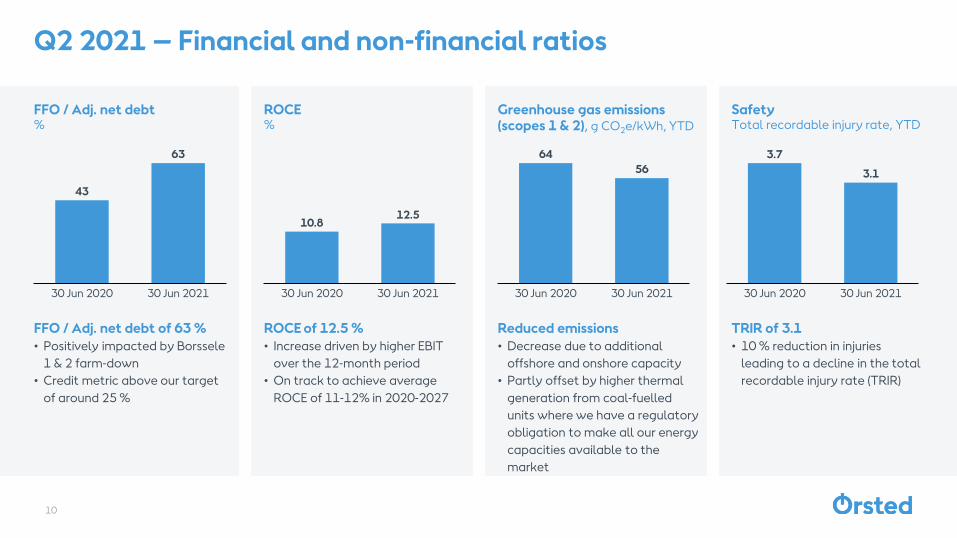
Q2 2021 – Financial and non-financial ratios
FFO / Adj. net debt%
FFO / Adj. net debt of 63 %
• Positively impacted by Borssele
1 & 2 farm-down
• Credit metric above our target
of around 25 %
ROCE%
ROCE of 12.5 %
• Increase driven by higher EBIT
over the 12-month period
• On track to achieve average
ROCE of 11-12% in 2020-2027
43
63
30 Jun 2020 30 Jun 2021
10.812.5
30 Jun 2020 30 Jun 2021
10
Greenhouse gas emissions (scopes 1 & 2), g CO2e/kWh, YTD
SafetyTotal recordable injury rate, YTD
64
56
30 Jun 2020 30 Jun 2021
3.7
3.1
30 Jun 2020 30 Jun 2021
Reduced emissions
• Decrease due to additional
offshore and onshore capacity
• Partly offset by higher thermal
generation from coal-fuelled
units where we have a regulatory
obligation to make all our energy
capacities available to the
market
TRIR of 3.1
• 10 % reduction in injuries
leading to a decline in the total
recordable injury rate (TRIR)
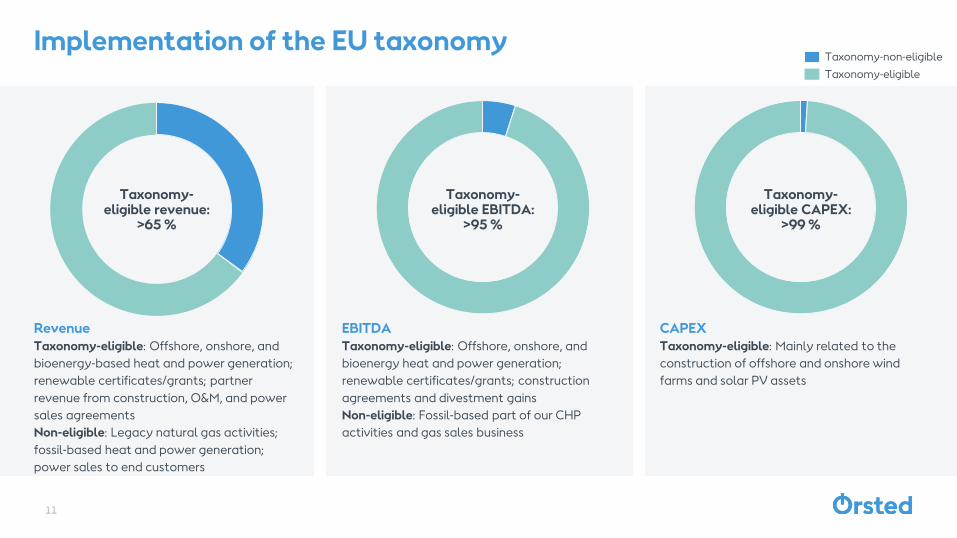
Implementation of the EU taxonomy
Revenue
Taxonomy-eligible: Offshore, onshore, and
bioenergy-based heat and power generation;
renewable certificates/grants; partner
revenue from construction, O&M, and power
sales agreements
Non-eligible: Legacy natural gas activities;
fossil-based heat and power generation;
power sales to end customers
EBITDA
Taxonomy-eligible: Offshore, onshore, and
bioenergy heat and power generation;
renewable certificates/grants; construction
agreements and divestment gains
Non-eligible: Fossil-based part of our CHP
activities and gas sales business
CAPEX
Taxonomy-eligible: Mainly related to the
construction of offshore and onshore wind
farms and solar PV assets
Taxonomy-eligible revenue:
>65 %
Taxonomy-eligible EBITDA:
>95 %
Taxonomy-eligible CAPEX:
>99 %
Taxonomy-non-eligible
Taxonomy-eligible
11
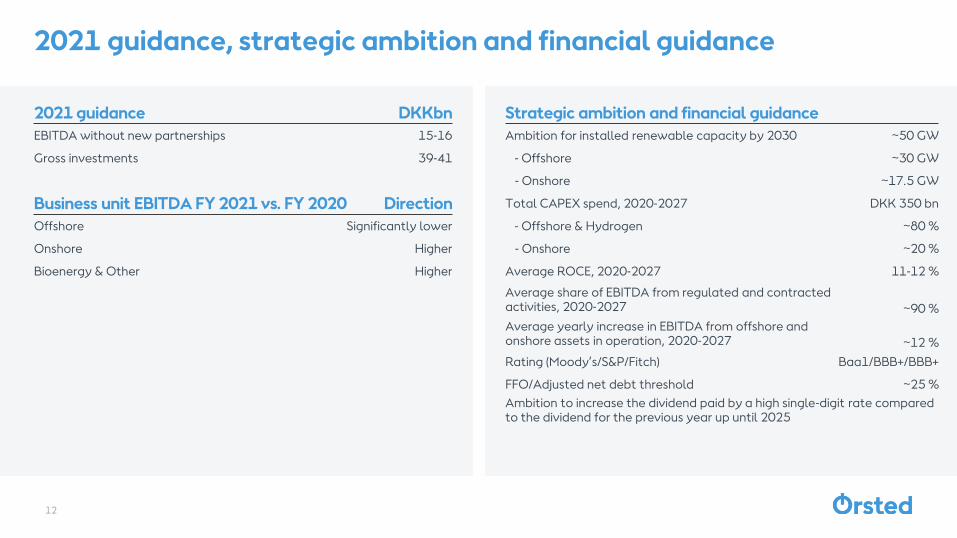
2021 guidance, strategic ambition and financial guidance
12
2021 guidance DKKbn
EBITDA without new partnerships 15-16
Gross investments 39-41
Business unit EBITDA FY 2021 vs. FY 2020 Direction
Offshore Significantly lower
Onshore Higher
Bioenergy & Other Higher
Strategic ambition and financial guidance
Ambition for installed renewable capacity by 2030 ~50 GW
- Offshore ~30 GW
- Onshore ~17.5 GW
Total CAPEX spend, 2020-2027 DKK 350 bn
- Offshore & Hydrogen ~80 %
- Onshore ~20 %
Average ROCE, 2020-2027 11-12 %
Average share of EBITDA from regulated and contracted activities, 2020-2027 ~90 %
Average yearly increase in EBITDA from offshore and onshore assets in operation, 2020-2027 ~12 %
Rating (Moody’s/S&P/Fitch) Baa1/BBB+/BBB+
FFO/Adjusted net debt threshold ~25 %
Ambition to increase the dividend paid by a high single-digit rate compared to the dividend for the previous year up until 2025
Earnings callDK: +45 78 15 01 09UK: +44 333 300 9268US: +1 833 823 0590
For questions, please press 01
Q&A
Appendix
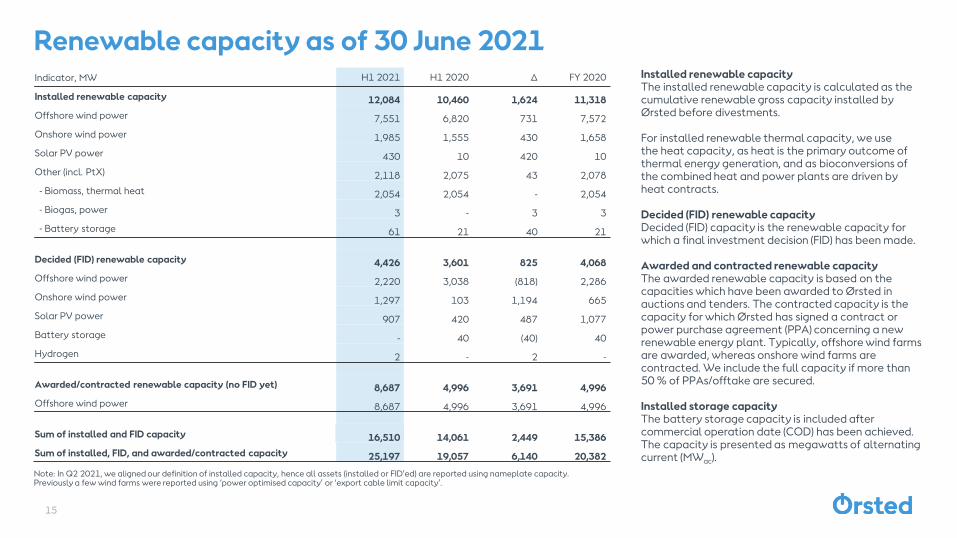
Renewable capacity as of 30 June 2021Indicator, MW H1 2021 H1 2020 Δ FY 2020
Installed renewable capacity 12,084 10,460 1,624 11,318
Offshore wind power 7,551 6,820 731 7,572
Onshore wind power 1,985 1,555 430 1,658
Solar PV power 430 10 420 10
Other (incl. PtX) 2,118 2,075 43 2,078
- Biomass, thermal heat 2,054 2,054 - 2,054
- Biogas, power 3 - 3 3
- Battery storage 61 21 40 21
Decided (FID) renewable capacity 4,426 3,601 825 4,068
Offshore wind power 2,220 3,038 (818) 2,286
Onshore wind power 1,297 103 1,194 665
Solar PV power 907 420 487 1,077
Battery storage - 40 (40) 40
Hydrogen 2 - 2 -
Awarded/contracted renewable capacity (no FID yet) 8,687 4,996 3,691 4,996
Offshore wind power 8,687 4,996 3,691 4,996
Sum of installed and FID capacity 16,510 14,061 2,449 15,386
Sum of installed, FID, and awarded/contracted capacity 25,197 19,057 6,140 20,382
Installed renewable capacityThe installed renewable capacity is calculated as the cumulative renewable gross capacity installed by Ørsted before divestments.
For installed renewable thermal capacity, we usethe heat capacity, as heat is the primary outcome of thermal energy generation, and as bioconversions of the combined heat and power plants are driven by heat contracts.
Decided (FID) renewable capacityDecided (FID) capacity is the renewable capacity for which a final investment decision (FID) has been made.
Awarded and contracted renewable capacityThe awarded renewable capacity is based on thecapacities which have been awarded to Ørsted inauctions and tenders. The contracted capacity is the capacity for which Ørsted has signed a contract or power purchase agreement (PPA) concerning a new renewable energy plant. Typically, offshore wind farms are awarded, whereas onshore wind farms are contracted. We include the full capacity if more than 50 % of PPAs/offtake are secured.
Installed storage capacityThe battery storage capacity is included aftercommercial operation date (COD) has been achieved. The capacity is presented as megawatts of alternating current (MWac).
15
Note: In Q2 2021, we aligned our definition of installed capacity, hence all assets (installed or FID’ed) are reported using nameplate capacity. Previously a few wind farms were reported using ‘power optimised capacity’ or ‘export cable limit capacity’.
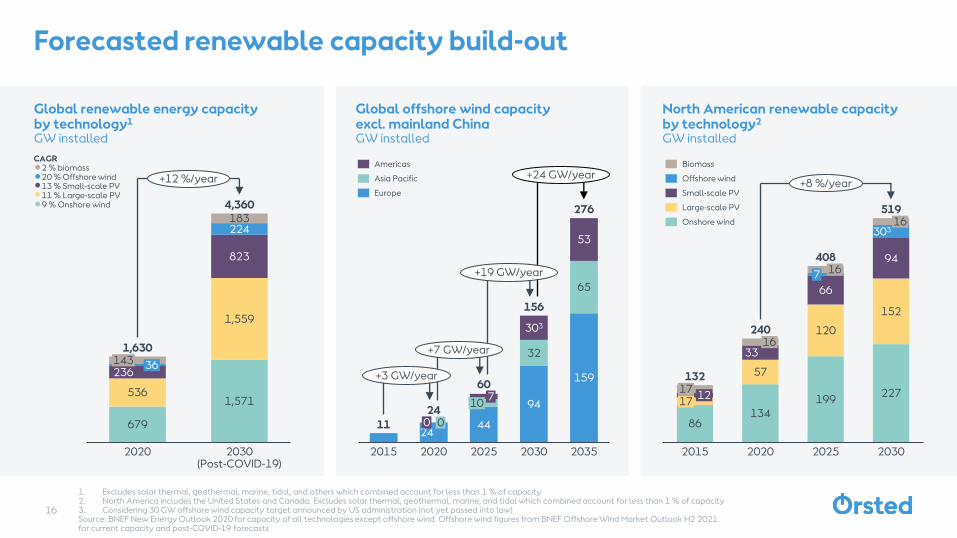
Forecasted renewable capacity build-out
679
1,571536
1,559
236
823
224183
2030(Post-COVID-19)
143 36
2020
1,630
4,360
+12 %/year
CAGR2 % biomass20 % Offshore wind13 % Small-scale PV11 % Large-scale PV9 % Onshore wind
Global renewable energy capacityby technology1
GW installed
Global offshore wind capacityexcl. mainland ChinaGW installed
2444
94
159
32
65
53
303
10
2015
24
2020
0 0
7
2025 2030 2035
276
11
60
156
+3 GW/year
+7 GW/year
+19 GW/year
+24 GW/yearAmericas
Asia Pacific
Europe
North American renewable capacityby technology2
GW installed
86134
199227
57
120
152
33
66
9416
519
2015
1712
2020
16240
17
16
7
2025
303
2030
132
408
+8 %/year
Biomass
Offshore wind
Onshore wind
Small-scale PV
Large-scale PV
1. Excludes solar thermal, geothermal, marine, tidal, and others which combined account for less than 1 % of capacity2. North America includes the United States and Canada. Excludes solar thermal, geothermal, marine, and tidal which combined account for less than 1 % of capacity3. Considering 30 GW offshore wind capacity target announced by US administration (not yet passed into law)Source: BNEF New Energy Outlook 2020 for capacity of all technologies except offshore wind. Offshore wind figures from BNEF Offshore Wind Market Outlook H2 2021for current capacity and post-COVID-19 forecasts
16
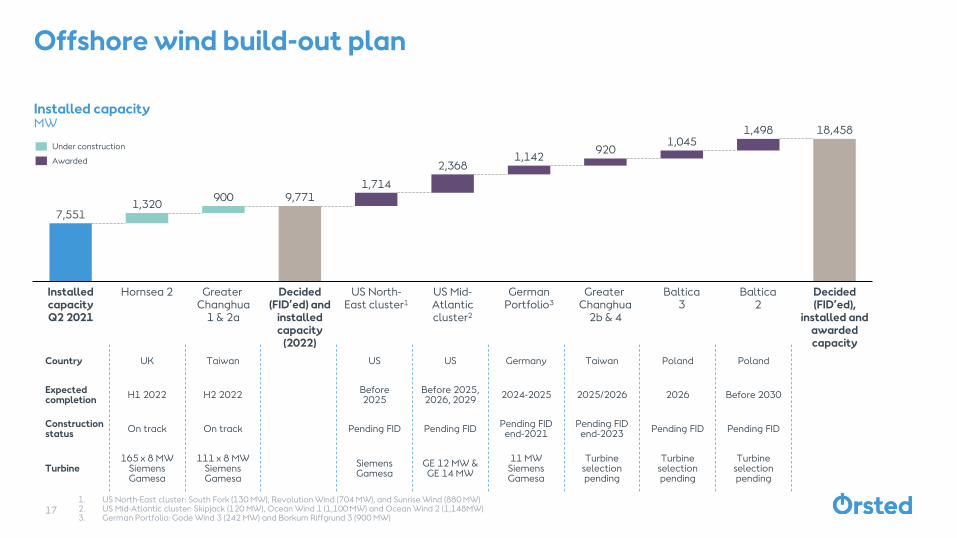
Country UK Taiwan US US Germany Taiwan Poland Poland
Expected completion
H1 2022 H2 2022Before2025
Before 2025, 2026, 2029
2024-2025 2025/2026 2026 Before 2030
Construction status
On track On track Pending FID Pending FIDPending FID
end-2021Pending FID
end-2023Pending FID Pending FID
Turbine 165 x 8 MW
SiemensGamesa
111 x 8 MW SiemensGamesa
Siemens Gamesa
GE 12 MW &GE 14 MW
11 MW Siemens Gamesa
Turbine selection pending
Turbine selection pending
Turbine selection pending
Offshore wind build-out plan
7,551
9,771
18,458
1,320900
1,714
2,3681,142
9201,045
1,498
Hornsea 2Installed capacityQ2 2021
Decided (FID’ed),
installed and awarded capacity
US North-East cluster1
Greater Changhua
1 & 2a
Greater Changhua
2b & 4
Decided (FID’ed) and
installed capacity
(2022)
US Mid-Atlantic cluster2
German Portfolio3
Baltica3
Baltica2
17
Under construction
Awarded
Installed capacityMW
1. US North-East cluster: South Fork (130 MW), Revolution Wind (704 MW), and Sunrise Wind (880 MW)2. US Mid-Atlantic cluster: Skipjack (120 MW), Ocean Wind 1 (1,100 MW) and Ocean Wind 2 (1,148MW)3. German Portfolio: Gode Wind 3 (242 MW) and Borkum Riffgrund 3 (900 MW)
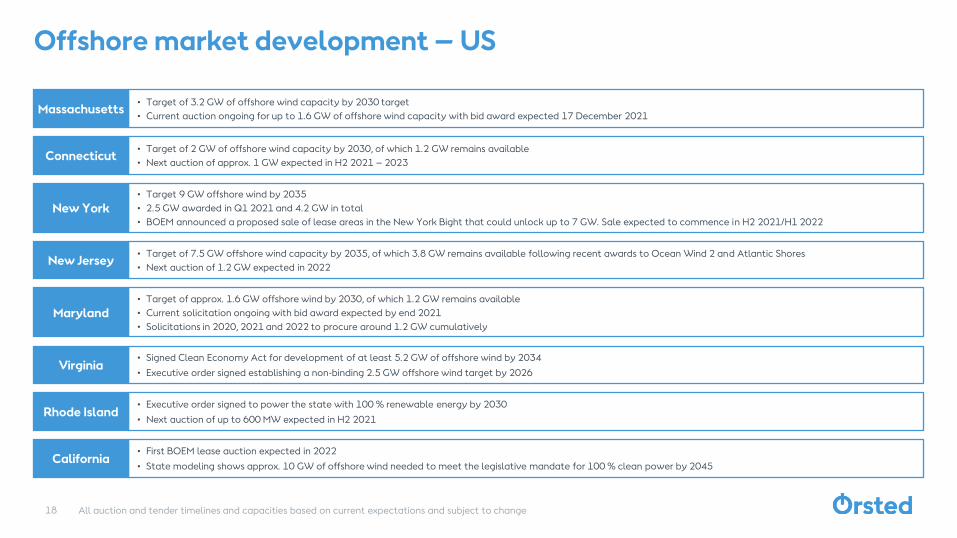
Massachusetts• Target of 3.2 GW of offshore wind capacity by 2030 target
• Current auction ongoing for up to 1.6 GW of offshore wind capacity with bid award expected 17 December 2021
New York• Target 9 GW offshore wind by 2035
• 2.5 GW awarded in Q1 2021 and 4.2 GW in total
• BOEM announced a proposed sale of lease areas in the New York Bight that could unlock up to 7 GW. Sale expected to commence in H2 2021/H1 2022
New Jersey• Target of 7.5 GW offshore wind capacity by 2035, of which 3.8 GW remains available following recent awards to Ocean Wind 2 and Atlantic Shores
• Next auction of 1.2 GW expected in 2022
Connecticut• Target of 2 GW of offshore wind capacity by 2030, of which 1.2 GW remains available
• Next auction of approx. 1 GW expected in H2 2021 – 2023
Maryland• Target of approx. 1.6 GW offshore wind by 2030, of which 1.2 GW remains available
• Current solicitation ongoing with bid award expected by end 2021
• Solicitations in 2020, 2021 and 2022 to procure around 1.2 GW cumulatively
Virginia• Signed Clean Economy Act for development of at least 5.2 GW of offshore wind by 2034
• Executive order signed establishing a non-binding 2.5 GW offshore wind target by 2026
Rhode Island• Executive order signed to power the state with 100 % renewable energy by 2030
• Next auction of up to 600 MW expected in H2 2021
Offshore market development – US
California• First BOEM lease auction expected in 2022
• State modeling shows approx. 10 GW of offshore wind needed to meet the legislative mandate for 100 % clean power by 2045
18 All auction and tender timelines and capacities based on current expectations and subject to change
19
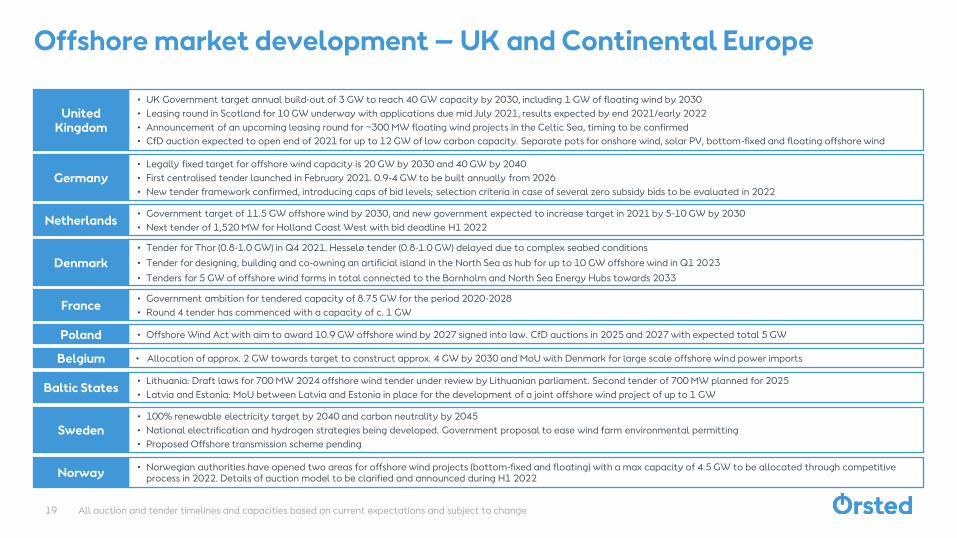
Offshore market development – UK and Continental Europe
Denmark
• Tender for Thor (0.8-1.0 GW) in Q4 2021. Hesselø tender (0.8-1.0 GW) delayed due to complex seabed conditions
• Tender for designing, building and co-owning an artificial island in the North Sea as hub for up to 10 GW offshore wind in Q1 2023
• Tenders for 5 GW of offshore wind farms in total connected to the Bornholm and North Sea Energy Hubs towards 2033
Germany
• Legally fixed target for offshore wind capacity is 20 GW by 2030 and 40 GW by 2040
• First centralised tender launched in February 2021. 0.9-4 GW to be built annually from 2026
• New tender framework confirmed, introducing caps of bid levels; selection criteria in case of several zero subsidy bids to be evaluated in 2022
Netherlands• Government target of 11.5 GW offshore wind by 2030, and new government expected to increase target in 2021 by 5-10 GW by 2030
• Next tender of 1,520 MW for Holland Coast West with bid deadline H1 2022
United Kingdom
• UK Government target annual build-out of 3 GW to reach 40 GW capacity by 2030, including 1 GW of floating wind by 2030
• Leasing round in Scotland for 10 GW underway with applications due mid July 2021, results expected by end 2021/early 2022
• Announcement of an upcoming leasing round for ~300 MW floating wind projects in the Celtic Sea, timing to be confirmed
• CfD auction expected to open end of 2021 for up to 12 GW of low carbon capacity. Separate pots for onshore wind, solar PV, bottom-fixed and floating offshore wind
France• Government ambition for tendered capacity of 8.75 GW for the period 2020-2028
• Round 4 tender has commenced with a capacity of c. 1 GW
Poland • Offshore Wind Act with aim to award 10.9 GW offshore wind by 2027 signed into law. CfD auctions in 2025 and 2027 with expected total 5 GW
Belgium • Allocation of approx. 2 GW towards target to construct approx. 4 GW by 2030 and MoU with Denmark for large scale offshore wind power imports
Baltic States• Lithuania: Draft laws for 700 MW 2024 offshore wind tender under review by Lithuanian parliament. Second tender of 700 MW planned for 2025
• Latvia and Estonia: MoU between Latvia and Estonia in place for the development of a joint offshore wind project of up to 1 GW
Sweden• 100% renewable electricity target by 2040 and carbon neutrality by 2045
• National electrification and hydrogen strategies being developed. Government proposal to ease wind farm environmental permitting
• Proposed Offshore transmission scheme pending
All auction and tender timelines and capacities based on current expectations and subject to change
Norway• Norwegian authorities have opened two areas for offshore wind projects (bottom-fixed and floating) with a max capacity of 4.5 GW to be allocated through competitive
process in 2022. Details of auction model to be clarified and announced during H1 2022
20
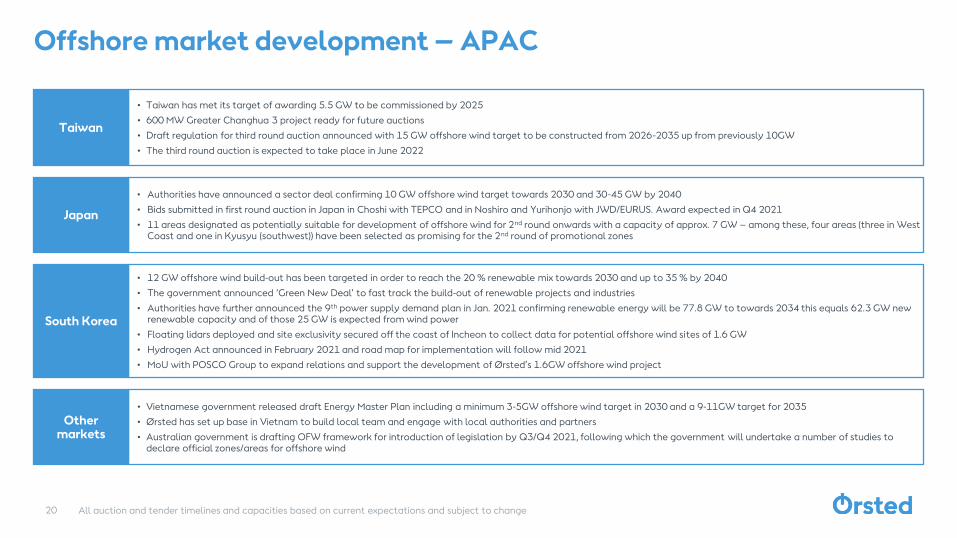
Offshore market development – APAC
Japan
• Authorities have announced a sector deal confirming 10 GW offshore wind target towards 2030 and 30-45 GW by 2040
• Bids submitted in first round auction in Japan in Choshi with TEPCO and in Noshiro and Yurihonjo with JWD/EURUS. Award expected in Q4 2021
• 11 areas designated as potentially suitable for development of offshore wind for 2nd round onwards with a capacity of approx. 7 GW – among these, four areas (three in West Coast and one in Kyusyu (southwest)) have been selected as promising for the 2nd round of promotional zones
Taiwan
• Taiwan has met its target of awarding 5.5 GW to be commissioned by 2025
• 600 MW Greater Changhua 3 project ready for future auctions
• Draft regulation for third round auction announced with 15 GW offshore wind target to be constructed from 2026-2035 up from previously 10GW
• The third round auction is expected to take place in June 2022
South Korea
• 12 GW offshore wind build-out has been targeted in order to reach the 20 % renewable mix towards 2030 and up to 35 % by 2040
• The government announced ‘Green New Deal’ to fast track the build-out of renewable projects and industries
• Authorities have further announced the 9th power supply demand plan in Jan. 2021 confirming renewable energy will be 77.8 GW to towards 2034 this equals 62.3 GW new renewable capacity and of those 25 GW is expected from wind power
• Floating lidars deployed and site exclusivity secured off the coast of Incheon to collect data for potential offshore wind sites of 1.6 GW
• Hydrogen Act announced in February 2021 and road map for implementation will follow mid 2021
• MoU with POSCO Group to expand relations and support the development of Ørsted’s 1.6GW offshore wind project
All auction and tender timelines and capacities based on current expectations and subject to change
Other markets
• Vietnamese government released draft Energy Master Plan including a minimum 3-5GW offshore wind target in 2030 and a 9-11GW target for 2035
• Ørsted has set up base in Vietnam to build local team and engage with local authorities and partners
• Australian government is drafting OFW framework for introduction of legislation by Q3/Q4 2021, following which the government will undertake a number of studies to declare official zones/areas for offshore wind
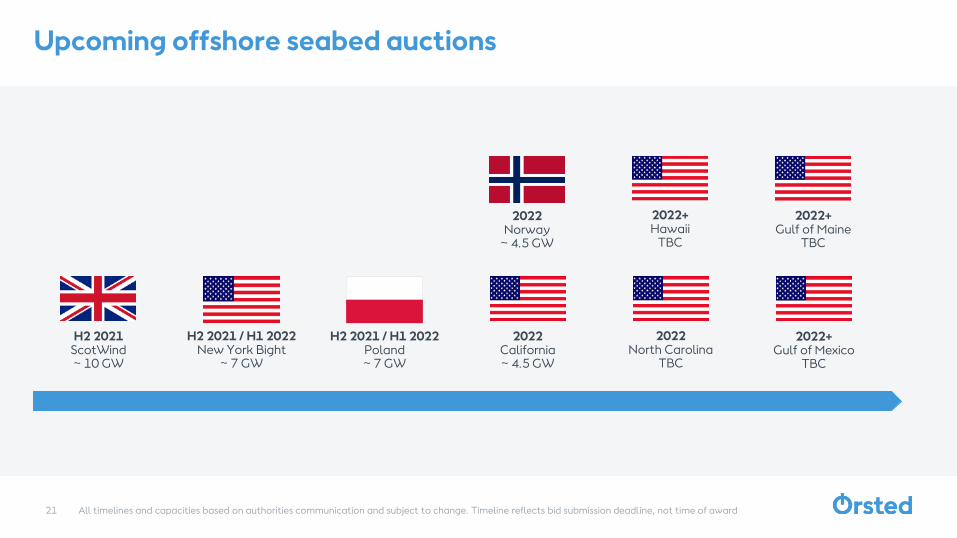
21
Upcoming offshore seabed auctions
2022California~ 4.5 GW
H2 2021 / H1 2022New York Bight
~ 7 GW
All timelines and capacities based on authorities communication and subject to change. Timeline reflects bid submission deadline, not time of award
H2 2021 / H1 2022Poland~ 7 GW
H2 2021ScotWind~ 10 GW
2022North Carolina
TBC
2022+Gulf of Mexico
TBC
2022Norway
~ 4.5 GW
2022+Hawaii
TBC
2022+Gulf of Maine
TBC
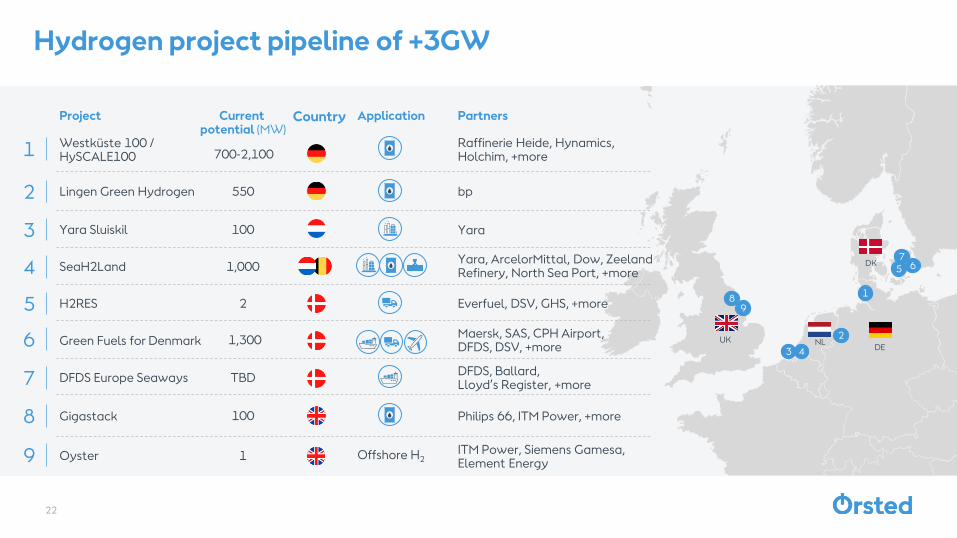
Hydrogen project pipeline of +3GW
Project Partners
DK
DEUK NL
8
3
1
2
765
1 Westküste 100 / HySCALE100
2 Lingen Green Hydrogen
3 Yara Sluiskil
6 Green Fuels for Denmark
5 H2RES
7 DFDS Europe Seaways
8 Gigastack
9 Oyster
4
4 SeaH2Land
CountryCurrent potential (MW)
700-2,100
550
100
1,300
2
TBD
100
1
1,000
Application
Offshore H2ITM Power, Siemens Gamesa, Element Energy
Philips 66, ITM Power, +more
DFDS, Ballard, Lloyd’s Register, +more
Maersk, SAS, CPH Airport,DFDS, DSV, +more
Everfuel, DSV, GHS, +more
Yara, ArcelorMittal, Dow, Zeeland Refinery, North Sea Port, +more
Yara
bp
Raffinerie Heide, Hynamics, Holchim, +more
9
22
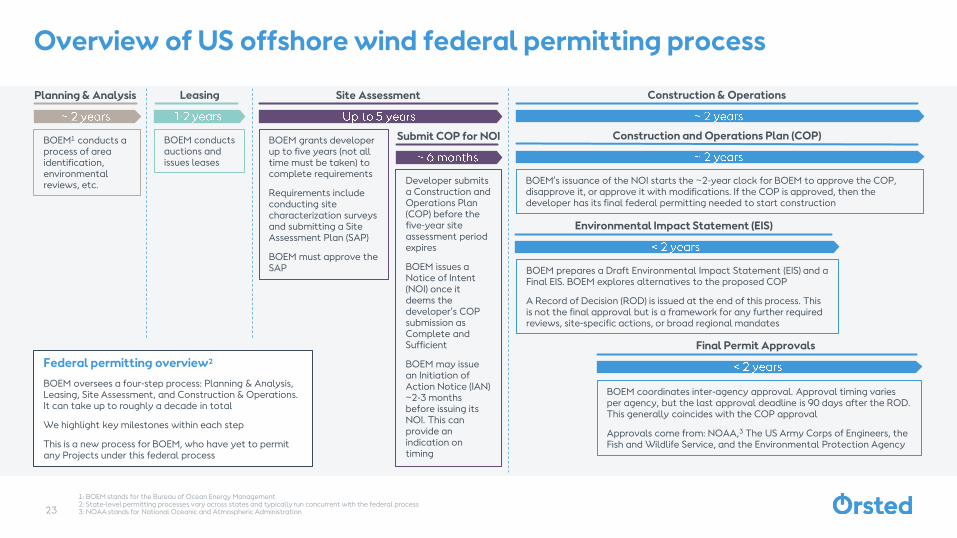
1: BOEM stands for the Bureau of Ocean Energy Management 2: State-level permitting processes vary across states and typically run concurrent with the federal process3: NOAA stands for National Oceanic and Atmospheric Administration
Overview of US offshore wind federal permitting process
Planning & Analysis Leasing Site Assessment Construction & Operations
Submit COP for NOI Construction and Operations Plan (COP)BOEM1 conducts a process of area identification, environmental reviews, etc.
BOEM conducts auctions and issues leases
BOEM grants developer up to five years (not all time must be taken) to complete requirements
Requirements include conducting site characterization surveys and submitting a Site Assessment Plan (SAP)
BOEM must approve the SAP
Developer submits a Construction and Operations Plan (COP) before the five-year site assessment period expires
BOEM issues a Notice of Intent (NOI) once it deems the developer’s COP submission as Complete and Sufficient
BOEM may issue an Initiation of Action Notice (IAN) ~2-3 months before issuing its NOI. This can provide an indication on timing
BOEM’s issuance of the NOI starts the ~2-year clock for BOEM to approve the COP, disapprove it, or approve it with modifications. If the COP is approved, then the developer has its final federal permitting needed to start construction
Environmental Impact Statement (EIS)
BOEM prepares a Draft Environmental Impact Statement (EIS) and a Final EIS. BOEM explores alternatives to the proposed COP
A Record of Decision (ROD) is issued at the end of this process. This is not the final approval but is a framework for any further required reviews, site-specific actions, or broad regional mandates
Final Permit Approvals
BOEM coordinates inter-agency approval. Approval timing varies per agency, but the last approval deadline is 90 days after the ROD. This generally coincides with the COP approval
Approvals come from: NOAA,3 The US Army Corps of Engineers, the Fish and Wildlife Service, and the Environmental Protection Agency
Federal permitting overview2
BOEM oversees a four-step process: Planning & Analysis, Leasing, Site Assessment, and Construction & Operations. It can take up to roughly a decade in total
We highlight key milestones within each step
This is a new process for BOEM, who have yet to permit any Projects under this federal process
23
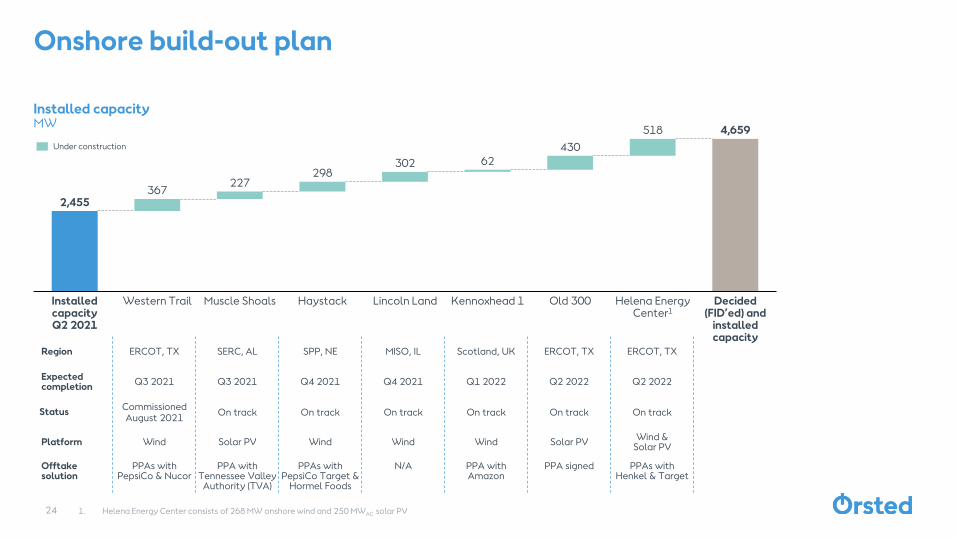
Region ERCOT, TX SERC, AL SPP, NE MISO, IL Scotland, UK ERCOT, TX ERCOT, TX
Expected completion
Q3 2021 Q3 2021 Q4 2021 Q4 2021 Q1 2022 Q2 2022 Q2 2022
StatusCommissioned August 2021
On track On track On track On track On track On track
Platform Wind Solar PV Wind Wind Wind Solar PV Wind &
Solar PV
Offtake solution
PPAs with PepsiCo & Nucor
PPA with Tennessee Valley
Authority (TVA)
PPAs with PepsiCo Target &
Hormel Foods
N/A PPA with Amazon
PPA signed PPAs with Henkel & Target
Onshore build-out plan
24
Installed capacityMW
1. Helena Energy Center consists of 268 MW onshore wind and 250 MWAC solar PV
2,455
4,659
367227
298302 62
430
518
Kennoxhead 1Installed capacityQ2 2021
Western Trail Helena Energy Center1
HaystackMuscle Shoals Lincoln Land Old 300 Decided (FID’ed) and
installed capacity
Under construction
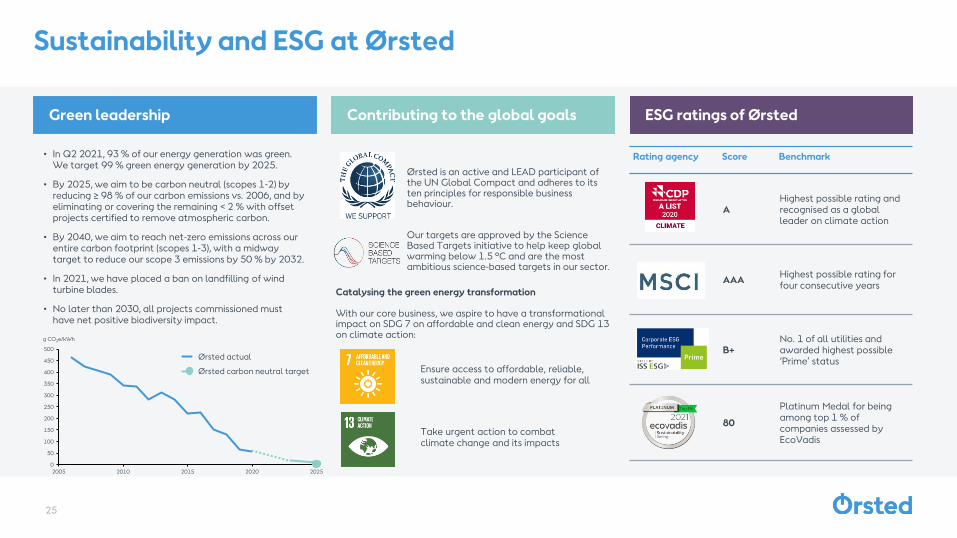
Sustainability and ESG at Ørsted
Contributing to the global goals ESG ratings of Ørsted
Rating agency Score Benchmark
AHighest possible rating and recognised as a global leader on climate action
AAAHighest possible rating for four consecutive years
B+No. 1 of all utilities and awarded highest possible ‘Prime’ status
80
Platinum Medal for being among top 1 % of companies assessed by EcoVadis
Ensure access to affordable, reliable, sustainable and modern energy for all
Take urgent action to combat climate change and its impacts
Catalysing the green energy transformation
With our core business, we aspire to have a transformational impact on SDG 7 on affordable and clean energy and SDG 13 on climate action:
• In Q2 2021, 93 % of our energy generation was green. We target 99 % green energy generation by 2025.
• By 2025, we aim to be carbon neutral (scopes 1-2) by reducing ≥ 98 % of our carbon emissions vs. 2006, and by eliminating or covering the remaining < 2 % with offset projects certified to remove atmospheric carbon.
• By 2040, we aim to reach net-zero emissions across our entire carbon footprint (scopes 1-3), with a midway target to reduce our scope 3 emissions by 50 % by 2032.
• In 2021, we have placed a ban on landfilling of wind turbine blades.
• No later than 2030, all projects commissioned must have net positive biodiversity impact.
0
50
100
150
200
250
300
350
400
450
500
2005 2010 2015 2020 2025
g CO2e/kWh
Ørsted actual
Ørsted carbon neutral target
Green leadership
Ørsted is an active and LEAD participant of the UN Global Compact and adheres to its ten principles for responsible business behaviour.
25
Our targets are approved by the Science Based Targets initiative to help keep global warming below 1.5 ºC and are the most ambitious science-based targets in our sector.
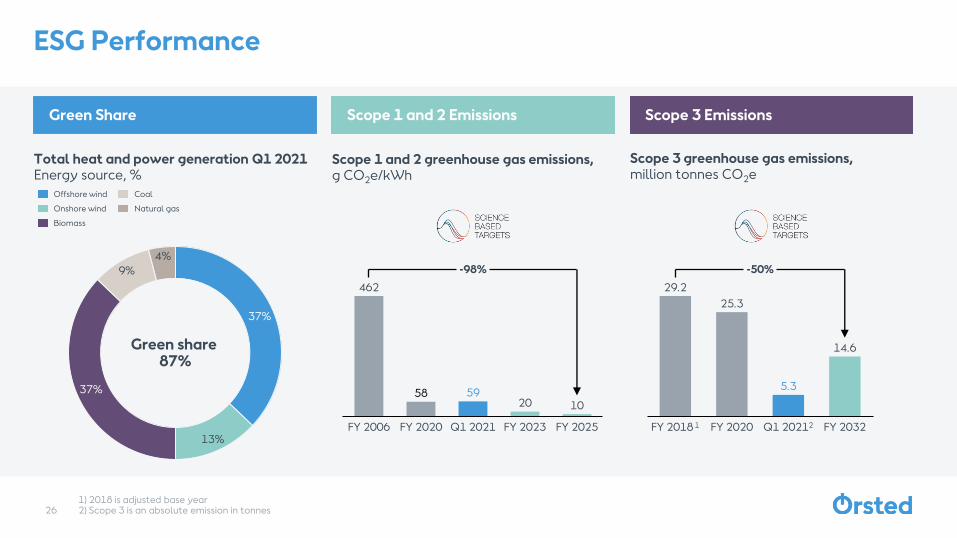
ESG Performance
Total heat and power generation Q1 2021 Energy source, %
Green Share
Scope 1 and 2 greenhouse gas emissions, g CO2e/kWh
Scope 1 and 2 Emissions
Scope 3 greenhouse gas emissions, million tonnes CO2e
Scope 3 Emissions
1) 2018 is adjusted base year2) Scope 3 is an absolute emission in tonnes
37%
13%
37%
9%
4%
Offshore wind
Onshore wind
Biomass
Natural gas
Coal
462
58 5920 10
Q1 2021FY 2020FY 2006 FY 2023 FY 2025
-98%
29.2
25.3
5.3
14.6
Q1 20212FY 2020FY 2018 1 FY 2032
-50%
Green share 87%
26
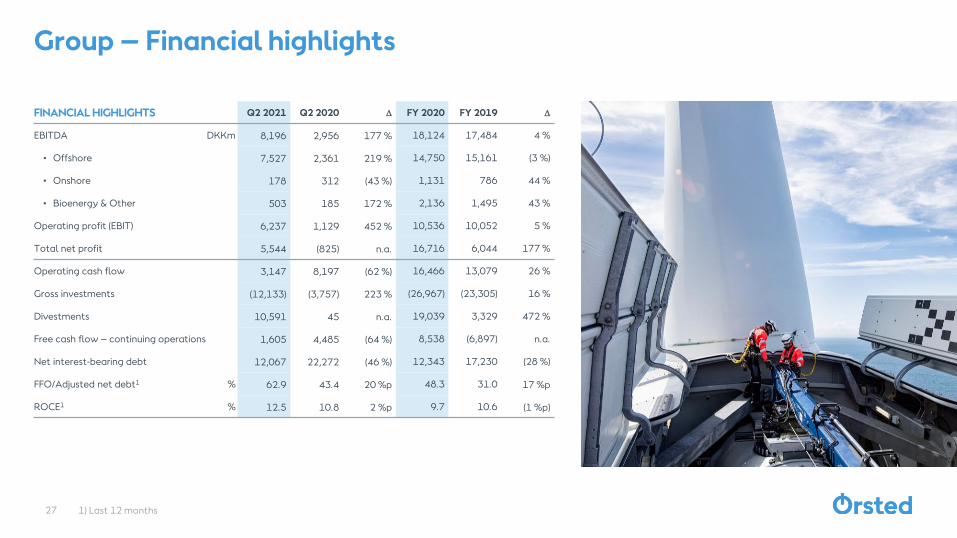
1) Last 12 months
Group – Financial highlights
FINANCIAL HIGHLIGHTS Q2 2021 Q2 2020 D FY 2020 FY 2019 D
EBITDA DKKm 8,196 2,956 177 % 18,124 17,484 4 %
• Offshore 7,527 2,361 219 % 14,750 15,161 (3 %)
• Onshore 178 312 (43 %) 1,131 786 44 %
• Bioenergy & Other 503 185 172 % 2,136 1,495 43 %
Operating profit (EBIT) 6,237 1,129 452 % 10,536 10,052 5 %
Total net profit 5,544 (825) n.a. 16,716 6,044 177 %
Operating cash flow 3,147 8,197 (62 %) 16,466 13,079 26 %
Gross investments (12,133) (3,757) 223 % (26,967) (23,305) 16 %
Divestments 10,591 45 n.a. 19,039 3,329 472 %
Free cash flow – continuing operations 1,605 4,485 (64 %) 8,538 (6,897) n.a.
Net interest-bearing debt 12,067 22,272 (46 %) 12,343 17,230 (28 %)
FFO/Adjusted net debt1 % 62.9 43.4 20 %p 48.3 31.0 17 %p
ROCE1 % 12.5 10.8 2 %p 9.7 10.6 (1 %p)
27
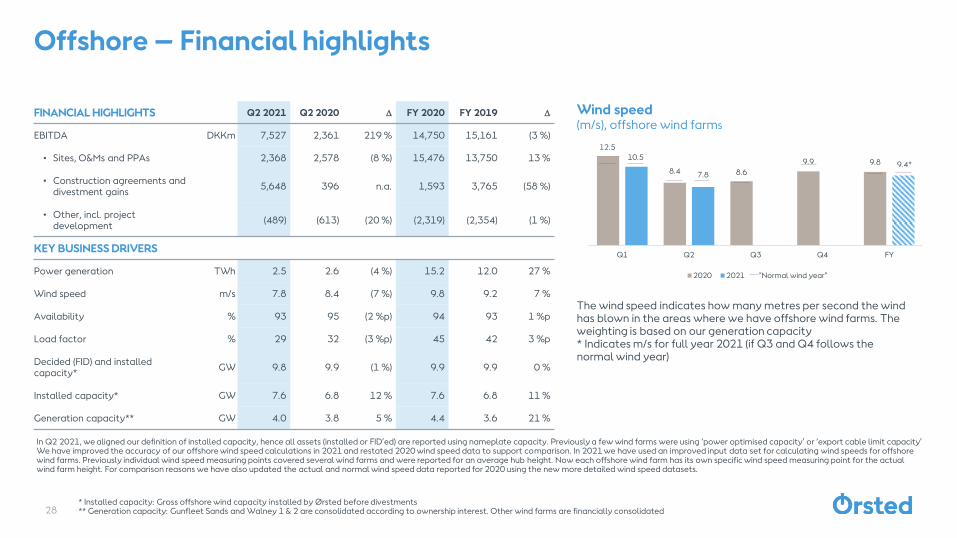
Offshore – Financial highlights
28
Wind speed(m/s), offshore wind farms
The wind speed indicates how many metres per second the wind has blown in the areas where we have offshore wind farms. The weighting is based on our generation capacity* Indicates m/s for full year 2021 (if Q3 and Q4 follows the normal wind year)
In Q2 2021, we aligned our definition of installed capacity, hence all assets (installed or FID’ed) are reported using nameplate capacity. Previously a few wind farms were using ‘power optimised capacity’ or ‘export cable limit capacity’We have improved the accuracy of our offshore wind speed calculations in 2021 and restated 2020 wind speed data to support comparison. In 2021 we have used an improved input data set for calculating wind speeds for offshore wind farms. Previously individual wind speed measuring points covered several wind farms and were reported for an average hub height. Now each offshore wind farm has its own specific wind speed measuring point for the actual wind farm height. For comparison reasons we have also updated the actual and normal wind speed data reported for 2020 using the new more detailed wind speed datasets.
* Installed capacity: Gross offshore wind capacity installed by Ørsted before divestments** Generation capacity: Gunfleet Sands and Walney 1 & 2 are consolidated according to ownership interest. Other wind farms are financially consolidated
FINANCIAL HIGHLIGHTS Q2 2021 Q2 2020 D FY 2020 FY 2019 D
EBITDA DKKm 7,527 2,361 219 % 14,750 15,161 (3 %)
• Sites, O&Ms and PPAs 2,368 2,578 (8 %) 15,476 13,750 13 %
• Construction agreements and divestment gains
5,648 396 n.a. 1,593 3,765 (58 %)
• Other, incl. project development
(489) (613) (20 %) (2,319) (2,354) (1 %)
KEY BUSINESS DRIVERS
Power generation TWh 2.5 2.6 (4 %) 15.2 12.0 27 %
Wind speed m/s 7.8 8.4 (7 %) 9.8 9.2 7 %
Availability % 93 95 (2 %p) 94 93 1 %p
Load factor % 29 32 (3 %p) 45 42 3 %p
Decided (FID) and installed capacity*
GW 9.8 9.9 (1 %) 9.9 9.9 0 %
Installed capacity* GW 7.6 6.8 12 % 7.6 6.8 11 %
Generation capacity** GW 4.0 3.8 5 % 4.4 3.6 21 %
12.5
8.4 8.6
9.9 9.810.5
7.8
9.4*
Q1 Q2 Q3 Q4 FY
2020 2021 "Normal wind year"
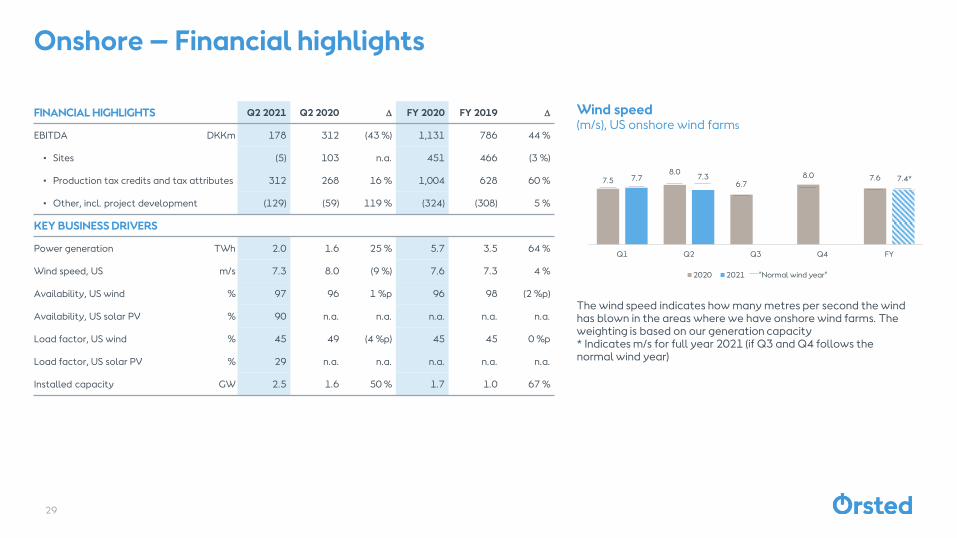
Onshore – Financial highlights
29
Wind speed(m/s), US onshore wind farms
FINANCIAL HIGHLIGHTS Q2 2021 Q2 2020 D FY 2020 FY 2019 D
EBITDA DKKm 178 312 (43 %) 1,131 786 44 %
• Sites (5) 103 n.a. 451 466 (3 %)
• Production tax credits and tax attributes 312 268 16 % 1,004 628 60 %
• Other, incl. project development (129) (59) 119 % (324) (308) 5 %
KEY BUSINESS DRIVERS
Power generation TWh 2.0 1.6 25 % 5.7 3.5 64 %
Wind speed, US m/s 7.3 8.0 (9 %) 7.6 7.3 4 %
Availability, US wind % 97 96 1 %p 96 98 (2 %p)
Availability, US solar PV % 90 n.a. n.a. n.a. n.a. n.a.
Load factor, US wind % 45 49 (4 %p) 45 45 0 %p
Load factor, US solar PV % 29 n.a. n.a. n.a. n.a. n.a.
Installed capacity GW 2.5 1.6 50 % 1.7 1.0 67 %
The wind speed indicates how many metres per second the wind has blown in the areas where we have onshore wind farms. The weighting is based on our generation capacity* Indicates m/s for full year 2021 (if Q3 and Q4 follows the normal wind year)
7.58.0
6.78.0 7.67.7 7.3 7.4*
Q1 Q2 Q3 Q4 FY
2020 2021 "Normal wind year"
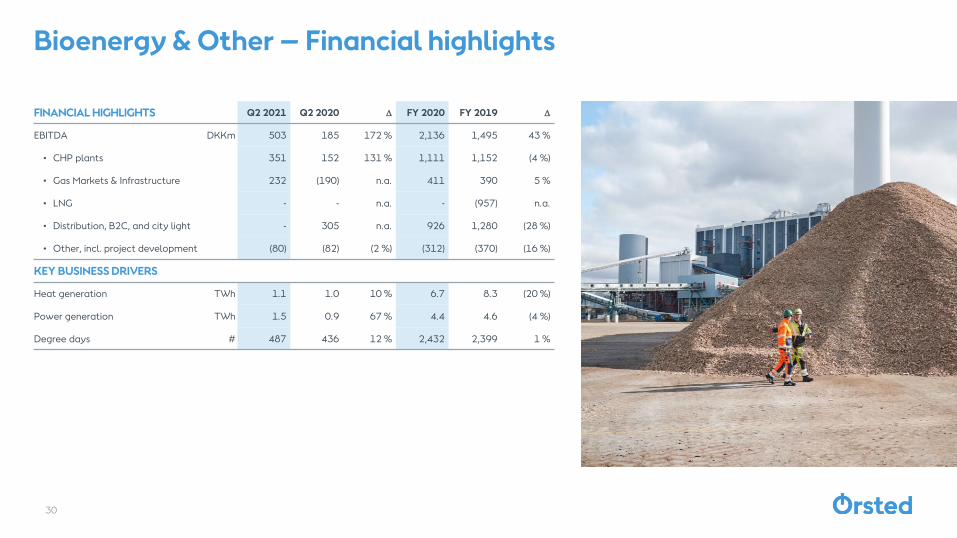
Bioenergy & Other – Financial highlights
30
FINANCIAL HIGHLIGHTS Q2 2021 Q2 2020 D FY 2020 FY 2019 D
EBITDA DKKm 503 185 172 % 2,136 1,495 43 %
• CHP plants 351 152 131 % 1,111 1,152 (4 %)
• Gas Markets & Infrastructure 232 (190) n.a. 411 390 5 %
• LNG - - n.a. - (957) n.a.
• Distribution, B2C, and city light - 305 n.a. 926 1,280 (28 %)
• Other, incl. project development (80) (82) (2 %) (312) (370) (16 %)
KEY BUSINESS DRIVERS
Heat generation TWh 1.1 1.0 10 % 6.7 8.3 (20 %)
Power generation TWh 1.5 0.9 67 % 4.4 4.6 (4 %)
Degree days # 487 436 12 % 2,432 2,399 1 %
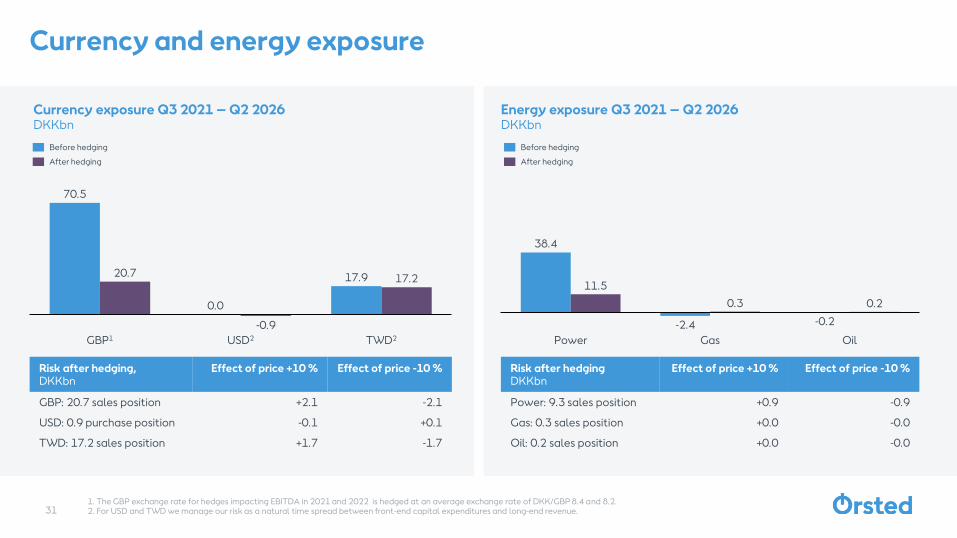
Currency and energy exposure
70.5
17.920.7
-0.9
17.2
GBP1 USD2 TWD2
0.0
38.4
-2.4 -0.2
11.5
0.3 0.2
OilPower Gas
Before hedging
After hedging
Before hedging
After hedging
Risk after hedgingDKKbn
Effect of price +10 % Effect of price -10 %
Power: 9.3 sales position +0.9 -0.9
Gas: 0.3 sales position +0.0 -0.0
Oil: 0.2 sales position +0.0 -0.0
Risk after hedging,DKKbn
Effect of price +10 % Effect of price -10 %
GBP: 20.7 sales position +2.1 -2.1
USD: 0.9 purchase position -0.1 +0.1
TWD: 17.2 sales position +1.7 -1.7
Energy exposure Q3 2021 – Q2 2026DKKbn
311. The GBP exchange rate for hedges impacting EBITDA in 2021 and 2022 is hedged at an average exchange rate of DKK/GBP 8.4 and 8.2.2. For USD and TWD we manage our risk as a natural time spread between front-end capital expenditures and long-end revenue.
Currency exposure Q3 2021 – Q2 2026DKKbn
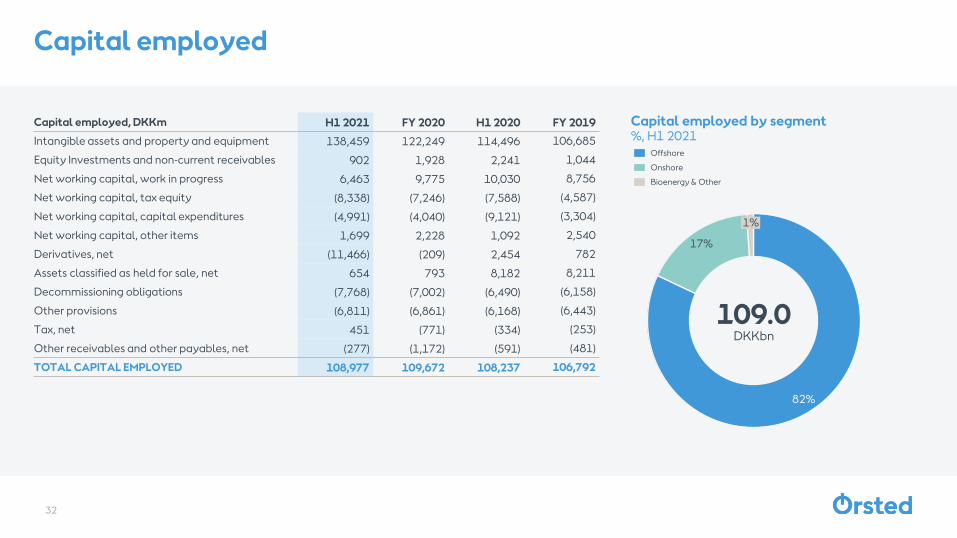
Capital employed
32
Capital employed, DKKm H1 2021 FY 2020 H1 2020 FY 2019
Intangible assets and property and equipment 138,459 122,249 114,496 106,685
Equity Investments and non-current receivables 902 1,928 2,241 1,044
Net working capital, work in progress 6,463 9,775 10,030 8,756
Net working capital, tax equity (8,338) (7,246) (7,588) (4,587)
Net working capital, capital expenditures (4,991) (4,040) (9,121) (3,304)
Net working capital, other items 1,699 2,228 1,092 2,540
Derivatives, net (11,466) (209) 2,454 782
Assets classified as held for sale, net 654 793 8,182 8,211
Decommissioning obligations (7,768) (7,002) (6,490) (6,158)
Other provisions (6,811) (6,861) (6,168) (6,443)
Tax, net 451 (771) (334) (253)
Other receivables and other payables, net (277) (1,172) (591) (481)
TOTAL CAPITAL EMPLOYED 108,977 109,672 108,237 106,792
82%
17%
1%
Capital employed by segment%, H1 2021
109.0DKKbn
Bioenergy & Other
Offshore
Onshore
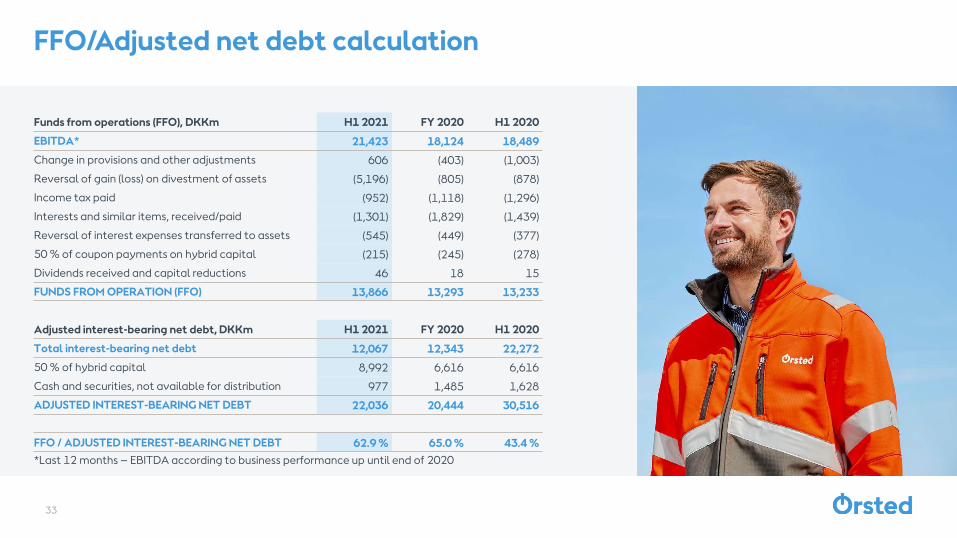
FFO/Adjusted net debt calculation
Funds from operations (FFO), DKKm H1 2021 FY 2020 H1 2020
EBITDA* 21,423 18,124 18,489
Change in provisions and other adjustments 606 (403) (1,003)
Reversal of gain (loss) on divestment of assets (5,196) (805) (878)
Income tax paid (952) (1,118) (1,296)
Interests and similar items, received/paid (1,301) (1,829) (1,439)
Reversal of interest expenses transferred to assets (545) (449) (377)
50 % of coupon payments on hybrid capital (215) (245) (278)
Dividends received and capital reductions 46 18 15
FUNDS FROM OPERATION (FFO) 13,866 13,293 13,233
Adjusted interest-bearing net debt, DKKm H1 2021 FY 2020 H1 2020
Total interest-bearing net debt 12,067 12,343 22,272
50 % of hybrid capital 8,992 6,616 6,616
Cash and securities, not available for distribution 977 1,485 1,628
ADJUSTED INTEREST-BEARING NET DEBT 22,036 20,444 30,516
FFO / ADJUSTED INTEREST-BEARING NET DEBT 62.9 % 65.0 % 43.4 %
33
*Last 12 months – EBITDA according to business performance up until end of 2020
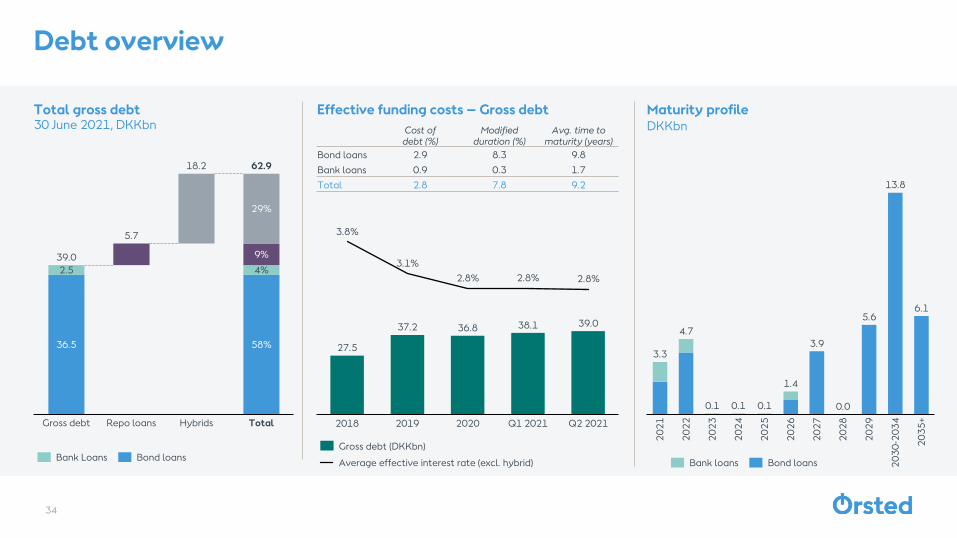
27.5
37.2 36.8 38.1 39.0
2019
3.8%
Q1 20212018 2020
3.1%
2.8% 2.8% 2.8%
Q2 2021
Average effective interest rate (excl. hybrid)
Gross debt (DKKbn)
Effective funding costs – Gross debt
Cost of debt (%)
Modified duration (%)
Avg. time to maturity (years)
Bond loans 2.9 8.3 9.8
Bank loans 0.9 0.3 1.7
Total 2.8 7.8 9.2
Maturity profileDKKbn
Total gross debt30 June 2021, DKKbn
0.1 0.1 0.1
3.9
5.6
13.8
6.1
20
23
20
21
20
26
20
22
20
27
20
24
20
25
20
28
20
29
20
30
-20
34
20
35
+
3.3
4.7
1.4
0.0
HybridsGross debt
2.5
36.5
29%
Repo loans
9%
4%
Total
58%
39.0
5.7
18.2 62.9
Bank loans Bond loansBank Loans Bond loans
34
Debt overview
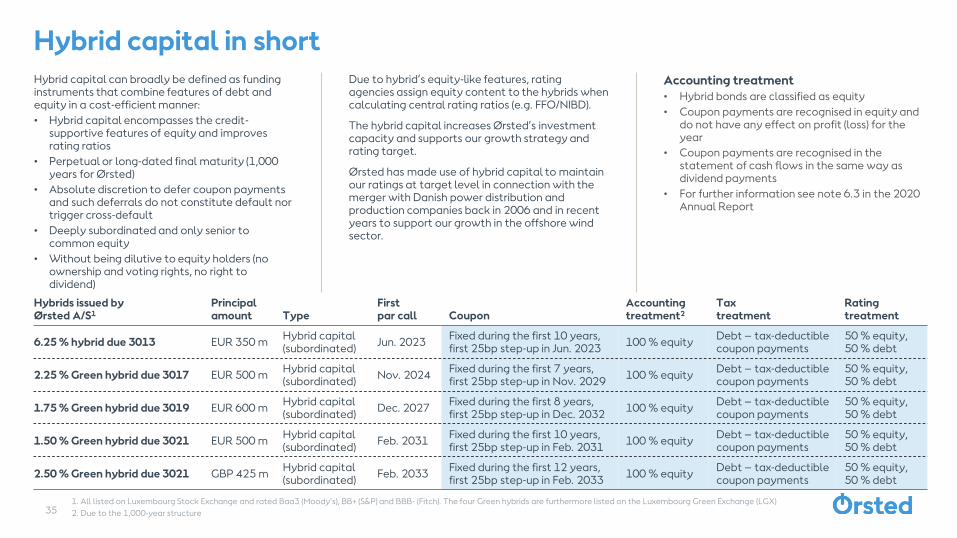
Accounting treatment
• Hybrid bonds are classified as equity
• Coupon payments are recognised in equity and do not have any effect on profit (loss) for the year
• Coupon payments are recognised in the statement of cash flows in the same way as dividend payments
• For further information see note 6.3 in the 2020 Annual Report
Hybrid capital can broadly be defined as funding instruments that combine features of debt and equity in a cost-efficient manner:
• Hybrid capital encompasses the credit-supportive features of equity and improves rating ratios
• Perpetual or long-dated final maturity (1,000 years for Ørsted)
• Absolute discretion to defer coupon payments and such deferrals do not constitute default nor trigger cross-default
• Deeply subordinated and only senior to common equity
• Without being dilutive to equity holders (no ownership and voting rights, no right to dividend)
Hybrids issued by Ørsted A/S1
Principalamount Type
First par call Coupon
Accounting treatment2
Tax treatment
Rating treatment
6.25 % hybrid due 3013 EUR 350 mHybrid capital (subordinated)
Jun. 2023Fixed during the first 10 years, first 25bp step-up in Jun. 2023
100 % equityDebt – tax-deductible coupon payments
50 % equity, 50 % debt
2.25 % Green hybrid due 3017 EUR 500 mHybrid capital (subordinated)
Nov. 2024Fixed during the first 7 years, first 25bp step-up in Nov. 2029
100 % equityDebt – tax-deductible coupon payments
50 % equity, 50 % debt
1.75 % Green hybrid due 3019 EUR 600 mHybrid capital (subordinated)
Dec. 2027Fixed during the first 8 years, first 25bp step-up in Dec. 2032
100 % equityDebt – tax-deductible coupon payments
50 % equity, 50 % debt
1.50 % Green hybrid due 3021 EUR 500 mHybrid capital (subordinated)
Feb. 2031Fixed during the first 10 years, first 25bp step-up in Feb. 2031
100 % equityDebt – tax-deductible coupon payments
50 % equity, 50 % debt
2.50 % Green hybrid due 3021 GBP 425 mHybrid capital (subordinated)
Feb. 2033Fixed during the first 12 years, first 25bp step-up in Feb. 2033
100 % equityDebt – tax-deductible coupon payments
50 % equity, 50 % debt
1. All listed on Luxembourg Stock Exchange and rated Baa3 (Moody’s), BB+ (S&P) and BBB- (Fitch). The four Green hybrids are furthermore listed on the Luxembourg Green Exchange (LGX)
2. Due to the 1,000-year structure
Hybrid capital in shortDue to hybrid’s equity-like features, rating agencies assign equity content to the hybrids when calculating central rating ratios (e.g. FFO/NIBD).
The hybrid capital increases Ørsted’s investment capacity and supports our growth strategy and rating target.
Ørsted has made use of hybrid capital to maintain our ratings at target level in connection with the merger with Danish power distribution and production companies back in 2006 and in recent years to support our growth in the offshore wind sector.
35
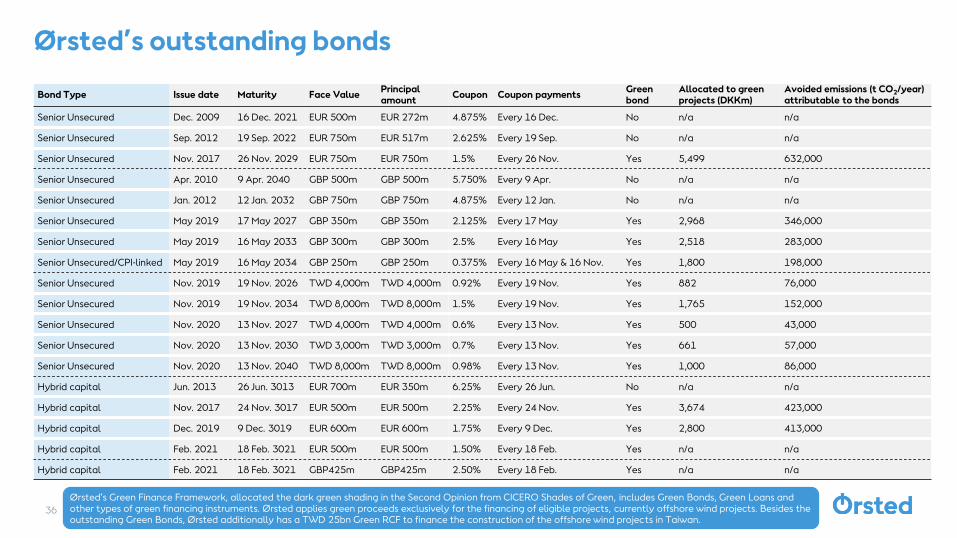
Bond Type Issue date Maturity Face ValuePrincipal amount
Coupon Coupon paymentsGreen bond
Allocated to green projects (DKKm)
Avoided emissions (t CO2/year) attributable to the bonds
Senior Unsecured Dec. 2009 16 Dec. 2021 EUR 500m EUR 272m 4.875% Every 16 Dec. No n/a n/a
Senior Unsecured Sep. 2012 19 Sep. 2022 EUR 750m EUR 517m 2.625% Every 19 Sep. No n/a n/a
Senior Unsecured Nov. 2017 26 Nov. 2029 EUR 750m EUR 750m 1.5% Every 26 Nov. Yes 5,499 632,000
Senior Unsecured Apr. 2010 9 Apr. 2040 GBP 500m GBP 500m 5.750% Every 9 Apr. No n/a n/a
Senior Unsecured Jan. 2012 12 Jan. 2032 GBP 750m GBP 750m 4.875% Every 12 Jan. No n/a n/a
Senior Unsecured May 2019 17 May 2027 GBP 350m GBP 350m 2.125% Every 17 May Yes 2,968 346,000
Senior Unsecured May 2019 16 May 2033 GBP 300m GBP 300m 2.5% Every 16 May Yes 2,518 283,000
Senior Unsecured/CPI-linked May 2019 16 May 2034 GBP 250m GBP 250m 0.375% Every 16 May & 16 Nov. Yes 1,800 198,000
Senior Unsecured Nov. 2019 19 Nov. 2026 TWD 4,000m TWD 4,000m 0.92% Every 19 Nov. Yes 882 76,000
Senior Unsecured Nov. 2019 19 Nov. 2034 TWD 8,000m TWD 8,000m 1.5% Every 19 Nov. Yes 1,765 152,000
Senior Unsecured Nov. 2020 13 Nov. 2027 TWD 4,000m TWD 4,000m 0.6% Every 13 Nov. Yes 500 43,000
Senior Unsecured Nov. 2020 13 Nov. 2030 TWD 3,000m TWD 3,000m 0.7% Every 13 Nov. Yes 661 57,000
Senior Unsecured Nov. 2020 13 Nov. 2040 TWD 8,000m TWD 8,000m 0.98% Every 13 Nov. Yes 1,000 86,000
Hybrid capital Jun. 2013 26 Jun. 3013 EUR 700m EUR 350m 6.25% Every 26 Jun. No n/a n/a
Hybrid capital Nov. 2017 24 Nov. 3017 EUR 500m EUR 500m 2.25% Every 24 Nov. Yes 3,674 423,000
Hybrid capital Dec. 2019 9 Dec. 3019 EUR 600m EUR 600m 1.75% Every 9 Dec. Yes 2,800 413,000
Hybrid capital Feb. 2021 18 Feb. 3021 EUR 500m EUR 500m 1.50% Every 18 Feb. Yes n/a n/a
Hybrid capital Feb. 2021 18 Feb. 3021 GBP425m GBP425m 2.50% Every 18 Feb. Yes n/a n/a
36
Ørsted’s outstanding bonds
Ørsted’s Green Finance Framework, allocated the dark green shading in the Second Opinion from CICERO Shades of Green, includes Green Bonds, Green Loans and other types of green financing instruments. Ørsted applies green proceeds exclusively for the financing of eligible projects, currently offshore wind projects. Besides the outstanding Green Bonds, Ørsted additionally has a TWD 25bn Green RCF to finance the construction of the offshore wind projects in Taiwan.
The financing strategy optimizes the effect of a fully integrated cash pool where cash at practically all of the company’s more than 200 subsidiaries is made available for the company’s financing and liquidity purposes.
Financing of activities at subsidiary level is provided by Ørsted A/S in a standardised and cost-efficient setup.
Widespread use of project financing is not considered cost-efficient and dilutes the creditworthiness of the company.
Financing strategy
37
At Ørsted, we have a centralised financing strategy utilizing our strong balance sheet and diverse portfolio.
The strategy supports:
• A capital structure supportive of our BBB+ rating ambition
• Concentration of and scale in financing activities
• Cost efficient financing based on a strong parent rating
• Optimal terms and conditions and uniform documentation
• Transparent and simple debt structure
• No financial covenants and restrictions on operating arrangements
• Corporate market more stable and predictable than project finance market
• Avoidance of structural subordination
38
Currency risk management
General principles
• Highly certain cash flows are hedged
• Cost-of-hedging is minimized by netting of exposures in the portfolio of projects, as well as use of construction contracts and debt in local currencies.
Managing outright long risk
• Operations: 5-year minimum hedging staircase mandate by the Board of Directors with 100 % in year 1 – declining to 20 % in year 5. The hedging staircase is a compromise between stabilizing cash flows in the front-end and ensuring a balanced FFO/NIBD.
• Beyond the 5-year horizon the currency exposures are to some extent hedged with foreign-currency debt.
Managing time-spread risk (new markets)
• Construction period: Hedge 100 % of year 1 currency cash flow risk by swapping the exposure to a year with the same currency revenue.
• In new markets the capital expenditures beyond year 1 are netted with future revenue in the same currency.
39
Interest rate and inflation risk management
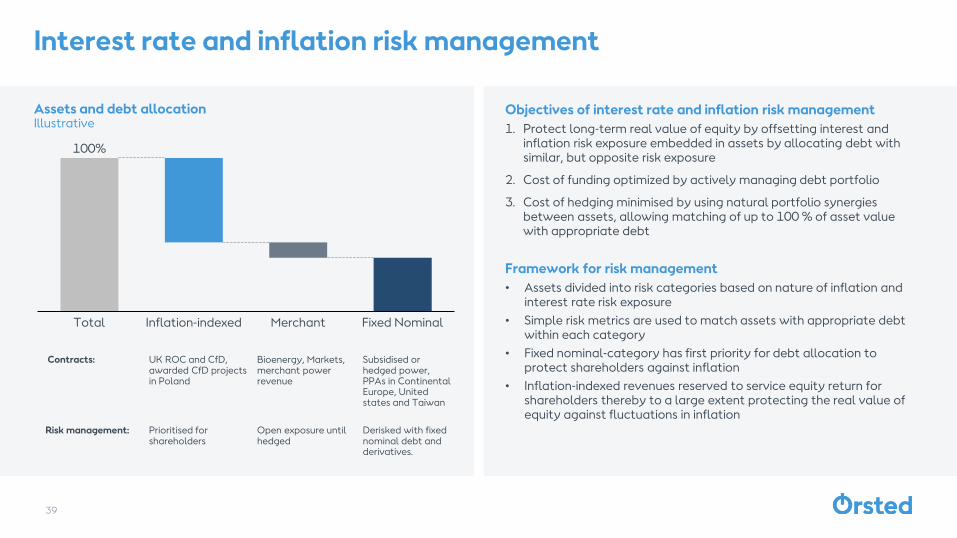
Objectives of interest rate and inflation risk management
1. Protect long-term real value of equity by offsetting interest and inflation risk exposure embedded in assets by allocating debt with similar, but opposite risk exposure
2. Cost of funding optimized by actively managing debt portfolio
3. Cost of hedging minimised by using natural portfolio synergies between assets, allowing matching of up to 100 % of asset value with appropriate debt
Framework for risk management
• Assets divided into risk categories based on nature of inflation and interest rate risk exposure
• Simple risk metrics are used to match assets with appropriate debt within each category
• Fixed nominal-category has first priority for debt allocation to protect shareholders against inflation
• Inflation-indexed revenues reserved to service equity return for shareholders thereby to a large extent protecting the real value of equity against fluctuations in inflation
Assets and debt allocationIllustrative
100%
Total Inflation-indexed Merchant Fixed Nominal
UK ROC and CfD, awarded CfD projects in Poland
Prioritised for shareholders
Bioenergy, Markets, merchant power revenue
Open exposure until hedged
Subsidised or hedged power, PPAs in Continental Europe, United states and Taiwan
Derisked with fixed nominal debt and derivatives.
Contracts:
Risk management:
40
Energy risk management
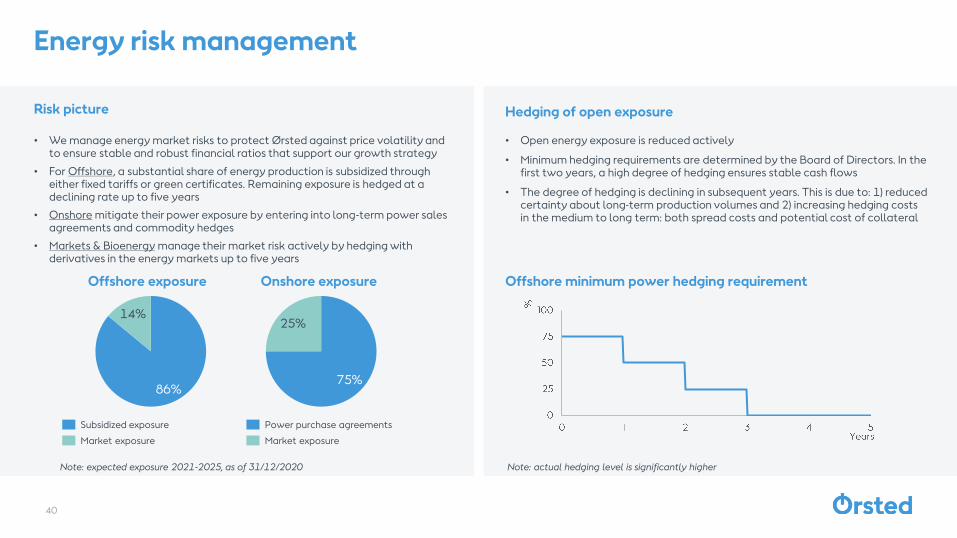
• We manage energy market risks to protect Ørsted against price volatility and to ensure stable and robust financial ratios that support our growth strategy
• For Offshore, a substantial share of energy production is subsidized through either fixed tariffs or green certificates. Remaining exposure is hedged at a declining rate up to five years
• Onshore mitigate their power exposure by entering into long-term power sales agreements and commodity hedges
• Markets & Bioenergy manage their market risk actively by hedging with derivatives in the energy markets up to five years
Offshore exposure Onshore exposure
Note: expected exposure 2021-2025, as of 31/12/2020
• Open energy exposure is reduced actively
• Minimum hedging requirements are determined by the Board of Directors. In the first two years, a high degree of hedging ensures stable cash flows
• The degree of hedging is declining in subsequent years. This is due to: 1) reduced certainty about long-term production volumes and 2) increasing hedging costs in the medium to long term: both spread costs and potential cost of collateral
Offshore minimum power hedging requirement
Note: actual hedging level is significantly higher
Risk picture Hedging of open exposure
86%
14%
75%
25%
Market exposure
Power purchase agreementsSubsidized exposure
Market exposure
Allan Bødskov Andersen
Head of Investor Relations
Rasmus Hærvig
Senior Manager
Sabine Lohse
Senior Investor Relations Officer
Alex Morgan
Lead Investor Relations Officer
Henriette Stenderup
IR Coordinator