investor presentation - li-ningir.lining.com/en/ir/presentations/pre150813.pdf · this presentation...
TRANSCRIPT

2015 Interim ResultsInvestor Presentation

© Li-Ning | 2015 | 2
DISCLAIMER
Disclaimer
This presentation incorporates information contained in the interim results announcement
(the “Results Announcement”) for the six months period ended 30 June 2015 of Li Ning
Company Limited (the “Company”). This presentation should be read in conjunction with
the Results Announcement and is qualified in its entirety by the more detailed information
and financial information contained in the Results Announcement.
Other than the information contained in the Results Announcement, you shall not
reproduce or distribute this presentation, in whole or in part, and you shall not disclose
any of the contents of this presentation or use any information herein for any purpose
without the Company‟s prior written consent. You hereby agree to the foregoing by
accepting delivery of this presentation.
The contents of this presentation have not been reviewed or approved by any regulatory
authority in Hong Kong or elsewhere. The contents of this presentation are not
investment, legal or tax advice. You are advised to exercise caution in perusing the
contents of this presentation. If you are in any doubt about any of the contents of this
presentation, you should obtain independent professional advice.

© Li-Ning | 2015 | 3
Agenda
Results Highlights
Financial Review
Operational Review
Outlook
Appendix

Results Highlights

© Li-Ning | 2015 | 5
2015H1 Results Highlights
Financial Highlights :
• Revenue grew 16% to RMB 3,641 million
• EBITDA and Operating Cash Flow turned positive– EBITDA RMB 260 million
– Operating cash flow RMB 165 million
• SSSG accelerated in both retail and wholesale
• Improved working capital
Operational Highlights:
• Store expansion prudently resumed with focus on under-penetrated southern region
• Double digit retail sell-through growth for core product categories in aggregate
• Inventory improved significantly
• Positive response from the market regarding our first Smart Shoes launch using O2O sales and marketing strategy

Financial Review

© Li-Ning | 2015 | 7
H12013
H22013
H12014
H22014
H12015
Other Brands
Double Happiness
LN Brand
3,258
2,906 2,9183,137
3,1272,458 2,625 2,674
86%
12%2%
Revenue Group Total
-RMB Million-
Revenue growth led by continuing momentum of Li Ning brand
3,592 3,641
Growth, YoYGroup: 16%
LN Brand: 17%
YoY growthGroup: 16%
LN Brand: 17%
© Li-Ning | 2015 | 8
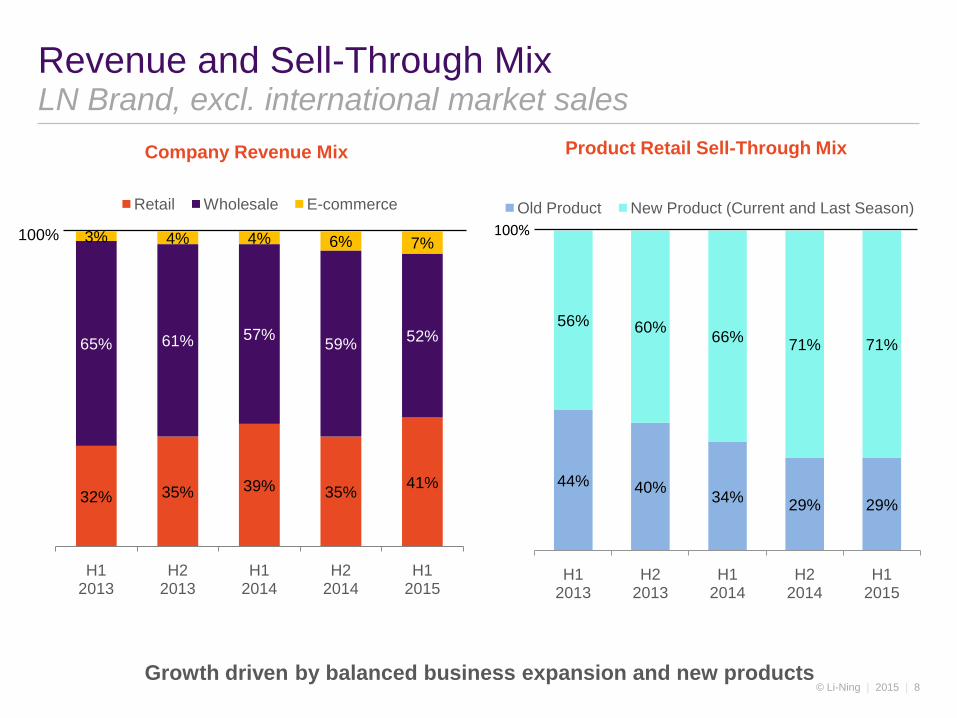
32% 35% 39% 35%41%
65% 61% 57%59%
52%
3% 4% 4% 6% 7%
H12013
H22013
H12014
H22014
H12015
Retail Wholesale E-commerce
Revenue and Sell-Through MixLN Brand, excl. international market sales
44% 40%34%
29% 29%
56% 60%66%
71% 71%
H12013
H22013
H12014
H22014
H12015
Old Product New Product (Current and Last Season)
100%
Growth driven by balanced business expansion and new products
100%
Product Retail Sell-Through MixCompany Revenue Mix

© Li-Ning | 2015 | 9
-21%
-17%
-7%
2%
10%
-19%
-12%
-8%
-2%
6%Country Total
Southern Region
5,626
5,745
Dec2014
Jun2015
Number of POS* at Period End
Performance by Geographical LocationLN Brand , excl. international market sales
Expansion resumed, with strategic focus on low-penetrated southern region
2013 2014 2015
1H 2H 1H 2H 1H
Sell-through growth, YoY %
*POS: Point of sales
1,322
1,371
Dec2014
Jun2015
119
49

© Li-Ning | 2015 | 10
Q32014
Q42014
Q12015
Q22015
Same Store Sales Growth (SSSG) RateLN Brand
Overall Platform
Low-teens
High-teens
Retail (Direct Operation)
Wholesale (Franchised Distributors)
High-Single-Digit
SSSG accelerated in both retail and wholesale
Q3
2014
Q4
2014
Q1
2015
Q2
2015
Q3
2014
Q4
2014
Q1
2015
Q2
2015

© Li-Ning | 2015 | 11
Business Performance
Wholesale Business^
LN Brand , excl. international market sales
Trade Fair Order* (Tag Price) Growth, % YoY
Wholesale business growth driven by trade fair orders^ Wholesale business: Sales to franchised distributors
*Order placed during trade fair (excl. orders from subsidiaries), e.g. 2016Q1 orders were placed almost one year ago
Q3 Q4Q1 Q2
20162014 2015
Mid-teens
Q3 Q4Q1 Q2 Q1
1,559 1,536 1,489
1,8541,604
5,393
4,989
4,552 4,424 4,453
1H2013
2H2013
1H2014
2H2014
1H2015
Revenue(RMB million)
No. of POS (Period End)
8% , YoY
Low-teens
8% , YoY

© Li-Ning | 2015 | 12
Retail Business^
LN Brand
Business Performance Revenue per Selling Area
Retail business continued to improved, in terms of both scale and efficiency
^ Retail business: Sales from direct operation
H12014
H12015
Net Floor Area('000 Square Meter)
Revenue per Selling Area(RMB '000 per Square Meter)
769
888
1,024 1,099
1,239
631
926
1,1191,202
1,292
H12013
H22013
H12014
H22014
H12015
Revenue(RMB million)
No. of POS (Period End)
21%, YoY
~6.9
~7.7
~160
~148
12%21%, YoY

© Li-Ning | 2015 | 13
2014H1
Reported
GP Margin
Cost of
Goods
Increase
2015H1
Reported
GP Margin
+1.3p.p.
Inventory
Provision
Gross Profit Margin Analysis – 2015H1 vs 2014H1Net Change in Major Items
Better inventory management offset production cost impact
44.6%44.9%
Channel
Revenue Mix
+0.6p.p.-1.8p.p.+0.2p.p.
Direct Retail
New Product
Mix

© Li-Ning | 2015 | 14
Profitability Analysis – 2015H1 vs 2014H1Net Change of Major P&L Items
Cost structure healthy and ready for profitability
-RMB Million-
2014H1
Reported
Net Profit
Gross
Profit
Non-operating
Items
2015H1
Reported
Net Profit
Platform
Operation Costs
Interest
&
Tax
+143
+234
+2
-49
+86
-28
+78
(29)
Direct CostOne
Time
Costs^
+108
(586)
+304
-17
Direct
StoresLogistics
Bad Debt
Provision
Other Income
& Other Gains
Advertising
& Promotion
Other
Expenses
(333)
^ One time cost include impairment of available-for-sale financial assets, closure of Flagship stores etc

© Li-Ning | 2015 | 15
6.5
7.57.2
7.8
6.9
Jun2013
Dec2013
Jun2014
Dec2014
Jun2015
Inventory Level(Tag Price)
Turnover Months
100%
37%46% 50%
56%48%
23%15%
21%20%
24%
40% 39%29%
24% 28%
Jun2013
Dec2013
Jun2014
Dec2014
Jun2015
6 months or less (New Product)
7 - 12 months Over 12 Months
Channel Inventory
Improvement driven by strong retail sell-through and better inventory control
© Li-Ning | 2015 | 16
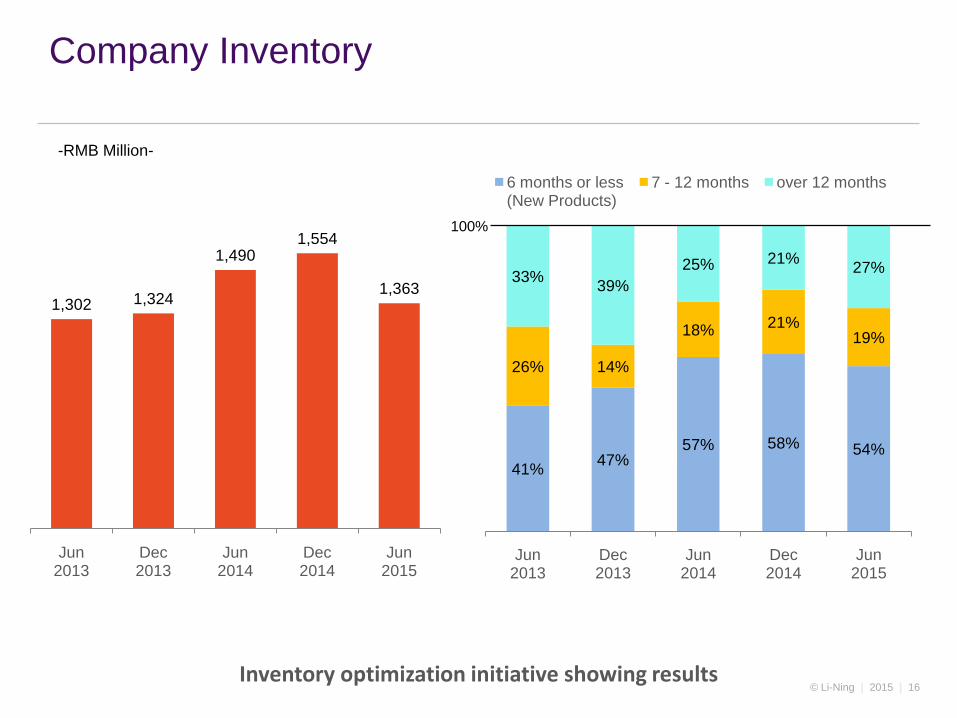
41%47%
57% 58% 54%
26% 14%
18%21%
19%
33%39%
25% 21%27%
Jun2013
Dec2013
Jun2014
Dec2014
Jun2015
6 months or less(New Products)
7 - 12 months over 12 months
100%
1,302 1,324
1,4901,554
1,363
Jun2013
Dec2013
Jun2014
Dec2014
Jun2015
Company Inventory
Inventory optimization initiative showing results
-RMB Million-

© Li-Ning | 2015 | 17
Trade Receivables
100%2,163
1,962 2,001
1,857 1,859
Jun2013
Dec2013
Jun2014
Dec2014
Jun2015
41% 40%49%
44%49%
26%34% 18% 30% 24%
33%26%
33%26% 27%
Jun2013
Dec2013
Jun2014
Dec2014
Jun2015
Below 90 days 91 - 180 days over 180 days
Lower receivables and healthier mix despite revenue growth
-RMB Million-
© Li-Ning | 2015 | 18
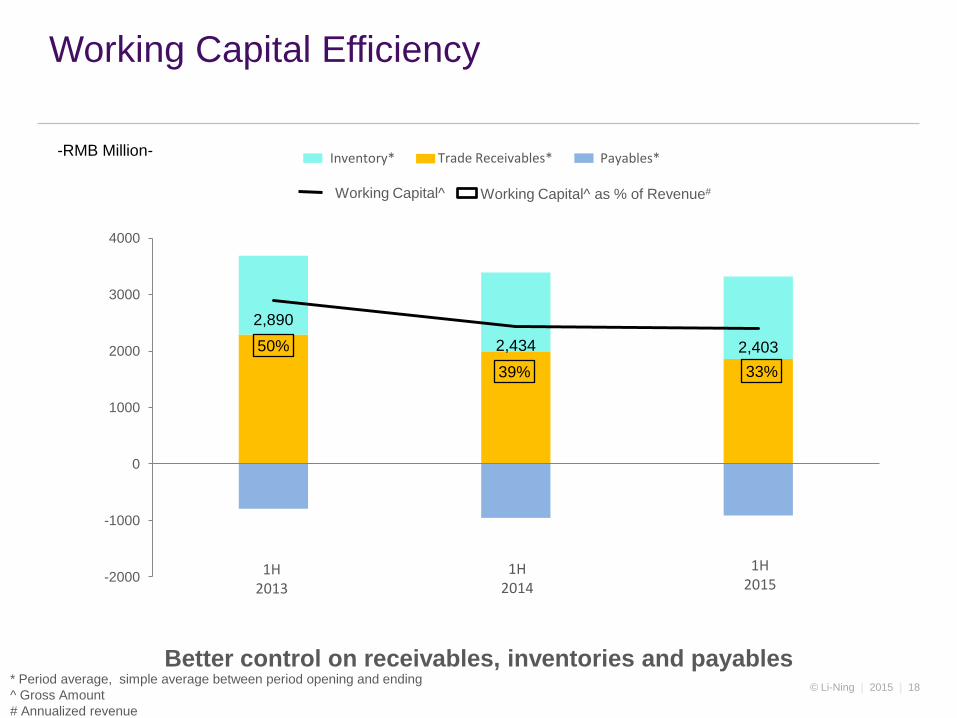
2,890
2,434 2,40350%
39% 33%
-2000
-1000
0
1000
2000
3000
4000
Working Capital Efficiency
* Period average, simple average between period opening and ending
^ Gross Amount
# Annualized revenue
Inventory* Trade Receivables* Payables*
Working Capital^ Working Capital^ as % of Revenue#
Better control on receivables, inventories and payables
-RMB Million-
1H2015
1H2013
1H2014

© Li-Ning | 2015 | 19
Balance sheet summary and cash position
Cash and
Cash Equivalents
Borrowings*
Net Cash / (Debt)^
-RMB Million-
(Post Equity Financing)(Pre Equity Financing)
*Borrowings included Bank Borrowings and Related Parties Loan
^Net Cash / (Debt) = Cash and Cash Equivalents – Borrowings
Operating cash flow turned positive
1,031
997
34
Current Period Operating Cash Flow
909
491
418
Interest-bearing debt-to-equity ratio 55.0% 86.4%
(319) (75)
2014
1H
2014
2H
2015
1H
165
1,757
548
1,209
40.0%

Business Review
© Li-Ning | 2015 | 21
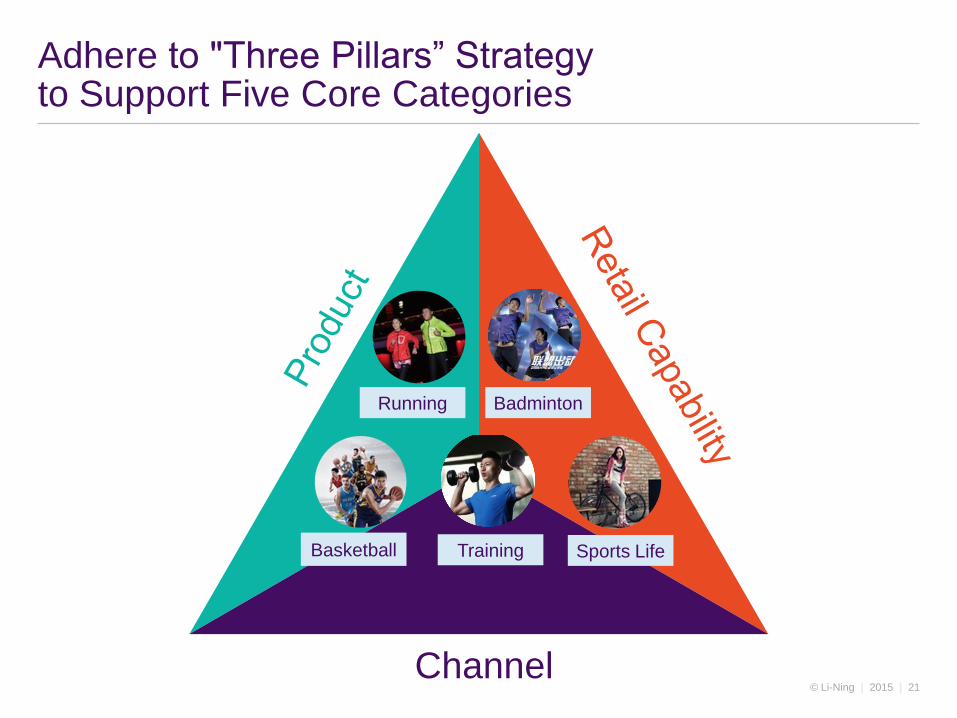
Adhere to "Three Pillars” Strategy to Support Five Core Categories
Badminton
Training
Running
Basketball Sports Life
Channel
© Li-Ning | 2015 | 22
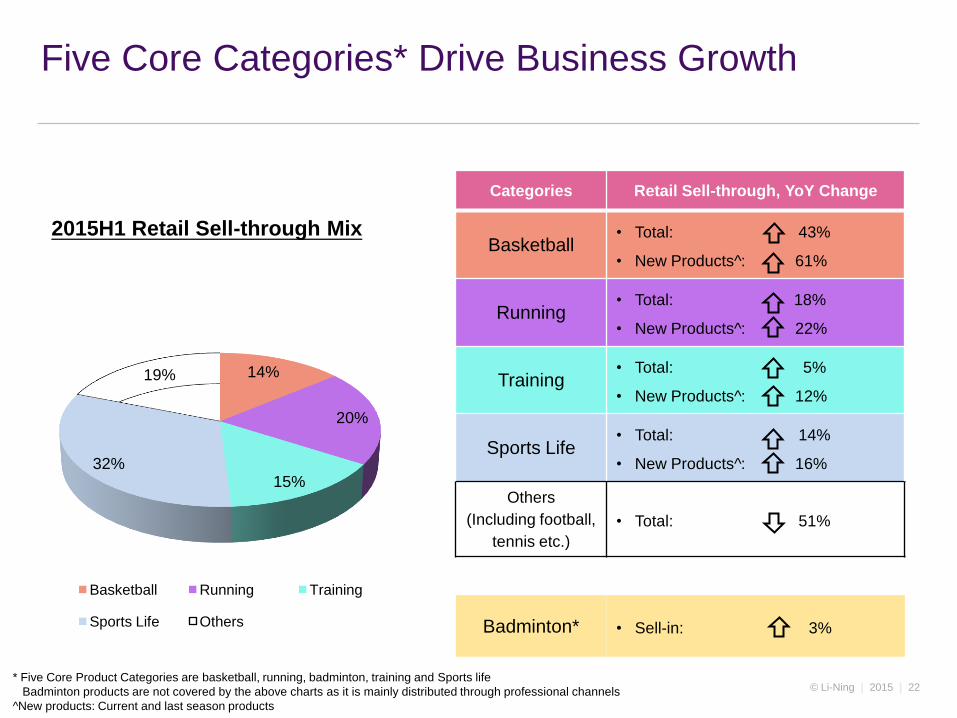
Five Core Categories* Drive Business Growth
14%
20%
15%32%
19%
2015H1 Retail Sell-through Mix
Basketball Running Training
Sports Life Others
* Five Core Product Categories are basketball, running, badminton, training and Sports life
Badminton products are not covered by the above charts as it is mainly distributed through professional channels
^New products: Current and last season products
Categories Retail Sell-through, YoY Change
Basketball• Total: 43%
• New Products^: 61%
Running• Total: 18%
• New Products^: 22%
Training• Total: 5%
• New Products^: 12%
Sports Life• Total: 14%
• New Products^: 16%
Others
(Including football,
tennis etc.)
• Total: 51%
Badminton* • Sell-in: 3%

© Li-Ning | 2015 | 23
Digital Business Induced by Smart Lifestyle
A new “Internet+”digital business model:
Our digital business aims to explore the potential
needs of consumers while incorporating elements of
aesthetic, innovation of material, technology and
craftsmanship to suit professional sports consumers.
We aim to strengthen the Li Ning digital ecosystem
enabling us to become more aligned with the habits
of the Chinese consumer‟s „smart‟ lifestyle
• Partner with Huami (part of Xiaomi ecosystem) to
launch latest smart running shoes
• Two versions of the smart running shoes were
launched in July: “Furious Rider (烈駿)” and
“Rouge Rabbit (赤兔)”
• Sales of the smart running shoes adopted an
“offline experience, online shopping” O2O sales
model for the first time
© Li-Ning | 2015 | 24
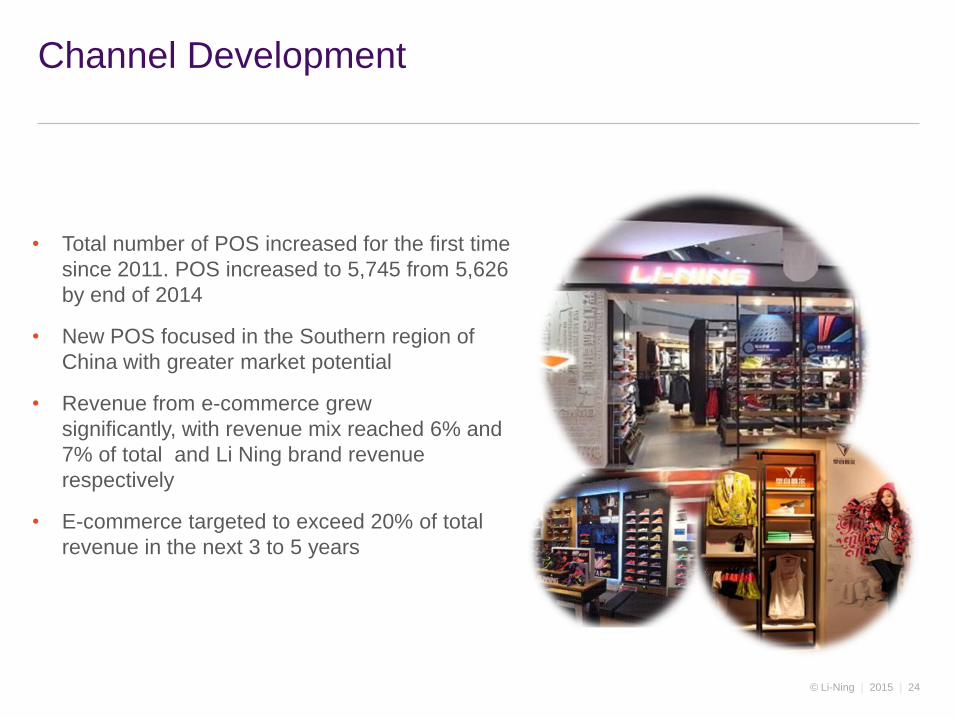
• Total number of POS increased for the first time
since 2011. POS increased to 5,745 from 5,626
by end of 2014
• New POS focused in the Southern region of
China with greater market potential
• Revenue from e-commerce grew
significantly, with revenue mix reached 6% and
7% of total and Li Ning brand revenue
respectively
• E-commerce targeted to exceed 20% of total
revenue in the next 3 to 5 years
Channel Development
© Li-Ning | 2015 | 25
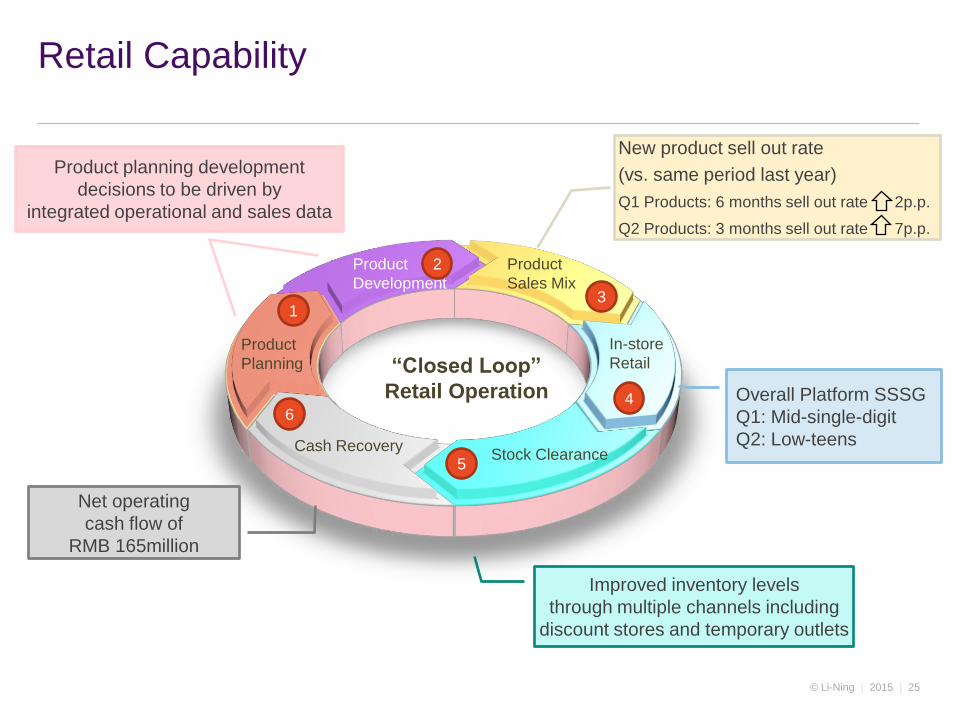
Retail Capability
In-store
Retail
Stock Clearance
Product
Development
Product
Sales Mix
Product
Planning
1
2
3
4
5
6
Cash Recovery
“Closed Loop”
Retail Operation
New product sell out rate
(vs. same period last year)
Q1 Products: 6 months sell out rate 2p.p.
Q2 Products: 3 months sell out rate 7p.p.
Overall Platform SSSG
Q1: Mid-single-digit
Q2: Low-teens
Improved inventory levels
through multiple channels including
discount stores and temporary outlets
Net operating
cash flow of
RMB 165million
Product planning development
decisions to be driven by
integrated operational and sales data
Outlook

© Li-Ning | 2015 | 27
Clear market positioning: Sports Functionality and Sports Life
(Sports Functionality)
• Targets sports enthusiasts and consumer groups who
understand the legacy of Li Ning brand and focus on
sports functionality
• Highlights sport functionality and
professionalism, reflected in product, channel and
consumer interface
• Product categories mainly include
running, basketball, football, badminton, tennis and
table tennis etc.
• Price: low-to-mid range
(Sports Life)
• Focus on young consumers who are trend conscious
• Products will begin launch in 2015H2 and scale up in
2016
• will appear on products and store design
• Price: low range

© Li-Ning | 2015 | 28
• Execute brand strategy
• Sales network expansion driven by market opportunities
• Increase control on operating costs and improve operational efficiency
• Manage inventory levels at a desirable level
• Strengthen cash flow management and lower cost of capital
Confident in back to profitability for FY2015

© Li-Ning | 2015 | 29
25th Anniversary – A New Start

Open Forum

Appendix

© Li-Ning | 2015 | 32
(RMB million)
Summary of Income Statement
(RMB million)
H1
2015
H1
2014 Better/(Worse)
Period ended 30 June
Revenue 3,641 3,137 16%
Gross Profit 1,634 1,400 17%
Distribution costs -1,314 -1,372 4%
Administrative expenses -200 -494 60%
Other income and other gains – net 21 19 11%
Operating (Loss) /Profit 142 -448 N/A
EBITDA 260 -351 N/A
Loss Attributable to Equity Holders -29 -586 95%
Basic Losses per share(RMB cents) -1.55 -37.72 96%
© Li-Ning | 2015 | 33
(RMB million)
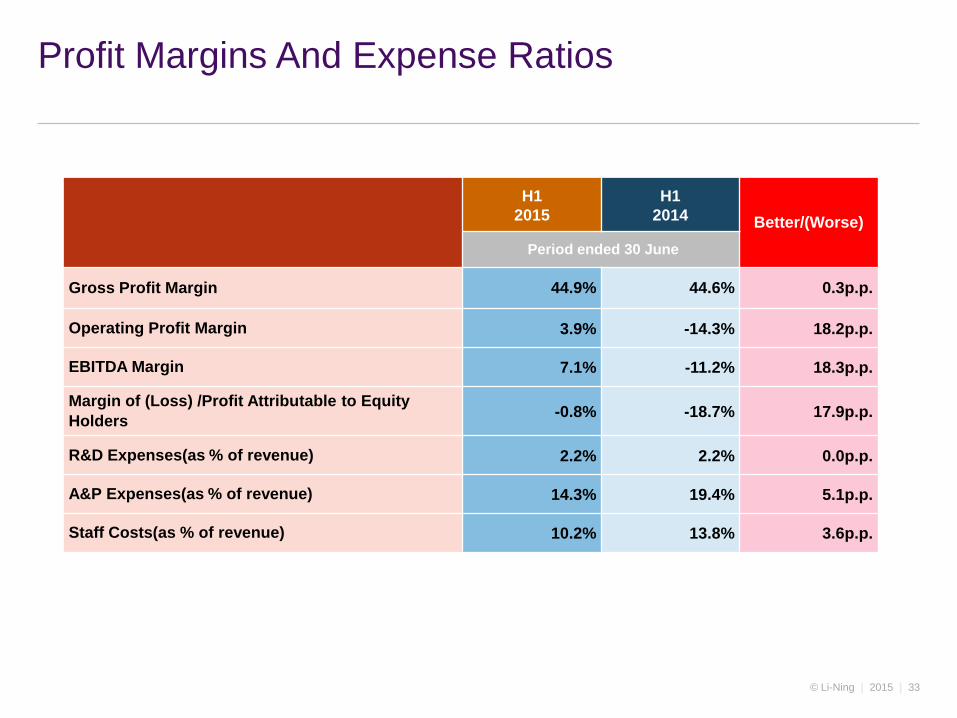
Profit Margins And Expense Ratios
H1
2015
H1
2014 Better/(Worse)
Period ended 30 June
Gross Profit Margin 44.9% 44.6% 0.3p.p.
Operating Profit Margin 3.9% -14.3% 18.2p.p.
EBITDA Margin 7.1% -11.2% 18.3p.p.
Margin of (Loss) /Profit Attributable to Equity
Holders-0.8% -18.7% 17.9p.p.
R&D Expenses(as % of revenue) 2.2% 2.2% 0.0p.p.
A&P Expenses(as % of revenue) 14.3% 19.4% 5.1p.p.
Staff Costs(as % of revenue) 10.2% 13.8% 3.6p.p.

© Li-Ning | 2015 | 34
(RMB million)
Key Operational Indicators
H1
2015
H1
2014 Better/(Worse)
Period ended 30 June
Average Inventory Turnover(Days) 109 106 (3)
Average Trade Receivables Turnover(Days) 64 78 14
Average Trade Payables Turnover(Days) 90 92 (2)
Cash Conversion Cycle(Days) 83 92 9
Return on Equity(ROE) -1.2% -24.3% 23.1p.p.
Return on Asset(ROA) -0.5% -10.0% 9.5p.p.
CAPEX*(RMB million) 142 115 23.5%
*Excluding the acquisition expenditures

© Li-Ning | 2015 | 35
(RMB million)
Summary of Balance Sheet
(RMB Million) 30 Jun 2015 31 Dec 2014 Better/(Worse)
Cash and Cash Equivalents 1,757 1031 70%
Borrowings^ 548 997 45%
Convertible Bonds Liabilities 706 689 (2%)
Net Cash* 1,209 34 3,456%
Current Liabilities 2,042 2,679 24%
Current Ratio(times) 2.2x 1.5x 0.7x
Total Liabilities to Total Assets Ratio 48.8% 64.1% 15.3p.p.
^Borrowings included Bank Borrowings and Related Parties Loan
*Net Cash = Cash and Cash Equivalents – Borrowings