investor presentation...ⓒ fiskars group 2020 may–june 2020 13 transformation program focusing...
TRANSCRIPT

Investor presentation
May 2020

Content
• Fiskars Group in brief• Segments• Financials• Appendices
May–June 2020ⓒ Fiskars Group 2020 2
Fiskars Group in brief
ⓒ Fiskars Group 2020

May–June 2020ⓒ Fiskars Group 2020 4
Our purpose:
Makingthe everyday
extraordinary

Key categories in 2019
May–June 2020ⓒ Fiskars Group 2020 5
Tableware Drinkware Interior Gardening Outdoor Watering
TERRA VITA
Scissors & Creating
Cooking
CREA
NET SALES BY SEGMENT
41% 46%
13%
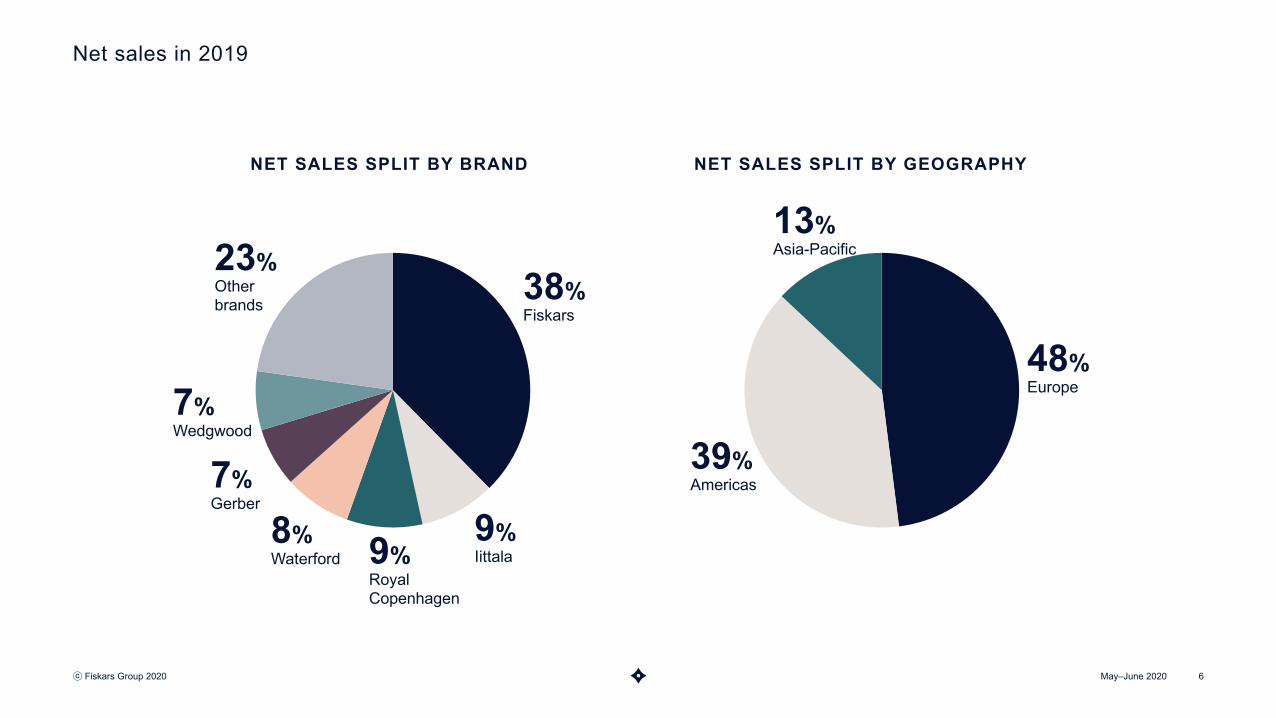
NET SALES SPLIT BY BRAND NET SALES SPLIT BY GEOGRAPHY
ⓒ Fiskars Group 2020 6
Net sales in 2019
May–June 2020
38%Fiskars
9%Iittala9%
Royal Copenhagen
8%Waterford
7%Gerber
7%Wedgwood
23%Other brands
13%Asia-Pacific
39%Americas
48%Europe

Strong brand portfolio
May–June 2020ⓒ Fiskars Group 2020 7
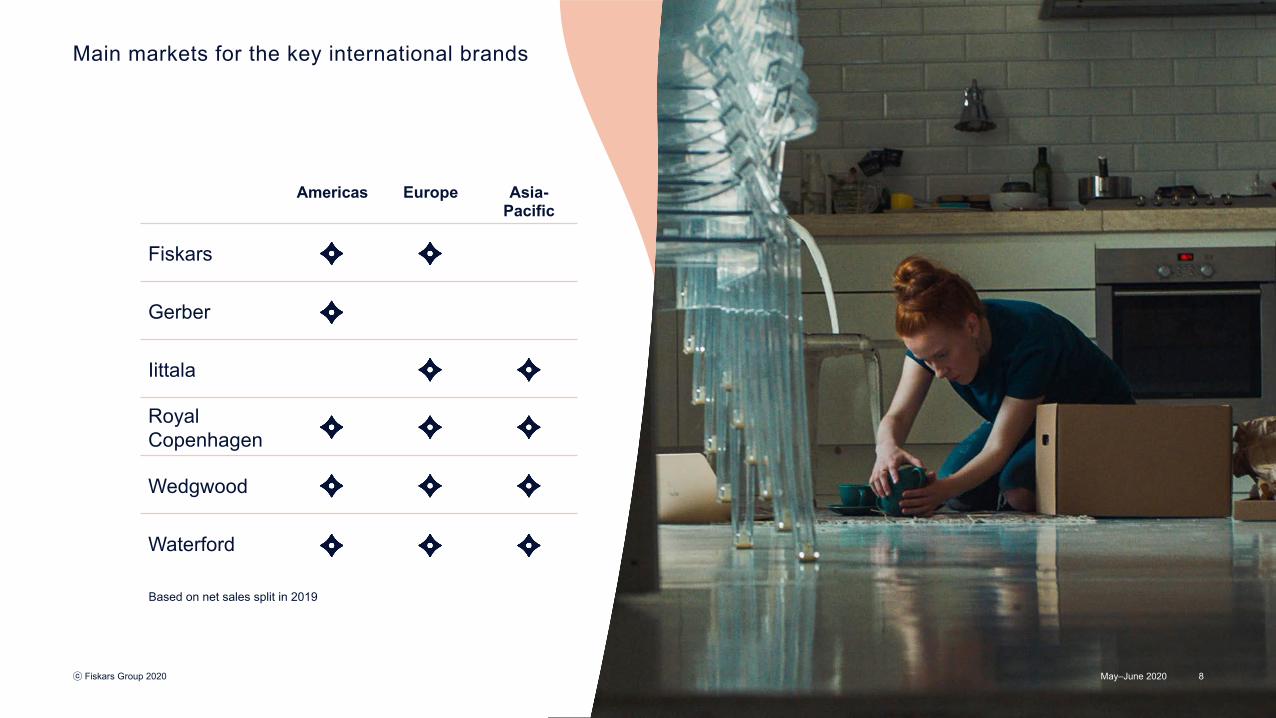
Main markets for the key international brands
May–June 2020ⓒ Fiskars Group 2020
Americas Europe Asia-Pacific
Fiskars
Gerber
Iittala
Royal Copenhagen
Wedgwood
Waterford
Based on net sales split in 2019
8

Our global presence
May–June 2020ⓒ Fiskars Group 2020 9
EMPLOYEES 7,000
PRESENCE IN 30 COUNTRIES
BRANDS AVAILABLE IN MORE
THAN 100 COUNTRIES
MORE THAN 350 STORES

Growing the core
Expanding in China and e-commerce
Exploring services
Strategic priorities
May–June 2020ⓒ Fiskars Group 2020 10
INSPIRING PEOPLE
GROWING BUSINESS
EXCITING CONSUMERS
IMPROVING PERFORMANCE

Our sustainability commitments
CIRCULAR PRODUCTS AND SERVICES
• Design for sustainability
• Create zero waste
• Explore service models
CARBON NEUTRAL BUSINESS
• Improve our energy efficiency
• Invest in renewable energy sources
• Reduce emissions from value chain
May–June 2020ⓒ Fiskars Group 2020 11
POSITIVE IMPACT
• Inspire people through leadership
• Champion safety, diversity and inclusion
• Create positive societal impact

Organizational structure
May–June 2020ⓒ Fiskars Group 2020 12
Supply Chain
Sales
Consumer Experience & Growth
JOHAN HEDBERG
VITA TERRA CREA
Interim CEO SARI POHJONEN
TINA ANDERSSON
RISTO GAGGL
SARI POHJONEN
NIKLAS LINDHOLM
PÄIVI TIMONEN
MAIJA TAIMI
Business Area Business Area Business Area
TUOMAS HYYRYLÄINEN
JAMES BROUILLARD
CHRISTIAN BACHLER
Finance & IT
Human Resources
Legal & Compliance
Communications & Sustainability

Update on programs
May–June 2020ⓒ Fiskars Group 2020 13
Transformation programFocusing on:
• The English & Crystal Living business, to improve its profitability
• Planned actions in retail, distribution and supply network as well as organizational structure
Targeted annual cost savings app. EUR 17 million• Subject to the full implementation of the program
• Targeted cost savings would be achieved gradually, and the majority of the savings are expected to materialize after the program is completed (end of 2021)
Costs of the program app. EUR 40 million in 2018–2021
By the end of 2019, EUR 19.5 million of costs had been booked
Restructuring program Focusing on:
• Looking for synergies and efficiencies in our selling and administrative spending
• Evaluating our entire supply and distribution network for efficiency improvements
Targeted annual cost savings app. EUR 20 million• Subject to the full implementation of the program
• Targeted cost savings would be achieved gradually, and the majority of the savings are expected to materialize after the program is completed (end of 2021)
Costs of the program app. EUR 30 million in 2019–2021
By the end of 2019, EUR 7.0 million of costs had been booked

Segments
May–June 2020ⓒ Fiskars Group 2020 14

Business Area Vita
ⓒ Fiskars Group 2020 15May–June 2020
Tableware Drinkware
Interior
KEY CATEGORIES NET SALES AND COMPARABLE EBITAKEY BRANDS
110.2101.3
117.6
171.6
93.6
2.7 %-0.5 %
8.0 %
15.7 %
-3.8 %
-10%
-5%
0%
5%
10%
15%
20%
25%
30%
0
20
40
60
80
100
120
140
160
180
200
Q1 2019 Q2 2019 Q3 2019 Q4 2019 Q1 2020

Gardening Outdoor
Watering
Business Area Terra
ⓒ Fiskars Group 2020 16May–June 2020
127.5 124.5
95.1 95.7
129.3
17.2 %
9.1 %
0.1 %
2.9 %
15.0 %
0%
5%
10%
15%
20%
25%
0
20
40
60
80
100
120
140
160
Q1 2019 Q2 2019 Q3 2019 Q4 2019 Q1 2020
KEY CATEGORIES NET SALES AND COMPARABLE EBITAKEY BRANDS

Scissors & Creating
Cooking
Business Area Crea
ⓒ Fiskars Group 2020 17May–June 2020
29.9
38.535.0
39.5
32.314.4 %
24.3 %
18.0 %
20.4 %
17.4 %
0%
5%
10%
15%
20%
25%
0
10
20
30
40
50
60
Q1 2019 Q2 2019 Q3 2019 Q4 2019 Q1 2020
KEY CATEGORIES NET SALES AND COMPARABLE EBITAKEY BRANDS

Store evolution – Iittala Vintage
Rolled out in all own Iittala stores in Finland in 2019
Scaling ongoing
Assessing expansion to other countries
ⓒ Fiskars Group 2020
CASE
May–June 2020 18
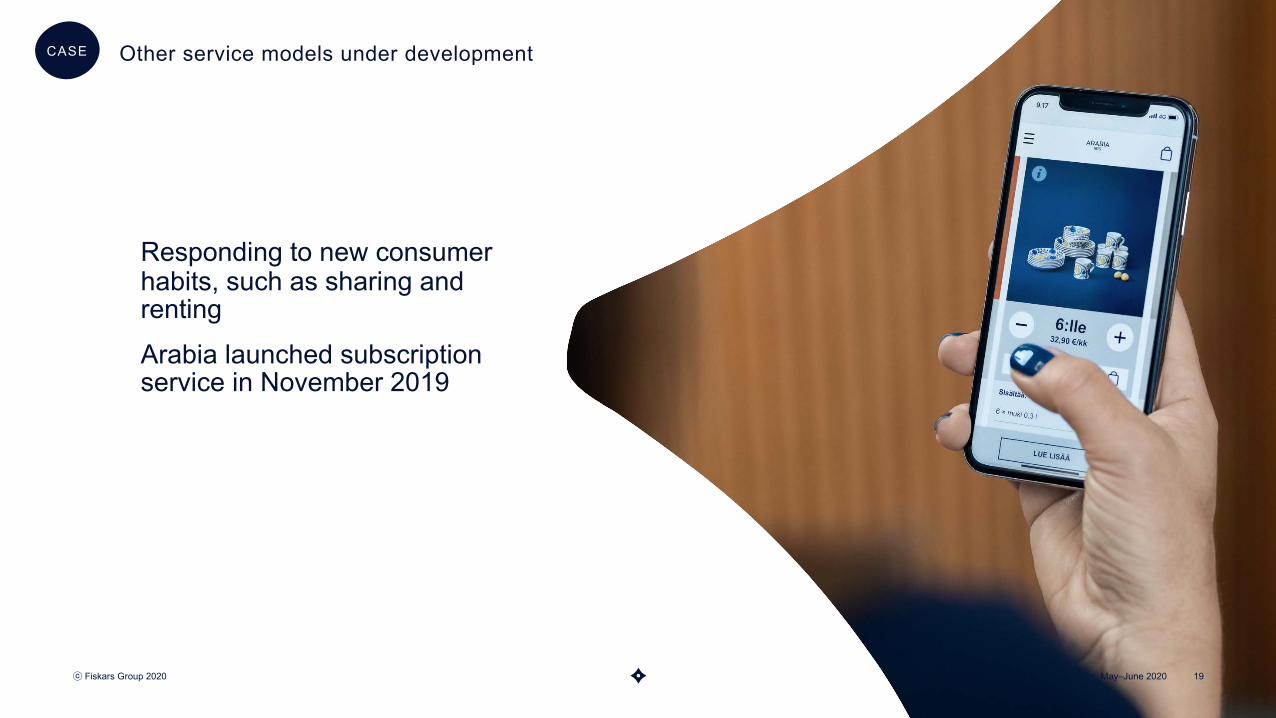
Other service models under development
Responding to new consumer habits, such as sharing and rentingArabia launched subscription service in November 2019
May–June 2020ⓒ Fiskars Group 2020 19
CASE

May–June 2020ⓒ Fiskars Group 2020 20
Brands with own e-commerce

Store network
54 %
46 %
BY BUSINESS
English & Crystal LivingScandinavian Living
33 %
62 %
5 %
BY REGION
EMEA APAC Americas
May–June 2020ⓒ Fiskars Group 2020 21
59 %30 %
11 %
BY TYPE
Concession Outlet Store
A total of 347 own stores at the end of 2018

Financials
ⓒ Fiskars Group 2020

660716 743 748 799 768
1 1071 205 1 186
1 119 1 090
33.5 %35.4 % 35.0 %
36.7 %
40.9 % 41.0 %38.7 %
42.5 % 43.2 % 43.4 %41.0 %
25%
30%
35%
40%
45%
50%
55%
60%
0
200
400
600
800
1 000
1 200
1 400
2009 2010 2011 2012 2013 2014 2015 2016 2017 2018 2019
Group net sales and profitability development
May–June 2020ⓒ Fiskars Group 2020 23
Net sales, EUR million Comparable gross margin Net sales CAGR
+5%

Long-term target to reach a reported EBITA margin of 12%
COMPARABLE EBITA
May–June 2020 24
75.7
107.1119 121.7
90.6
25.918.9
6.8 %
8.9 %
10.0 %10.9 %
8.3 %
9.7 %
7.4 %
0%
2%
4%
6%
8%
10%
12%
14%
0
20
40
60
80
100
120
140
2015 2016 2017 2018 2019 Q1-19 Q1-20
Comparable EBITA, EUR million Comparable EBITA margin

10% 9% 11%16%
12% 11% 9%
9%
3% 4%3%
4%
Q1 Q2 Q3 Q4
Vita Terra Crea
3%-1%
9%
26%21%
11%0%
3%4%
9%6%
8%
Q1 Q2 Q3 Q4
Vita Terra Crea
NET SALES COMPARABLE EBITA
ⓒ Fiskars Group 2020 25
Seasonalities creating balanced income profile
Seasonal distribution by quarter and business area in 2019. Percentages as share of total full year group figures
May–June 2020

ⓒ Fiskars Group 2020 26
SKU reduction ongoing with potential remaining
May–June 2020
0
10 000
20 000
30 000
40 000
50 000
60 000
70 000
80 000
90 000
0
5 000
10 000
15 000
20 000
25 000
30 000
35 000
40 000
45 000
2007 2008 2009 2010 2011 2012 2013 2014 2015 2016 2017 2018 2019Number of Stock Keeping Units Net sales / SKU, EUR
Number of Stock Keeping Units (SKU)
Sales / SKU, EUR
Royal Copenhagen
acquired
Brand portfolio
acquired (incl. Wedgwood and
Waterford)
Nelson and Gilmour acquired
Targeting to reach the previous high in sales / SKU

-36.2
39.1 40.3
77.5
-46.4
48.624.8
103.5
-39.2
42.7 41.1
92.2
-25.8
48.1
10.5
84.7
-37.5
-100
-50
0
50
100
150
200
Q1 16 Q2 16 Q3 16 Q4 16 Q1 17 Q2 17 Q3 17 Q4 17 Q1 18 Q2 18 Q3 18 Q4 18 Q1 19 Q2 19 Q3 19 Q4 19 Q1 20
Quarter Rolling 12 months
ⓒ Fiskars Group 2020 27
Cash flow
Cash flow from operating activities before financial items and taxes EUR million
May–June 2020

28.5
42.837.4 38.8
43.8
59.6
0
10
20
30
40
50
60
70
2014 2015 2016 2017 2018 2019
35.032.4
37.6
32.8
46.2
40.0
4.6 %
2.9 % 3.1 % 2.8 %
4.1 %3.7 %
0%
2%
4%
6%
8%
10%
12%
14%
0
5
10
15
20
25
30
35
40
45
50
2014 2015 2016 2017 2018 2019
Capex as % of sales
DEPRECIATION, AMORTIZATION AND IMPAIRMENT, EUR MILLION
CAPEX, EUR MILLION
ⓒ Fiskars Group 2020 28
Capital expenditure
Depreciation increased as a result of IFRS 16
May–June 2020

152 148 135.4
261.1
321.6 331.3
0
50
100
150
200
250
300
350
2016 2017 2018 2019 Q1-19 Q1-20
69% 69% 70%
56%
65%
51%
12% 12% 11%
34%
26%
44%
0%
10%
20%
30%
40%
50%
60%
70%
80%
0%
10%
20%
30%
40%
50%
60%
70%
80%
2016 2017 2018 2019 Q1-19 Q1-20
Equity ratio Net gearing
NET DEBT, EUR MILLION NET GEARING AND EQUITY RATIO
May–June 2020ⓒ Fiskars Group 2020 29
Solid balance sheet
Excluding IFRS 16-impact and Wärtsilä share distribution:
Equity ratio: 71%Net gearing 12%
Increase in 2019 due to IFRS 16

Long-term financial targets
May–June 2020ⓒ Fiskars Group 2020 30
GROWTH
The average annual net sales growth to exceed 5%, through a combination of organic growth and targeted acquisitions
PROFITABILITY
EBITA margin to reach 12%
CAPITAL STRUCTURE
Net gearing* below 100%
DIVIDEND
Fiskars aims to distribute a stable, over time increasing dividend, to be paid biannually
EUR 0.56 per share, paid in two installments of 0.28 each-2.5% YoY
-3.9% YoY (comparable)6.7% 8.3% (comparable)
34%2019
**Net gearing ratio is the ratio of interest-bearing debt, less interest-bearing receivables and cash and bank equivalents, divided by total equity

Wärtsilä share distribution changed the baseline for dividend growth
ⓒ Fiskars Group 2020 31May–June 2020
0.00
0.20
0.40
0.60
0.80
1.00
1.20
1.40
1.60
2009 2010 2011 2012 2013 2014 2015 2016 2017 2018 2019
Dividend per share (DPS) history 2009–2019EUR
Extra DividendBase Dividend
0.71
0.35
First dividendSecond dividend
0.520.60
1.30
0.62
0.750.65
2.60
0.67 0.68 0.70 0.72
0.36
0.27
0.27
Wärtsilä share distribution
0.36
0.54
5.31
0.28
0.28
0.56

Appendices
May–June 2020ⓒ Fiskars Group 2020 32

Largest shareholders as of April 30, 2020
ⓒ Fiskars Group 2020 33
# Shareholder name Number of shares % of shares and votes1 Virala Oy Ab 12,650,000 15.44
2 Turret Oy Ab 10,930,961 13.35
3 Holdix Oy Ab 10,165,537 12.41
4 Bergsrådinnan Sophie von Julins Foundation 2,556,000 3.12
5 Oy Julius Tallberg Ab 2,554,350 3.12
6 Varma Mutual Pension Insurance Company 2,469,326 3.01
7 Gripenberg Gerda Margareta Lindsay Dödsbo 1,982,000 2.42
8 von Julin Sofia Margareta dödsbo 1,560,000 1.90
9 Ilmarinen Mutual Pension Insurance Company 1,105,442 1.35
10 Wrede Anna 928,684 1.13
10 largest shareholders, total 46,902,300 57.26Other shareholders 35,002,942 42.74Total 81,905,242 100.00
Data supplied by Euroland
May–June 2020

Shareholder structure as of April 30, 2020
May–June 2020 34
Data supplied by Euroland
Sector Number of shareholders
% of total shareholders
Number of shares
% of shares and votes
Private companies 700 2.8% 28,412,377 34.7%Households 24,096 95.6% 28,096,117 34.3%Financial and insurance institutions 36 0.1% 121,07,697 14.8%Public sector and non-profit organizations 231 0.9% 9,731,679 11.9%Nominee registered and non-Finnish holders 133 0.5% 3,557,372 4.3%
Total 81,905,242 100.00
34.7%
34.3%
14.8%
11.9%4.3%
Private companies
Households
Financial and insuranceinstitutionsPublic sector and non-profitorganizationsNominee registered and non-Finnish holders

Fiskars Group Leadership Team
May–June 2020ⓒ Fiskars Group 2020 35
SARI POHJONEN
Interim CEO & Chief Financial Officer
TINA ANDERSSON
Chief Consumer OfficerCHRISTIAN BACHLER
Executive Vice President,BA Vita
TUOMAS HYYRYLÄINEN
Executive Vice President,BA Crea
NIKLAS LINDHOLM
Chief People OfficerMAIJA TAIMI
Chief Communications Officer
PÄIVI TIMONEN
Chief Legal Officer
JAMES BROUILLARD
Executive Vice President,BA Terra
JOHAN HEDBERG
Chief Sales Officer
RISTO GAGGL
Chief Supply Chain Officer

Board of Directors
May–June 2020ⓒ Fiskars Group 2020 36
PAUL EHRNROOTH
Chairman
JYRI LUOMAKOSKI
Vice Chairman
ALBERT EHRNROOTH
LOUISE FROMOND
INKA MERO
FABIAN MÅNSSON
PETER SJÖLANDER
RITVA SOTAMAA
NATHALIE AHLSTRÖM

Disclaimer
May–June 2020ⓒ Fiskars Group 2020 37
This presentation contains forward-looking statements that reflect management’s current views with respect to certain future events and potential financial performance. Although Fiskars believes that the expectations reflected in such forward-looking statements are reasonable, no assurance can be given that such expectations will prove to have been correct. Accordingly, results could differ materially from those set out in the forward-looking statements as a result of various factors.
Important factors that may cause such a difference for Fiskars include, but are not limited to: (i) the macroeconomic development and consumer confidence in the key markets, (ii) change in the competitive climate, (iii) change in the regulatory environment and other government actions, (iv) change in interest rate and foreign exchange rate levels, and (v) internal operating factors.
This presentation does not imply that Fiskars has undertaken to revise these forward-looking statements, beyond what is required by applicable law or applicable stock exchange regulations if and when circumstances arise that will lead to changes compared to the date when these statements were provided.

May–June 2020ⓒ Fiskars Group 2020 38
Makingthe everyday
extraordinary