investor financial supplement...axis capital holdings limited basis of presentation all financial...
TRANSCRIPT
INVESTOR FINANCIAL SUPPLEMENT
THIRD QUARTER 2008
AXIS Capital Holdings Limited

AXIS Capital Holdings Limited92 Pitts Bay RoadPembroke HM 08 Bermuda
Contact Information:Linda Ventresca Investor Relations441 405 [email protected]
Website Information:www.axiscapital.com
This report is for informational purposes only. It should be read in conjunctionwith the documents that we file with the Securities and Exchange Commissionpursuant to the Securities Act of 1933 and the Securities Exchange Act of 1934.

Page(s)i. Basis of Presentation i - iiiI. Financial Highlights 1II. Income Statements
a. Consolidated Statements of Income - Quarterly 2b. Consolidated Statements of Income - YTD 3c. Consolidated Segment Data 4d. Gross Premium Written by Segment by Line of Business 5e. Segment Consecutive Quarters 6-7
III. Balance Sheetsa. Consolidated Balance Sheets 8b. Summary Investment Portfolio Information 9c. Investment Portfolio Composition - Quarterly 10d. Investment Portfolio: Mortgage and Asset Backed Securities 11e. Investment Portfolio: Subprime and Alternative-A Holdings in Direct Investment Portfolio 12f. Investment Portfolio: Largest Ten Corporate Holdings 13g. Investment Portfolio: Financial Issuer Exposure in Fixed Maturity Portfolio 14h. Net Realized and Net Unrealized Investments Gains (Losses) 15i. Reinsurance Recoverable Analysis 16-17
IV. Loss Reserve Analysisa. Paid to Incurred Analysis 18b. Paid to Incurred Analysis by Segment 19c. Segment Consecutive Quarters 20-21d. Third Quarter 2008 Impact of Hurricanes Gustav and Ike 22
V. Share Analysisa. Earnings Per Common Share Analysis - As Reported 23b. Earnings Per Common Share Analysis and Common Share Rollforward- Quarterly 24c. Diluted Book Value Per Common Share Analysis 25
AXIS Capital Holdings LimitedFINANCIAL SUPPLEMENT TABLE OF CONTENTS
DEFINITIONS AND PRESENTATION
Cautionary Note Regarding Forward-Looking Statements:
Unless otherwise noted, all data is in thousands, except for per share amounts and ratio information. Amounts may not reconcile exactly due to small rounding differences.NM - Not meaningful; NR - Not Reported; NA - Not applicable
This financial supplement may contain forward-looking statements which involve inherent risks and uncertainties. Statements that are not historical facts, including statements about our beliefs, plans or expectations, are forward-looking statements. These statements are based on current plans, estimates and expectations. Actual results may differ materially from those included in such forward-looking statements and therefore you should not place undue reliance on them. A non-exclusive list of other important factors that could cause actual results to differ materially from those in such forward-looking statements is set forth in our most recent annual report on Form 10-K, quarterly report on Form 10-Q and our other documents on file with the Securities and Exchange Commission. AXIS undertakes no obligation to publicly update or revise any forward-looking statement, whether as a result of new information, future developments or otherwise.
AXIS Capital Holdings LimitedBASIS OF PRESENTATION
All financial information contained herein is unaudited, except for the consolidated balance sheet and statement of income at and for the year ended December 31, 2007.
i

AXIS Capital Holdings LimitedBASIS OF PRESENTATION
BUSINESS DESCRIPTIONS
INSURANCE SEGMENT
Our insurance segment provides insurance coverage on a worldwide basis. The following are the lines of business in our insurance segment
Property : provides physical damage and business interruption coverage primarily for industrial and commercial properties and physical damage, business interruption and liability coverage for onshore energy properties and operations. The book consists of both primary and excess risks, some of which are catastrophe-exposed.
Marine: provides coverage for hull, liability, cargo and specie and recreational marine risks. These risks include property damage or physical loss to ships, pollution damage caused by vessels on a sudden and accidental basis, protection for general cargo and the contents of armored cars, vaults, exhibitions and museums, and specific war related risks. This line of business also provides physical damage, business interruption and liability coverage for offshore energy property and operations.
Terrorism: provides coverage for physical damage and business interruption of an insured following an act of terrorism.
Aviation: includes hull and liability and specific war coverage for passenger and cargo airlines and privately owned aircraft as well as select aviation product liability coverage.
Political risk: provides protection against sovereign default or sovereign actions that result in the impairment of cross-border investments for banks and major corporations. This book also provides sovereign and corporate credit insurance, where lenders seek to mitigate the risk of non-payment from their borrowers.
This line of business covers a range of perils that can affect foreign direct investments and assets, project finance, export or import transactions or cross-border financings to private or sovereign borrowers for working capital, trade-related or capital market borrowings. Typical insured risks include confiscation, expropriation, nationalization; currency inconvertibility and non-transfer; terrorism, sabotage, war, insurrection, rebellion; government act, law order or decree; contract frustration, non-performance or payment default, and wrongful calling of contract guarantees and bonds. Coverages are tailored to the insured's requirements for a broad range of overseas exposures, including equity investments, physical assets, cross-border loans or contracts for goods and services.
Professional lines: includes coverage for directors’ and officers’ liability, errors and omissions liability, employment practices liability, media, cyber, technology and miscellaneous professional liability coverage.
Liability: primarily targets general liability and umbrella and excess liability in the U.S. excess and surplus lines markets. Target classes include mercantile, manufacturingand building/premises, with particular emphasis on commercial and consumer products, commercial construction and miscellaneous general liability.
Other: primarily includes employee medical coverage for self-insured, small and medium sized employers for losses in excess of a retention.
ii

AXIS Capital Holdings LimitedBASIS OF PRESENTATION
BUSINESS DESCRIPTIONS (CONTINUED)
REINSURANCE SEGMENT
Our reinsurance segment provides property and casualty reinsurance to insurance companies on a worldwide basis. The following are the lines of business we write on both a treaty and facultative basis:Catastrophe: provides protection for most catastrophic losses that are covered in the underlying insurance policies written by our ceding company clients. The exposure in the underlying policies is principally property exposure but also covers other exposures including workers compensation, personal accident and life. The principal perils in this portfolio are hurricane and windstorm, earthquake, flood, tornado, hail and fire. In some instances, terrorism may be a covered peril or the only peril. We underwrite catastrophe reinsurance principally on an excess of loss basis, meaning that our exposure only arises when our customers’ claims exceed a certain retained amount.
Property: includes reinsurance written on both a pro rata and a per risk basis and covers underlying personal lines and commercial property exposures. Property pro rata treaty reinsurance covers a cedent’s aggregate losses from all events in the covered period on a proportional basis. Property per risk treaty reinsurance reinsures a portfolio of particular property risks of ceding companies on an excess of loss basis.Professional Liability: covers directors’ and officers’ liability, employment practices liability, medical malpractice and miscellaneous errors and omissions insurance risks.Credit and Bond: consists principally of reinsurance of trade credit insurance products and includes both proportional and excess-of loss structures. The underlying insurance indemnifies sellers of goods and services against a payment default by the buyer of those goods and services. Also included in this book is coverage for ceding insurers against losses arising from a broad array of surety bonds issued by bond insurers principally to satisfy regulatory demands in a variety of jurisdictions around the world, but predominantly in Europe.
Motor: provides coverage to insurers for motor liability losses arising out of any one occurrence. The occurrence can involve one or many claimants where the ceding insurer aggregates the claims from the occurrence.
Liability: provides coverage to insurers of standard casualty lines, including auto liability, general liability, personal and commercial umbrella and workers’ compensation.
Engineering: provides coverage for all types of civil construction risks and risks associated with erection, testing and commissioning of machinery and plants during the construction stage. This line of business also includes operational risks for machinery, plant and equipment, electronic equipment and business interruption. We write engineering business on a proportional and non-proportional treaty basis as well as on a facultative basis.
Other: includes aviation, marine, personal accident and crop reinsurance.
iii

2008 2007 Change 2008 2007 Change
HIGHLIGHTS Gross premiums written 725,283$ 755,224$ (4.0)% 2,863,633$ 3,017,225$ (5.1)%Gross premiums written - Insurance 55.5% 63.7% (8.1)% 48.6% 50.7% (2.1)%Gross premiums written - Reinsurance 44.5% 36.3% 8.1% 51.4% 49.3% 2.1%Net premiums written 551,416$ 583,902$ (5.6)% 2,327,407$ 2,478,602$ (6.1)%
Net premiums earned 689,970$ 685,845$ 0.6% 2,028,895$ 2,065,090$ (1.8)%Net premiums earned - Insurance 42.5% 44.0% (1.5)% 43.9% 44.3% (0.4)%Net premiums earned - Reinsurance 57.5% 56.0% 1.5% 56.1% 55.7% 0.4%Net (loss) income available to common shareholders (249,346)$ 269,975$ (192.4)% 219,643$ 749,143$ (70.7)%Reserve for losses and loss expenses 6,406,204 5,531,379 15.8% 6,406,204 5,531,379 15.8%Total shareholders' equity 4,601,190 4,943,592 (6.9)% 4,601,190 4,943,592 (6.9)%
PER COMMON SHARE AND COMMON SHARE DATA Basic earnings per common share ($1.79) $1.84 (197.3)% $1.55 $5.04 (69.2)%
Diluted earnings per common share ($1.79) $1.65 (208.8)% $1.40 $4.53 (69.2)%Weighted average common shares outstanding 139,335 146,845 (5.1)% 141,628 148,753 (4.8)%Diluted weighted average common shares outstanding 139,335 164,064 (15.1)% 157,315 165,458 (4.9)%Book value per common share $29.72 $30.50 (2.5)% $29.72 $30.50 (2.5)%Accumulated dividends paid per common share $2.72 $2.19 24.2% $2.72 $2.19 24.2%Diluted book value per common share (treasury stock method) [a] $26.25 $26.93 (2.5)% $26.25 $26.93 (2.5)%
FINANCIAL RATIOS ROACE [b] (22.5)% 25.0% (47.5)% 6.7% 23.9% (17.2)%
Net loss and loss expense ratio 102.3% 47.9% 54.4% 70.9% 52.3% 18.6%Acquisition cost ratio 13.1% 14.6% (1.5)% 13.9% 14.2% (0.3)%General and administrative expense ratio 12.6% 11.6% 0.9% 12.2% 10.2% 2.0%
Combined ratio 128.0% 74.1% 53.9% 97.0% 76.7% 20.3%
INVESTMENT DATA Total assets 15,175,454$ 14,711,904$ 3.2% 15,175,454$ 14,711,904$ 3.2%Total cash and investments [c] 10,645,111 10,285,370 3.5% 10,645,111 10,285,370 3.5%Net investment income 50,583 118,908 (57.5)% 273,249 357,873 (23.6)%Net realized investment losses (89,079) (1,192) nm (51,842) (5,548) nmTotal return on cash and investments [d] (3.6)% 1.9% (5.5)% (2.8)% 3.6% (6.4)%Annualized effective yield of invested assets [e] 4.8% 5.0% (0.2)% 4.8% 5.0% (0.2)%
[a] To conform with our current period presentation, we have recalculated the diluted book value per common share for the third quarter of 2007 using the “treasury stock” method.[b] Return on average common equity ("ROACE") is calculated by dividing net income available to common shareholders for the period by the average common shareholders' equity determined by using the common shareholders' equity balances at the beginning and end of the period. Percentages presented are annualized for the respective quarters.[c] Cash and investments represents the total cash, available for sale investments, other investments, accrued interest receivable and net receivable (payable) for investments sold (purchased).[d] In calculating total return, we include net investment income, net realized investment gains (losses) and the change in unrealized gains (losses) generated by our average cash and investment balances.[e] Annualized effective yield of invested assets is calculated by dividing the net income generated from invested assets by the average balance of the assets managed by our external investment managers.
AXIS Capital Holdings LimitedFINANCIAL HIGHLIGHTS
Quarter endedSeptember 30,
Nine months endedSeptember 30,
1
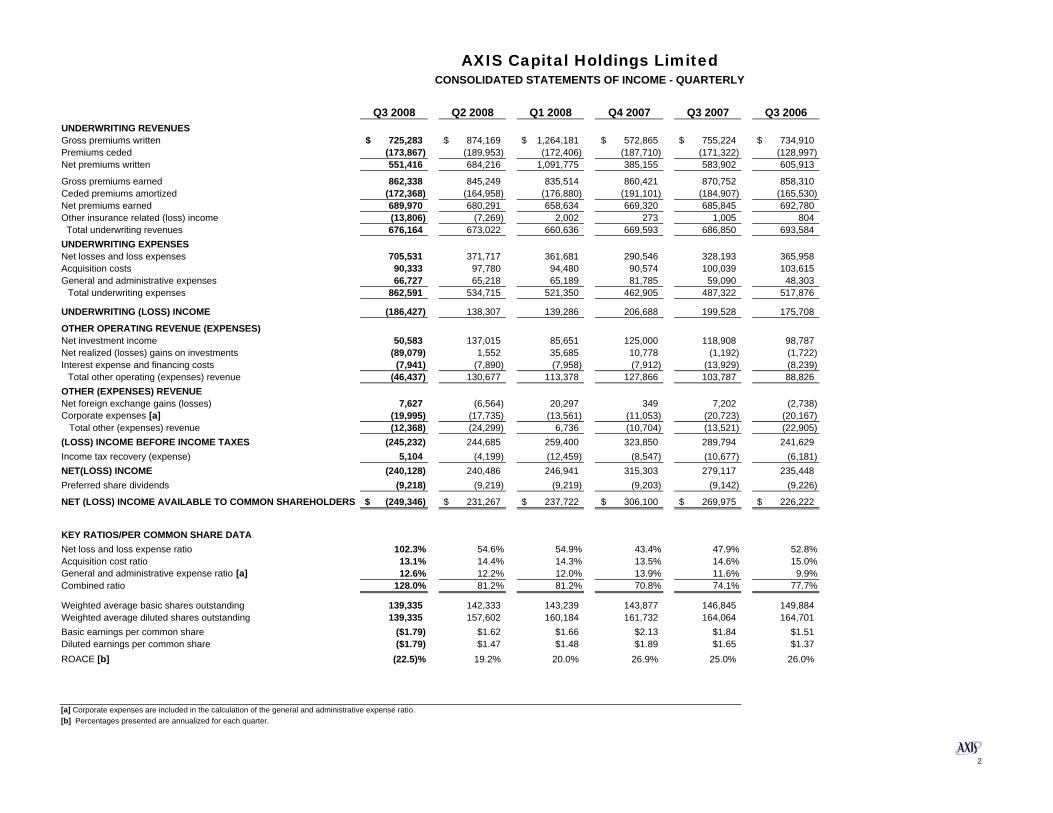
Q3 2008 Q2 2008 Q1 2008 Q4 2007 Q3 2007 Q3 2006UNDERWRITING REVENUESGross premiums written 725,283$ 874,169$ 1,264,181$ 572,865$ 755,224$ 734,910$ Premiums ceded (173,867) (189,953) (172,406) (187,710) (171,322) (128,997)Net premiums written 551,416 684,216 1,091,775 385,155 583,902 605,913
Gross premiums earned 862,338 845,249 835,514 860,421 870,752 858,310 Ceded premiums amortized (172,368) (164,958) (176,880) (191,101) (184,907) (165,530) Net premiums earned 689,970 680,291 658,634 669,320 685,845 692,780 Other insurance related (loss) income (13,806) (7,269) 2,002 273 1,005 804 Total underwriting revenues 676,164 673,022 660,636 669,593 686,850 693,584 UNDERWRITING EXPENSESNet losses and loss expenses 705,531 371,717 361,681 290,546 328,193 365,958 Acquisition costs 90,333 97,780 94,480 90,574 100,039 103,615 General and administrative expenses 66,727 65,218 65,189 81,785 59,090 48,303
Total underwriting expenses 862,591 534,715 521,350 462,905 487,322 517,876
UNDERWRITING (LOSS) INCOME (186,427) 138,307 139,286 206,688 199,528 175,708
OTHER OPERATING REVENUE (EXPENSES)Net investment income 50,583 137,015 85,651 125,000 118,908 98,787 Net realized (losses) gains on investments (89,079) 1,552 35,685 10,778 (1,192) (1,722) Interest expense and financing costs (7,941) (7,890) (7,958) (7,912) (13,929) (8,239)
Total other operating (expenses) revenue (46,437) 130,677 113,378 127,866 103,787 88,826 OTHER (EXPENSES) REVENUE Net foreign exchange gains (losses) 7,627 (6,564) 20,297 349 7,202 (2,738) Corporate expenses [a] (19,995) (17,735) (13,561) (11,053) (20,723) (20,167) Total other (expenses) revenue (12,368) (24,299) 6,736 (10,704) (13,521) (22,905) (LOSS) INCOME BEFORE INCOME TAXES (245,232) 244,685 259,400 323,850 289,794 241,629 Income tax recovery (expense) 5,104 (4,199) (12,459) (8,547) (10,677) (6,181) NET(LOSS) INCOME (240,128) 240,486 246,941 315,303 279,117 235,448 Preferred share dividends (9,218) (9,219) (9,219) (9,203) (9,142) (9,226)
NET (LOSS) INCOME AVAILABLE TO COMMON SHAREHOLDERS (249,346)$ 231,267$ 237,722$ 306,100$ 269,975$ 226,222$
KEY RATIOS/PER COMMON SHARE DATANet loss and loss expense ratio 102.3% 54.6% 54.9% 43.4% 47.9% 52.8%Acquisition cost ratio 13.1% 14.4% 14.3% 13.5% 14.6% 15.0%General and administrative expense ratio [a] 12.6% 12.2% 12.0% 13.9% 11.6% 9.9%Combined ratio 128.0% 81.2% 81.2% 70.8% 74.1% 77.7%
Weighted average basic shares outstanding 139,335 142,333 143,239 143,877 146,845 149,884 Weighted average diluted shares outstanding 139,335 157,602 160,184 161,732 164,064 164,701 Basic earnings per common share ($1.79) $1.62 $1.66 $2.13 $1.84 $1.51Diluted earnings per common share ($1.79) $1.47 $1.48 $1.89 $1.65 $1.37ROACE [b] (22.5)% 19.2% 20.0% 26.9% 25.0% 26.0%
[a] Corporate expenses are included in the calculation of the general and administrative expense ratio.[b] Percentages presented are annualized for each quarter.
AXIS Capital Holdings LimitedCONSOLIDATED STATEMENTS OF INCOME - QUARTERLY
2
Nine months ended Year ended September 30, 2008 September 30, 2007 September 30, 2006 December 31, 2007 December 31, 2006
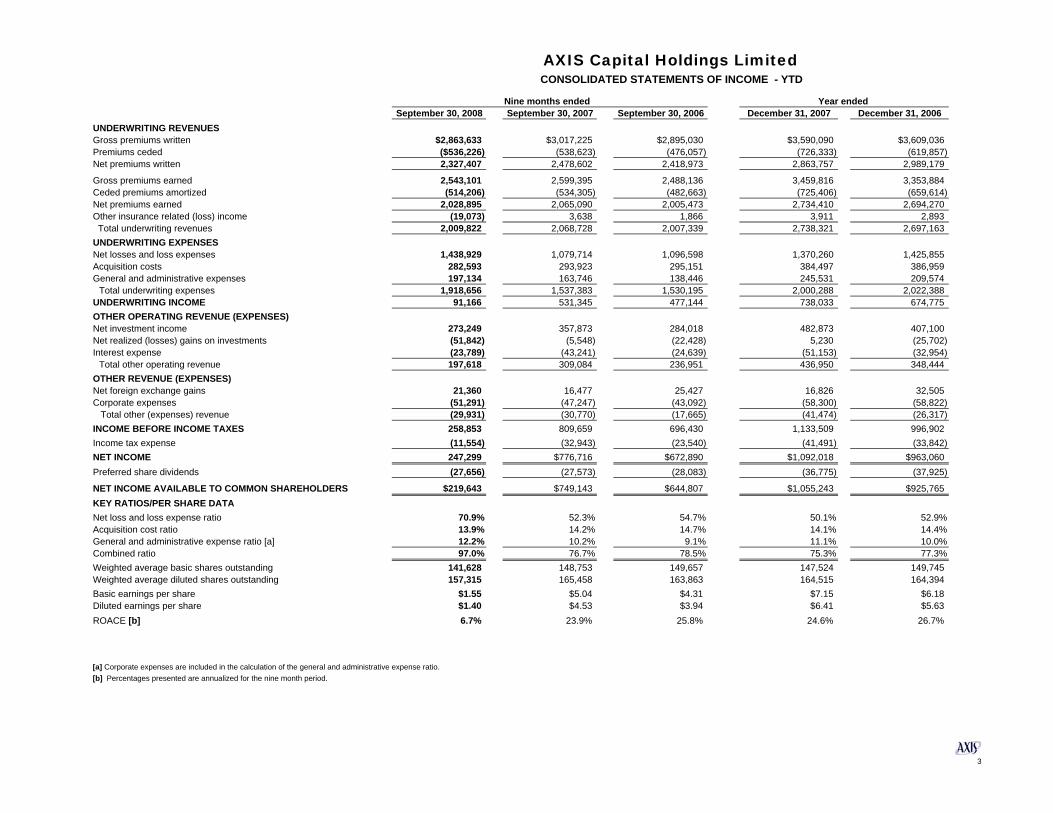
UNDERWRITING REVENUESGross premiums written $2,863,633 $3,017,225 $2,895,030 $3,590,090 $3,609,036Premiums ceded ($536,226) (538,623) (476,057) (726,333) (619,857) Net premiums written 2,327,407 2,478,602 2,418,973 2,863,757 2,989,179
Gross premiums earned 2,543,101 2,599,395 2,488,136 3,459,816 3,353,884 Ceded premiums amortized (514,206) (534,305) (482,663) (725,406) (659,614) Net premiums earned 2,028,895 2,065,090 2,005,473 2,734,410 2,694,270 Other insurance related (loss) income (19,073) 3,638 1,866 3,911 2,893 Total underwriting revenues 2,009,822 2,068,728 2,007,339 2,738,321 2,697,163 UNDERWRITING EXPENSESNet losses and loss expenses 1,438,929 1,079,714 1,096,598 1,370,260 1,425,855 Acquisition costs 282,593 293,923 295,151 384,497 386,959General and administrative expenses 197,134 163,746 138,446 245,531 209,574
Total underwriting expenses 1,918,656 1,537,383 1,530,195 2,000,288 2,022,388UNDERWRITING INCOME 91,166 531,345 477,144 738,033 674,775OTHER OPERATING REVENUE (EXPENSES)Net investment income 273,249 357,873 284,018 482,873 407,100 Net realized (losses) gains on investments (51,842) (5,548) (22,428) 5,230 (25,702)Interest expense (23,789) (43,241) (24,639) (51,153) (32,954)
Total other operating revenue 197,618 309,084 236,951 436,950 348,444OTHER REVENUE (EXPENSES) Net foreign exchange gains 21,360 16,477 25,427 16,826 32,505 Corporate expenses (51,291) (47,247) (43,092) (58,300) (58,822) Total other (expenses) revenue (29,931) (30,770) (17,665) (41,474) (26,317) INCOME BEFORE INCOME TAXES 258,853 809,659 696,430 1,133,509 996,902 Income tax expense (11,554) (32,943) (23,540) (41,491) (33,842) NET INCOME 247,299 $776,716 $672,890 $1,092,018 $963,060Preferred share dividends (27,656) (27,573) (28,083) (36,775) (37,925)
NET INCOME AVAILABLE TO COMMON SHAREHOLDERS $219,643 $749,143 $644,807 $1,055,243 $925,765KEY RATIOS/PER SHARE DATANet loss and loss expense ratio 70.9% 52.3% 54.7% 50.1% 52.9%Acquisition cost ratio 13.9% 14.2% 14.7% 14.1% 14.4%General and administrative expense ratio [a] 12.2% 10.2% 9.1% 11.1% 10.0%Combined ratio 97.0% 76.7% 78.5% 75.3% 77.3%Weighted average basic shares outstanding 141,628 148,753 149,657 147,524 149,745 Weighted average diluted shares outstanding 157,315 165,458 163,863 164,515 164,394 Basic earnings per share $1.55 $5.04 $4.31 $7.15 $6.18Diluted earnings per share $1.40 $4.53 $3.94 $6.41 $5.63 ROACE [b] 6.7% 23.9% 25.8% 24.6% 26.7%
[a] Corporate expenses are included in the calculation of the general and administrative expense ratio.[b] Percentages presented are annualized for the nine month period.
AXIS Capital Holdings LimitedCONSOLIDATED STATEMENTS OF INCOME - YTD
3
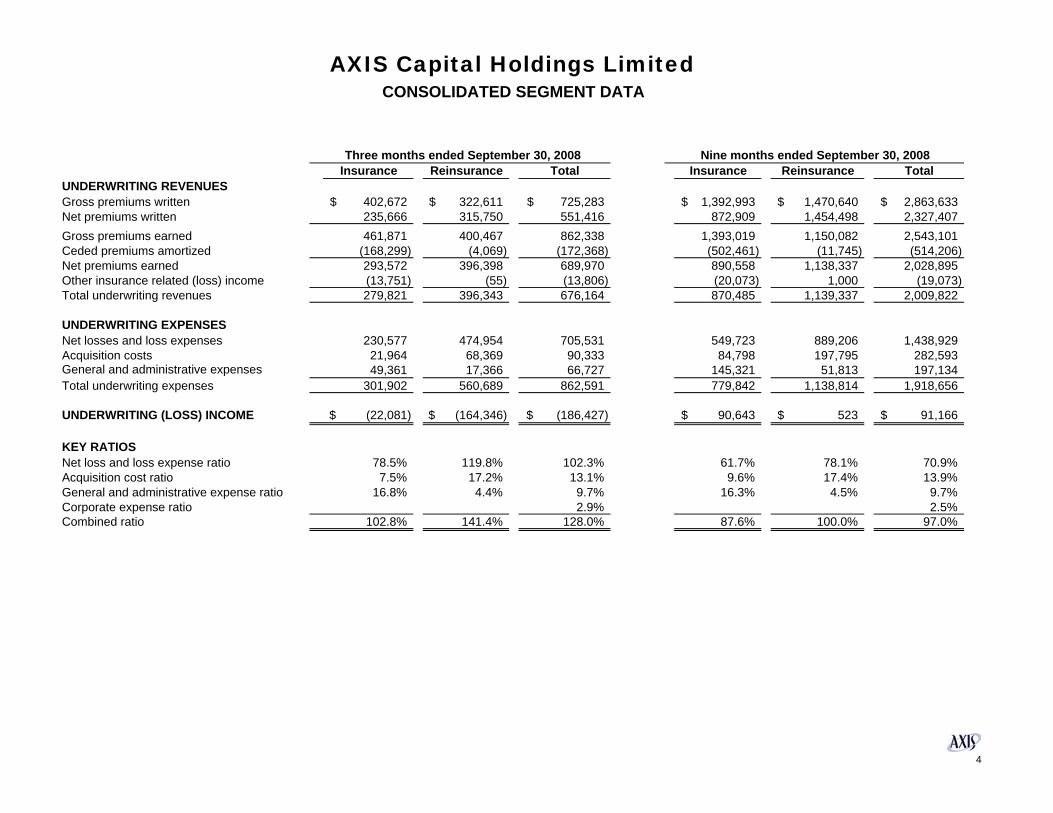
Insurance Reinsurance Total Insurance Reinsurance TotalUNDERWRITING REVENUESGross premiums written 402,672$ 322,611$ 725,283$ 1,392,993$ 1,470,640$ 2,863,633$ Net premiums written 235,666 315,750 551,416 872,909 1,454,498 2,327,407 Gross premiums earned 461,871 400,467 862,338 1,393,019 1,150,082 2,543,101 Ceded premiums amortized (168,299) (4,069) (172,368) (502,461) (11,745) (514,206) Net premiums earned 293,572 396,398 689,970 890,558 1,138,337 2,028,895 Other insurance related (loss) income (13,751) (55) (13,806) (20,073) 1,000 (19,073) Total underwriting revenues 279,821 396,343 676,164 870,485 1,139,337 2,009,822
UNDERWRITING EXPENSESNet losses and loss expenses 230,577 474,954 705,531 549,723 889,206 1,438,929 Acquisition costs 21,964 68,369 90,333 84,798 197,795 282,593 General and administrative expenses 49,361 17,366 66,727 145,321 51,813 197,134 Total underwriting expenses 301,902 560,689 862,591 779,842 1,138,814 1,918,656
UNDERWRITING (LOSS) INCOME (22,081)$ (164,346)$ (186,427)$ 90,643$ 523$ 91,166$
KEY RATIOSNet loss and loss expense ratio 78.5% 119.8% 102.3% 61.7% 78.1% 70.9%Acquisition cost ratio 7.5% 17.2% 13.1% 9.6% 17.4% 13.9%General and administrative expense ratio 16.8% 4.4% 9.7% 16.3% 4.5% 9.7%Corporate expense ratio 2.9% 2.5%Combined ratio 102.8% 141.4% 128.0% 87.6% 100.0% 97.0%
AXIS Capital Holdings LimitedCONSOLIDATED SEGMENT DATA
Three months ended September 30, 2008 Nine months ended September 30, 2008
4

Q3 2008 Q2 2008 Q1 2008 Q4 2007 Q3 2007 Q3 2006INSURANCE SEGMENTProperty 137,417$ 175,017$ 127,291$ 150,283$ 147,033$ 145,334$ Marine 41,121 64,601 64,887 19,984 49,971 54,904 Terrorism 7,112 14,612 8,349 10,216 11,672 18,454 Aviation 11,735 8,715 17,486 28,788 14,518 15,384 Political risk 24,817 65,636 54,576 75,410 71,442 35,955 Professional lines 137,553 175,199 108,177 146,095 123,824 112,469 Liability 42,833 52,406 49,923 74,294 53,158 57,559 Other 84 (722) 4,168 4,256 9,111 13,057
TOTAL INSURANCE SEGMENT 402,672 555,464 434,857 509,326 480,729 453,116
REINSURANCE SEGMENTCatastrophe 115,216 117,306 212,948 8,743 76,044 100,759 Property 64,683 86,416 141,408 (578) 55,965 53,933 Professional lines 55,378 31,806 87,376 27,909 54,645 49,431 Credit and bond 5,083 9,230 134,574 5,363 6,705 1,889 Motor 7,202 16,831 75,526 902 5,886 5,896 Liability 54,659 28,917 108,759 8,477 59,233 48,640 Engineering 17,381 7,895 53,224 10,428 13,578 17,158 Other 3,009 20,304 15,509 2,295 2,439 4,088
TOTAL REINSURANCE SEGMENT 322,611 318,705 829,324 63,539 274,495 281,794
CONSOLIDATED TOTAL 725,283$ 874,169$ 1,264,181$ 572,865$ 755,224$ 734,910$
AXIS Capital Holdings LimitedGROSS PREMIUM WRITTEN BY SEGMENT BY LINE OF BUSINESS- QUARTERLY
Quarter ended
5
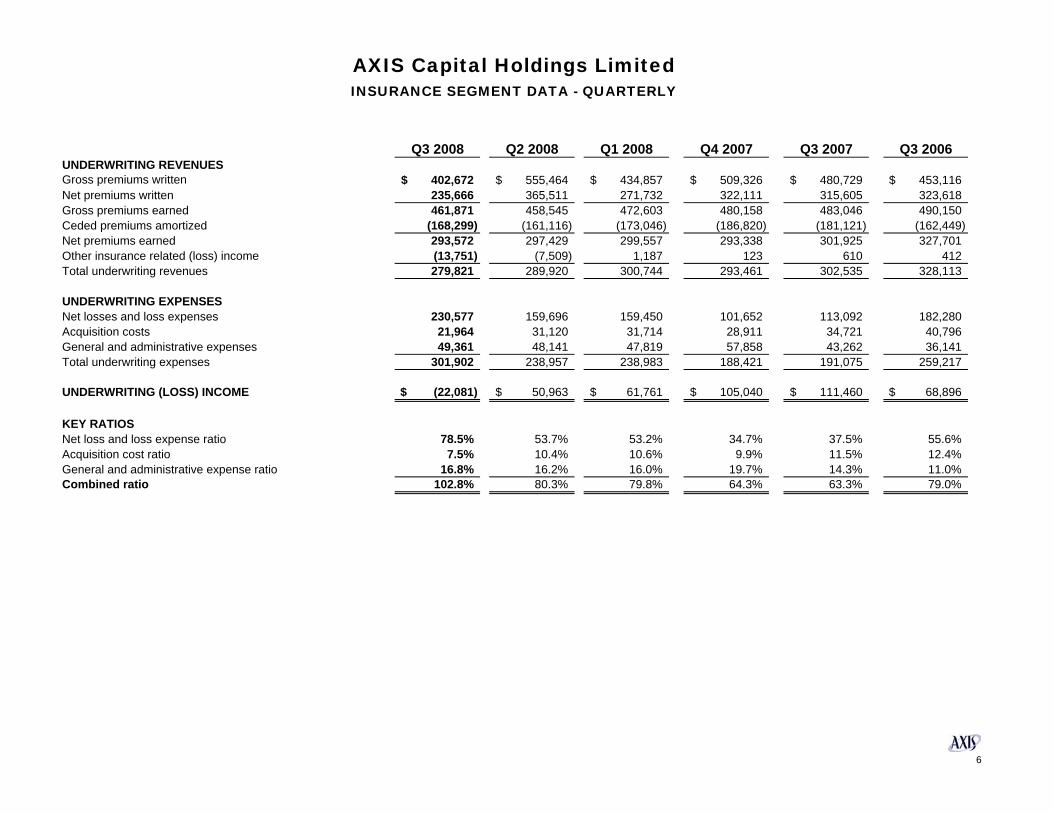
Q3 2008 Q2 2008 Q1 2008 Q4 2007 Q3 2007 Q3 2006UNDERWRITING REVENUESGross premiums written 402,672$ 555,464$ 434,857$ 509,326$ 480,729$ 453,116$ Net premiums written 235,666 365,511 271,732 322,111 315,605 323,618 Gross premiums earned 461,871 458,545 472,603 480,158 483,046 490,150 Ceded premiums amortized (168,299) (161,116) (173,046) (186,820) (181,121) (162,449) Net premiums earned 293,572 297,429 299,557 293,338 301,925 327,701 Other insurance related (loss) income (13,751) (7,509) 1,187 123 610 412 Total underwriting revenues 279,821 289,920 300,744 293,461 302,535 328,113
UNDERWRITING EXPENSESNet losses and loss expenses 230,577 159,696 159,450 101,652 113,092 182,280 Acquisition costs 21,964 31,120 31,714 28,911 34,721 40,796 General and administrative expenses 49,361 48,141 47,819 57,858 43,262 36,141 Total underwriting expenses 301,902 238,957 238,983 188,421 191,075 259,217
UNDERWRITING (LOSS) INCOME (22,081)$ 50,963$ 61,761$ 105,040$ 111,460$ 68,896$
KEY RATIOSNet loss and loss expense ratio 78.5% 53.7% 53.2% 34.7% 37.5% 55.6%Acquisition cost ratio 7.5% 10.4% 10.6% 9.9% 11.5% 12.4%General and administrative expense ratio 16.8% 16.2% 16.0% 19.7% 14.3% 11.0%Combined ratio 102.8% 80.3% 79.8% 64.3% 63.3% 79.0%
AXIS Capital Holdings LimitedINSURANCE SEGMENT DATA - QUARTERLY
6

Q3 2008 Q2 2008 Q1 2008 Q4 2007 Q3 2007 Q3 2006UNDERWRITING REVENUESGross premiums written 322,611$ 318,705$ 829,324$ 63,539$ 274,495$ 453,116$ Net premiums written 315,750 318,705 820,043 63,044 268,297 323,618 Gross premiums earned 400,467 386,704 362,911 380,263 387,706 490,150 Ceded premiums amortized (4,069) (3,842) (3,834) (4,281) (3,786) (162,449) Net premiums earned 396,398 382,862 359,077 375,982 383,920 327,701 Other insurance related (loss) income (55) 240 815 150 395 412 Total underwriting revenues 396,343 383,102 359,892 376,132 384,315 328,113
UNDERWRITING EXPENSESNet losses and loss expenses 474,954 212,021 202,231 188,894 215,101 182,280 Acquisition costs 68,369 66,660 62,766 61,663 65,318 40,796 General and administrative expenses 17,366 17,077 17,370 23,927 15,828 36,141 Total underwriting expenses 560,689 295,758 282,367 274,484 296,247 259,217
UNDERWRITING (LOSS) INCOME (164,346)$ 87,344$ 77,525$ 101,648$ 88,068$ 68,896$
KEY RATIOSNet loss and loss expense ratio 119.8% 55.4% 56.3% 50.2% 56.0% 55.6%Acquisition cost ratio 17.2% 17.4% 17.5% 16.4% 17.0% 12.4%General and administrative expense ratio 4.4% 4.5% 4.8% 6.4% 4.1% 11.0%Combined ratio 141.4% 77.3% 78.6% 73.0% 77.1% 79.0%
AXIS Capital Holdings LimitedREINSURANCE SEGMENT DATA - QUARTERLY
7

Sep 30, Jun 30, Mar 31, Dec 31, Sep 30, Sep 30,2008 2008 2008 2007 2007 2006
ASSETSInvestments: Fixed maturities, available for sale, at fair value 8,449,620$ 8,703,346$ 8,423,794$ 8,331,666$ 7,814,855$ 6,523,009$ Equity securities, available for sale, at fair value 129,220 247,845 99,239 7,746 8,779 - Other investments, at fair value 636,304 724,239 552,872 638,241 603,650 714,381 Total investments 9,215,144 9,675,430 9,075,905 8,977,653 8,427,284 7,237,390 Cash and cash equivalents 1,419,610 1,094,429 1,578,801 1,332,921 1,830,852 1,640,914 Accrued interest receivable 74,693 89,261 80,990 87,338 76,257 65,235 Insurance and reinsurance premium balances receivable 1,412,445 1,652,295 1,607,609 1,231,494 1,385,486 1,233,125 Reinsurance recoverable balances 1,410,554 1,340,452 1,330,965 1,280,295 1,247,720 1,315,395 Reinsurance recoverable balances on paid losses 62,617 82,677 95,348 76,598 97,047 49,287 Deferred acquisition costs 333,002 355,587 369,000 276,801 331,290 272,110 Prepaid reinsurance premiums 264,960 263,461 238,466 242,940 246,027 274,972 Securities lending collateral 731,661 813,737 1,025,343 865,256 861,280 1,010,846 Net receivable for investments sold - - 18,086 86,356 - Goodwill and intangible assets 60,726 61,035 61,344 61,653 61,967 34,543 Other assets 190,042 178,025 158,337 156,004 146,694 120,385 TOTAL ASSETS 15,175,454$ 15,606,389$ 15,640,194$ 14,675,309$ 14,711,904$ 13,254,202$
LIABILITIESReserve for losses and loss expenses 6,406,204$ 5,995,731$ 5,814,208$ 5,587,311$ 5,531,379$ 4,995,074$ Unearned premiums 2,466,622 2,603,676 2,574,755 2,146,087 2,433,339 2,167,364 Insurance and reinsurance balances payable 223,963 249,710 225,715 244,988 255,922 287,445 Securities lending payable 730,412 812,833 1,024,752 863,906 858,546 1,006,806 Senior notes 499,342 499,315 499,288 499,261 499,234 499,127 Other liabilities 183,385 144,689 130,054 175,134 140,869 109,656 Net payable for investments purchased 64,336 37,273 - - 49,023 47,781 TOTAL LIABILITIES 10,574,264 10,343,227 10,268,772 9,516,687 9,768,312 9,113,253
SHAREHOLDERS' EQUITYSeries A and B preferred shares 500,000 500,000 500,000 500,000 500,000 500,000 Common shares 1,878 1,877 1,875 1,850 1,849 1,875 Additional paid-in capital 1,943,125 1,922,356 1,902,336 1,869,810 1,859,067 1,923,169 Accumulated other comprehensive (loss) income (495,697) (150,721) (104) 22,668 (28,444) (54,673) Retained earnings 3,097,487 3,377,051 3,176,654 2,968,900 2,690,742 1,770,578 Treasury shares, at cost (445,603) (387,401) (209,339) (204,606) (79,622) - TOTAL SHAREHOLDERS' EQUITY 4,601,190 5,263,162 5,371,422 5,158,622 4,943,592 4,140,949 TOTAL LIABILITIES AND SHAREHOLDERS' EQUITY 15,175,454$ 15,606,389$ 15,640,194$ 14,675,309$ 14,711,904$ 13,254,202$
Book value per common share $29.72 $34.11 $33.69 $32.69 $30.50 $24.27
Debt (Senior notes) to total capitalization [a] 9.8% 8.7% 8.5% 8.8% 9.2% 10.8%
Debt plus preferred shares to total capitalization 19.6% 17.3% 17.0% 17.7% 18.4% 21.5%
[a] The debt to capitalization ratio is calculated by dividing our senior notes by the total capital. Total capital represents the sum of total shareholders' equity and our senior notes.
AXIS Capital Holdings LimitedCONSOLIDATED BALANCE SHEETS
8
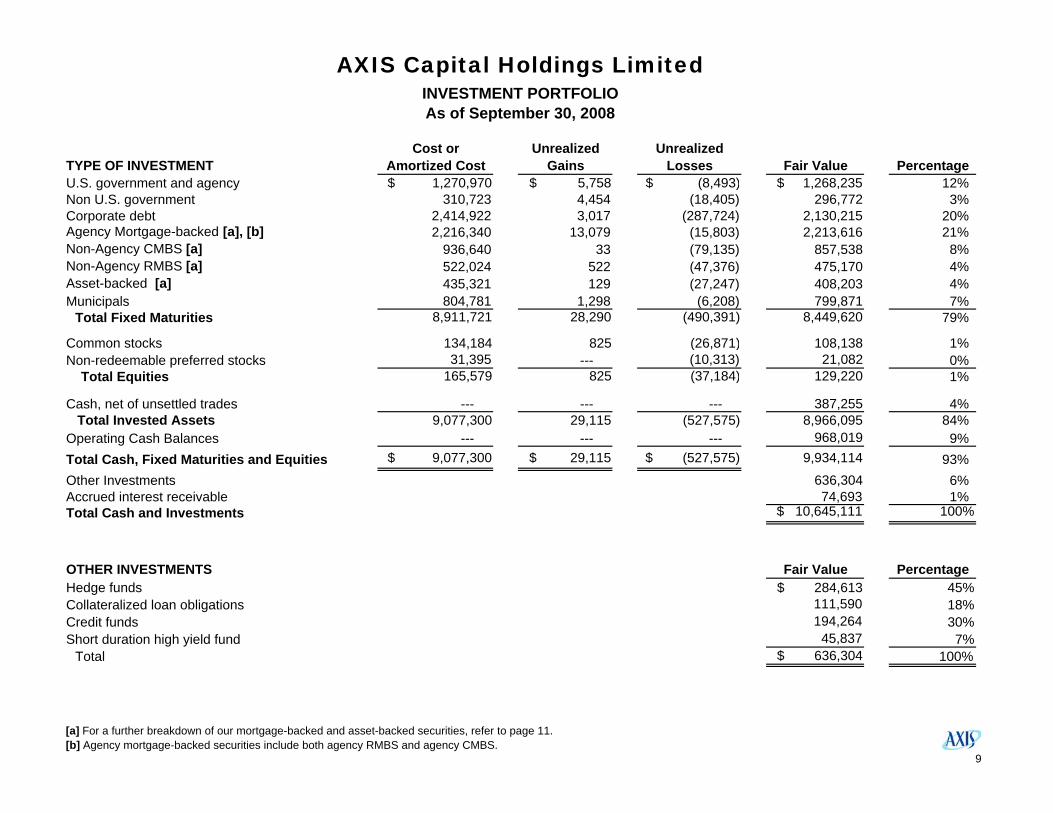
Cost or Unrealized UnrealizedTYPE OF INVESTMENT Amortized Cost Gains Losses Fair Value PercentageU.S. government and agency $ 1,270,970 $ 5,758 $ (8,493) $ 1,268,235 12%Non U.S. government 310,723 4,454 (18,405) 296,772 3%Corporate debt 2,414,922 3,017 (287,724) 2,130,215 20%Agency Mortgage-backed [a], [b] 2,216,340 13,079 (15,803) 2,213,616 21%Non-Agency CMBS [a] 936,640 33 (79,135) 857,538 8%Non-Agency RMBS [a] 522,024 522 (47,376) 475,170 4%Asset-backed [a] 435,321 129 (27,247) 408,203 4%Municipals 804,781 1,298 (6,208) 799,871 7%
Total Fixed Maturities 8,911,721 28,290 (490,391) 8,449,620 79%
Common stocks 134,184 825 (26,871) 108,138 1%Non-redeemable preferred stocks 31,395 --- (10,313) 21,082 0% Total Equities 165,579 825 (37,184) 129,220 1%
Cash, net of unsettled trades --- --- --- 387,255 4% Total Invested Assets 9,077,300 29,115 (527,575) 8,966,095 84%Operating Cash Balances --- --- --- 968,019 9%Total Cash, Fixed Maturities and Equities $ 9,077,300 $ 29,115 $ (527,575) 9,934,114 93%Other Investments 636,304 6%Accrued interest receivable 74,693 1%Total Cash and Investments $ 10,645,111 100%
OTHER INVESTMENTS Fair Value PercentageHedge funds $ 284,613 45%Collateralized loan obligations 111,590 18%Credit funds 194,264 30%Short duration high yield fund 45,837 7%
Total $ 636,304 100%
[a] For a further breakdown of our mortgage-backed and asset-backed securities, refer to page 11. [b] Agency mortgage-backed securities include both agency RMBS and agency CMBS.
AXIS Capital Holdings LimitedINVESTMENT PORTFOLIOAs of September 30, 2008
9
Q3 2008 Q2 2008 Q1 2008 Q4 2007 Q3 2007 Q3 2006
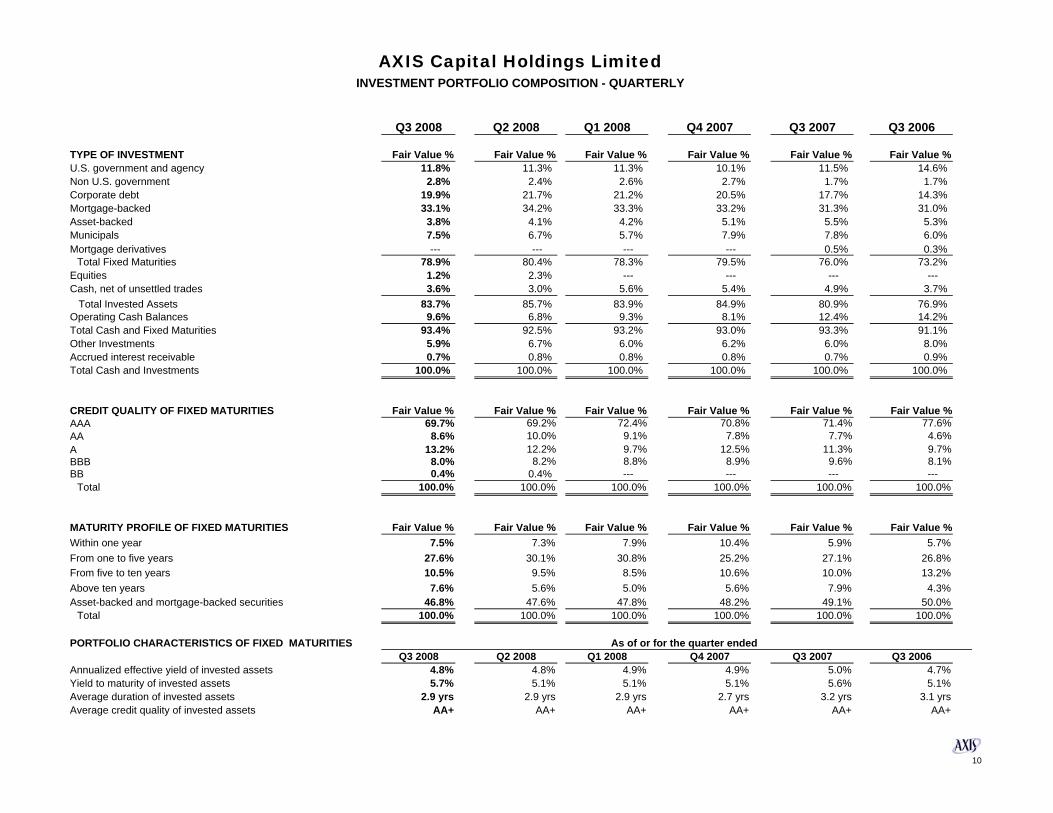
TYPE OF INVESTMENT Fair Value % Fair Value % Fair Value % Fair Value % Fair Value % Fair Value %U.S. government and agency 11.8% 11.3% 11.3% 10.1% 11.5% 14.6%Non U.S. government 2.8% 2.4% 2.6% 2.7% 1.7% 1.7%Corporate debt 19.9% 21.7% 21.2% 20.5% 17.7% 14.3%Mortgage-backed 33.1% 34.2% 33.3% 33.2% 31.3% 31.0%Asset-backed 3.8% 4.1% 4.2% 5.1% 5.5% 5.3%Municipals 7.5% 6.7% 5.7% 7.9% 7.8% 6.0%Mortgage derivatives --- --- --- --- 0.5% 0.3%
Total Fixed Maturities 78.9% 80.4% 78.3% 79.5% 76.0% 73.2%Equities 1.2% 2.3% --- --- --- ---Cash, net of unsettled trades 3.6% 3.0% 5.6% 5.4% 4.9% 3.7% Total Invested Assets 83.7% 85.7% 83.9% 84.9% 80.9% 76.9%Operating Cash Balances 9.6% 6.8% 9.3% 8.1% 12.4% 14.2%Total Cash and Fixed Maturities 93.4% 92.5% 93.2% 93.0% 93.3% 91.1%Other Investments 5.9% 6.7% 6.0% 6.2% 6.0% 8.0%Accrued interest receivable 0.7% 0.8% 0.8% 0.8% 0.7% 0.9%Total Cash and Investments 100.0% 100.0% 100.0% 100.0% 100.0% 100.0%
CREDIT QUALITY OF FIXED MATURITIES Fair Value % Fair Value % Fair Value % Fair Value % Fair Value % Fair Value %AAA 69.7% 69.2% 72.4% 70.8% 71.4% 77.6%AA 8.6% 10.0% 9.1% 7.8% 7.7% 4.6%A 13.2% 12.2% 9.7% 12.5% 11.3% 9.7%BBB 8.0% 8.2% 8.8% 8.9% 9.6% 8.1%BB 0.4% 0.4% --- --- --- ---
Total 100.0% 100.0% 100.0% 100.0% 100.0% 100.0%
MATURITY PROFILE OF FIXED MATURITIES Fair Value % Fair Value % Fair Value % Fair Value % Fair Value % Fair Value %Within one year 7.5% 7.3% 7.9% 10.4% 5.9% 5.7%From one to five years 27.6% 30.1% 30.8% 25.2% 27.1% 26.8%From five to ten years 10.5% 9.5% 8.5% 10.6% 10.0% 13.2%Above ten years 7.6% 5.6% 5.0% 5.6% 7.9% 4.3%Asset-backed and mortgage-backed securities 46.8% 47.6% 47.8% 48.2% 49.1% 50.0%
Total 100.0% 100.0% 100.0% 100.0% 100.0% 100.0%
PORTFOLIO CHARACTERISTICS OF FIXED MATURITIESQ3 2008 Q2 2008 Q1 2008 Q4 2007 Q3 2007 Q3 2006
Annualized effective yield of invested assets 4.8% 4.8% 4.9% 4.9% 5.0% 4.7%Yield to maturity of invested assets 5.7% 5.1% 5.1% 5.1% 5.6% 5.1%Average duration of invested assets 2.9 yrs 2.9 yrs 2.9 yrs 2.7 yrs 3.2 yrs 3.1 yrsAverage credit quality of invested assets AA+ AA+ AA+ AA+ AA+ AA+
As of or for the quarter ended
AXIS Capital Holdings LimitedINVESTMENT PORTFOLIO COMPOSITION - QUARTERLY
10

Residential Commercial Residential Commercial Residential Commercial Residential Commercial Total Agency Agency Pass-Throughs 2,020,583$ -$ -$ -$ -$ -$ 2,020,583$ -$ 2,020,583$ Agency CMO’s 112,676 9,315 - - - 112,676 9,315 121,991 Agency Floating Rate MBS 71,042 - - - - - 71,042 - 71,042
Non-AgencyNon-Agency CMO’s - - 411,624 837,767 8,092 19,758 419,716 857,525 1,277,241 Non-Agency Floating Rate MBS - - 54,907 13 547 - 55,454 13 55,467 Total 2,204,301$ 9,315$ 466,531$ 837,780$ 8,639$ 19,758$ 2,679,471$ 866,853$ 3,546,324$
Description AAA AA or lower TotalAuto 126,285$ 11,938$ 138,223$ CLO [b] - 44,976 44,976 CDO 5,678 3,139 8,817 Credit Card 112,577 - 112,577 Equipment 5,872 - 5,872 Home Equity 33,901 6,718 40,619 Other 57,119 - 57,119 Total 341,432$ 66,771$ 408,203$
[a] These represent securities backed by U.S Government sponsored agencies.[b] Collateralized loan obligation - debt tranche securities.
Total
Asset-Backed Securities By Rating
AXIS Capital Holdings LimitedMORTGAGE AND ASSET BACKED SECURITIES
As of September 30, 2008
Mortgage-Backed Securities By Rating and ClassAgency [a] AAA AA or lower
11
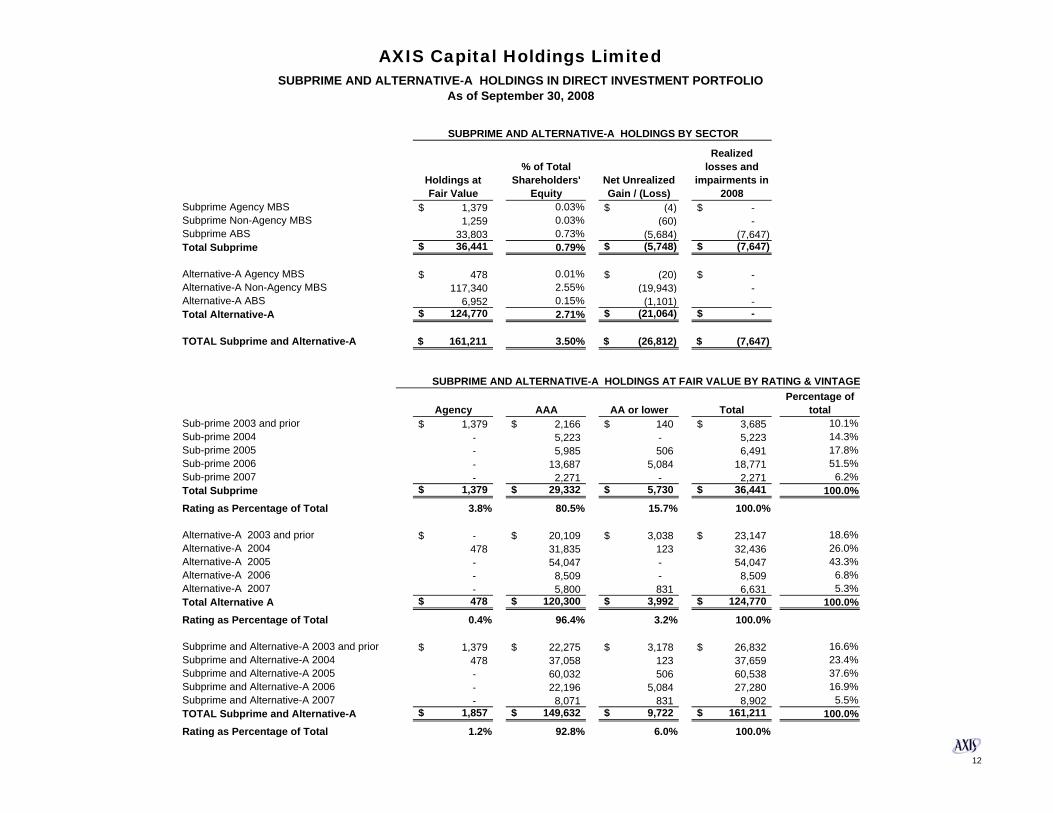
Holdings at Fair Value
% of Total Shareholders'
EquityNet Unrealized Gain / (Loss)
Realized losses and
impairments in 2008
Subprime Agency MBS 1,379$ 0.03% (4)$ -$ Subprime Non-Agency MBS 1,259 0.03% (60) - Subprime ABS 33,803 0.73% (5,684) (7,647) Total Subprime 36,441$ 0.79% (5,748)$ (7,647)$
Alternative-A Agency MBS 478$ 0.01% (20)$ -$ Alternative-A Non-Agency MBS 117,340 2.55% (19,943) - Alternative-A ABS 6,952 0.15% (1,101) - Total Alternative-A 124,770$ 2.71% (21,064)$ -$
TOTAL Subprime and Alternative-A $ 161,211 3.50% $ (26,812) $ (7,647)
Agency AAA AA or lower Total Percentage of
totalSub-prime 2003 and prior 1,379$ 2,166$ 140$ 3,685$ 10.1%Sub-prime 2004 - 5,223 - 5,223 14.3%Sub-prime 2005 - 5,985 506 6,491 17.8%Sub-prime 2006 - 13,687 5,084 18,771 51.5%Sub-prime 2007 - 2,271 - 2,271 6.2%Total Subprime 1,379$ 29,332$ 5,730$ 36,441$ 100.0%Rating as Percentage of Total 3.8% 80.5% 15.7% 100.0%
Alternative-A 2003 and prior -$ 20,109$ 3,038$ 23,147$ 18.6%Alternative-A 2004 478 31,835 123 32,436 26.0%Alternative-A 2005 - 54,047 - 54,047 43.3%Alternative-A 2006 - 8,509 - 8,509 6.8%Alternative-A 2007 - 5,800 831 6,631 5.3%Total Alternative A 478$ 120,300$ 3,992$ 124,770$ 100.0%Rating as Percentage of Total 0.4% 96.4% 3.2% 100.0%
Subprime and Alternative-A 2003 and prior 1,379$ 22,275$ 3,178$ 26,832$ 16.6%Subprime and Alternative-A 2004 478 37,058 123 37,659 23.4%Subprime and Alternative-A 2005 - 60,032 506 60,538 37.6%Subprime and Alternative-A 2006 - 22,196 5,084 27,280 16.9%Subprime and Alternative-A 2007 - 8,071 831 8,902 5.5%TOTAL Subprime and Alternative-A 1,857$ 149,632$ 9,722$ 161,211$ 100.0%Rating as Percentage of Total 1.2% 92.8% 6.0% 100.0%
SUBPRIME AND ALTERNATIVE-A HOLDINGS AT FAIR VALUE BY RATING & VINTAGE
AXIS Capital Holdings LimitedSUBPRIME AND ALTERNATIVE-A HOLDINGS IN DIRECT INVESTMENT PORTFOLIO
As of September 30, 2008
SUBPRIME AND ALTERNATIVE-A HOLDINGS BY SECTOR
12

Amortized Unrealized % of TotalISSUER Cost Gain / (Loss) Fair Value Fixed Maturities
GENERAL ELECTRIC CO $ 95,020 $ (7,062) $ 87,958 1.0%JPMORGAN CHASE & CO 88,402 (4,260) 84,142 1.0%BANK OF AMERICA CORP 71,930 (5,857) 66,073 0.8%CITIGROUP INC 59,172 (8,630) 50,542 0.6%WELLS FARGO & COMPANY 46,476 (1,590) 44,886 0.5%NATIONAL AUSTRALIA BANK LIMITED 35,370 31 35,401 0.4%MORGAN STANLEY 46,418 (12,073) 34,345 0.4%HSBC HOLDINGS PLC 35,254 (1,534) 33,720 0.4%AT&T INC 34,294 (932) 33,362 0.4%COMCAST CORPORATION 33,797 (1,097) 32,700 0.4%
Notes:1. Corporate issuers exclude government-backed, government-sponsored enterprises and cash and cash equivalents.
2. Credit exposures represent only direct exposure to fixed maturities and short-term investments of the parent issuer and its major subsidiaries. These exposures exclude asset and mortgage backed securities that were issued, sponsored or serviced by the parent.
AXIS Capital Holdings LimitedINVESTMENT PORTFOLIO
TEN LARGEST CORPORATE HOLDINGSAs of September 30, 2008
13

Amortized Unrealized % of TotalISSUER Cost Gain / (Loss) Fair Value Fixed Maturities
JPMORGAN CHASE & CO $ 88,402 $ (4,260) $ 84,142 1.0%BANK OF AMERICA CORP 71,930 (5,857) 66,073 0.8%CITIGROUP INC 59,172 (8,630) 50,542 0.6%WELLS FARGO & COMPANY 46,476 (1,590) 44,886 0.5%NATIONAL AUSTRALIA BANK LIMITED 35,370 31 35,401 0.4%MORGAN STANLEY 46,418 (12,073) 34,345 0.4%HSBC HOLDINGS PLC 35,254 (1,534) 33,720 0.4%WACHOVIA CORPORATION 30,595 (4,988) 25,607 0.3%NATIONWIDE BUILDING SOCIETY 26,173 (172) 26,001 0.3%Less than $25m individually 530,213 (54,305) 475,908 5.6%
$Total 970,003$ (93,378)$ 876,625$ 10.4%
Notes:1. Corporate issuers exclude government-backed, government-sponsored enterprises and cash and cash equivalents.2. Credit exposures represent only direct exposure to fixed maturities and short-term investments of the parent issuer and its major subsidiaries. These exposures exclude asset and mortgage backed securities that were issued, sponsored or serviced by the parent. Credit exposures are listed individually where the amortized cost is greater than $25 million.
AXIS Capital Holdings LimitedINVESTMENT PORTFOLIO
FINANCIAL ISSUER EXPOSURE IN FIXED MATURITY PORTFOLIOAs of September 30, 2008
14
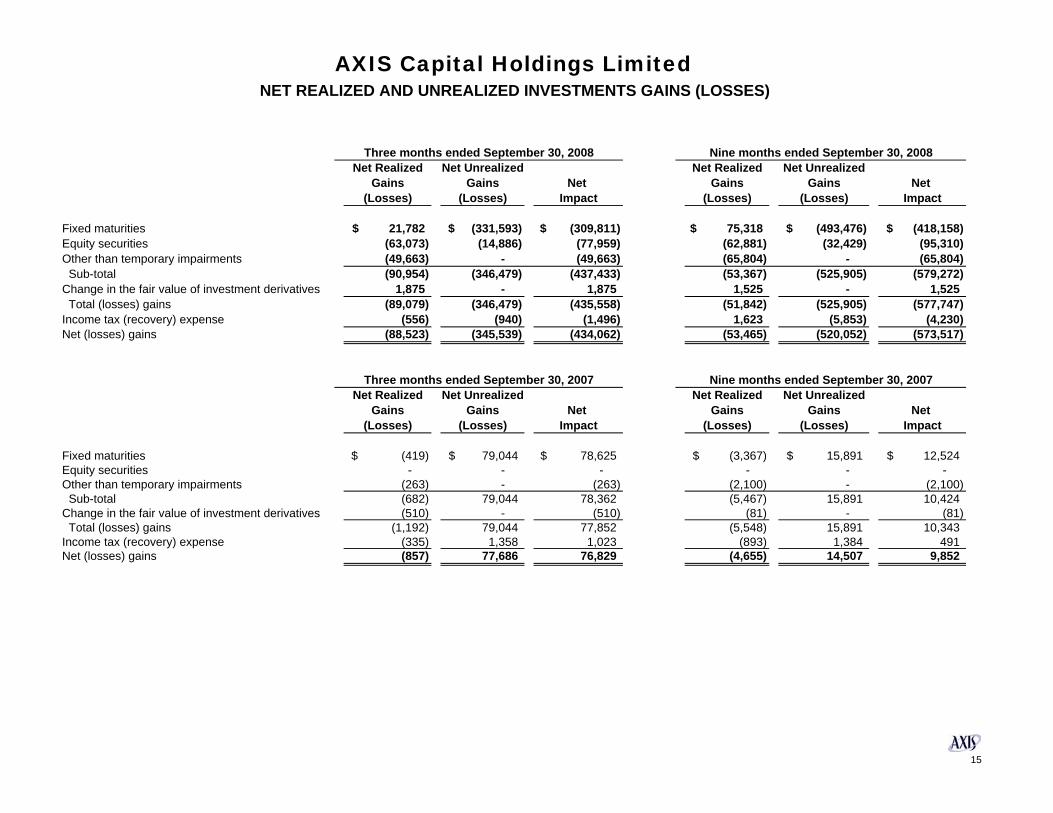
Net Realized Net Unrealized Net Realized Net UnrealizedGains Gains Net Gains Gains Net
(Losses) (Losses) Impact (Losses) (Losses) Impact
Fixed maturities 21,782$ (331,593)$ (309,811)$ 75,318$ (493,476)$ (418,158)$ Equity securities (63,073) (14,886) (77,959) (62,881) (32,429) (95,310) Other than temporary impairments (49,663) - (49,663) (65,804) - (65,804) Sub-total (90,954) (346,479) (437,433) (53,367) (525,905) (579,272) Change in the fair value of investment derivatives 1,875 - 1,875 1,525 - 1,525 Total (losses) gains (89,079) (346,479) (435,558) (51,842) (525,905) (577,747) Income tax (recovery) expense (556) (940) (1,496) 1,623 (5,853) (4,230) Net (losses) gains (88,523) (345,539) (434,062) (53,465) (520,052) (573,517)
Net Realized Net Unrealized Net Realized Net UnrealizedGains Gains Net Gains Gains Net
(Losses) (Losses) Impact (Losses) (Losses) Impact
Fixed maturities (419)$ 79,044$ 78,625$ (3,367)$ 15,891$ 12,524$ Equity securities - - - - - - Other than temporary impairments (263) - (263) (2,100) - (2,100) Sub-total (682) 79,044 78,362 (5,467) 15,891 10,424 Change in the fair value of investment derivatives (510) - (510) (81) - (81) Total (losses) gains (1,192) 79,044 77,852 (5,548) 15,891 10,343 Income tax (recovery) expense (335) 1,358 1,023 (893) 1,384 491 Net (losses) gains (857) 77,686 76,829 (4,655) 14,507 9,852
Three months ended September 30, 2007 Nine months ended September 30, 2007
AXIS Capital Holdings LimitedNET REALIZED AND UNREALIZED INVESTMENTS GAINS (LOSSES)
Three months ended September 30, 2008 Nine months ended September 30, 2008
15
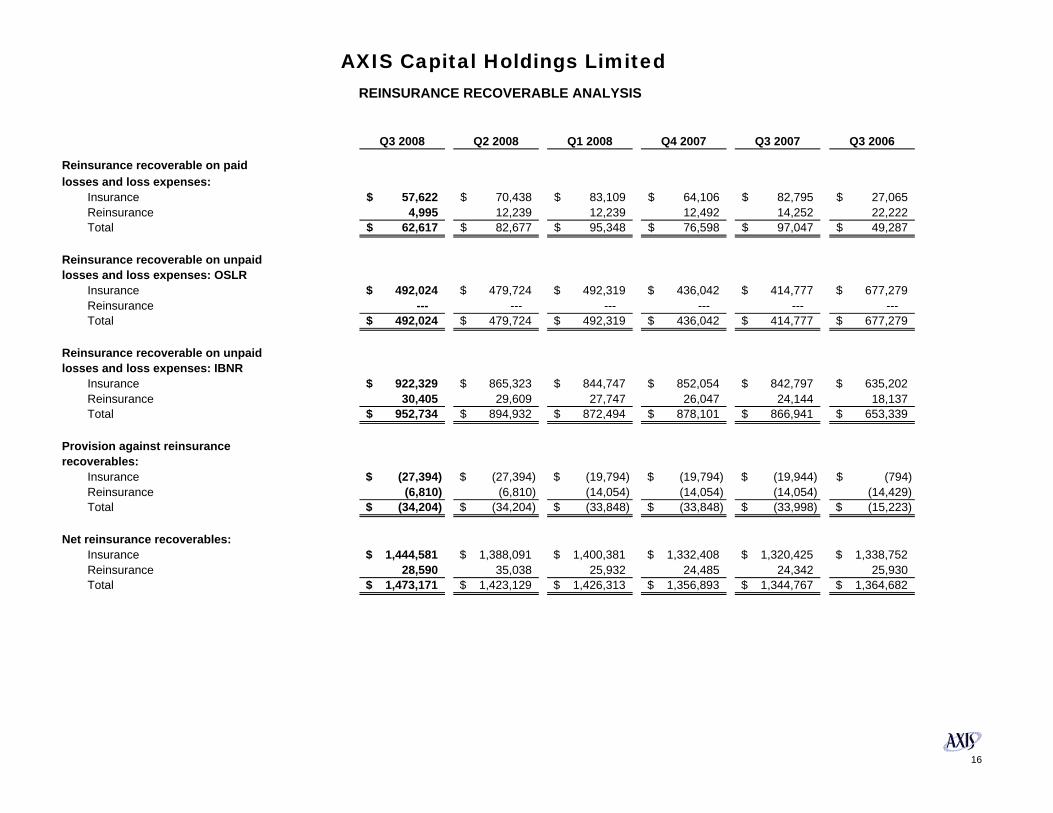
Q3 2008 Q2 2008 Q1 2008 Q4 2007 Q3 2007 Q3 2006
Reinsurance recoverable on paid losses and loss expenses:
Insurance 57,622$ 70,438$ 83,109$ 64,106$ 82,795$ 27,065$ Reinsurance 4,995 12,239 12,239 12,492 14,252 22,222 Total 62,617$ 82,677$ 95,348$ 76,598$ 97,047$ 49,287$
Reinsurance recoverable on unpaid losses and loss expenses: OSLR
Insurance 492,024$ 479,724$ 492,319$ 436,042$ 414,777$ 677,279$ Reinsurance --- --- --- --- --- ---Total 492,024$ 479,724$ 492,319$ 436,042$ 414,777$ 677,279$
Reinsurance recoverable on unpaid losses and loss expenses: IBNR
Insurance 922,329$ 865,323$ 844,747$ 852,054$ 842,797$ 635,202$ Reinsurance 30,405 29,609 27,747 26,047 24,144 18,137 Total 952,734$ 894,932$ 872,494$ 878,101$ 866,941$ 653,339$
Provision against reinsurancerecoverables:
Insurance (27,394)$ (27,394)$ (19,794)$ (19,794)$ (19,944)$ (794)$ Reinsurance (6,810) (6,810) (14,054) (14,054) (14,054) (14,429) Total (34,204)$ (34,204)$ (33,848)$ (33,848)$ (33,998)$ (15,223)$
Net reinsurance recoverables:Insurance 1,444,581$ 1,388,091$ 1,400,381$ 1,332,408$ 1,320,425$ 1,338,752$ Reinsurance 28,590 35,038 25,932 24,485 24,342 25,930 Total 1,473,171$ 1,423,129$ 1,426,313$ 1,356,893$ 1,344,767$ 1,364,682$
AXIS Capital Holdings LimitedREINSURANCE RECOVERABLE ANALYSIS
16
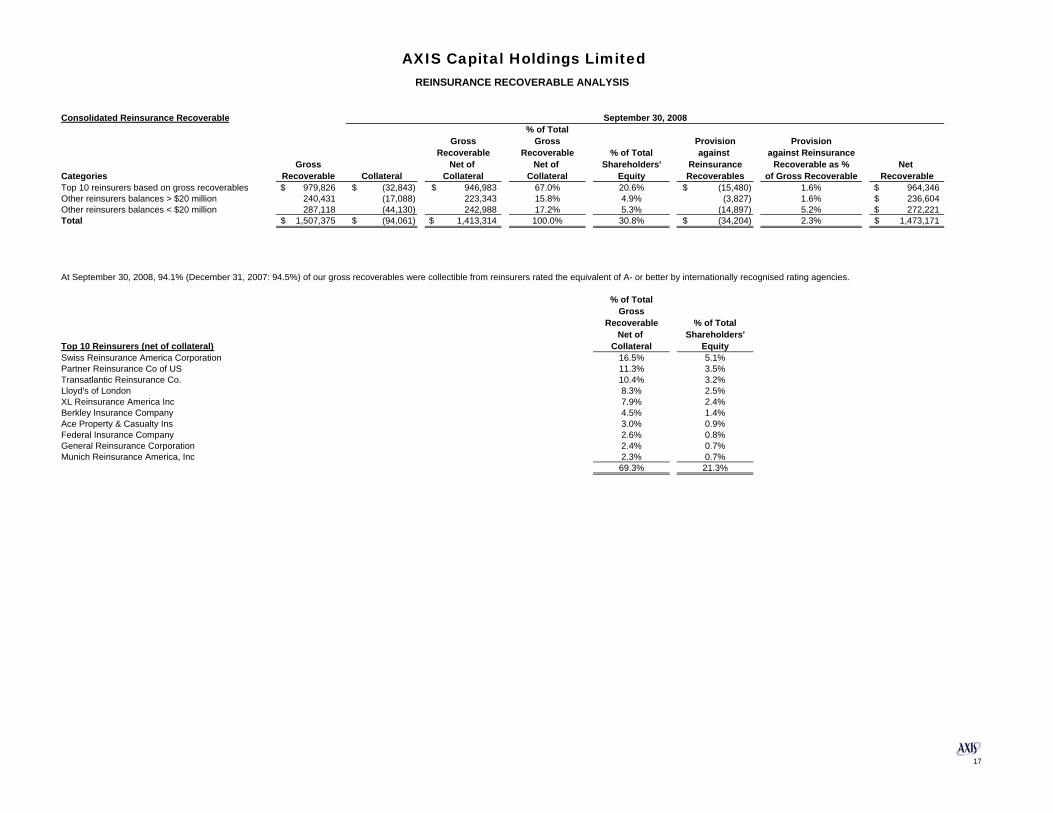
Consolidated Reinsurance Recoverable% of Total
Gross Gross Provision ProvisionRecoverable Recoverable % of Total against against Reinsurance
Gross Net of Net of Shareholders' Reinsurance Recoverable as % Net Categories Recoverable Collateral Collateral Collateral Equity Recoverables of Gross Recoverable RecoverableTop 10 reinsurers based on gross recoverables 979,826$ (32,843)$ 946,983$ 67.0% 20.6% (15,480)$ 1.6% 964,346$ Other reinsurers balances > $20 million 240,431 (17,088) 223,343 15.8% 4.9% (3,827) 1.6% 236,604$ Other reinsurers balances < $20 million 287,118 (44,130) 242,988 17.2% 5.3% (14,897) 5.2% 272,221$ Total 1,507,375$ (94,061)$ 1,413,314$ 100.0% 30.8% (34,204)$ 2.3% 1,473,171$
% of TotalGross
Recoverable % of TotalNet of Shareholders'
Top 10 Reinsurers (net of collateral) Collateral EquitySwiss Reinsurance America Corporation 16.5% 5.1%Partner Reinsurance Co of US 11.3% 3.5%Transatlantic Reinsurance Co. 10.4% 3.2%Lloyd's of London 8.3% 2.5%XL Reinsurance America Inc 7.9% 2.4%Berkley Insurance Company 4.5% 1.4%Ace Property & Casualty Ins 3.0% 0.9%Federal Insurance Company 2.6% 0.8%General Reinsurance Corporation 2.4% 0.7%Munich Reinsurance America, Inc 2.3% 0.7%
69.3% 21.3%
AXIS Capital Holdings LimitedREINSURANCE RECOVERABLE ANALYSIS
September 30, 2008
At September 30, 2008, 94.1% (December 31, 2007: 94.5%) of our gross recoverables were collectible from reinsurers rated the equivalent of A- or better by internationally recognised rating agencies.
17
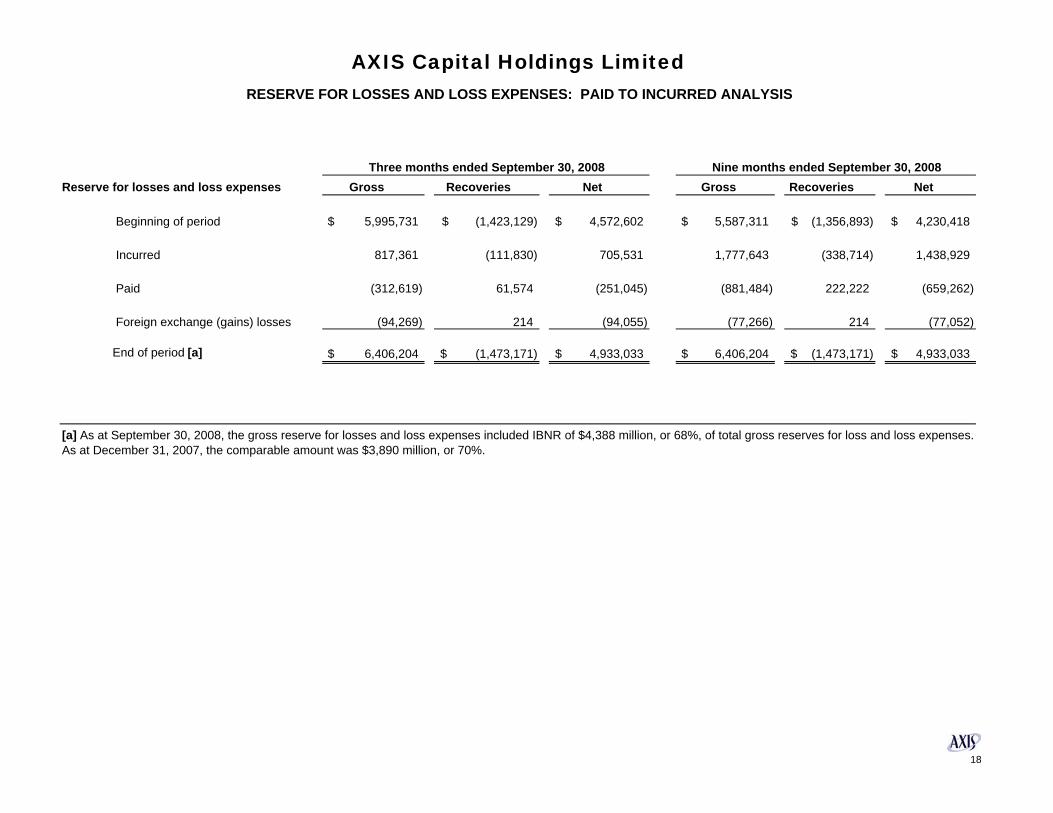
Three months ended September 30, 2008 Nine months ended September 30, 2008Reserve for losses and loss expenses Gross Recoveries Net Gross Recoveries Net
Beginning of period 5,995,731$ (1,423,129)$ 4,572,602$ 5,587,311$ (1,356,893)$ 4,230,418$
Incurred 817,361 (111,830) 705,531 1,777,643 (338,714) 1,438,929
Paid (312,619) 61,574 (251,045) (881,484) 222,222 (659,262)
Foreign exchange (gains) losses (94,269) 214 (94,055) (77,266) 214 (77,052)
End of period [a] 6,406,204$ (1,473,171)$ 4,933,033$ 6,406,204$ (1,473,171)$ 4,933,033$
[a] As at September 30, 2008, the gross reserve for losses and loss expenses included IBNR of $4,388 million, or 68%, of total gross reserves for loss and loss expenses. As at December 31, 2007, the comparable amount was $3,890 million, or 70%.
AXIS Capital Holdings LimitedRESERVE FOR LOSSES AND LOSS EXPENSES: PAID TO INCURRED ANALYSIS
18
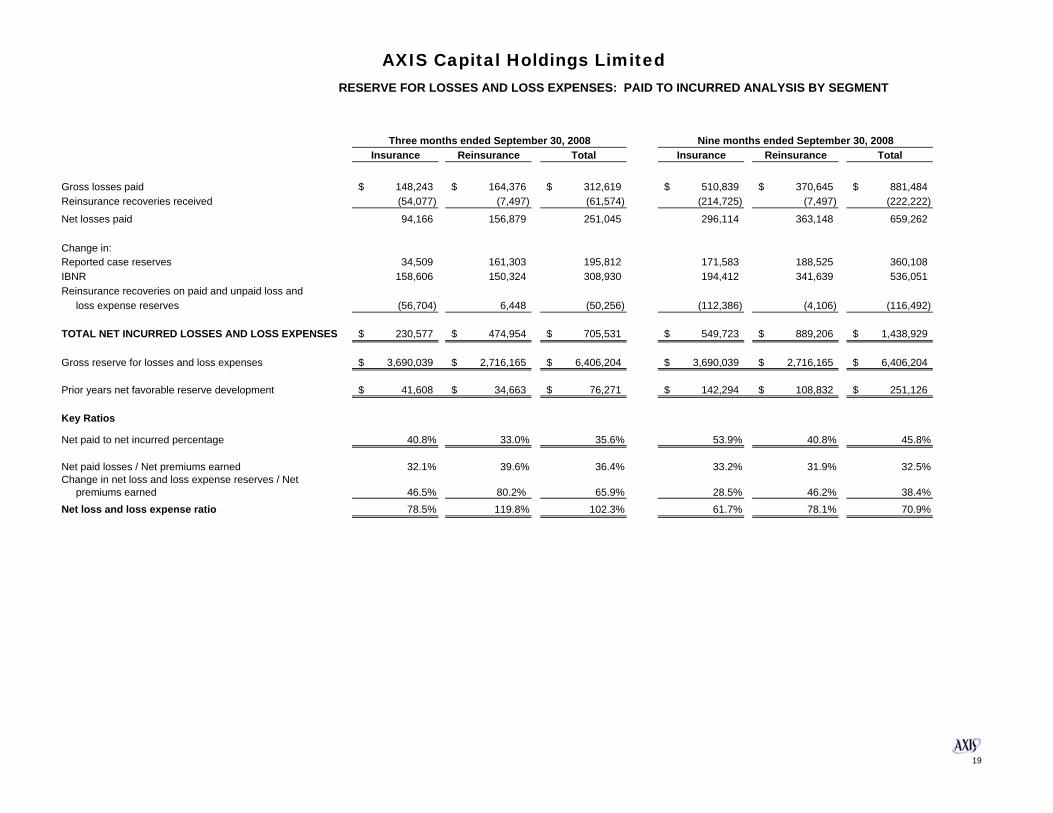
Insurance Reinsurance Total Insurance Reinsurance Total
Gross losses paid 148,243$ 164,376$ 312,619$ 510,839$ 370,645$ 881,484$ Reinsurance recoveries received (54,077) (7,497) (61,574) (214,725) (7,497) (222,222)
Net losses paid 94,166 156,879 251,045 296,114 363,148 659,262
Change in:Reported case reserves 34,509 161,303 195,812 171,583 188,525 360,108 IBNR 158,606 150,324 308,930 194,412 341,639 536,051 Reinsurance recoveries on paid and unpaid loss and loss expense reserves (56,704) 6,448 (50,256) (112,386) (4,106) (116,492)
TOTAL NET INCURRED LOSSES AND LOSS EXPENSES 230,577$ 474,954$ 705,531$ 549,723$ 889,206$ 1,438,929$
Gross reserve for losses and loss expenses 3,690,039$ 2,716,165$ 6,406,204$ 3,690,039$ 2,716,165$ 6,406,204$
Prior years net favorable reserve development 41,608$ 34,663$ 76,271$ 142,294$ 108,832$ 251,126$
Key Ratios
Net paid to net incurred percentage 40.8% 33.0% 35.6% 53.9% 40.8% 45.8%
Net paid losses / Net premiums earned 32.1% 39.6% 36.4% 33.2% 31.9% 32.5%Change in net loss and loss expense reserves / Net premiums earned 46.5% 80.2% 65.9% 28.5% 46.2% 38.4%Net loss and loss expense ratio 78.5% 119.8% 102.3% 61.7% 78.1% 70.9%
($118,366) ($132,964) ($4,971)
AXIS Capital Holdings Limited RESERVE FOR LOSSES AND LOSS EXPENSES: PAID TO INCURRED ANALYSIS BY SEGMENT
Three months ended September 30, 2008 Nine months ended September 30, 2008
19
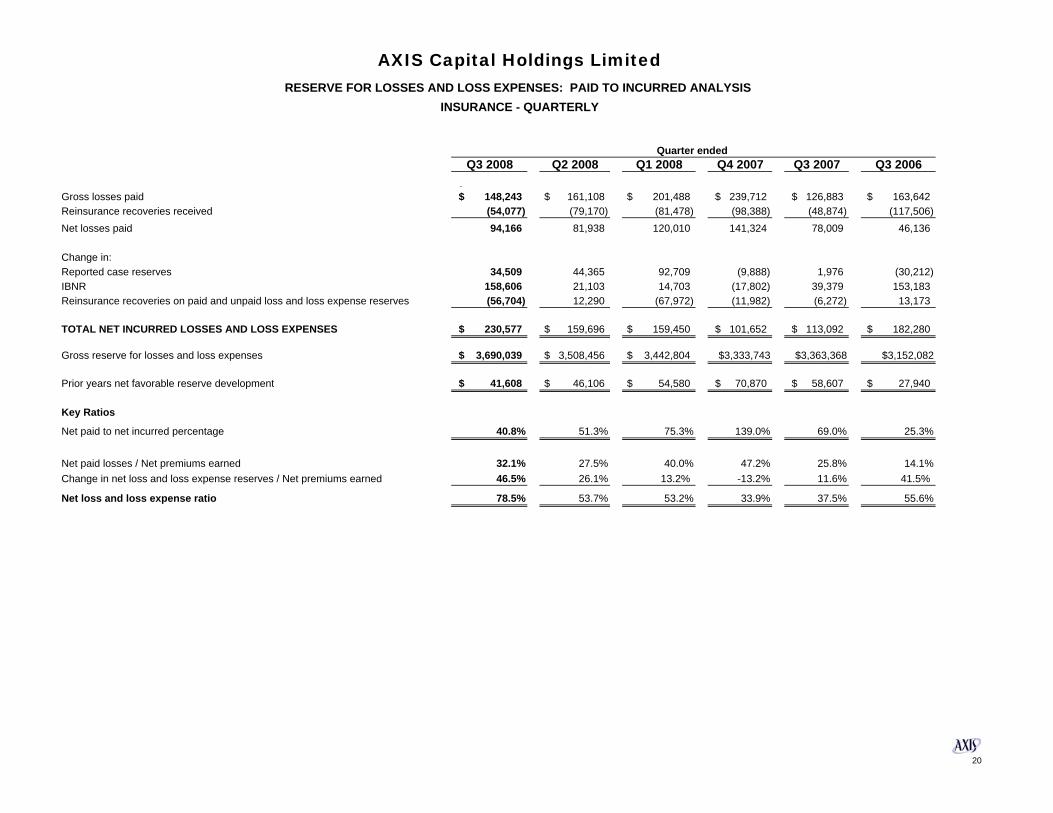
Q3 2008 Q2 2008 Q1 2008 Q4 2007 Q3 2007 Q3 2006$
Gross losses paid 148,243$ 161,108$ 201,488$ 239,712$ 126,883$ 163,642$ Reinsurance recoveries received (54,077) (79,170) (81,478) (98,388) (48,874) (117,506) Net losses paid 94,166 81,938 120,010 141,324 78,009 46,136
Change in:Reported case reserves 34,509 44,365 92,709 (9,888) 1,976 (30,212) IBNR 158,606 21,103 14,703 (17,802) 39,379 153,183 Reinsurance recoveries on paid and unpaid loss and loss expense reserves (56,704) 12,290 (67,972) (11,982) (6,272) 13,173
TOTAL NET INCURRED LOSSES AND LOSS EXPENSES 230,577$ 159,696$ 159,450$ 101,652$ 113,092$ 182,280$
Gross reserve for losses and loss expenses 3,690,039$ 3,508,456$ 3,442,804$ $3,333,743 $3,363,368 $3,152,082
Prior years net favorable reserve development 41,608$ 46,106$ 54,580$ 70,870$ 58,607$ 27,940$
Key Ratios
Net paid to net incurred percentage 40.8% 51.3% 75.3% 139.0% 69.0% 25.3%
Net paid losses / Net premiums earned 32.1% 27.5% 40.0% 47.2% 25.8% 14.1%Change in net loss and loss expense reserves / Net premiums earned 46.5% 26.1% 13.2% -13.2% 11.6% 41.5%
Net loss and loss expense ratio 78.5% 53.7% 53.2% 33.9% 37.5% 55.6%
AXIS Capital Holdings LimitedRESERVE FOR LOSSES AND LOSS EXPENSES: PAID TO INCURRED ANALYSIS
INSURANCE - QUARTERLY
Quarter ended
20

Q3 2008 Q2 2008 Q1 2008 Q4 2007 Q3 2007 Q3 2006
Gross losses paid 164,376$ 101,782$ 104,487$ 103,817$ 105,316$ 147,766$ Reinsurance recoveries received (7,497) - - - (738) (15,000) Net losses paid 156,879 101,782 104,487 103,817 104,578 132,766
Change in:Reported case reserves 161,303 15,193 12,029 162 49,528 (23,293) IBNR 150,324 104,152 87,163 85,058 61,779 59,517 Reinsurance recoveries on paid and unpaid loss and loss expense reserves 6,448 (9,106) (1,448) (143) (784) 14,688
TOTAL NET INCURRED LOSSES AND LOSS EXPENSES 474,954$ 212,021$ 202,231$ 188,894$ 215,101$ 183,678$
Gross reserve for losses and loss expenses 2,716,165$ 2,487,275$ 2,371,404$ 2,253,568$ 2,168,011$ 1,842,992$
Prior years net favorable reserve development 34,663$ 40,638$ 33,531$ 21,131$ 23,585$ 28,626$
Key Ratios
Net paid to net incurred percentage 33.0% 48.0% 51.7% 55.0% 48.6% 72.3%
Net paid losses / Net premiums earned 39.6% 26.6% 29.1% 27.6% 27.2% 36.4%Change in net loss and loss expense reserves / Net premiums earned 80.2% 28.8% 27.2% 22.6% 28.8% 13.9%
Net loss and loss expense ratio 119.8% 55.4% 56.3% 50.2% 56.0% 50.3%
AXIS Capital Holdings LimitedRESERVE FOR LOSSES AND LOSS EXPENSES: PAID TO INCURRED ANALYSIS
REINSURANCE - QUARTERLY
Quarter ended
21
Insurance Reinsurance Total
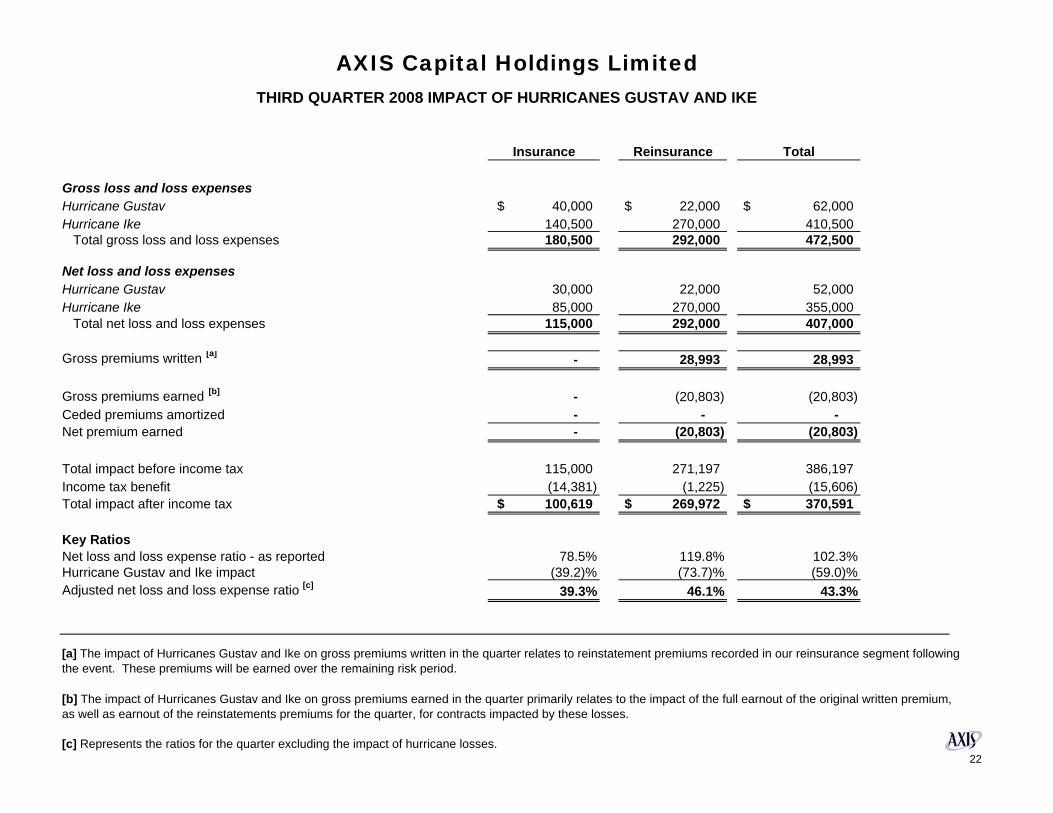
Gross loss and loss expensesHurricane Gustav 40,000$ 22,000$ 62,000$ Hurricane Ike 140,500 270,000 410,500 Total gross loss and loss expenses 180,500 292,000 472,500
Net loss and loss expensesHurricane Gustav 30,000 22,000 52,000 Hurricane Ike 85,000 270,000 355,000 Total net loss and loss expenses 115,000 292,000 407,000
Gross premiums written [a] - 28,993 28,993
Gross premiums earned [b] - (20,803) (20,803)Ceded premiums amortized - - - Net premium earned - (20,803) (20,803)
Total impact before income tax 115,000 271,197 386,197 Income tax benefit (14,381) (1,225) (15,606) Total impact after income tax 100,619$ 269,972$ 370,591$
Key RatiosNet loss and loss expense ratio - as reported 78.5% 119.8% 102.3%Hurricane Gustav and Ike impact (39.2)% (73.7)% (59.0)%Adjusted net loss and loss expense ratio [c] 39.3% 46.1% 43.3%
[c] Represents the ratios for the quarter excluding the impact of hurricane losses.
[b] The impact of Hurricanes Gustav and Ike on gross premiums earned in the quarter primarily relates to the impact of the full earnout of the original written premium, as well as earnout of the reinstatements premiums for the quarter, for contracts impacted by these losses.
AXIS Capital Holdings LimitedTHIRD QUARTER 2008 IMPACT OF HURRICANES GUSTAV AND IKE
[a] The impact of Hurricanes Gustav and Ike on gross premiums written in the quarter relates to reinstatement premiums recorded in our reinsurance segment following the event. These premiums will be earned over the remaining risk period.
� 22
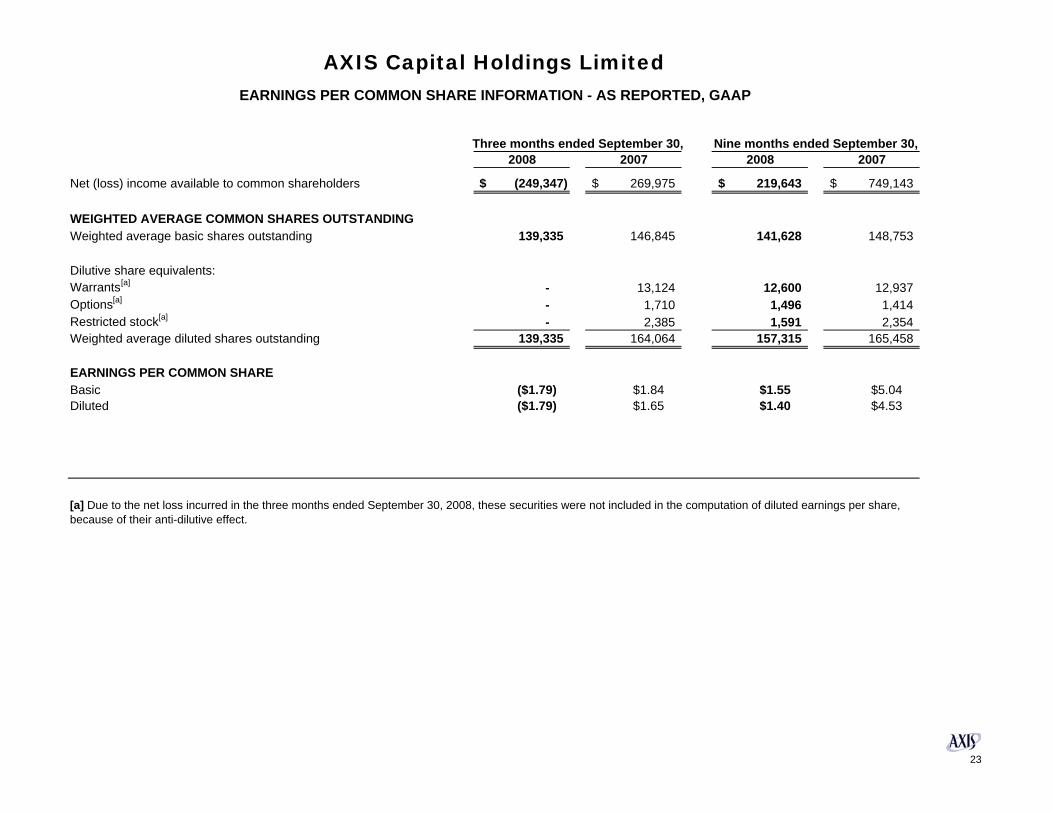
Three months ended September 30, Nine months ended September 30,2008 2007 2008 2007
Net (loss) income available to common shareholders (249,347)$ 269,975$ 219,643$ 749,143$
WEIGHTED AVERAGE COMMON SHARES OUTSTANDINGWeighted average basic shares outstanding 139,335 146,845 141,628 148,753
Dilutive share equivalents:Warrants[a] - 13,124 12,600 12,937 Options[a] - 1,710 1,496 1,414 Restricted stock[a] - 2,385 1,591 2,354 Weighted average diluted shares outstanding 139,335 164,064 157,315 165,458
EARNINGS PER COMMON SHAREBasic ($1.79) $1.84 $1.55 $5.04Diluted ($1.79) $1.65 $1.40 $4.53
[a] Due to the net loss incurred in the three months ended September 30, 2008, these securities were not included in the computation of diluted earnings per share, because of their anti-dilutive effect.
AXIS Capital Holdings LimitedEARNINGS PER COMMON SHARE INFORMATION - AS REPORTED, GAAP
23
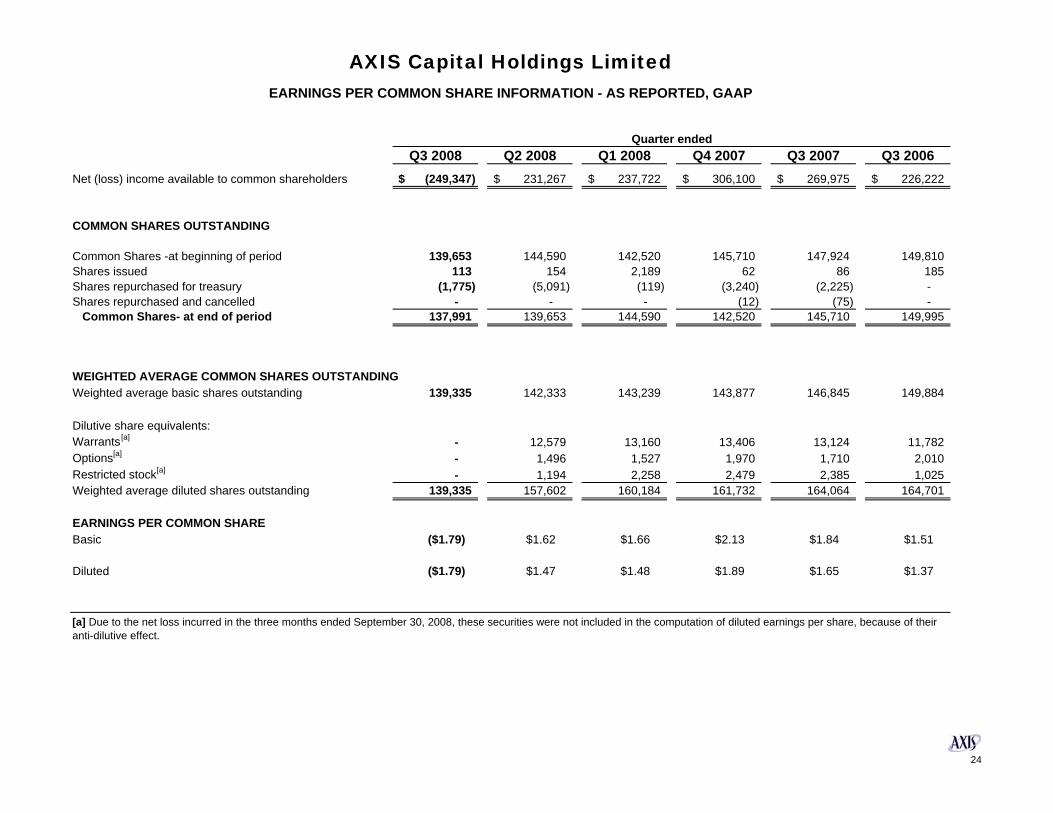
Q3 2008 Q2 2008 Q1 2008 Q4 2007 Q3 2007 Q3 2006Net (loss) income available to common shareholders (249,347)$ 231,267$ 237,722$ 306,100$ 269,975$ 226,222$
COMMON SHARES OUTSTANDING
Common Shares -at beginning of period 139,653 144,590 142,520 145,710 147,924 149,810 Shares issued 113 154 2,189 62 86 185 Shares repurchased for treasury (1,775) (5,091) (119) (3,240) (2,225) - Shares repurchased and cancelled - - - (12) (75) - Common Shares- at end of period 137,991 139,653 144,590 142,520 145,710 149,995
WEIGHTED AVERAGE COMMON SHARES OUTSTANDINGWeighted average basic shares outstanding 139,335 142,333 143,239 143,877 146,845 149,884
Dilutive share equivalents:Warrants[a] - 12,579 13,160 13,406 13,124 11,782 Options[a] - 1,496 1,527 1,970 1,710 2,010 Restricted stock[a] - 1,194 2,258 2,479 2,385 1,025 Weighted average diluted shares outstanding 139,335 157,602 160,184 161,732 164,064 164,701
EARNINGS PER COMMON SHAREBasic ($1.79) $1.62 $1.66 $2.13 $1.84 $1.51
Diluted ($1.79) $1.47 $1.48 $1.89 $1.65 $1.37
AXIS Capital Holdings LimitedEARNINGS PER COMMON SHARE INFORMATION - AS REPORTED, GAAP
[a] Due to the net loss incurred in the three months ended September 30, 2008, these securities were not included in the computation of diluted earnings per share, because of their anti-dilutive effect.
Quarter ended
24

Weighted Average
Strike Price
Common Shareholders'
Equity
Outstanding Common Shares
net of Treasury Shares Per share
Closing stock price $31.71
Book value per common share 4,101,190$ 137,991 $29.72
Dilutive securities:Warrants $12.41 - 11,989 (2.38) Restricted stocks - 5,177 (0.90) Options $21.20 - 1,017 (0.18) Phantom stock units - 65 (0.01)
Diluted book value per common share 4,101,190$ 156,239 $26.25
Weighted Average
Strike Price
Common Shareholders'
Equity
Outstanding Common Shares
net of Treasury Shares Per share
Closing stock price $38.97
Book value per common share 4,658,622$ 142,520 $32.69
Dilutive securities:Warrants $12.42 - 13,388 (2.81) Restricted stocks - 3,312 (0.60) Options $18.46 - 2,531 (0.48) Phantom stock units - 53 (0.01)
Diluted book value per common share 4,658,622$ 161,804 $28.79
[a] This method assumes that proceeds received upon exercise of options and warrants will be used to repurchase our common shares at the closing market price. Unvested restricted stock is also added to determine the diluted common shares outstanding.
AXIS Capital Holdings LimitedDILUTED BOOK VALUE PER COMMON SHARE - TREASURY STOCK METHOD [a]
At September 30, 2008
At December 31, 2007
25