investor day presentation - master
TRANSCRIPT

Investor Day PresentationFebruary 2014

2
Forward-Looking Statements
Why are we here today?
Statements about future results made in this presentation constitute forward-looking statements within the meaning of the Private Securities Litigation Reform Act of 1995. Such forward-looking statements include projections.
These statements are based on current expectations and the current economic environment. Forward-looking statements and projections are inherently subject to significant economic, competitive and other uncertainties and contingencies, many of which are beyond the control of management. The Company cautions that these statements are not guarantees of future performance. Actual results may differ materially from those expressed or implied in the forward-looking statements.
Important assumptions and other important factors that could cause actual results to differ materially from those in the forward-looking statements and projections are specified in the Company's most recently filed Form 10-K and other SEC filings.
You are cautioned not to place undue reliance on these forward-looking statements, which speak only as of the date stated, or if no date is stated, the date of our last earnings conference call.
This presentation includes certain non-GAAP financial measures as defined under SEC rules. Important information regarding such measures is contained within this presentation, including in the Glossary section.

3
Agenda
Ron Nelson Chairman and Chief Executive Officer Larry De Shon President, Europe, Middle East and Africa Pat Siniscalchi President, Latin America / Asia-Pacific
Q & A
Tom Gartland President, North America Kaye Ceille President, Zipcar
Q & A
David Wyshner Sr. Executive Vice President and CFO
Ron Nelson Chairman and Chief Executive Officer
Q & A
Lunch Avis Budget Group executives

Investor Day Presentation
Ronald L. NelsonChairman & Chief Executive Officer
February 2014

5
Years since our lastInvestor Day . . .
2014 Investor Day

6
3New brands acquired . . .
2014 Investor Day

7
256,000,000Rental days . . .
2014 Investor Day

8
$15,300,000,000 Rental revenue . . .
2014 Investor Day
9
$1,600,000,000 Adjusted EBITDA
2014 Investor Day
Note: Excluding certain items

10
$1,000,000,000 Free Cash Flow . . .
2014 Investor Day

11
19,000,000 Diluted shares repurchased . . .
2014 Investor Day
Note: Includes the effect of convertible debt repurchases

12
135% Increase in stock price . . .
2014 Investor Day
Note: Through February 14, 2014

13
$1,000,000,000Adjusted EBITDA by 2015
Why Am I So Optimistic?

14
Valuation Does Not Reflect Our Growth Prospects
Price to Earnings 14x11x
Expected EPS Growth(a) 10%25%
Free Cash Flow Yield 6%12%
(a) 2014 – 2015 CAGR(b) Based on the midpoint of our 2015 estimates(c) Source: FactSet Market AggregatesNote: Calculations are based on stock price as of 2/14/14
(b) (c)

1515
North America pricing has turned positive
EMEA integration and expansion efforts successful
Expanded our addressible market by acquiring Zipcar, Apex and Payless
Strong, stable free cash flow
Looking back…
Why Am I So Optimistic?
Progress

16
Why Am I So Optimistic?
Market:
$50 billion global industry(a)
Scale benefits
Little obsolescence risk
Critical service to travelers
Consolidation allows for rational competitive environment
Looking forward…
16
OpportunitiesAhead
(a) Source: Global Industry Analysts, Inc.

17
Why Am I So Optimistic?
Company:
Ongoing benefits from acquisitions
Technology deployment
Global shared services opportunity
Fleet costs have normalized
Smart use of Free Cash Flow:– Organic growth initiatives– Share repurchase– Acquisitions
Substantial margin enhancement
Looking forward…
17
OpportunitiesAhead

18
Expect Margin Expansion Across All Segments
2013Actual
2015Estimate Change
Adjusted EBITDA Margin
NorthAmerica 10% 11% +1 pt
International 11% 13% +2 pts
Truck 10% 12% +2 pts
Total Company 10% 11-12% +1-2 pts
Note: Excluding certain items

19
Expect Margin Expansion Across All Segments
2013Actual
LongTerm Change
Adjusted EBITDA Margin
NorthAmerica 10% 12-13% +2-3 pts
International 11% 14-15% +3-4 pts
Truck 10% 13-14% +3-4 pts
Total Company 10% 13-14% +3-4 pts
Note: Excluding certain items

2020
Strategic Plan
Driving Sustained, Profitable Growth
Strategically Accelerate
Growth
Strategically Accelerate
Growth
Put the Customer
First
Put the Customer
First
Drive Efficiency
Throughoutthe
Organization
Drive Efficiency
Throughoutthe
Organization
Expand OurGlobal
Footprint
Expand OurGlobal
Footprint
21
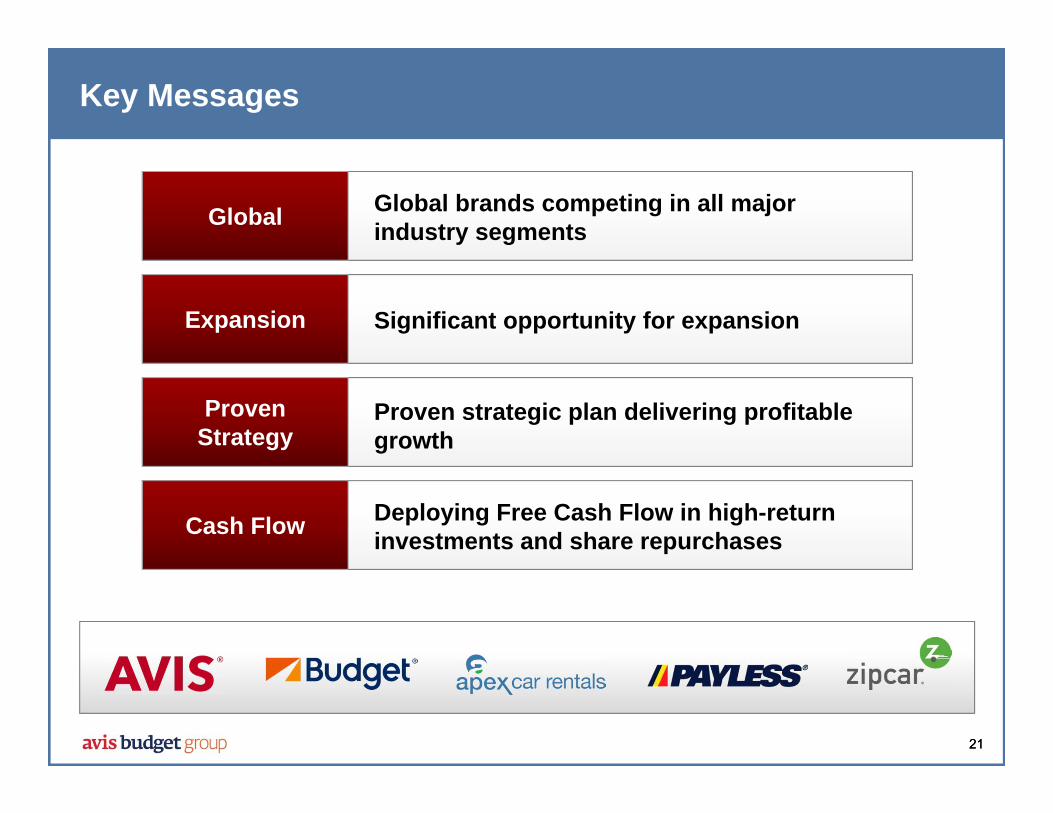
Global Global brands competing in all major industry segments
Expansion Significant opportunity for expansion
Proven Strategy
Proven strategic plan delivering profitable growth
Cash Flow Deploying Free Cash Flow in high-return investments and share repurchases
21
Key Messages

Investor Day 2014

Investor Day Presentation
Larry De ShonPresident, Europe, the Middle East and Africa
February 2014
2424
Agenda
The business today
Market dynamics
Driving sustained profitable growth

2525
A Leader in the European Car Rental Industry
1,600 locations
1,600 locations
106,000 vehicles106,000 vehicles
5 million transactions
5 million transactions
28 million rental days28 million
rental days
$1.8 billion annual
revenue

2626
Diversified Revenue Sources
Avis vs. Budget Commercial vs. Leisure
On-Airport vs. Off-Airport
Revenue by Market
11%89% 60%40% 40%60%
22%15%
18%
17%16%
12%
FranceOther
Italy
Germany
UK
Spain
Commercial
Leisure
Airport
Off-Airport
Budget share of EMEA revenue has tripled since 2011

2727
Diversified Fleet Mitigates Risk
Renault11%
Ford10%
Fiat9%
GM8%
Daimler5%
BMW5%
Other11%
Volkswagen 22%
Risk30%
Program70%
Peugeot19%
By Manufacturer By Type

28
Europe60%
Middle East and
Africa40%
Substantial and Diversified Licensee Revenue Stream
More than $80 million of High-margin Licensee Revenue
Corporate
No locationsLicensee

2929
Differentiated Brand Portfolio to Meet Customer Needs
Deep-Value Car Rental
Car Sharing
North America
EMEALatin America / Asia-Pacific
PremiumCar Rental
Mid-tierCar Rental

30
Car SharingDeep-Value
Competitive Landscape
Premium Sector
Mid-tier

3131
Agenda
The business today
Market dynamics
Driving sustained profitable growth

32
Commercial volume trends improving UK and Germany
Resilient leisure volumes but soft local commercial demandFrance
Inbound leisure improving, domestic demand still weak Italy and Spain
Market Environment: We Are Well Positioned to Benefit from Economic Recovery
Demand resilient across diversified marketsMiddle East and Africa

3333
Strong Industry Partnerships Drive Incremental Revenue
Long-Standing Relationships with Leading Travel Participants
Travel Air/Rail Corporate

3434
Agenda
The business today
Market dynamics
Driving sustained profitable growth

3535
Strategic Plan
Driving Sustained, Profitable Growth
Strategically Accelerate
Growth
Strategically Accelerate
Growth
Put the Customer
First
Put the Customer
First
Drive Efficiency
Throughoutthe
Organization
Drive Efficiency
Throughoutthe
Organization
Expand OurGlobal
Footprint
Expand OurGlobal
Footprint

36
Expected Annual Benefit($ in millions)
Phase I Synergies
(2012)
Phase II Initiatives(2013 - 2015)
$35
$55-$75
$45
$65-$75
2 Years Ago Today
$90 - $110
$110 - $120
Exceeding Targeted Operating Improvements

3737
A C C E L E R A T E G R O W T H
Capture Highly Profitable Cross Border Demand
2011 2013
International Inbound Revenue
+23%
Increasing investment and resources to drive additional cross border revenue

38
2011 2013
38
+270%
Budget Rental Days Network expanded
– Launched in Spain – Acquired licensees in Italy,
Belgium and Luxembourg– Dual-branded locations
Added to major travel partnerships
Sales team reorganized and retrained
A C C E L E R A T E G R O W T H
Budget Volume has More than Tripled Since 2011
Expect Budget to grow to nearly 20% of EMEA volume by 2016

3939
Driving sales culture
Trained almost 3,000 rental sales staff
Introduced new products
(a) Excluding gas and customer recoveries
2011 2013
Ancillary Revenue per Day(a)
+24%
A C C E L E R A T E G R O W T H
Driving Profitability Through Growth in Ancillary Products
Expect ancillary sales to increase $50 million by 2016

4040
New Budget websites across our five largest countries
Benefits include:– Loading times reduced
by 40%– Customer conversion
improved by 16%
Further developments in 2014
Targeting increases in website visitors and 20% higher conversion
A C C E L E R A T E G R O W T H
Investing in Digital Capabilities to Drive Traffic to our Most Profitable Channels

4141(a) Navigant Consulting
European car sharing market expected to reach 12 million members by 2020(a)
Zipcar currently operates in three countries More than 15 cities identified for potential expansion including
potential licensee markets
Re-branding Avis on Demand in Paris to Zipcar
A C C E L E R A T E G R O W T H
Significant Opportunity for Zipcar Expansion in EMEA

4242
E X P A N D G L O B A L F O O T P R I N T
Building a Stronger Licensee Network to Increase System Profitability
Expanding geographic presence, especially for Budget
Leveraging strong licensee partners
Growing inbound-to-licensee and outbound-from-licensee volumes
Driving improved profitability for both Avis Budget and licensees
Corporate TerritoriesOpportunity Countries
Licensee Territories

4343
C U S T O M E R F I R S T
Improving the Customer Experience

44
Increasing use of shared service centers drives savings
Organizational Transformation
Implemented regional structure to drive efficiencies
Structural Realignment
Peformance Excellence contributing to profitability
Performance Excellence
Improving utilization and productivity
Operational Excellence
D R I V E E F F I C I E N C Y
Driving Cost Savings and Process Improvements

45
2014 Outlook
Economic environment beginning to recover
Expect full year revenue growth of 4-6% driven by‒ Budget expansion revenue growth of approximately 25%‒ Increase ancillary sales by 10%
Initiative benefits ahead of original expectations
Zipcar focused on growth and expansion

4646
Key Messages
Broadest Brands
A market leader with the broadest brand portfolio
WellPositioned Well-positioned for recovery in demand
Strong Execution
Exceeding original targets through strong execution
Zipcar Opportunity Significant opportunity to expand Zipcar
Investor Day 2014

Investor Day Presentation
Pat SiniscalchiPresident, Latin America/Asia-Pacific
February 2014

4949
2012: 40-Years With Avis Budget Group . . .
My wife asked, “What are you doing?”
I said, “Nothing.”
My wife then asked, “Didn’t you do that yesterday?”
I replied, “I wasn’t finished yet.”

5050
. . . Two Years Later
My friend Bob asked, “Will that be us in ten years?”I replied, “That’s a mirror.”

5151
Agenda
The business today
Market dynamics
Growth drivers

5252
Broadest Coverage in Car Rental
Corporate Joint Venture Licensee

53
The Business Today
1,900 locations(a)
1,900 locations(a)
39,000 vehicles39,000
vehicles2 million
transactions2 million
transactions
9 million rental days
9 million rental days
$720 million annual
revenue
(a) Includes joint ventures and licensees
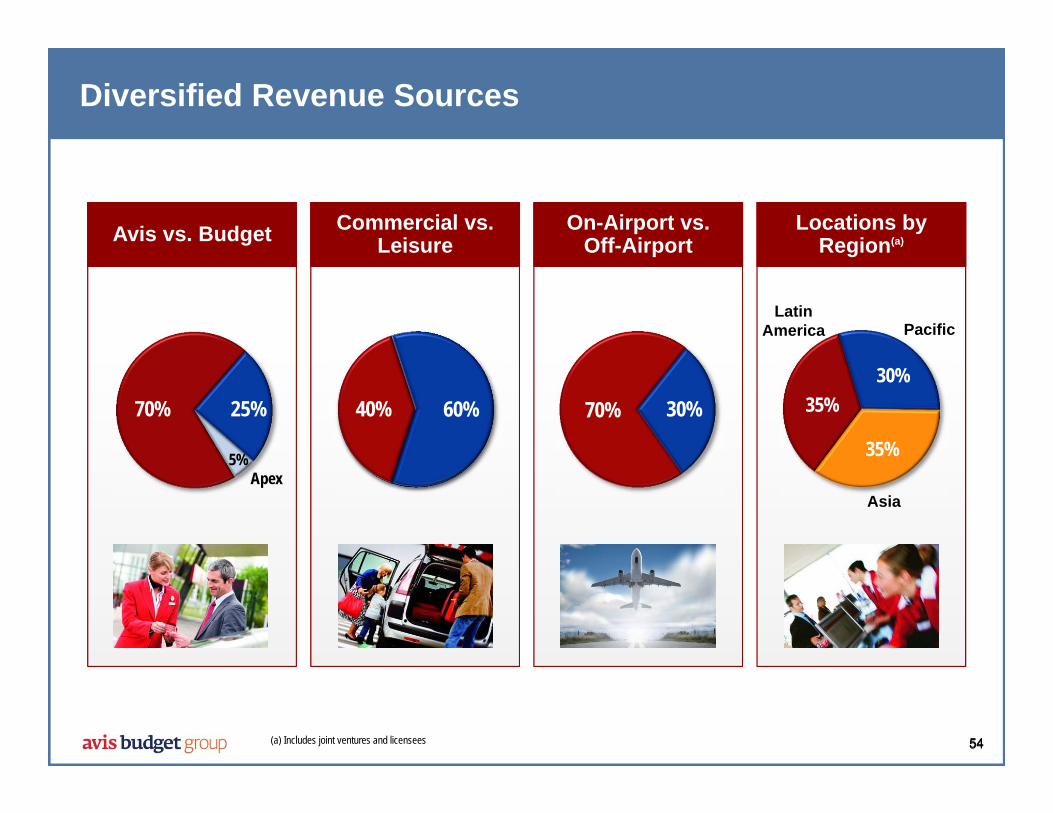
5454
Diversified Revenue Sources
Avis vs. Budget Commercial vs. Leisure
On-Airport vs. Off-Airport
Locations by Region(a)
25%
5%
70%
Apex
60%40% 30%70% 35%30%
35%
LatinAmerica Pacific
Asia
(a) Includes joint ventures and licensees
55
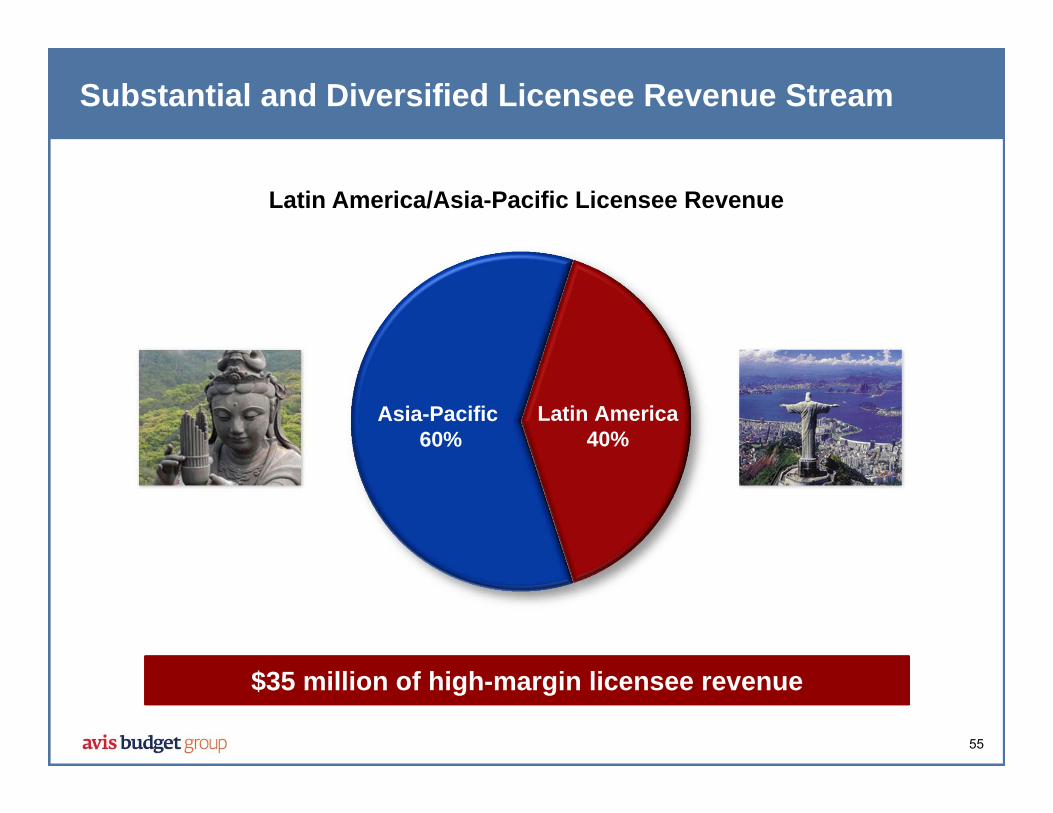
Substantial and Diversified Licensee Revenue Stream
Latin America40%
Asia-Pacific 60%
Latin America/Asia-Pacific Licensee Revenue
$35 million of high-margin licensee revenue

5656
Diversified Fleet Mitigates Risk
By Manufacturer By Car Class By Type
Small20%
Mid16%
Full23%
SUV8%
Van16%
Trucks7%
Risk85%
Ford10%
Hyundai15%
Kia6%
Nissan10%
Toyota28%
Other5%
GM18%
Program15%
Mitsubishi8% Premium
10%

57
Double-Digit Revenue Growth
$478
$720
2009 2013
Revenue($ in millions)
11%CAGR
5858
Agenda
The business today
Market dynamics
Growth drivers
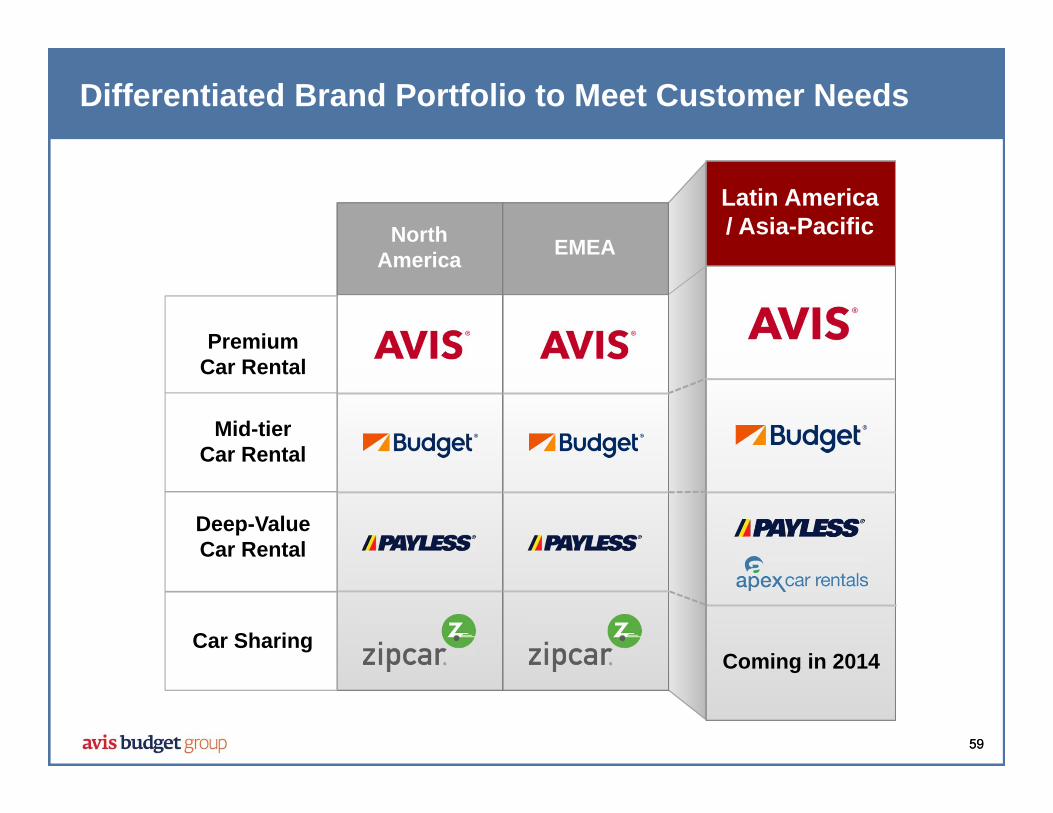
5959
Differentiated Brand Portfolio to Meet Customer Needs
Premium Car Rental
Deep-Value Car Rental
Car Sharing
North America
Coming in 2014
Latin America / Asia-Pacific
EMEA
Mid-tierCar Rental

60
Strong Positions in Australia and New Zealand
Source: Airport authorities
Strong and growing share in each country
Leading market shares in each country Our New Zealand revenue is
double our next competitor’s
Strong profitability driven by high ancillary revenue and inbound volume
Award-winning customer service

6161
Market Environment: Well-Positioned for Long-term Growth in Key Markets
Corporate and government segments rebounding slowlyAustralia
Strong economy and good inbound growthNew Zealand
2014 World Cup expected to drive incremental revenueBrazil
Car rental market continues to grow double digitsChina

6262
Key Partnerships Drive Incremental Revenue
Travel Corporate
Long-Standing Relationships with Leading Travel Participants
Air

6363
Agenda
The business today
Market dynamics
Growth drivers

6464
Strategic Plan
Driving Sustained, Profitable Growth
Strategically Accelerate
Growth
Strategically Accelerate
Growth
Put the Customer
First
Put the Customer
First
Drive Efficiency
Throughoutthe
Organization
Drive Efficiency
Throughoutthe
Organization
Expand OurGlobal
Footprint
Expand OurGlobal
Footprint

6565
A C C E L E R A T E G R O W T H
Joint Venture Investments Expected to Accelerate Profitable Growth
$30
$120
$25 $25
Brazil China India Thailand
(a) Revenue represents total revenue of Avis Budget Group’s joint ventures; India is the only joint venture whose revenues are included in the Company’s consolidated results (and only since December 2013)
Our joint ventures generated $200 millionof revenue in 2013(a)
Joint Ventures’ 2013 Revenue ($ in millions)

6666
Avis is the leading international car rental brand in China
Focusing on higher margin self-drive rentals
Profitable over last three years
A C C E L E R A T E G R O W T H
China – Second Largest Car Rental Market by 2020
Double-digit revenue growth since 2011
2013 2017
$120
$190
58%
Revenue($ in millions)

6767
Increased ownership stake to 60% in 2013
More locations than any other car rental company in India
Principally car-with-driver market
Expect to launch Budget in 2014
Joint venture revenue grew 25% in 2013
A C C E L E R A T E G R O W T H
India – The Developing Market
2013 2017
$25
$55
>100%
Revenue($ in millions)

6868
Acquired 50% ownership of existing licensee in 2013
Expect to increase fleet by 30% in 2014
Capturing high-margin inbound and outbound demand
2014 World Cup and 2016 Summer Olympics expected to drive incremental revenue
A C C E L E R A T E G R O W T H
Brazil – Capture Share in Growing Car Rental Market
2013 2017
$30
$170
~6x
Revenue($ in millions)

6969
2013 brand expansions:– Signed Avis licensees in Laos, Cambodia and Taiwan– Introduced Budget brand in Singapore and signed Budget
licensee in Colombia– Expanded Apex to four Australian cities
Opportunity to expand our deep-value brands
Expect to launch Zipcar in Australia in 2014
E X P A N D G L O B A L F O O T P R I N T
Substantial Expansion Opportunity Across Regions
7070
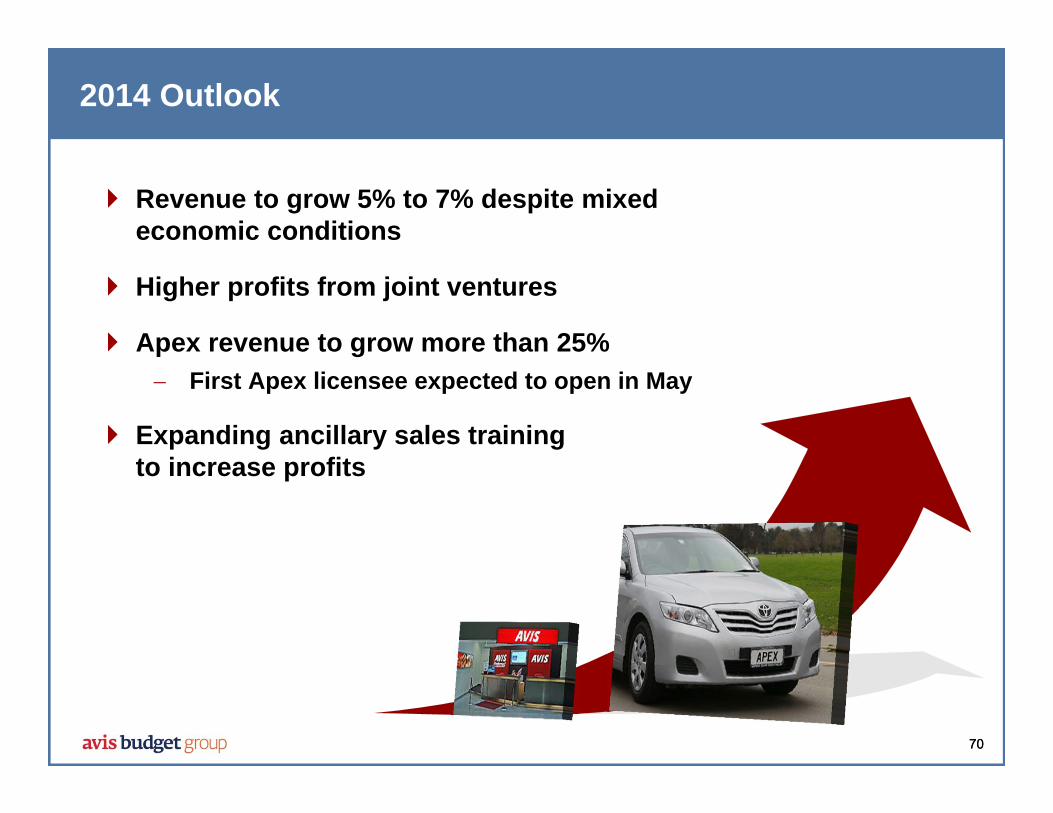
2014 Outlook
Revenue to grow 5% to 7% despite mixed economic conditions
Higher profits from joint ventures
Apex revenue to grow more than 25% First Apex licensee expected to open in May
Expanding ancillary sales training to increase profits

7171
Key Messages
Leading Brands A market leader with a broad brand portfolio
Profitable Strong profitability driven by high ancillary sales and increasing inbound volume
Growing Well-positioned to capture growth within emerging markets
Expanding Significant opportunity to expand our brands

Investor Day 2014

Investor Day Presentation
Tom GartlandPresident, North America
February 2014
74
Agenda
The business today
Market dynamics
Growth drivers

75
A Leader in North American Car Rental Industry
5,000(a)
locations5,000(a)
locations
367,000 vehicles367,000 vehicles
23 million transactions
23 million transactions
93 million rental days93 million
rental days
$5.5 billion annual
revenue
Note: Excludes Zipcar(a) Includes licensee locations

76
Diversified Revenue Sources
Avis vs. Budget Commercial vs. Leisure(a)
On-Airport vs. Off-Airport(a) Total Revenue(b)
33%
5%
62% 55%45% 25%75%
15%5%
80%
AncillaryZipcar
(a) Excludes gasoline revenue and pass-throughs(b) Excludes Payless and Truck
Zipcar

77
Balanced Revenue Between Segments
Marketing & Partnerships
54%
Unaffiliated21%
Inbound14%
Opaque5%Tour
6%
Small Business19%
Unaffiliated10%
Replacement2%
Inbound4%
Other2%
Contracted59%
Commercial$2.2B
Leisure$2.6B
Government4%
Our revenue mix continues to shift towards moreprofitable segments

78
Key Partnerships Drive Incremental Revenue
Long-Standing Relationships with Leading Industry Participants
$3 billion of annual revenue from travel andcorporate partners
Travel Air Corporate

7979
Diversified Fleet Mitigates Risk
By Manufacturer By Car Class By Type
Note: Full year 2013
Ford30%
GM18%
Nissan8%
Kia5%
Toyota8%
Hyundai4%
VW4%
Mazda3%
Other3%
Small12%
Midsize23%
Full Size19%
Midsize SUV22%
Chrysler17%
Risk67%
Program33%
Specialty &
Premium24%
High-margin specialty & premium fleet has grownalmost 15% since 2011

8080
Differentiated Brand Portfolio to Meet Customer Needs
Deep-Value Car Rental
Car Sharing
North America
EMEA
Coming in 2014
Latin America / Asia-Pacific
Premium Car Rental
Mid-tierCar Rental

8181
Earnings and Margins Have Grown
$262
$299
2011 2013
$444
$482
2011 2013
Note: Excludes Truck and Zipcar(a) Excluding certain items
Monthly Per-Unit Fleet Costs
Adjusted EBITDA(a)
(in millions)
2011 2013
Operating and SG&A Costsper Rental Day
(5%)
+8%+14%
9.9% 10.0%Margin
Lower operating costs offset higher fleet costs

8282
Agenda
The business today
Market dynamics
Growth drivers

83
Volume outpacing economic growth
Volume
Strong leisure pricing while commercial pricing remains difficult, but improving
Pricing
Relatively stable used car values
Fleet Costs
Positive Market Environment: Continued Growth and Improving Leisure Prices
Strong membership and revenue growth and incremental synergy benefits
Zipcar

84
73%
86% 87%82% 80%
2008 - 2010Average
2011 2012 2013 2014E
Residual Values Have Returned to Historical Norms . . .
Historical Residual Values
Note: U.S. Residual Values = Selling Price / Cap Cost
79%
Historicalaverage

85
. . . And We Expect Fleet Costs Will Remain Stable
$260$283
$312$347 $361
$324
$262
$239
2005 2006 2007 2008 2009 2010 2011 2012 2013 2014E
$299
LTM Monthly Per-Unit Fleet Costs(a)
(a) As of December 31, 2013; excluding Zipcar
Average
2005 2006 2007 2008 2009 2010 2011 2012 2013 2014E
2014E$300-$310
2014 per-unit fleet costs are expected to be flat to up 3%
8686
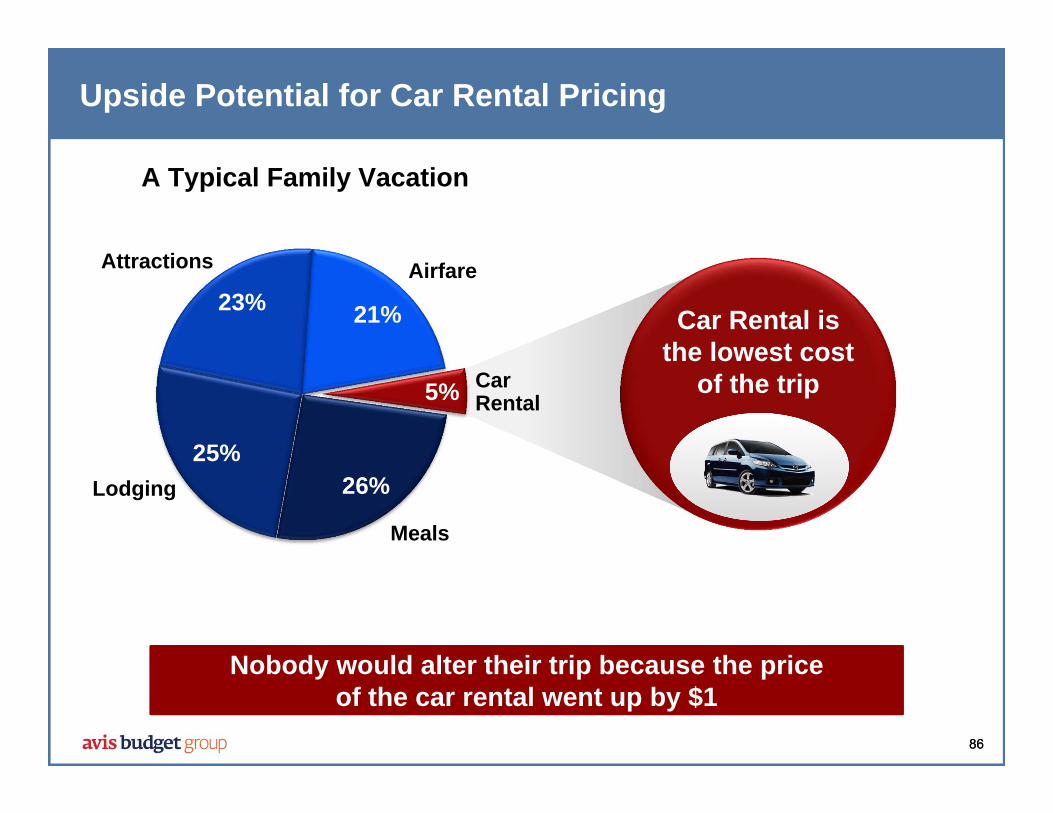
Upside Potential for Car Rental Pricing
Nobody would alter their trip because the priceof the car rental went up by $1
26%25%
23% 21%
5% CarRental
AirfareAttractions
Lodging
Meals
A Typical Family Vacation
Car Rental isthe lowest cost
of the trip

8787
Pricing and Volume Trends are Improving
86
88
2012 2013
3%
Rental Days(in millions)
2012 2013
1%
Time & Mileageper Rental Day
$40.70
$40.22
Leisure pricing increased 3% in 2013
Note: Excludes Payless and Zipcar

8888
Agenda
The business today
Market dynamics
Growth drivers

8989
Strategic Plan
Driving Sustained, Profitable Growth
Strategically Accelerate
Growth
Strategically Accelerate
Growth
Put the Customer
First
Put the Customer
First
Drive Efficiency
Throughoutthe
Organization
Drive Efficiency
Throughoutthe
Organization
Expand OurGlobal
Footprint
Expand OurGlobal
Footprint
90
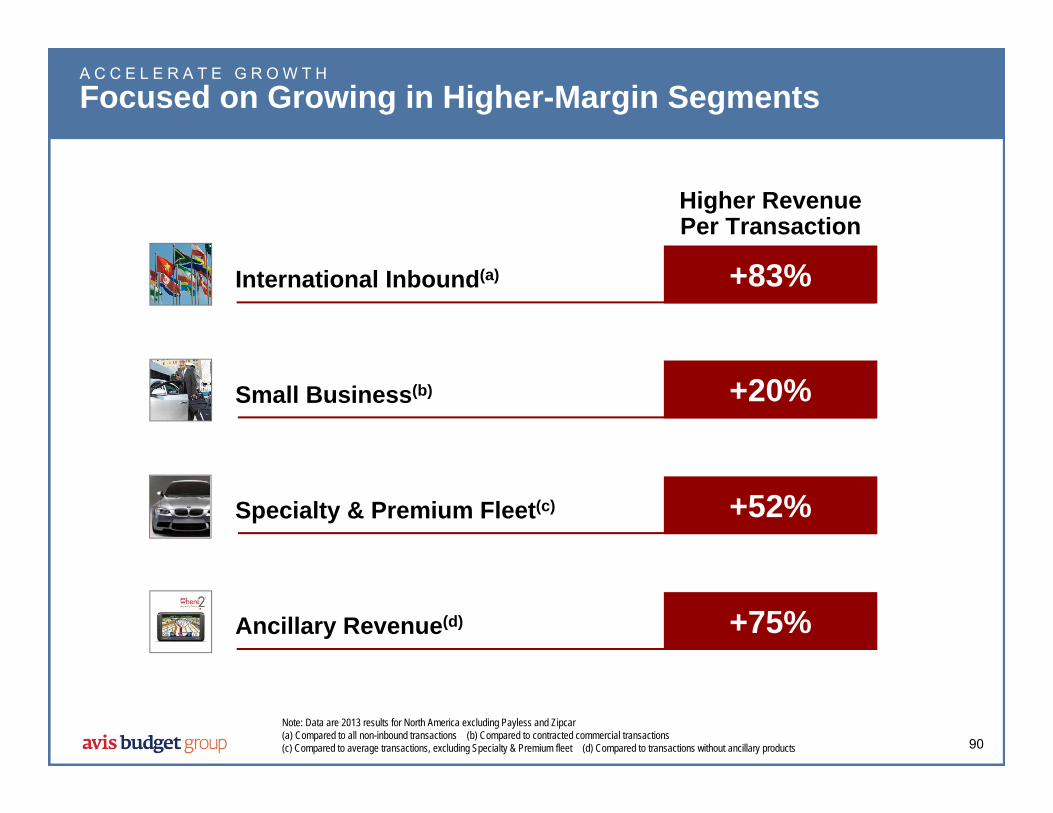
International Inbound(a) +83%
Small Business(b) +20%
Specialty & Premium Fleet(c) +52%
Ancillary Revenue(d) +75%
Note: Data are 2013 results for North America excluding Payless and Zipcar(a) Compared to all non-inbound transactions (b) Compared to contracted commercial transactions(c) Compared to average transactions, excluding Specialty & Premium fleet (d) Compared to transactions without ancillary products
A C C E L E R A T E G R O W T H
Focused on Growing in Higher-Margin Segments
Higher RevenuePer Transaction
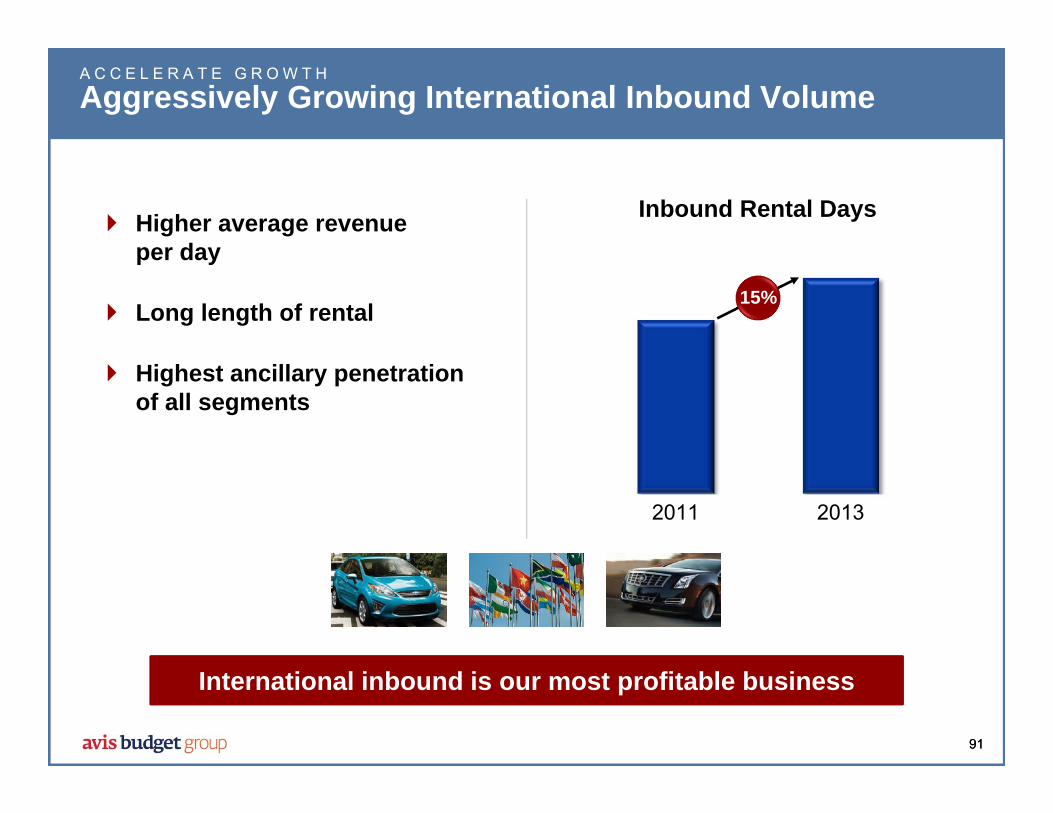
91
2011 2013
91
Higher average revenue per day
Long length of rental
Highest ancillary penetration of all segments
A C C E L E R A T E G R O W T H
Aggressively Growing International Inbound Volume
International inbound is our most profitable business
Inbound Rental Days
15%

9292
Large and fragmented market opportunity
Pricing is $5 higher per day than our large commercial accounts
Greater ancillary penetration
Low-cost customer acquisition model
A C C E L E R A T E G R O W T H
Small Business – The $1 Billion Market Opportunity
2011 2013
Small Business Revenue
10%
Small Business represents 20% of commercial revenue

9393
A C C E L E R A T E G R O W T H
Increasing our Luxury Fleet to Drive Profits
The Gross Margin on signature car rentals is doublethat of an average rental
+90%
Signature Fleet Revenue Signature Vehicle Economics(Per-unit per month)
Total Revenue $1,000 $2,000
Fleet Cost $300 $500Utilization 73% 66%
Interest Expense $50 $75
Gross Margin $650 $1,425
For illustrative purposes2012 2013
Average Signature

9494Note: Excludes Payless, Zipcar and Truck
2011 2013
Generate more than $6 per rental day in ancillary revenue with margins of approximately 75%
A C C E L E R A T E G R O W T H
Ancillary Revenue Drives Increased Profitability
Ancillary Revenue per Rental Day Ancillary Revenue Mix
RoadsideService
8%
Late Return7%
Youth & Additional Driver
5%Other 10%
Insuranceand
DamageWaivers
60%
GPS10%
+2%

9595
2011 2013
$732
$844
2011 2013
Note: Excludes Truck and Zipcar
Revenue per Store(in thousands)
2011 2013
437
756
+15%+10%
A C C E L E R A T E G R O W T H
Driving Profitable Local Market Growth
Revenue(in millions)
Co-Branded Locations
Expect to add 20 - 40 new stores annually
+73%$973
$1,070

9696
E X P A N D G L O B A L F O O T P R I N T
Payless Provides Us a Presence in Deep-Value Segment
Fastest-growing segment in the car rental industry
Leverage Avis Budget’s relationships to accelerate growth
Cascading cars to Payless allows Avis Budget Group to better manage its overall fleet
Expect 100% of fleet to be comprised of cascaded Avis and Budget cars by end of 2014

9797
C U S T O M E R F I R S T
Mobile Applications Enhance the Customer Experience
2011 2013
3x
Generates higher than average revenue per day
Growing Mobile Rentals

98
“Select & Go” provides customers choice of vehicle
Customer Relationship Management to drive customer satisfaction
New loyalty program to be launched in late 2014
C U S T O M E R F I R S T
Improving Customer Interactions to Drive Loyalty
Three out of four customers have spent more with a company because of a positive experience(b)
(a) Voice of the Customer(b) 2012 Global Customer Service Barometer
2011 2013
+6pts
Customer Satisfaction(a)
2011 2013
+6pts

9999
27
23
2012 2013
$34 $36
2012 2013
Adjusted EBITDA(a)
(in millions)
2012 2013
$71.64$76.85
(13%)
Year-End Fleet(in thousands)
Time & Mileageper Rental Day
Positions us to consistently deliver double-digit margins
D R I V E E F F I C I E N C Y
Successfully Restructured Truck Segment for Profitability
+7% +6%
(a) Excluding certain items

100
D R I V E E F F I C I E N C Y
Integrated Yield Management System Expected to Generate Incremental Profits
System expected to be fully implemented by 2015
Optimized pricing & fleet levels
$50 million incremental profits
Demand
Fleet
Pricing

101
D R I V E E F F I C I E N C Y
Utilizing Technology to Reduce Fleet Costs
Program vs. risk OEM mix Seasonal needs Car class mix Customer
preferences
Geographic allocation Mileage and usage On- vs. off-airport “Cascading”
Timing / seasonality Program vs. risk Minimizing disposal
costs Maximizing residuals
Generated $10 million of savings in 2013
Minimizing Fleet Lifecycle Costs
Acquisition Deployment Disposition

102
D R I V E E F F I C I E N C Y
Expanding Alternative Disposal Channels to Reduce Fleet Costs
Our combined direct-to-dealer and direct-to-consumercar sales have doubled since 2011
Expanding dealer-direct sales
AutoNation partnership drives direct-to-consumer sales
(a) Excluding auction simulcast sales
(a)
$0
$250
$400 TBD
TraditionalAuction
InternetSales
Direct-to-Dealer
On-lineRetail
Alternative Disposal Channel Benefits

103103
2014 Outlook
Revenue growth of 4-6%– Volume to grow 3-5%– Pricing expected to increase approximately 1%
Per-unit fleet costs expected to be flat to up 3%
Continued operational efficiencies to deliver incremental savings

104
Leading Brands Industry leader with a multi-brand strategy
Profitable Aggressively targeting price increases
Focused Focused on maintaining double-digit margins
Growing Strategic initiatives drive sustainable long-term growth
104
Key Messages
Investor Day 2014

Investor Day Presentation
Kaye CeillePresident, Zipcar
February 2014

107107
Agenda
The Zipcar way
Synergies
Growth opportunities

108108
Clear and Simple Value Proposition

109109
Award Winning Technology
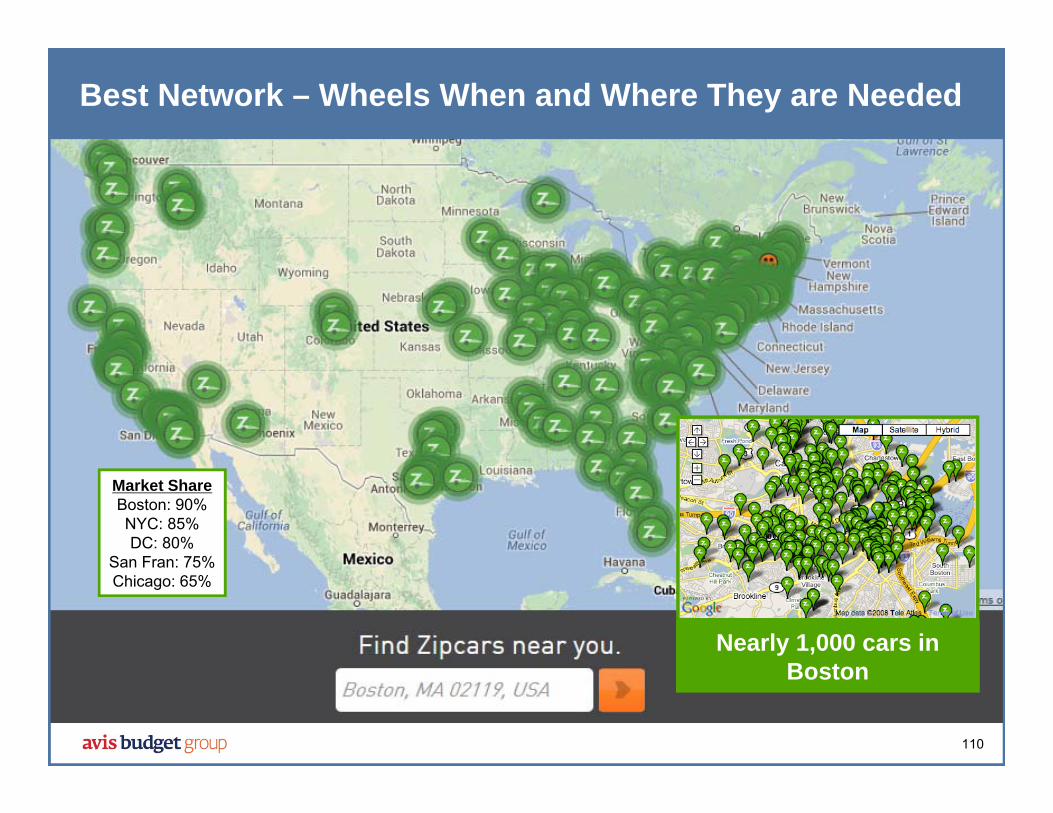
110
Nearly 1,000 cars in Boston
Best Network – Wheels When and Where They are Needed
Market ShareBoston: 90%NYC: 85%DC: 80%
San Fran: 75%Chicago: 65%

111111
Trusted Brand

112112
World Class Customer Loyalty
2013 Net Promoter Scores
Two-thirds of Zipsters would recommend Zipcar to their friendsTwo-thirds of Zipsters would recommend Zipcar to their friends
Source: researchscape.com
5950
3632
27 24
6
65
2518

113
Diverse and Growing Membership Base

114
Millennial View of Car Ownership is a Tailwind
• 22% of licensed drivers are twenty-something or teenagers(a)
• 53% claim that high costs of ownership make it hard to own a car(b)
• 50% say they would drive less if options were available(b)
• 35% report that they are actively seeking alternatives(b)
(a) University of Michigan Transportation Research Institute(b) Zipcar Millennial Survey 2013-2014

115
Key Criteria for Market Expansion High population density High costs of car ownership
Strong public transportation systems Solid, developing middle-class
Estimates of Potential Market Size Based on Frost & Sullivan Study and Zipcar Study
Substantial Market Potential
North America
$3B+
Europe$3B+
Asia Pacific
$4B

116
0
2
4
6
8
10
12
14
2013 2014 2015 2016 2017 2018 2019 2020
116
Category Expected to Add 10 Million Members by 2020
Total Members By Region (millions)
Source: Navigant Research
North America
Europe
Asia Pacific
Latin America
Middle East & Africa

117117
Agenda
The Zipcar way
Synergies
Growth opportunities
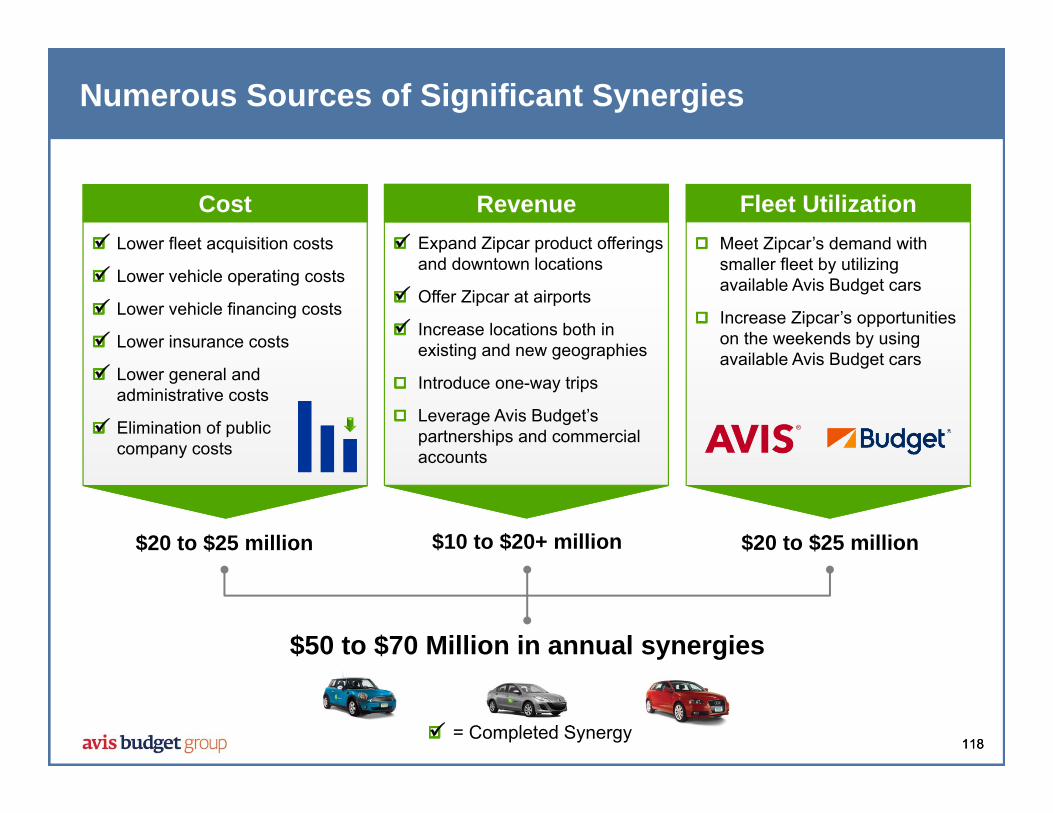
118118
Numerous Sources of Significant Synergies
Lower fleet acquisition costs
Lower vehicle operating costs
Lower vehicle financing costs
Lower insurance costs
Lower general and administrative costs
Elimination of public company costs
Cost
$20 to $25 million $20 to $25 million$10 to $20+ million
= Completed Synergy
Expand Zipcar product offerings and downtown locations
Offer Zipcar at airports
Increase locations both in existing and new geographies
Introduce one-way trips
Leverage Avis Budget’s partnerships and commercial accounts
Revenue
Meet Zipcar’s demand with smaller fleet by utilizing available Avis Budget cars
Increase Zipcar’s opportunities on the weekends by using available Avis Budget cars
Fleet Utilization
$50 to $70 Million in annual synergies

119
Fleet Utilization Will Generate Substantial Benefits
Note: Illustrative utilization data
$20+ Million Opportunity
100%
0
20
40
60
80
100
120
0
10
20
30
40
50
60
70
80
Monday Tuesday Wednesday Thursday Friday Saturday Sunday
Flee
t Util
izat
ion
Zipcar Avis Budget
0%
Zipcar in excess fleet position: $10+ million cost savings opportunity
Zipcar has unsatisfied demand when Avis Budget has excess fleet:
$10+ million revenue opportunity
Expect to be sharing 1,500 cars by mid-2014Expect to be sharing 1,500 cars by mid-2014

120
Substantial Progress Made Toward Achieving Synergies
120
Launched Zipcar in six metropolitan markets and 28 airports
Expand Availability
Consolidated non-customer facing efforts reducing SG&A by 13%
Reduced SG&A
Leveraging Avis Budget partnerships and corporate accounts
New Revenue Sources
Leveraging Avis Budget’s purchasing power lowers Zipcar’s per-unit fleet cost by 25%
Lower Fleet Costs
Sharing fleet in 14 metropolitan marketsFleet
Sharing

121121
Anticipated Synergy Timetable
2013 2014 2015
$9
Realized / Expected Synergies($ in millions)
$25 - $30
$45 - $50
Year-end Run-rate $20$20 $35 - $40$35 - $40 $50 - $70$50 - $70

122122
Agenda
The Zipcar way
Synergies
Growth opportunities

123123
Substantial Growth Opportunities
1234
Expand within current markets
Broaden product service offerings
Add new geographic markets
Extend leading edge technology

124124
1. Expand Within Current Markets
Grow membership to 1 million Zipsters by 2015
Increase usage per member by introducing new use cases
Improve availability by 25% by sharing cars
Leverage Avis Budget Group’s existing partnerships
Expand FastFleet by Zipcar

125125
2. Broaden Product and Service Offerings
Offer one-way trips
Flexible memberships for light users
Increase daily and weekend vehicle availability
More than double premium vehicles
28
>150
Current Goal
Airport Presence
126126
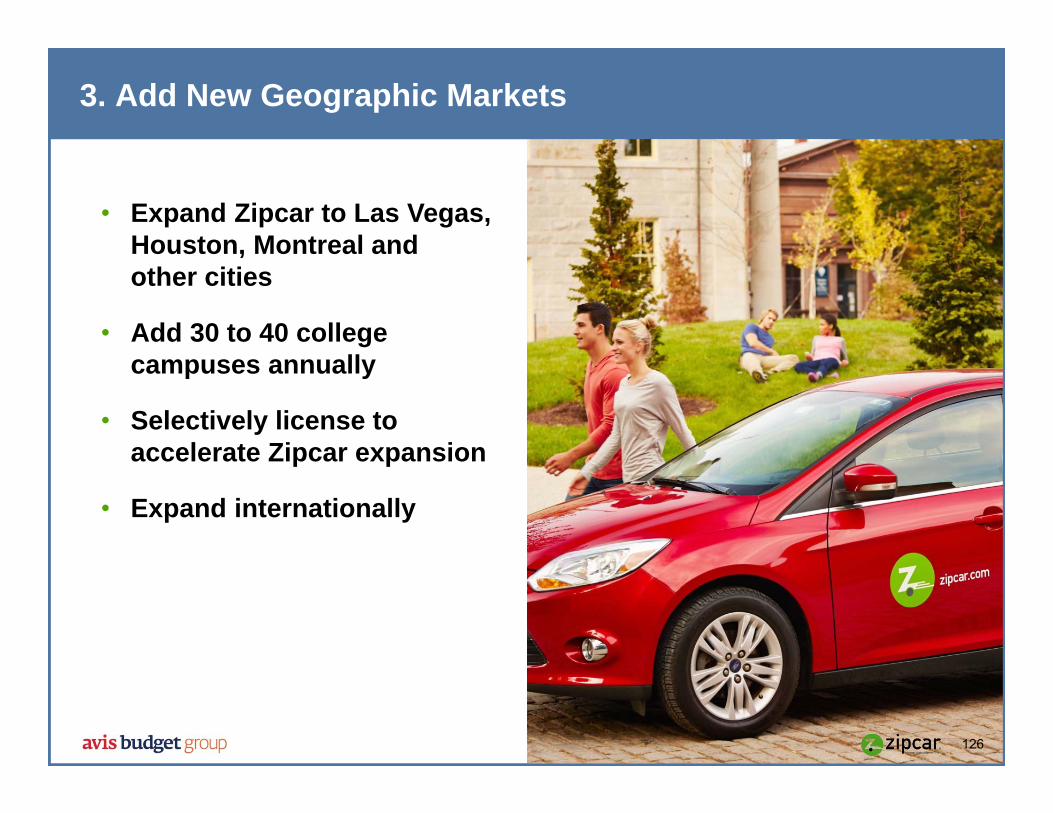
3. Add New Geographic Markets
• Expand Zipcar to Las Vegas, Houston, Montreal and other cities
• Add 30 to 40 college campuses annually
• Selectively license to accelerate Zipcar expansion
• Expand internationally

127127
4. Extend Leading Edge Technology
• “Join and Drive” mobile membership application
• “Smart Parking” for one-way rentals
• Next generation technology enables better fleet management and delivers new value to members

128
• Obsess about the member experience
• Double-digit member and revenue growth
• Expand Zipcar’s presence and availability
• Deliver on synergy targets
128
2014 Outlook

129
Zipcar is the brand leader in the industry
129
Key Messages
Car sharing represents a large, globalgrowth opportunity
Achieving significant synergies
Multiple avenues for growth

Investor Day 2014

Investor Day Presentation
David WyshnerSr. Executive Vice President and Chief Financial Officer
February 2014

132132
Agenda
The business today
Global performance drivers
Projected earnings growth
Generating and deploying Free Cash Flow

133133
A Global Leader in the Car Rental Industry
10,000 locations
10,000 locations
520,000 vehicles520,000 vehicles
35 million transactions
35 million transactions
130 million rental days130 million rental days
$8 billion annual
revenue

134134
Diversified Revenue Sources
Avis vs. Budget Commercial vs. Leisure
On-Airport vs. Off-Airport
30%65% 55%45%
North America vs. International
35%65%30%70%
Zipcar
Locations in more than 175 countries and a leading position in most major markets

135
We Have a Highly Variable Cost Structure . . .
Fixed25%
Variable 75%
Direct OperatingCosts
100%Fleet Costs
SG&A Costs
75% 25%
75% 25%
Variable Costs Fixed Costs
136
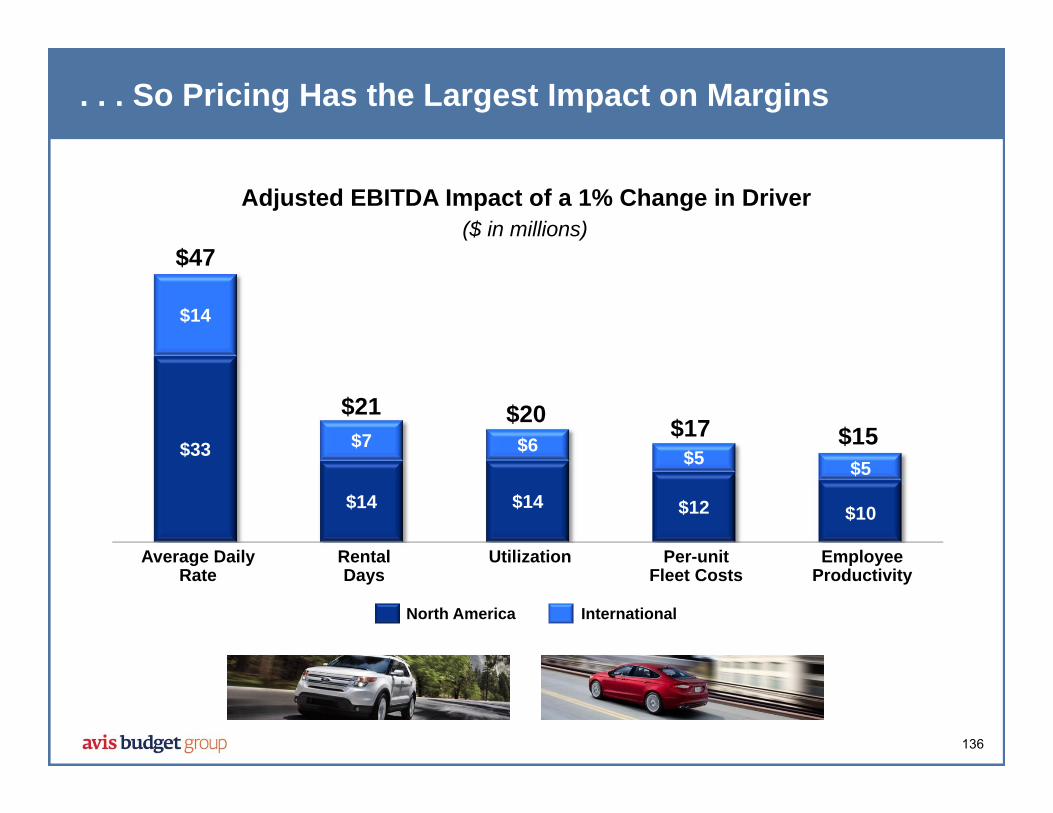
$33
$14 $14 $12
$14
$7 $6 $5
Average Daily Rate
RentalDays
Utilization Per-unit Fleet Costs
Employee Productivity
Adjusted EBITDA Impact of a 1% Change in Driver($ in millions)
. . . So Pricing Has the Largest Impact on Margins
North America International
$47
$21 $20 $17 $15$5
$10

137137
Significant Profit Margin Expansion
$410
$769
2010 2013
Adjusted EBITDA(a)
($ in millions)
23%CAGR
7.9%Margin
9.7%Margin
(a) Excluding certain items
180 basis points of margin improvement
138
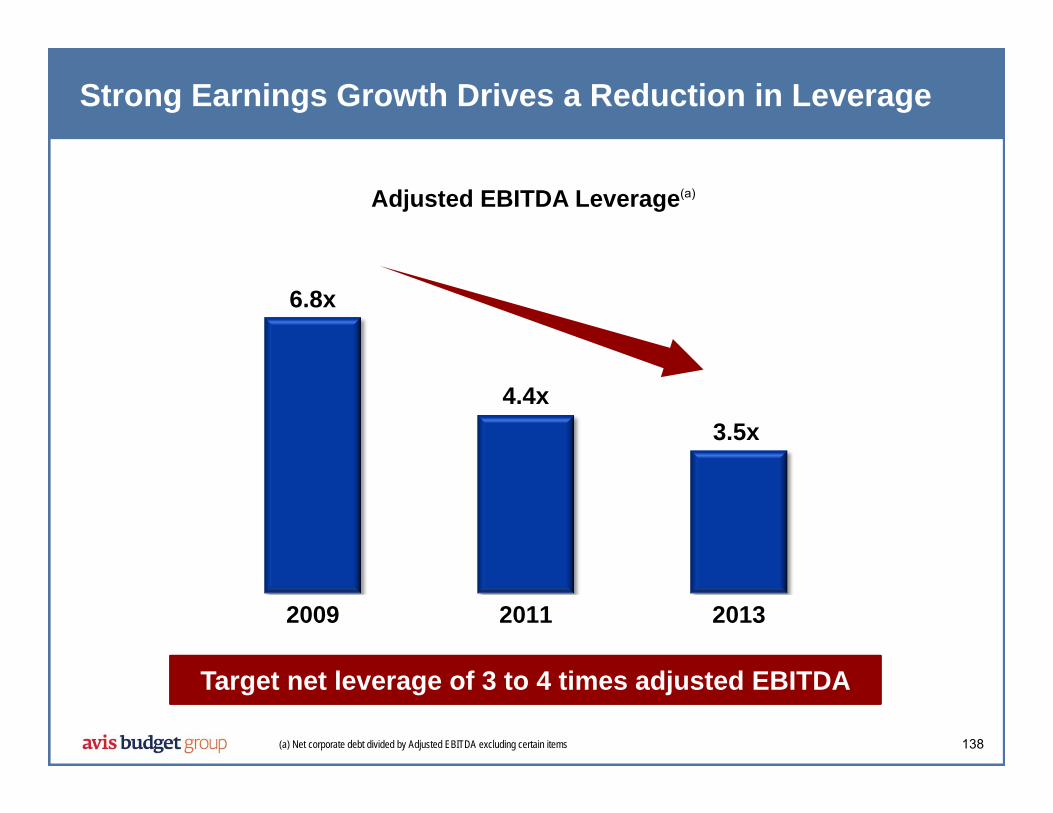
6.8x
4.4x3.5x
2009 2011 2013
Strong Earnings Growth Drives a Reduction in Leverage
(a) Net corporate debt divided by Adjusted EBITDA excluding certain items
Adjusted EBITDA Leverage(a)
Target net leverage of 3 to 4 times adjusted EBITDA

139139
We Had a Successful 2013 Despite Higher Fleet Costs
(a) Excludes certain items (b) North America
$840$769
2012AdjustedEBITDA
2013AdjustedEBITDA
Revenue
Other
Per-unitFleetCosts(b)
+$105+$50 ($190)
($36)
Adjusted EBITDA Impact(a)
Synergies
Total volume +3%
North America pricing +1%
Budget growth in Europe
Zipcar acquisition
EMEA cost synergies
Zipcar integration
Non-vehicle inflation, net
Offset by operational efficiencies
$125+ million impact from very low 2012 fleet costs
Weak residual values in spring 2013

140140
Agenda
The business today
Global performance drivers
Projected earnings growth
Generating and deploying free cash flow

141
Perf
orm
ance
Driv
erKey Performance Drivers
Profitable revenue growth Process improvement and cost control Investment in technology Acquisition synergies Fleet and yield optimization
Global strategies, regional execution

142
1. Focused on Growing in More Profitable Segments and Channels . . .
Opaque
GovernmentInsurance
ReplacementLarge
CommercialLarge
Commercial
Marketing &PartnershipsMarketing &Partnerships
InternationalInbound
SmallBusiness
Mid-MarketCommercialMid-MarketCommercial
Segment Profitability Matrix
Average Profitability
Specialty & PremiumVehicles
2009Growth
Rate

143
1. Focused on Growing in More Profitable Segments and Channels . . .. . . Which Has Been a Key Driver of Our Profit Growth
Segment Profitability Matrix
Average Profitability
CurrentGrowth
Rate
Opaque InsuranceReplacement
Large Commercial
Large Commercial
Marketing &PartnershipsMarketing &Partnerships
Mid-MarketCommercialMid-MarketCommercial
Government
Specialty& Premium
Vehicles
InternationalInbound
SmallBusiness

144144
2. Process Improvement and Cost Control
(a) North America only
Transactions per employee since 2007(a) Up 9%
Performance Excellence contribution each year $50 million
Use of shared service centers Increased
Focus on costs Relentless

145145
3. Targeted Investment in Technology Drives Revenue and Profit Growth
Higher conversion rate
Higher ancillary sales & average rate
Lower third-party commissions
Higher customer satisfaction
2012 2014
New website benefits

146
Target Achieved
146
4. Transaction Integration Is a Core Competency
$104
$75
Synergy Benefits(a)
($ in millions)
(a) On a run-rate basis
Target NewTarget
$85 - $105
$110 - $120
$50 - $70
2013 Acquisitions
$15
Europe

147147
5. Fleet Optimization Already Delivering Benefits
Car Class
Manufacturer
Model
Risk / ProgramTiming of in-fleeting
Location
Hold Period
Sales Channel
$30 million(a)
(a) By 2015
DeploymentDeployment
Numerous decision points for 520,000 vehicles = opportunity for optimization to add value

148148
Rental Car Pricing Has Lagged the Travel Industry
2009 2013 2009 2013
(a) Source: BTS Transtats
Airfare(a) Avis Budget Group T&M per Day
2009 2013
HotelRevPAR(a)
+31% (4%)+23%
Significant opportunity for pricing improvement

149
+3%
+1%
2013 Time & Mileage per Rental Day(North America)
While Our Pricing Improved in 2013 . . .
(1%)
149
CommercialLeisure Total

150150
. . . Yield Optimization is Still in the Early Stages
Automation Optimization
Worth a point of price and a point of utilization

151151
Agenda
The business today
Global performance drivers
Projected earnings growth
Generating and deploying free cash flow

152
Avis Europe Synergies
ZipcarSynergies
Operational Efficiencies
Performance Excellence
Budget expansion
Cost savings
Cost savings
Fleet utilization
Revenue opportunities
$55 to $75million
$50 to $70million
$100million
Key Initiatives Generating Significant Benefits
Yield management
Fleet optimization
Process improvement
(Phase II)

153
Zipcar & Payless Synergies
Avis Europe Synergies
Operational Efficiencies
Performance Excellence
Budget expansion
Cost savings
Cost savings
Fleet utilization
Revenue opportunities
$65 to $75million
$65 to $85million
$125million
Key Initiatives Generating Significant Benefits
Yield management
Fleet optimization
Process improvement
(Phase II)
Achieved in 2013
+$15 million+$15 million +$25 million +$25 million
$20 million $10 million $30 million
+$5 million+$5 million

154154
Key Drivers of 2014 Growth
$769
$865
2013AdjustedEBITDA
2014AdjustedEBITDA
(a) Excluding certain items(b) Excludes Payless(c) North AmericaNote: Based on the midpoint of our 2014 estimates
Revenue
ExpensesSynergies Fleet Costs+$130+$55 ($30)
($60)
Adjusted EBITDA
Non-vehicle inflation
Offset by operational efficiencies
EMEA cost synergies
Zipcar
Payless
Residual value decline of 2 points(c)
Offset by fleet optimization benefits
Volume growth
North America pricing +1%(b)
Yield management
($ in millions)
(a)

155155
The Path to $1 Billion of Adjusted EBITDA by 2015
$865
$1,000
2014AdjustedEBITDA
2015AdjustedEBITDA
Revenue
ExpensesSynergies Fleet Costs+$140+$55 ($30)
($30)
Note: Based on the midpoint of our 2015 estimates
Adjusted EBITDA
Non-vehicle inflation
Offset by operational efficiencies
EMEA cost synergies
Zipcar
PaylessVolume growth
North America pricing up slightly
Yield management
Fleet inflation
Offset by fleet optimization benefits
($ in millions)

156156
Agenda
The business today
Global performance drivers
Projected earnings growth
Generating and deploying Free Cash Flow

157157
Strong Cash Flow Generation in 2013
2013 Actual
Adjusted EBITDA(a) $769
Corporate interest (228)
Capital expenditures (154)
Cash taxes (58)
Working capital, vehicle programs and other 131
Free Cash Flow $460
($ in millions)
Generated approximately $4 of Free Cash Flow per share
(a) Excluding certain items

158158
Deployment of Free Cash Flow
ShareRepurchases
11%
CashIncrease
19%
PaylessAcquisition
10%
BrazilInvestment
10%
$460 Million Free Cash Flow Use
(a) Excludes borrowings incurred to acquire Zipcar(b) Including convertible debt repurchases
Debt Repayments(a)
13%
Other2%
Convertible DebtRepurchases
22%
Transaction-Related Payments
13%
Repurchased over five million diluted shares in 2013(b)

159159
Roughly $1 Billion of Free Cash Flow by 2015
Will generate over $8 of free cash flow per share
2014E 2015E
Adjusted EBITDA $865 $1,000
Corporate interest (220) (220)
Capital expenditures (190) (200)
Cash taxes (70) (80)
Working capital, vehicle programs and other 25 40
Free Cash Flow $410 $540
($ in millions)
Note: Based on midpoints of our 2014 and 2015 estimates

160160
Planned Uses of Free Cash Flow in 2014 and 2015
Share repurchases
Tuck-in acquisitions– includes licensees
Mix will depend on available opportunities

161
Debt Refinancing Remains a Substantial Opportunity
2014 2015 2016 2017 2018 2019 2020 2021 2022 2023
$685
$1,000
$1,685
€250
$65
$550
$225
8.25% notes are callable in 2014
9.75%$500
Corporate Debt Maturities(in millions)
Term LoanSenior NotesConvertible Notes

162162
Key Messages
StrongPerformance Strong financial performance
Focused Focused on profitable growth
GlobalOpportunities Multiple opportunities to grow globally
Profitable Generating significant earnings and Free Cash Flow

Investor Day 2014
164
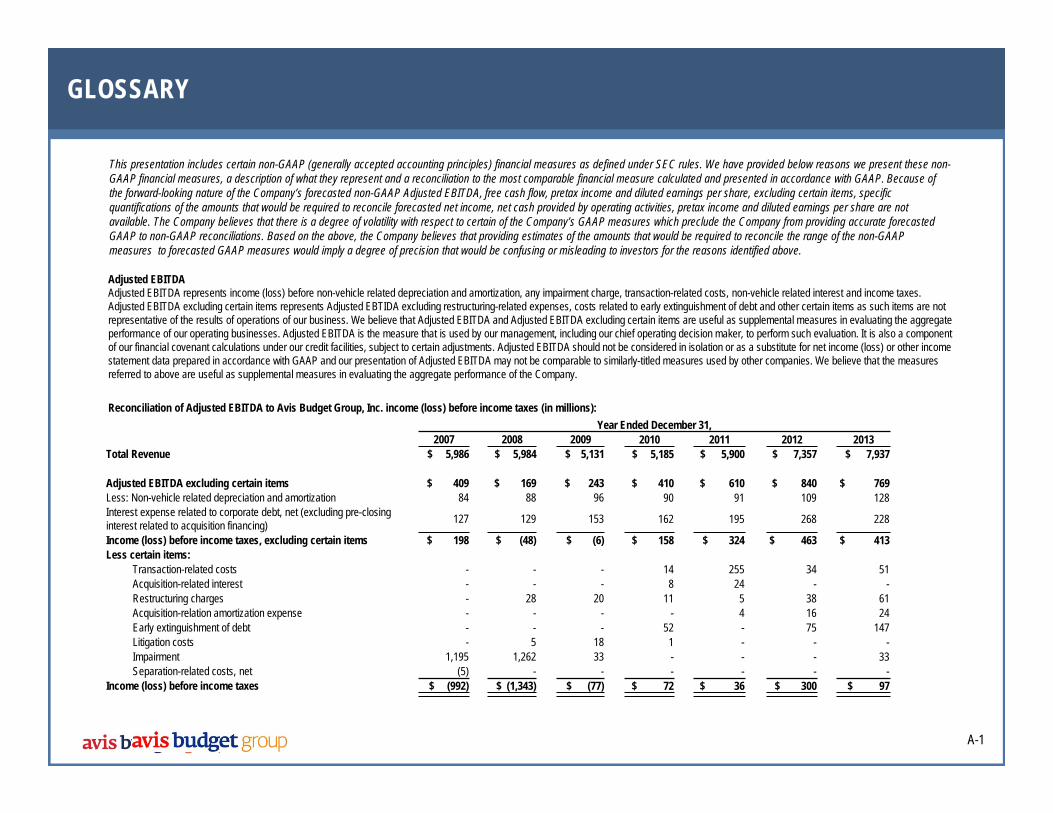
Adjusted EBITDAAdjusted EBITDA represents income (loss) before non-vehicle related depreciation and amortization, any impairment charge, transaction-related costs, non-vehicle related interest and income taxes. Adjusted EBITDA excluding certain items represents Adjusted EBTIDA excluding restructuring-related expenses, costs related to early extinguishment of debt and other certain items as such items are not representative of the results of operations of our business. We believe that Adjusted EBITDA and Adjusted EBITDA excluding certain items are useful as supplemental measures in evaluating the aggregate performance of our operating businesses. Adjusted EBITDA is the measure that is used by our management, including our chief operating decision maker, to perform such evaluation. It is also a component of our financial covenant calculations under our credit facilities, subject to certain adjustments. Adjusted EBITDA should not be considered in isolation or as a substitute for net income (loss) or other income statement data prepared in accordance with GAAP and our presentation of Adjusted EBITDA may not be comparable to similarly-titled measures used by other companies. We believe that the measures referred to above are useful as supplemental measures in evaluating the aggregate performance of the Company.
Reconciliation of Adjusted EBITDA to Avis Budget Group, Inc. income (loss) before income taxes (in millions):
This presentation includes certain non-GAAP (generally accepted accounting principles) financial measures as defined under SEC rules. We have provided below reasons we present these non-GAAP financial measures, a description of what they represent and a reconciliation to the most comparable financial measure calculated and presented in accordance with GAAP. Because of the forward-looking nature of the Company’s forecasted non-GAAP Adjusted EBITDA, free cash flow, pretax income and diluted earnings per share, excluding certain items, specific quantifications of the amounts that would be required to reconcile forecasted net income, net cash provided by operating activities, pretax income and diluted earnings per share are not available. The Company believes that there is a degree of volatility with respect to certain of the Company’s GAAP measures which preclude the Company from providing accurate forecasted GAAP to non-GAAP reconciliations. Based on the above, the Company believes that providing estimates of the amounts that would be required to reconcile the range of the non-GAAP measures to forecasted GAAP measures would imply a degree of precision that would be confusing or misleading to investors for the reasons identified above.
GLOSSARY
A-1
Year Ended December 31,2007 2008 2009 2010 2011 2012 2013
Total Revenue $ 5,986 $ 5,984 $ 5,131 $ 5,185 $ 5,900 $ 7,357 $ 7,937
Adjusted EBITDA excluding certain items $ 409 $ 169 $ 243 $ 410 $ 610 $ 840 $ 769Less: Non-vehicle related depreciation and amortization 84 88 96 90 91 109 128Interest expense related to corporate debt, net (excluding pre-closing interest related to acquisition financing) 127 129 153 162 195 268 228
Income (loss) before income taxes, excluding certain items $ 198 $ (48) $ (6) $ 158 $ 324 $ 463 $ 413Less certain items:
Transaction-related costs - - - 14 255 34 51Acquisition-related interest - - - 8 24 - -Restructuring charges - 28 20 11 5 38 61Acquisition-relation amortization expense - - - - 4 16 24Early extinguishment of debt - - - 52 - 75 147Litigation costs - 5 18 1 - - -Impairment 1,195 1,262 33 - - - 33Separation-related costs, net (5) - - - - - -
Income (loss) before income taxes $ (992) $ (1,343) $ (77) $ 72 $ 36 $ 300 $ 97

165
Reconciliation of net income, excluding certain items to net income (loss):
GLOSSARY
Year Ended December 31,2010 2011 2012 2013
Earnings per share, excluding certain items (diluted) $ 0.90 $ 1.65 $ 2.43 $ 2.20Shares used to calculate Earnings per share, excluding certain items (diluted) 126.7 128.9 121.6 116.6
Net income (loss), excluding certain items $ 107 $ 206 $ 291 $ 256Less certain items, net of tax:
Transaction-related expenses 8 215 30 41Acquisition-related interest 5 14 - -Restructuring charges 7 3 27 40Acquisition-relation amortization expense - 3 11 16Early extinguishment of debt 32 - 61 110Litigation costs 1 - - -Non-cash income tax benefit for pre-2007 taxes (128) -
Net income (loss) $ 54 $ (29) $ 290 $ 16
A-2
Reconciliation of Net Corporate Debt (in millions):Year Ended December 31
2009 2010 2011 2012 2013Net corporate debt $ 1,649 $ 1,591 $ 2,671 $ 2,299 $ 2,701Plus: Cash and cash equivalents 482 911 534 606 693Corporate debt $ 2,131 $ 2,502 $ 3,205 $ 2,905 $ 3,394
166
GLOSSARY
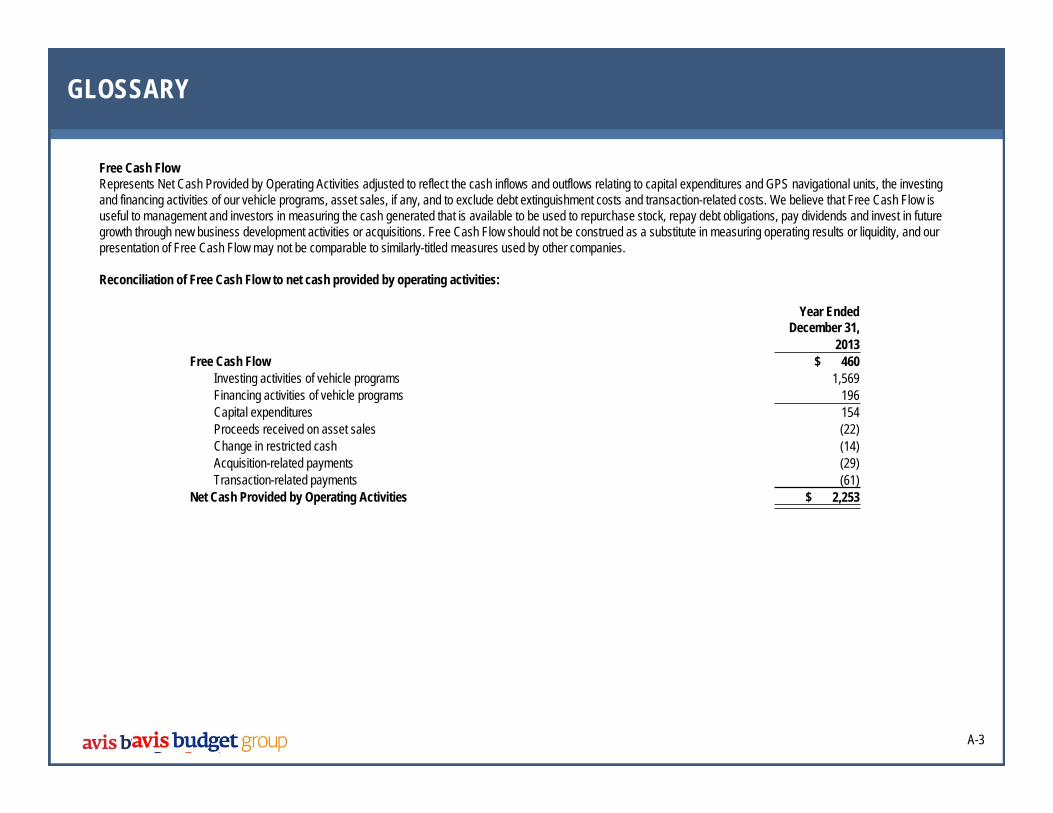
Free Cash FlowRepresents Net Cash Provided by Operating Activities adjusted to reflect the cash inflows and outflows relating to capital expenditures and GPS navigational units, the investing and financing activities of our vehicle programs, asset sales, if any, and to exclude debt extinguishment costs and transaction-related costs. We believe that Free Cash Flow is useful to management and investors in measuring the cash generated that is available to be used to repurchase stock, repay debt obligations, pay dividends and invest in future growth through new business development activities or acquisitions. Free Cash Flow should not be construed as a substitute in measuring operating results or liquidity, and our presentation of Free Cash Flow may not be comparable to similarly-titled measures used by other companies.
Reconciliation of Free Cash Flow to net cash provided by operating activities:
Year EndedDecember 31,
2013Free Cash Flow $ 460
Investing activities of vehicle programs 1,569Financing activities of vehicle programs 196Capital expenditures 154 Proceeds received on asset sales (22)Change in restricted cash (14) Acquisition-related payments (29)Transaction-related payments (61)
Net Cash Provided by Operating Activities $ 2,253
A-3

167
GLOSSARY
Avis Budget Group AttendeesJohn BarrowsVice President, Corporate Communications
Bryon KoepkeSenior Vice President and Chief Securities Counsel
David CalabriaVice President and Assistant Treasurer
Ned LinnenChief Human Resources Officer
Kaye CeillePresident, Zipcar
Kristen MaloneyVice President, Strategic Customer Leadership
David CrowtherSenior Vice President, Finance, North America
Izzy MartinsSenior Vice President & Acting Chief Accounting Officer
Larry De ShonPresident, Europe, Middle East and Africa
Gerard MonuskySenior Vice President, Finance, Latin America / Asia-Pacific
Scott DeaverExecutive Vice President of Strategy
Ronald NelsonChairman & Chief Executive Officer
Joseph FerraroSenior Vice President, Operations, North America
Michael SchmidtSenior Vice President, Fleet Services
Matthew FlahertySenior Manager, Investor Relations
Mark ServodidioManaging Director, UK
Paul FordVice President & Controller, Financial Planning & Analysis
Patric SiniscalchiPresident, Latin America / Asia-Pacific
Jeff FoxBoard Member
Perryn StewartDirector, Financial Planning & Analysis
Thomas GartlandPresident, North America
Rochelle TarloweVice President & Treasurer
Neal GoldnerVice President, Investor Relations
Michael TuckerExecutive Vice President & General Counsel
Jack HardyBoard Member
Stephen WrightSenior Vice President, Sales & Marketing, Latin America/Asia-Pacific
Gerard InsallSenior Vice President & Chief Information Officer
David WyshnerSenior Executive Vice President & Chief Financial Officer
A-4