investor day presentation 3 dec2015 (final merged)
TRANSCRIPT
Newmont Investor DayDecember 3, 2015

Newmont Mining Corporation I 2015 Investor Day I Slide 2December 2015
Safety briefing
Mandarin Oriental Ballroom – emergency exits

Newmont Mining Corporation I 2015 Investor Day I Slide 3December 2015
Cautionary statement
Cautionary statement regarding forward looking statements:
This presentation contains “forward-looking statements” within the meaning of Section 27A of the Securities Act of 1933, as amended, and
Section 21E of the Securities Exchange Act of 1934, as amended, and are intended to be covered by the safe harbor provided for under
such sections. Such forward-looking statements may include, without limitation: (i) estimates of future consolidated and attributable
production and sales; (ii) estimates of future costs applicable to sales and All-in sustaining costs; (iii) estimates of future consolidated and
attributable capital expenditures; (iv) our efforts to continue delivering reduced costs and efficiency; (v) expectations regarding the
development, growth and exploration potential of the Company’s operations and projects, including the Turf Vent Shaft, Merian, Long
Canyon Phase 1, Tanami Expansion, Subika Underground and Ahafo Mill Expansion; (vi) expectations regarding the repayment of debt
from cash flows and existing cash; and (vii) expectations regarding future price assumptions, financial performance and other outlook or
guidance. Estimates or expectations of future events or results are based upon certain assumptions, which may prove to be incorrect.
Such assumptions, include, but are not limited to: (i) there being no significant change to current geotechnical, metallurgical, hydrological
and other physical conditions; (ii) permitting, development, operations and expansion of the Company’s operations and projects being
consistent with current expectations and mine plans, including without limitation receipt of export approvals; (iii) political developments in
any jurisdiction in which the Company operates being consistent with its current expectations; (iv) certain exchange rate assumptions for
the Australian dollar to the U.S. dollar, as well as other the exchange rates being approximately consistent with current levels; (v) certain
price assumptions for gold, copper and oil; (vi) prices for key supplies being approximately consistent with current levels; (vii) the accuracy
of our current mineral reserve and mineralized material estimates; (viii) the acceptable outcome of negotiation of the amendment to the
Contract of Work and/or resolution of export issues in Indonesia (ix) there being no significant acquisitions or divestitures during the
outlook period and; (x) other assumptions noted herein. Where the Company expresses an expectation or belief as to future events or
results, such expectation or belief is expressed in good faith and believed to have a reasonable basis. However, such statements are
subject to risks, uncertainties and other factors, which could cause actual results to differ materially from future results expressed,
projected or implied by the “forward-looking statements”. Such risks include, but are not limited to, gold and other metals price volatility,
currency fluctuations, increased production costs and variances in ore grade or recovery rates from those assumed in mining plans,
political and operational risks, community relations, conflict resolution and outcome of projects or oppositions and governmental regulation
and judicial outcomes. For a more detailed discussion of such risks and other factors, see the Company’s 2014 Annual Report on Form
10-K, filed on February 20, 2015, with the Securities and Exchange Commission (the “SEC”), the Company’s Quarterly Report on Form
10-Q filed on July 23, 2015, as well as the Company’s other SEC filings. The Company does not undertake any obligation to release
publicly revisions to any “forward-looking statement,” including, without limitation, outlook, to reflect events or circumstances after the date
of this presentation, or to reflect the occurrence of unanticipated events, except as may be required under applicable securities laws.
Investors should not assume that any lack of update to a previously issued “forward-looking statement” constitutes a reaffirmation of that
statement. Continued reliance on “forward-looking statements” is at investors' own risk.

Gary GoldbergPresident and Chief Executive Officer

Newmont Mining Corporation I 2015 Investor Day I Slide 5December 2015
Agenda
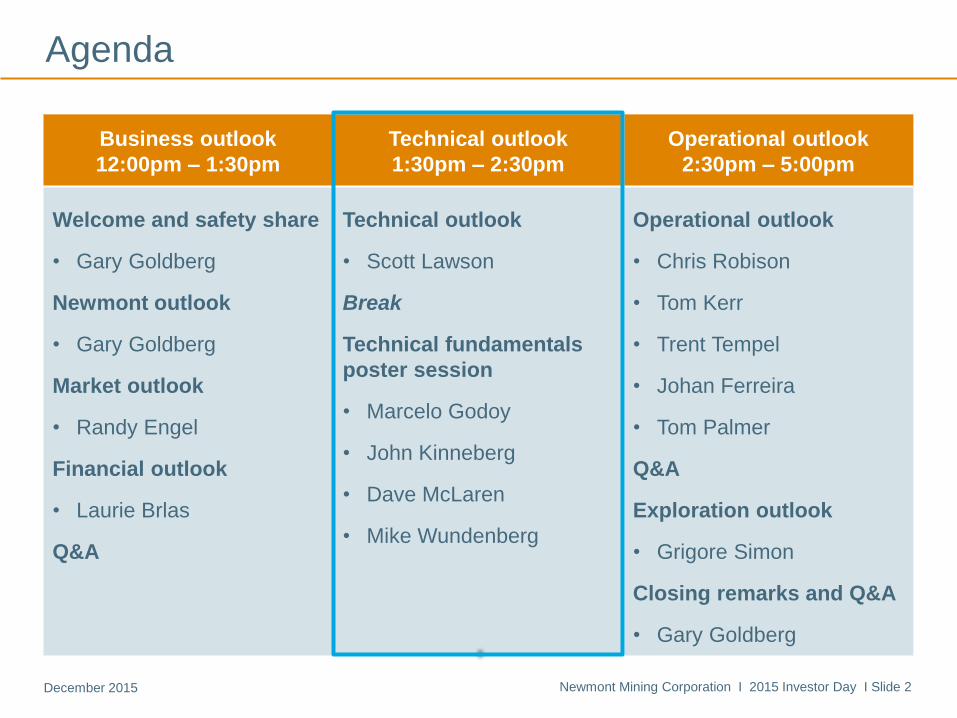
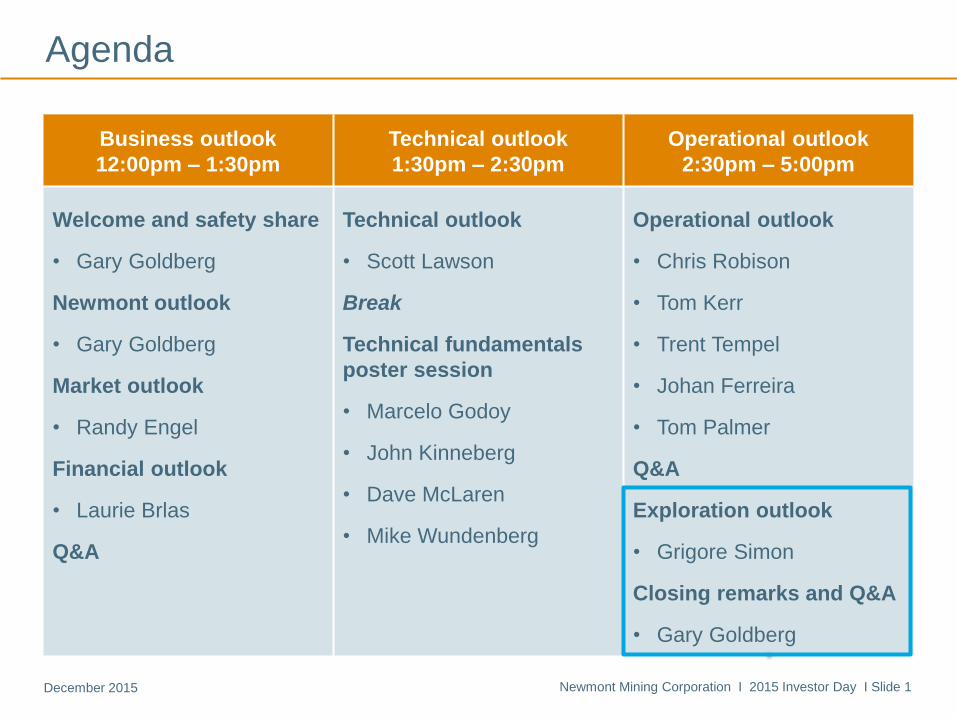
Business outlook
12:00pm – 1:30pm
Technical outlook
1:30pm – 2:30pm
Operational outlook
2:30pm – 5:00pm
Welcome and safety share
• Gary Goldberg
Newmont outlook
• Gary Goldberg
Market outlook
• Randy Engel
Financial outlook
• Laurie Brlas
Q&A
Technical outlook
• Scott Lawson
Break
Technical fundamentals
poster session
• Marcelo Godoy
• John Kinneberg
• Dave McLaren
• Mike Wundenberg
Operational outlook
• Chris Robison
• Tom Kerr
• Trent Tempel
• Johan Ferreira
• Tom Palmer
Q&A
Exploration outlook
• Grigore Simon
Closing remarks and Q&A
• Gary Goldberg
Newmont Mining Corporation I 2015 Investor Day I Slide 6December 2015
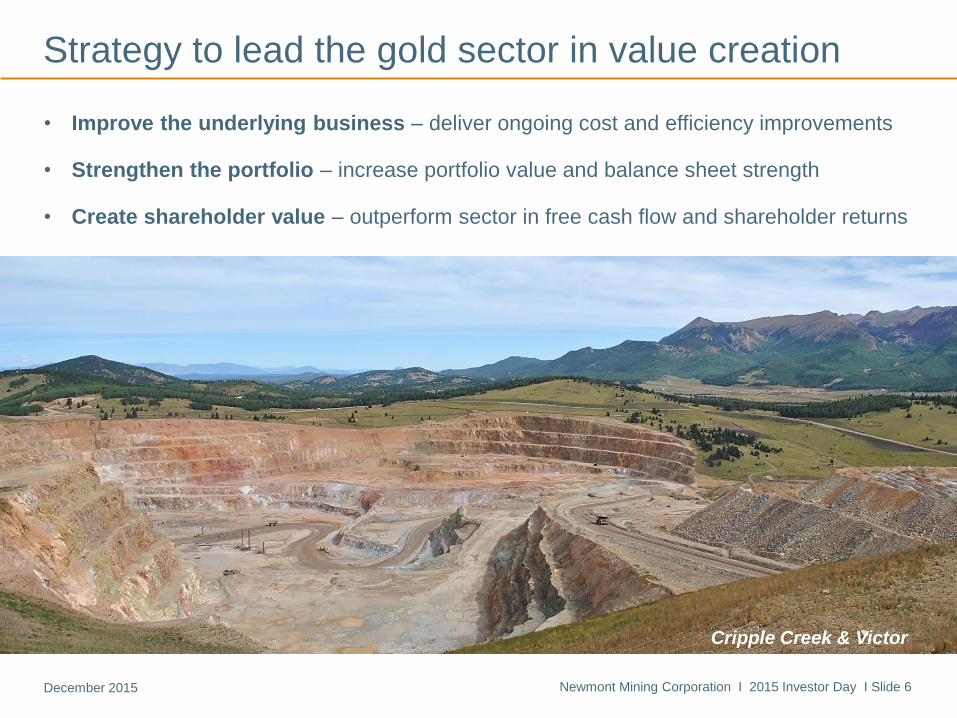
Strategy to lead the gold sector in value creation
• Improve the underlying business – deliver ongoing cost and efficiency improvements
• Strengthen the portfolio – increase portfolio value and balance sheet strength
• Create shareholder value – outperform sector in free cash flow and shareholder returns
Cripple Creek & Victor

Newmont Mining Corporation I 2015 Investor Day I Slide 7December 2015
0.65
0.47
0.39
0.32
0.2
0.3
0.4
0.5
0.6
0.7
2012 2013 2014 2015 YTD
Running a safer and more productive business
Injury rates (total recordable injuries per 200,000 hours worked)
Labor costs ($ per gold equivalent ounce produced)
Injury rates down ~50%
Productivity up ~40%
$492
$433
$392
$284
$200
$300
$400
$500
2012 2013 2014 2015 YTD
Newmont Mining Corporation I 2015 Investor Day I Slide 8December 2015
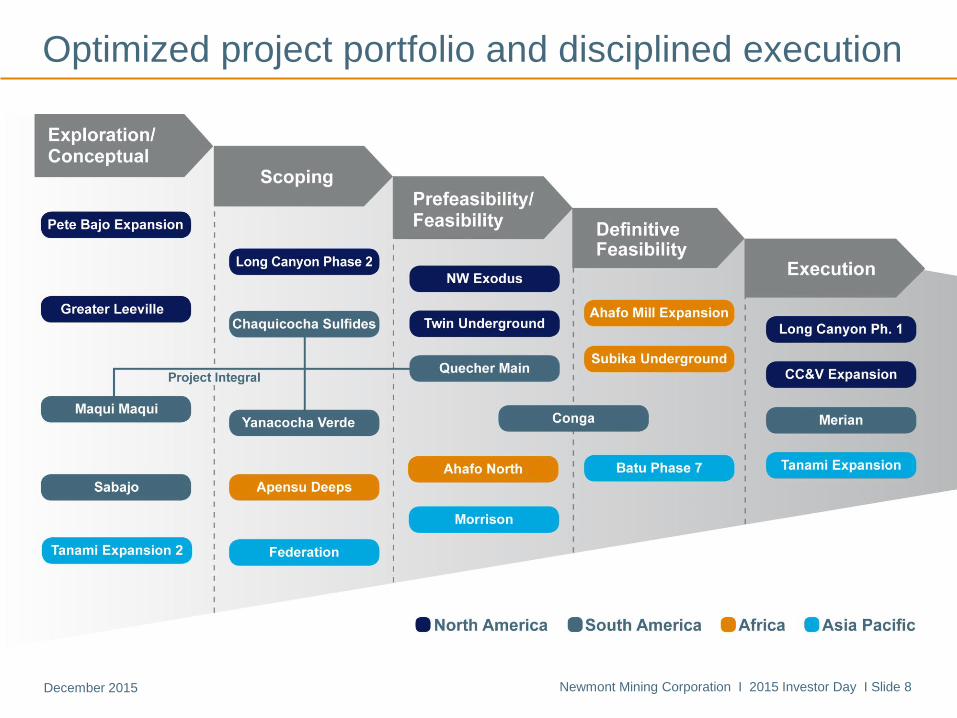
Optimized project portfolio and disciplined execution

Newmont Mining Corporation I 2015 Investor Day I Slide 9December 2015
0.5x
1.0x
1.5x
2.0x
2.5x
3.0x
Q1 Q2 Q3 Q4 Q1 Q2 Q3 Q4 Q1 Q2 Q3
Maintaining industry leading net debt to EBITDA
2013 2014 2015
Net debt to EBITDA1
Newmont Competitor average
*Competitors include Agnico Eagle, Anglogold Ashanti, Barrick, Buenaventura, Goldcorp, Gold Fields, Harmony, Kinross, Newcrest, and Yamana; net debt to EBITDA utilizes trailing
12-month EBITDA. Competitor average is weighted based on Total Enterprise Value (September 30, 2015). Newmont Q2 2015 net debt excludes cash for CC&V of $820 million.

Newmont Mining Corporation I 2015 Investor Day I Slide 10December 2015
Success factors
People
• Strong and increasingly diverse bench
• Step change in operational performance
• Well-regarded governance
Discipline
• Continuous improvement (Full Potential)
• Rigorous investment ranking and controls
• Optimized portfolio and pipeline
Focus
• Value over volume
• Shareholder returns
• Outperform sector Long Canyon

Newmont Mining Corporation I 2015 Investor Day I Slide 11December 2015
2012A 2013A 2014A 2015E 2016E 2017E 2018E 2019E 2020E
AISC improvements are sustained
Consolidated gold all-in sustaining cost per ounce2 ($/oz)
850 – 950900 – 9601,002
1,113
1,177
900 – 1,000880 – 940

Newmont Mining Corporation I 2015 Investor Day I Slide 12December 2015
2012A 2013A 2014A 2015E 2016E 2017E 2018E 2019E 2020E
Attributable gold production3 (Moz)
Steady attributable gold production
5.2 – 5.7
4.5 – 5.05.0 5.1 4.8 – 5.3
4.84.7 – 5.1
Newmont Mining Corporation I 2015 Investor Day I Slide 13December 2015
$0
$500
$1,000
$1,500
$2,000
$2,500
$3,000
$3,500
2012A 2013A 2014A 2015E 2016E 2017E 2018E 2019E 2020E
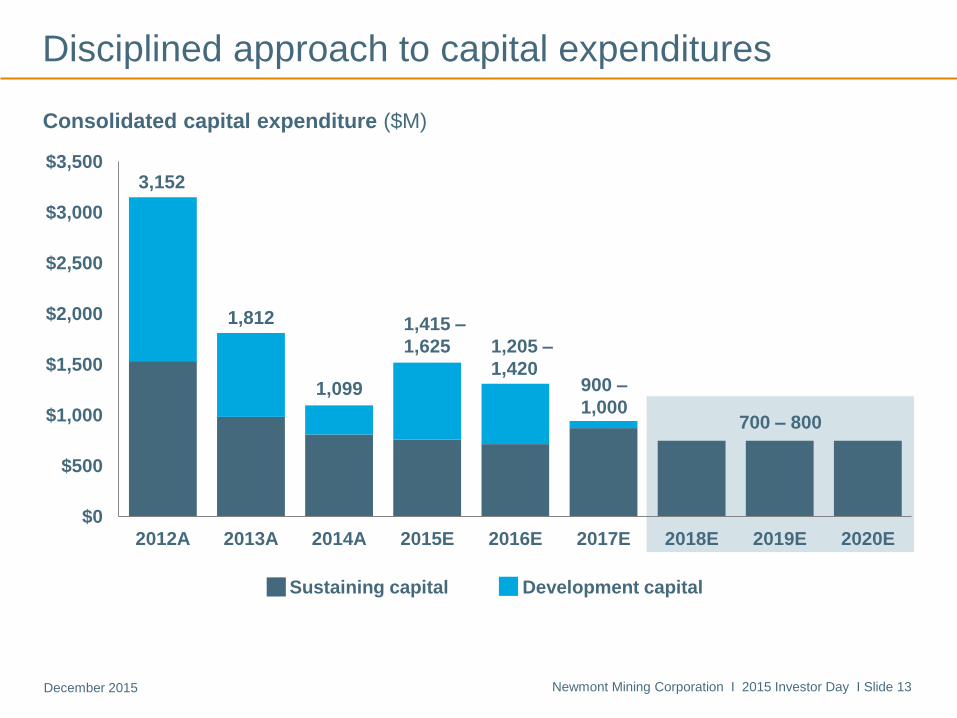
Disciplined approach to capital expenditures
Consolidated capital expenditure ($M)
Sustaining capital Development capital
700 – 800
900 –
1,000
3,152
1,812
1,099
1,205 –
1,420
1,415 –
1,625

Newmont Mining Corporation I 2015 Investor Day I Slide 14December 2015
Prepared for opportunities and challenges
Upside
• Maintain cost and capital
discipline
• Follow up on most
promising exploration
prospects
• Accelerate debt
repayment
• Pursue value-accretive
growth
• Pay higher dividends in
line with policy
$1,100/ounce gold
• Optimize costs & capital
• Complete current
projects
• Near-mine, high value
exploration focus
• Reduce support costs
across business
• Review Batu Hijau
Phase 7 and Ahafo Mill
Expansion options
• Pay dividend at Board’s
discretion
Downside
• Reduce stripping and
increase stockpile
processing
• Complete current
projects
• Mothball lowest margin
operations
• Reduce exploration
• Discontinue early debt
repayments
• Reevaluate dividend
Newmont Mining Corporation I 2015 Investor Day I Slide 15December 2015
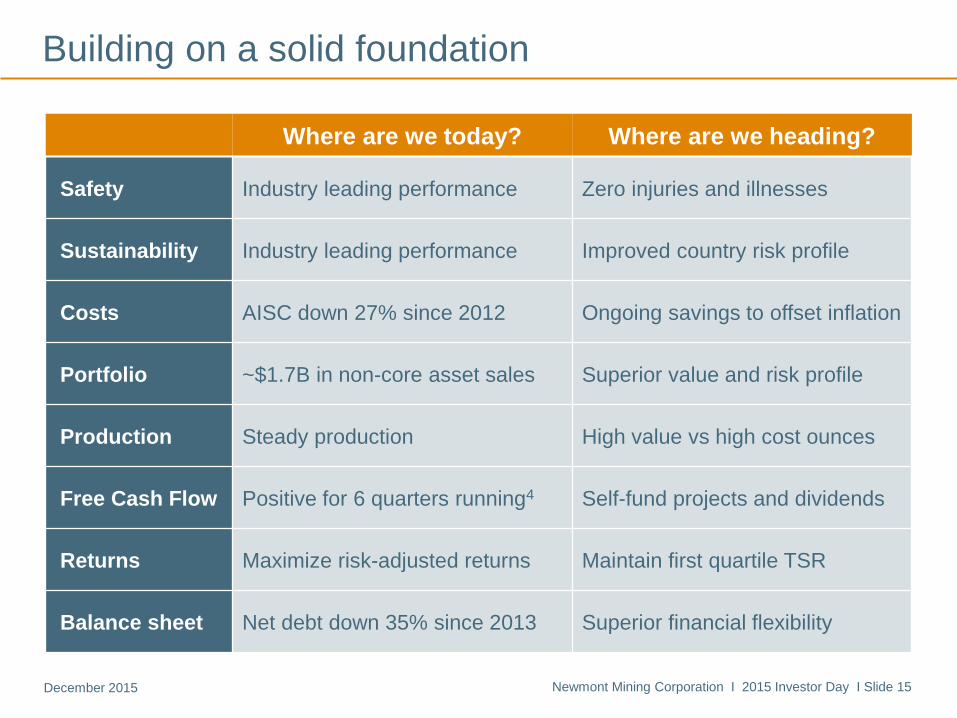
Where are we today? Where are we heading?
Safety Industry leading performance Zero injuries and illnesses
Sustainability Industry leading performance Improved country risk profile
Costs AISC down 27% since 2012 Ongoing savings to offset inflation
Portfolio ~$1.7B in non-core asset sales Superior value and risk profile
Production Steady production High value vs high cost ounces
Free Cash Flow Positive for 6 quarters running4 Self-fund projects and dividends
Returns Maximize risk-adjusted returns Maintain first quartile TSR
Balance sheet Net debt down 35% since 2013 Superior financial flexibility
Building on a solid foundation

Randy EngelExecutive Vice President, Strategic Development

Newmont Mining Corporation I 2015 Investor Day I Slide 17December 2015
Industry leading EBITDA per share
Consolidated EBITDA per share ($)
*Competitors include Agnico Eagle, Anglogold Ashanti, Barrick, Buenaventura, Goldcorp, Gold Fields, Harmony, Kinross, Newcrest, and Yamana; Consolidated EBITDA per share
utilizes trailing 12-month EBITDA and average shares outstanding. Competitor average is weighted based on Total Enterprise Value (September 30, 2015).
$0.00
$1.00
$2.00
$3.00
$4.00
$5.00
$6.00
$7.00
$8.00
$9.00
Q1 Q2 Q3 Q4 Q1 Q2 Q3 Q4 Q1 Q2 Q3
2013 2014 2015
Newmont Competitor average

Newmont Mining Corporation I 2015 Investor Day I Slide 18December 2015
-$2.00
-$1.50
-$1.00
-$0.50
$0.00
$0.50
$1.00
$1.50
$2.00
$2.50
Q1 Q2 Q3 Q4 Q1 Q2 Q3 Q4 Q1 Q2 Q3
Industry leading free cash flow per share
Free cash flow per share4 ($)
*Competitors include Agnico Eagle, Anglogold Ashanti, Barrick, Buenaventura, Goldcorp, Gold Fields, Harmony, Kinross, Newcrest, and Yamana; FCF per share utilizes trailing 12-
month free cash flow and average shares outstanding. Competitor average is weighted based on Total Enterprise Value (September 30, 2015).
2013 2014 2015
Newmont Competitor average

Newmont Mining Corporation I 2015 Investor Day I Slide 19December 2015
0%
2%
4%
6%
8%
10%
12%
14%
Q1 Q2 Q3 Q4 Q1 Q2 Q3 Q4 Q1 Q2 Q3
Industry leading return on capital employed
Return on capital employed (%)
*Competitors include Agnico Eagle, Anglogold Ashanti, Barrick, Buenaventura, Goldcorp, Gold Fields, Harmony, Kinross, Newcrest, and Yamana; ROCE is a non-GAAP metric and
utilizes rolling 12 month earnings before interest and taxes (EBIT) over capital employed less cash and equivalents. Competitor average is weighted based on Total Enterprise Value
(September 30, 2015). All figures sourced from Capital IQ.
2013 2014 2015
Newmont Competitor average

Newmont Mining Corporation I 2015 Investor Day I Slide 20December 2015
Competitive portfolio improvements
-23%
-7.5%
-25%
-20%
-15%
-10%
-5%
0%
Newmont Competitors
-$1.6
$0.8
-$2,000
-$1,250
-$500
$250
$1,000
Newmont Competitors
2012 – 2015E AISC improvement (%) 2012 – 2015E net debt improvement ($B)
FCF yield – trailing twelve months (%)
*Competitors represent industry weighted averages for Agnico Eagle, Anglogold Ashanti, Barrick, Buenaventura, Goldcorp, Gold Fields, Harmony, Kinross, Newcrest, and Yamana;
sourced from Capital IQ, except for AISC which represents analyst consensus estimates
ROCE – trailing twelve months (%)
14%
1.9%0%
3%
6%
9%
12%
15%
Newmont Competitors
10%
1%
0%
3%
6%
9%
12%
15%
Newmont Competitors

Newmont Mining Corporation I 2015 Investor Day I Slide 21December 2015
Disciplined approach to portfolio optimization
De-risk Maintain
Close or divest Improve value
Lo
w
V
alu
e
Hig
h
High Risk Low
Portfolio approach
Newmont Mining Corporation I 2015 Investor Day I Slide 22December 2015
$0
$600
$1,200
$1,800
Ca
na
dia
n O
il Sa
nd
s
Mid
as
Pa
lad
in (5
.4%
)
Ju
nd
ee
Pe
nm
on
t (44
%)
Me
rian
(25
%)
Va
lca
mb
i
Wa
ihi
Oth
er*
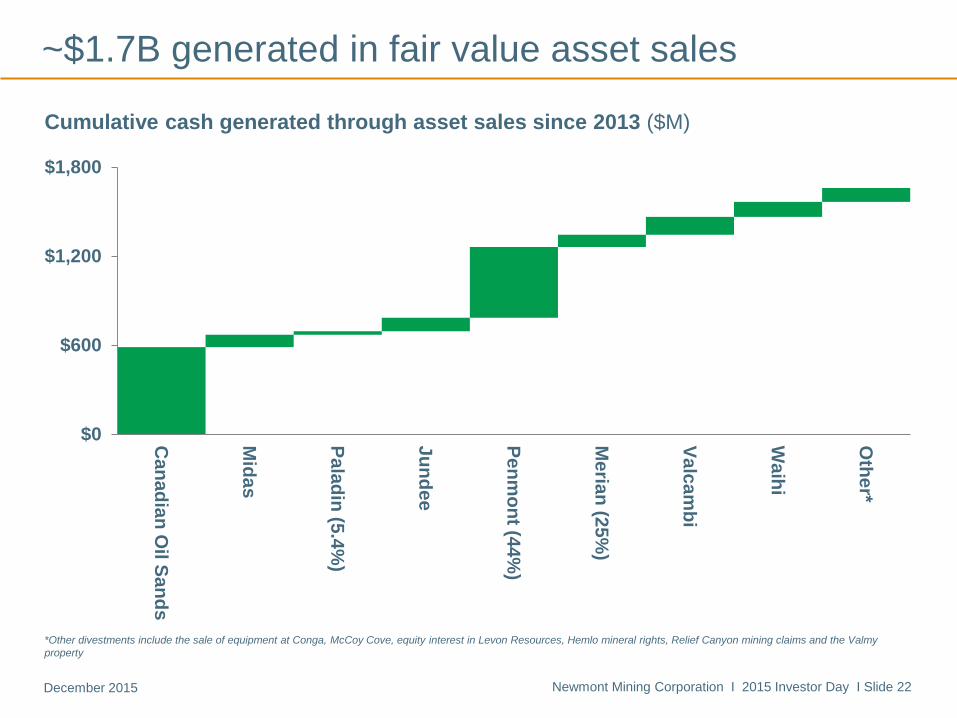
~$1.7B generated in fair value asset sales
Cumulative cash generated through asset sales since 2013 ($M)
*Other divestments include the sale of equipment at Conga, McCoy Cove, equity interest in Levon Resources, Hemlo mineral rights, Relief Canyon mining claims and the Valmy
property

Newmont Mining Corporation I 2015 Investor Day I Slide 23December 2015
Step change in portfolio value delivered
Divested Reinvested
AssetsMidas, Jundee,
Penmont, Waihi
Merian, Long
Canyon, CC&V
Mine life Less than 6 years More than 10 years
Production 500Koz/year ~1Moz/year
Costs $900 – $950/oz Below $800/oz
Risk Higher technical
and social risk
Lower technical
and social risk
AISC down 19%
Mine life up 66%
*Production and cost data represent expected weighted average calculation based on 5-year outlook estimates

Newmont Mining Corporation I 2015 Investor Day I Slide 24December 2015
60
70
80
90
100
110
2014 2015E 2016E 2017E 2018E 2019E 2020E
Gold sector fundamentals improving
*Sourced from SNL Mineral Economics Group (2013), GFMS Mine Economics Database (2015) and WGC Demand Trends
0
25
50
75
100
2007 2008 2009 2010 2011 2012
3-year average gold discovered (Moz) Gold mine supply (Moz)
Operations Projects

Laurie BrlasExecutive Vice President & Chief Financial Officer
Newmont Mining Corporation I 2015 Investor Day I Slide 26December 2015
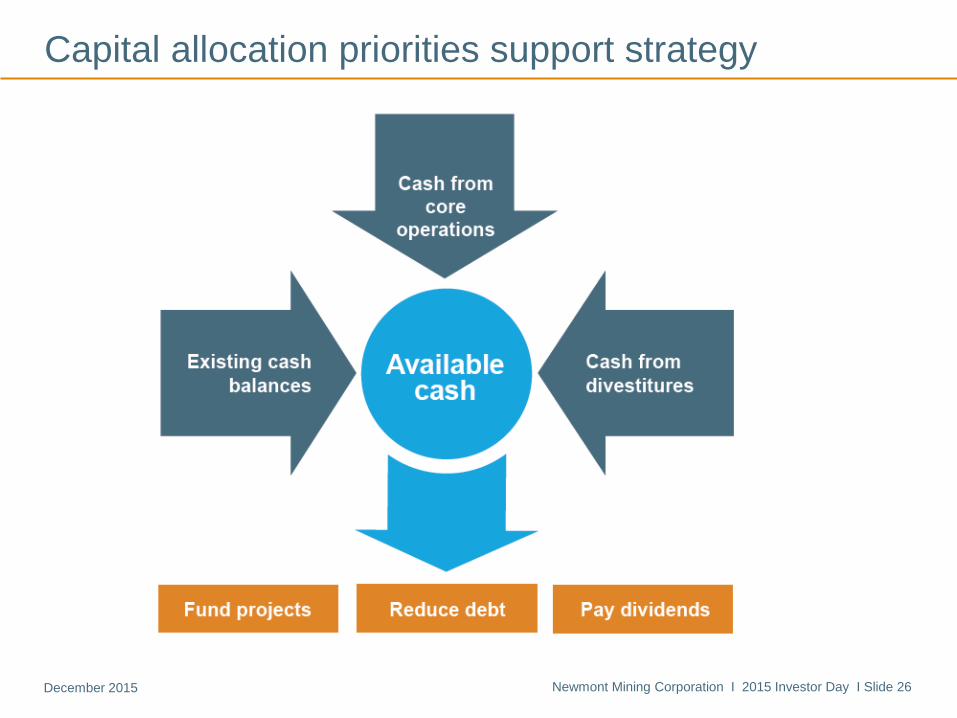
Capital allocation priorities support strategy

Newmont Mining Corporation I 2015 Investor Day I Slide 27December 2015
2013A 2015 YTD*
Gold price per ounce $1,393 $1,159
Liquidity $5.1B $6.4B
Free cash flow ($339M) $941M
Net debt $5.2B $3.4B
Dividend Gold price linked dividend Gold price linked dividend
*As of September 30, 2015
Step change in financial flexibility
Free cash flow up
$1.3BNet Debt down
35%Liquidity up
25%
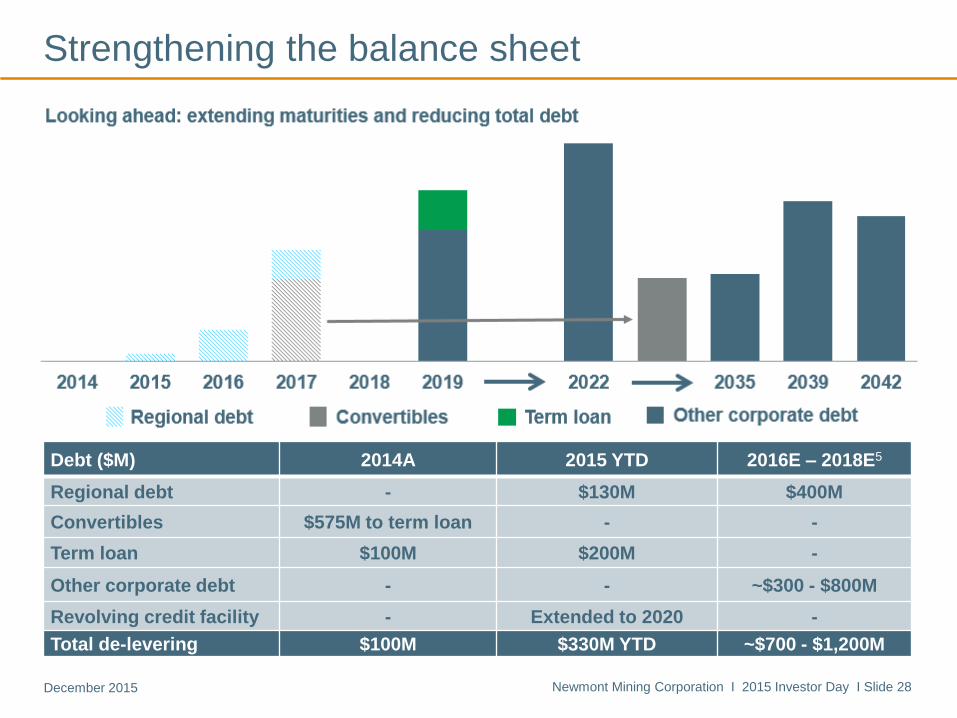
Strengthening the balance sheet
Regional debt Convertibles Term loan Other corporate debt
Debt ($M) 2014A 2015 YTD 2016E – 2018E5
Regional debt - $130M $400M
Convertibles $575M to term loan - -
Term loan $100M $200M -
Other corporate debt - - ~$300 - $800M
Revolving credit facility - Extended to 2020 -
Total de-levering $100M $330M YTD ~$700 - $1,200M
Newmont Mining Corporation I 2015 Investor Day I Slide 28December 2015

Newmont Mining Corporation I 2015 Investor Day I Slide 29December 2015
Maintaining our investment grade balance sheet
*2012-2014 figures sourced from Moody’s Credit Opinion May 6, 2015; implied rating based on Q3 2015 metrics; actual ratings are based on multi-year averages
• Rated Baa2 (negative) by Moody’s and BBB (stable) by S&P
• Agencies have recognized cost reductions and improved liquidity
• Focus on controlling what we can control; negative outlook is function of metal price
Key credit metrics* 2012A 2013A 2014A Q3 2015 Implied rating
EBIT Margin 35% 13% 13% 22% Aa
Debt to Total Capitalization 28% 35% 34% 37% A
Debt to EBITDA 1.5x 2.9x 3.3x 2.3x Baa
EBIT to Interest Expense 8.9x 2.5x 2.2x 4.7x Baa
(CFO – dividends) to debt 24% 13% 19% 35% Baa

Newmont Mining Corporation I 2015 Investor Day I Slide 30December 2015
0.5x
1.0x
1.5x
2.0x
2.5x
3.0x
Q1 Q2 Q3 Q4 Q1 Q2 Q3 Q4 Q1 Q2 Q3
Maintaining industry leading net debt to EBITDA
2013 2014 2015
Net debt to EBITDA
Newmont Competitor average
*Competitors include Agnico Eagle, Anglogold Ashanti, Barrick, Buenaventura, Goldcorp, Gold Fields, Harmony, Kinross, Newcrest, and Yamana; net debt to EBITDA utilizes trailing
12-month EBITDA. Competitor average is weighted based on Total Enterprise Value (9/30/2015). Newmont Q2 2015 net debt excludes cash for CC&V of $820 million.

Newmont Mining Corporation I 2015 Investor Day I Slide 31December 2015
Steady dividend with upside potential
Annualized dividend per share (US$)*
*For illustrative purposes, declaration of dividend remains subject to Board of Directors approval
$0.10 $0.20
$0.40
$0.60
$0.80
$1.00
$1.20
$0.00
$0.50
$1.00
$1.50
<$1
,30
0
$1
,30
0-$
1,3
99
$1
,40
0-$
1,4
99
$1
,50
0-$
1,5
99
$1
,60
0-$
1,6
99
$1
,70
0-$
1,7
99
$1
,80
0-$
1,8
99

Newmont Mining Corporation I 2015 Investor Day I Slide 32December 2015
WACC6
7% based on long-term expected returns, interest rates and stock betas
Regional hurdle rates based on proprietary country risk model
Investments expected to generate returns above hurdle rates at spot pricing
Planning
process
Conservative economic assumptions
Built from $900/oz case to maximize value, optionality; support contingency planning
Improved outlook due to operation and project optimization; accretive transactions
Value
assurance
All investments subject to independent valuation process to test business case
Review process assesses technical, economic and sociopolitical aspects
Post investment reviews conducted and lessons applied to future investments
Disciplined capital allocation process
Newmont Mining Corporation I 2015 Investor Day I Slide 33December 2015
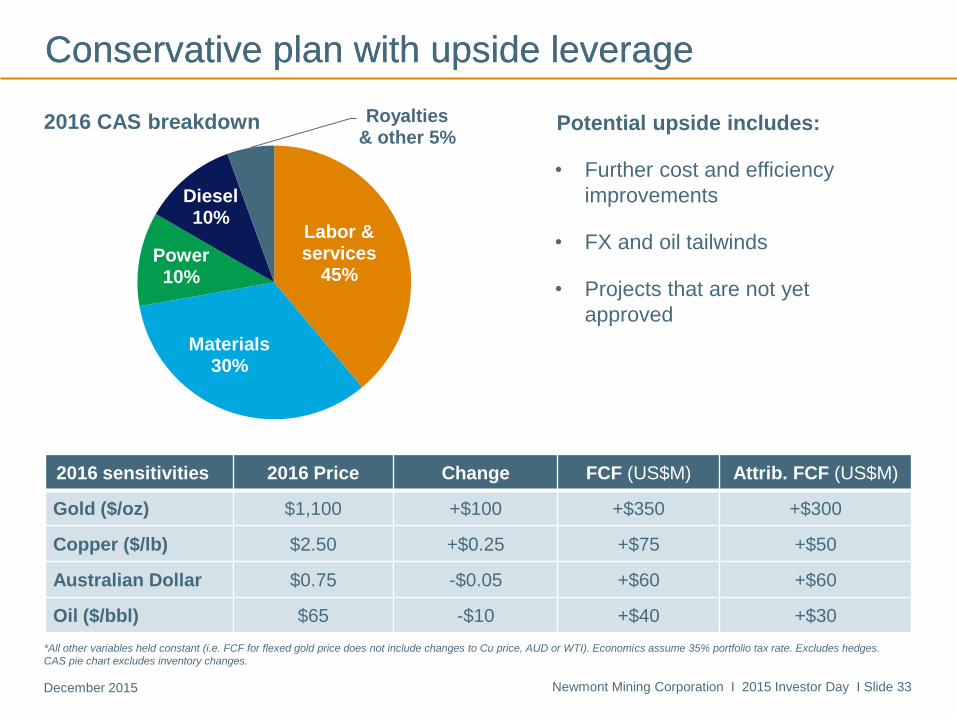
Labor & services
45%
Materials 30%
Power 10%
Diesel 10%
Royalties & other 5%
Conservative plan with upside leverageConservative plan with upside leverage
*All other variables held constant (i.e. FCF for flexed gold price does not include changes to Cu price, AUD or WTI). Economics assume 35% portfolio tax rate. Excludes hedges.
CAS pie chart excludes inventory changes.
2016 CAS breakdown Potential upside includes:
• Further cost and efficiency
improvements
• FX and oil tailwinds
• Projects that are not yet
approved
2016 sensitivities 2016 Price Change FCF (US$M) Attrib. FCF (US$M)
Gold ($/oz) $1,100 +$100 +$350 +$300
Copper ($/lb) $2.50 +$0.25 +$75 +$50
Australian Dollar $0.75 -$0.05 +$60 +$60
Oil ($/bbl) $65 -$10 +$40 +$30

Newmont Mining Corporation I 2015 Investor Day I Slide 34December 2015
$100
$150
$200
$250
$300
2012 2013 2014 2015E 2016E 2017E 2018E
Improving functional efficiency and effectiveness
Cash G&A (US$M)
*Total General and administrative and regional administration expense less stock based compensation

Questions?

Scott LawsonExecutive Vice President, Technical Services
Agenda
Business outlook
12:00pm – 1:30pm
Technical outlook
1:30pm – 2:30pm
Operational outlook
2:30pm – 5:00pm
Welcome and safety share
• Gary Goldberg
Newmont outlook
• Gary Goldberg
Market outlook
• Randy Engel
Financial outlook
• Laurie Brlas
Q&A
Technical outlook
• Scott Lawson
Break
Technical fundamentals
poster session
• Marcelo Godoy
• John Kinneberg
• Dave McLaren
• Mike Wundenberg
Operational outlook
• Chris Robison
• Tom Kerr
• Trent Tempel
• Johan Ferreira
• Tom Palmer
Q&A
Exploration outlook
• Grigore Simon
Closing remarks and Q&A
• Gary Goldberg
Newmont Mining Corporation I 2015 Investor Day I Slide 2December 2015

Newmont Mining Corporation I 2015 Investor Day I Slide 38December 2015
Raising technical standards and performance
• Sector challenged by maturing operations, more complex ore bodies, rising expectations
• Emerging technology holds promise for incremental rather than transformational change
• Culture and practice – not technology alone – are key to improving value, lowering risk
− $1B in Full Potential improvements delivered to date7
Newmont Mining Corporation I 2015 Investor Day I Slide 3December 2015
Newmont Mining Corporation I 2015 Investor Day I Slide 39December 2015
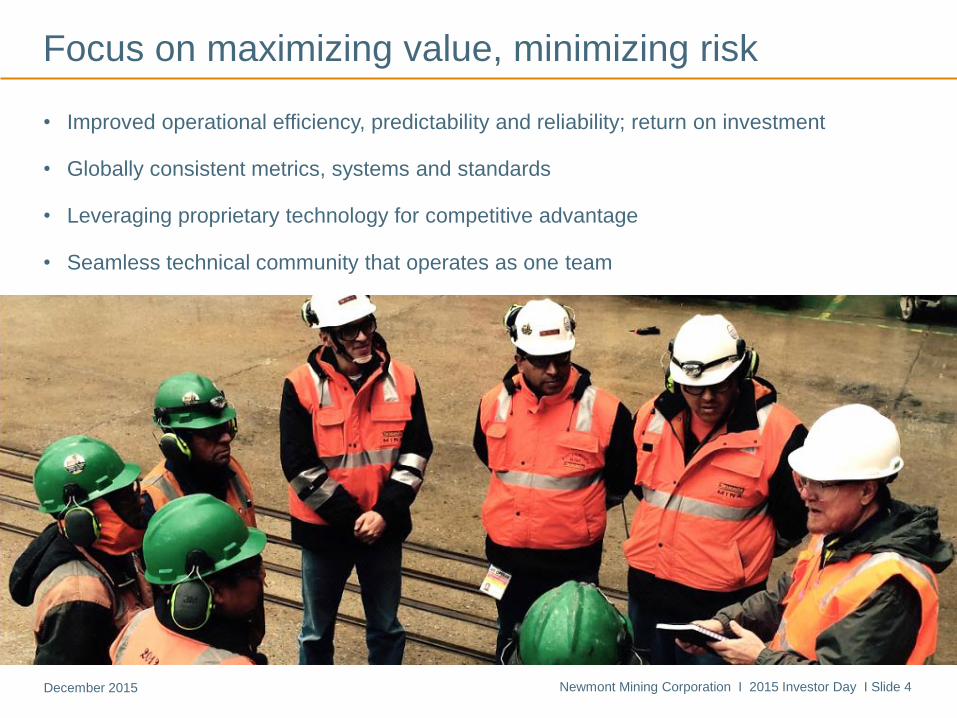
Focus on maximizing value, minimizing risk
• Improved operational efficiency, predictability and reliability; return on investment
• Globally consistent metrics, systems and standards
• Leveraging proprietary technology for competitive advantage
• Seamless technical community that operates as one team
Newmont Mining Corporation I 2015 Investor Day I Slide 4December 2015

Newmont Mining Corporation I 2015 Investor Day I Slide 40December 2015
Prioritizing value-adding disciplines
Resource
modelingBetter understand and plan for ore body risks and opportunities
Mine
planningOptimize how deposits are mined and processed for life of mine
Processing/
metallurgyExpertise to deliver leading technology and industry best practice
Asset
managementMaximize asset performance and productivity across lifecycle
Business
improvementSystems and skills to drive culture of continuous improvement
Newmont Mining Corporation I 2015 Investor Day I Slide 5December 2015

Newmont Mining Corporation I 2015 Investor Day I Slide 41December 2015
Realizing our Full Potential
• Structured approach to accelerating value delivery
• Full Potential improvements of $1 billion to date
• Future savings expected to exceed targets
• Stronger technical fundamentals, knowledge-sharing
Full Potential improvements by type (2012 – 2015 YTD)
Processing• Ore blending and throughput
• Maintenance shutdowns
Sustaining capex• Equipment reliability
• Asset management
Mining• Modeling and mine planning
• Payload and fleet availability
41%Processing
30%Sustaining
Capital
24%Mining
5%Supply Chain
Newmont Mining Corporation I 2015 Investor Day I Slide 6December 2015

Newmont Mining Corporation I 2015 Investor Day I Slide 42December 2015
People are our primary competitive advantage
John Kinneberg
Group Executive,
Mine Engineering
• Technical Services team represents 1,700 years of experience, nearly half at Newmont
• 80% of team has advanced degrees
• Leaders are recognized industry experts
Mike Wundenberg
Group Executive,
Asset Management,
Business Improvement
Marcelo Godoy
Group Executive,
Resource Modeling
Dave McLaren
Group Executive,
Processing
Newmont Mining Corporation I 2015 Investor Day I Slide 7December 2015

Newmont Investor DayDecember 3, 2015

Chris RobisonExecutive Vice President and Chief Operating Officer

Newmont Mining Corporation I 2015 Investor Day I Slide 45December 2015
Agenda
Business outlook
12:00pm – 1:30pm
Technical outlook
1:30pm – 2:30pm
Operational outlook
2:30pm – 5:00pm
Welcome and safety share
• Gary Goldberg
Newmont outlook
• Gary Goldberg
Market outlook
• Randy Engel
Financial outlook
• Laurie Brlas
Q&A
Technical outlook
• Scott Lawson
Break
Technical fundamentals
poster session
• Marcelo Godoy
• John Kinneberg
• Dave McLaren
• Mike Wundenberg
Operational outlook
• Chris Robison
• Tom Kerr
• Trent Tempel
• Johan Ferreira
• Tom Palmer
Q&A
Exploration outlook
• Grigore Simon
Closing remarks and Q&A
• Gary Goldberg
Newmont Mining Corporation I 2015 Investor Day I Slide 3December 2015

Newmont Mining Corporation I 2015 Investor Day I Slide 46December 2015 Newmont Mining Corporation I 2015 Investor Day I Slide 4
% of 2015E
gold production
Maximizing returns across the portfolio
North America
Carlin
Phoenix
Twin Creeks
Long Canyon
CC&V
South America
Merian
Yanacocha
Project Integral
Conga
Africa
Ahafo
Akyem
Asia Pacific
Batu Hijau
Boddington
Kalgoorlie
Tanami
Since 2012*Injury rates
− 50%Productivity
+ 40%AISC
− 27%Sust CapEx
− 55%Projects
+ 5
Operations
Projects
2015E gold
production
North America
34%South America
10%Africa
16%Australia
33%Indonesia
7%*Percentage change compares Q3 2015 YTD vs 2012A; sustaining capital expenditure compares 2015E vs 2012A
December 2015

Newmont Mining Corporation I 2015 Investor Day I Slide 47December 2015
Taking performance to the next level
Health & Safety
Operational
Excellence
Growth
People
Sustainability &
Ext Relations
• Continue to improve behaviors and critical controls
• Eliminate fatalities and serious injuries
• Continue to leverage the right tools, metrics and standards
• Meet or exceed earnings, cost and capital targets
• Continue to optimize near-term cash flow and long-term value
• Deliver projects safely, on time and budget
• Maintain a fit-for-purpose operating model
• Cultivate a deep and diverse leadership pipeline
• Elevate social and environmental standards and accountabilities
• Secure social license, permits and agreements to deliver Plan
Newmont Mining Corporation I 2015 Investor Day I Slide 5December 2015

Newmont Mining Corporation I 2015 Investor Day I Slide 48December 2015
Sector-differentiating project pipeline
Newmont Mining Corporation I 2015 Investor Day I Slide 6December 2015
Newmont Mining Corporation I 2015 Investor Day I Slide 49December 2015
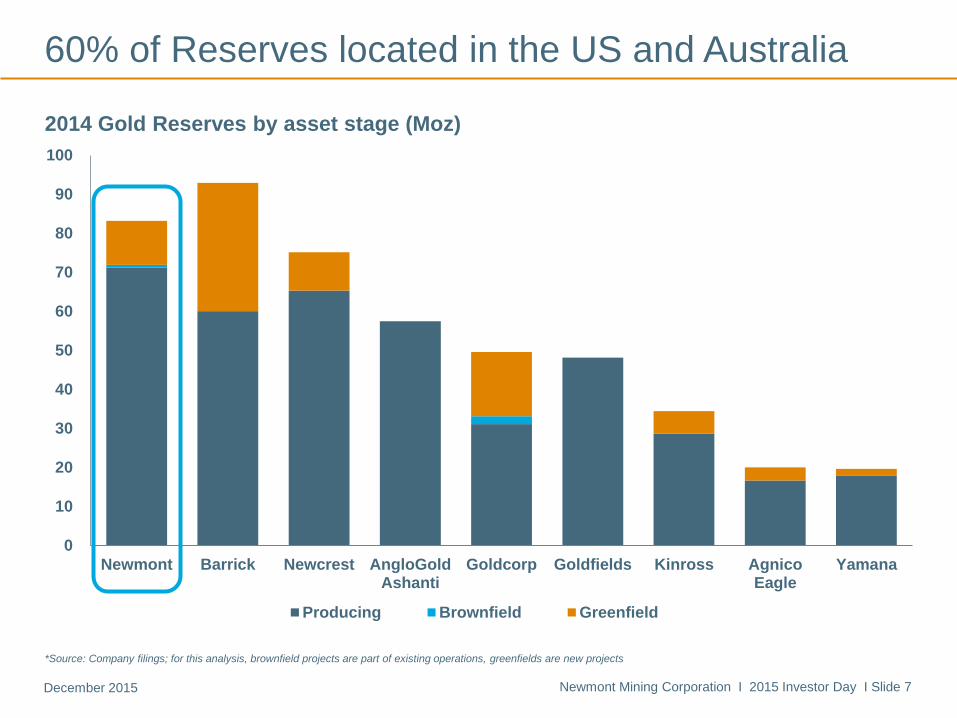
0
10
20
30
40
50
60
70
80
90
100
Newmont Barrick Newcrest AngloGoldAshanti
Goldcorp Goldfields Kinross AgnicoEagle
Yamana
Producing Brownfield Greenfield
100 %
100%
13 %
2014 Gold Reserves by asset stage (Moz)
60% of Reserves located in the US and Australia
*Source: Company filings; for this analysis, brownfield projects are part of existing operations, greenfields are new projects
Newmont Mining Corporation I 2015 Investor Day I Slide 7December 2015

Newmont Mining Corporation I 2015 Investor Day I Slide 50December 2015
Strong bench of experienced operators
Johan Ferreira
RSVP, Africa
Tom Palmer
RSVP, Asia PacificTrent Tempel
RSVP, South America
Tom Kerr
RSVP, North America
• 35 years’ experience
• Mining engineer
• Director, Nevada
Mining Association
• 31 years’ experience
• Metallurgical
engineer
• Former Chairman,
Nevada Mining
Association
• 29 years’ experience
• Mining engineer
• President, Ghana
Chamber of Mines
• 25 years’ experience
• Mechanical engineer
• Director, Mineral
Council of Australia
Newmont Mining Corporation I 2015 Investor Day I Slide 8December 2015

Tom KerrRegional Senior Vice President, North America

Newmont Mining Corporation I 2015 Investor Day I Slide 52December 2015
$977 $1,007
$0
$200
$400
$600
$800
$1,000
$1,200
$1,400
-200
50
300
550
800
1050
1300
1550
1800
2050
2300
2013 2014 2015E 2016E 2017E 2018E
Gold Production Actual (Moz) Gold Production Outlook (Moz) AISC ($/oz)
$850 - 925
1.5 - 1.7
$940 - 1,010 $800 - 900
1.6
2.0
$900 - 1,000
North America adds profitable production
• Driving continuous improvement and progressing underground options in Nevada
• Leveraging synergies to improve costs and productivity at CC&V
• Brownfields approach to opening new district at Long Canyon
Gold production and AISC trends and outlook
1.9 – 2.12.1 – 2.3
1.9 – 2.1
Newmont Mining Corporation I 2015 Investor Day I Slide 10December 2015

Newmont Mining Corporation I 2015 Investor Day I Slide 53December 2015
Underground growth opportunities at Carlin
• Turf Vent Shaft accesses higher grades,
supports further Leeville expansion
• NW Exodus adds mine life and value;
growing into major high grade deposit
• Managing geotech issues; UG ore offsets
stripping, lower grades in surface mines
$9 millionAnnual savings achieved through improved
stope definition drilling
Newmont Mining Corporation I 2015 Investor Day I Slide 11December 2015

Newmont Mining Corporation I 2015 Investor Day I Slide 54December 2015
Twin Creeks continues to deliver strong performance
• Developing underground opportunities to
extend mine life
• Optimizing potential expansion at
Turquoise Ridge Joint Venture
• Stripping campaign begins in 2018
120,000 milesNew record set for tire life, with 16,000
hours of operation
Newmont Mining Corporation I 2015 Investor Day I Slide 12December 2015

Newmont Mining Corporation I 2015 Investor Day I Slide 55December 2015
Improved recovery enhances value at Phoenix
• Achieving steady state production at new
SXEW plant; transforms waste to cathode
• Mine sequencing and ore blending remain
critical to maximizing value
• Leveraging Full Potential to improve
recovery and offset impact of variable ore
8 percentImprovement in recovery generating $20
million in value
Newmont Mining Corporation I 2015 Investor Day I Slide 13December 2015

Newmont Mining Corporation I 2015 Investor Day I Slide 56December 2015
CC&V adds significant cash flow and upside potential
• Transition and integration progressing
well; expansion on time and on budget
• Initial improvement opportunities identified
• Continuing to work through mill ramp-up
10 percentPotential improvement in direct mining
costs by optimizing mine plan
Newmont Mining Corporation I 2015 Investor Day I Slide 14December 2015

Newmont Mining Corporation I 2015 Investor Day I Slide 57December 2015
Long Canyon opens prospective new district
• High grade oxide deposit, with trend potential
and mineralization open in all directions
• Optimized to lower capital, improve returns
• Progressing on schedule and on budget
Production 100 – 150 Koz
AISC $500 – $600/oz
Capital $250 – $300M
First production Early 2017
Production and AISC calculated as first full five year average
Newmont Mining Corporation I 2015 Investor Day I Slide 15December 2015

Trent TempelRegional Senior Vice President, South America

Newmont Mining Corporation I 2015 Investor Day I Slide 59December 2015
$1,041 $988
$0
$200
$400
$600
$800
$1,000
$1,200
$1,400
0
100
200
300
400
500
600
700
800
2013 2014 2015E 2016E 2017E 2018E
Gold Production Actual (Moz) Gold Production Outlook (Moz) AISC ($/oz)
$1,050 -
1,150$950 - 1,020
$950 - 1,050
498523
$850 - 950
Gold production* and AISC trends and outlook
Merian production offsets declines at Yanacocha
• Disciplined approach to maintaining profitability at Yanacocha as oxide deposits mature
• Extending profitable production through integrated development of sulfide deposits
• Developing Merian and advancing other options in the highly prospective Guiana Shield
400 – 450
600 – 700 600 – 700
450 – 490
*Attributable, excludes La Zanja (46.94%)
Newmont Mining Corporation I 2015 Investor Day I Slide 17December 2015

Newmont Mining Corporation I 2015 Investor Day I Slide 60December 2015
Pragmatic approach to depleting Yanacocha oxides
• Stripping last cutback at El Tapado Oeste
to access higher grade ore
• Water treatment systems meet more
stringent limits
• Conga spend minimized
$22 millionReduction in 2015 capital expenditure for
water treatment by adding brine treatment
Newmont Mining Corporation I 2015 Investor Day I Slide 18December 2015
Newmont Mining Corporation I 2015 Investor Day I Slide 61December 2015
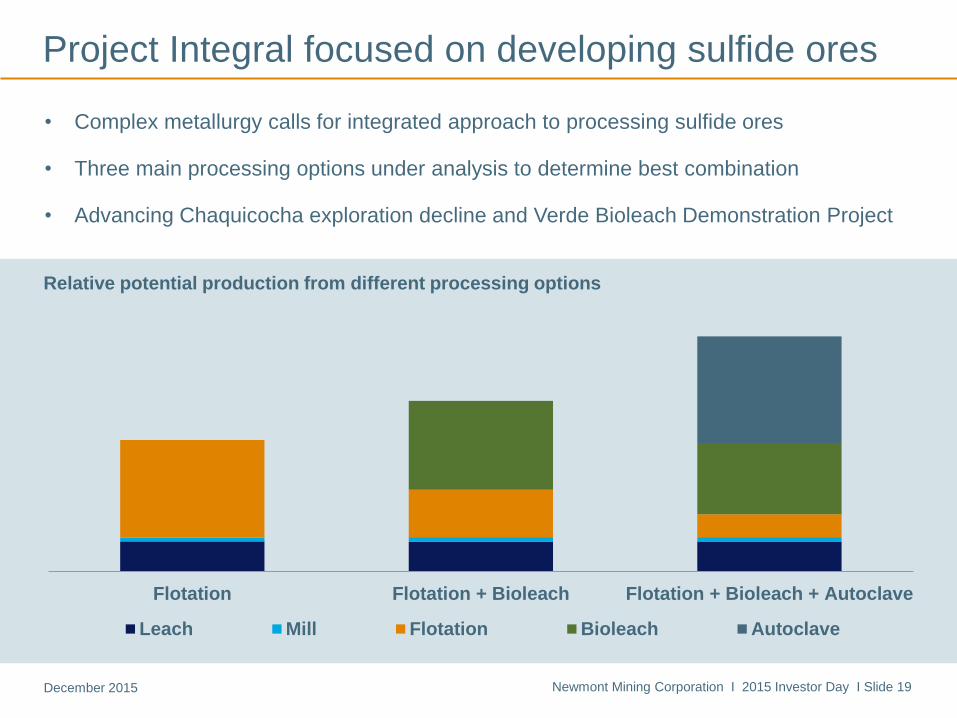
Project Integral focused on developing sulfide ores
• Complex metallurgy calls for integrated approach to processing sulfide ores
• Three main processing options under analysis to determine best combination
• Advancing Chaquicocha exploration decline and Verde Bioleach Demonstration Project
Flotation Flotation + Bioleach Flotation + Bioleach + Autoclave
Leach Mill Flotation Bioleach Autoclave
Relative potential production from different processing options
Newmont Mining Corporation I 2015 Investor Day I Slide 19December 2015
Newmont Mining Corporation I 2015 Investor Day I Slide 62December 2015
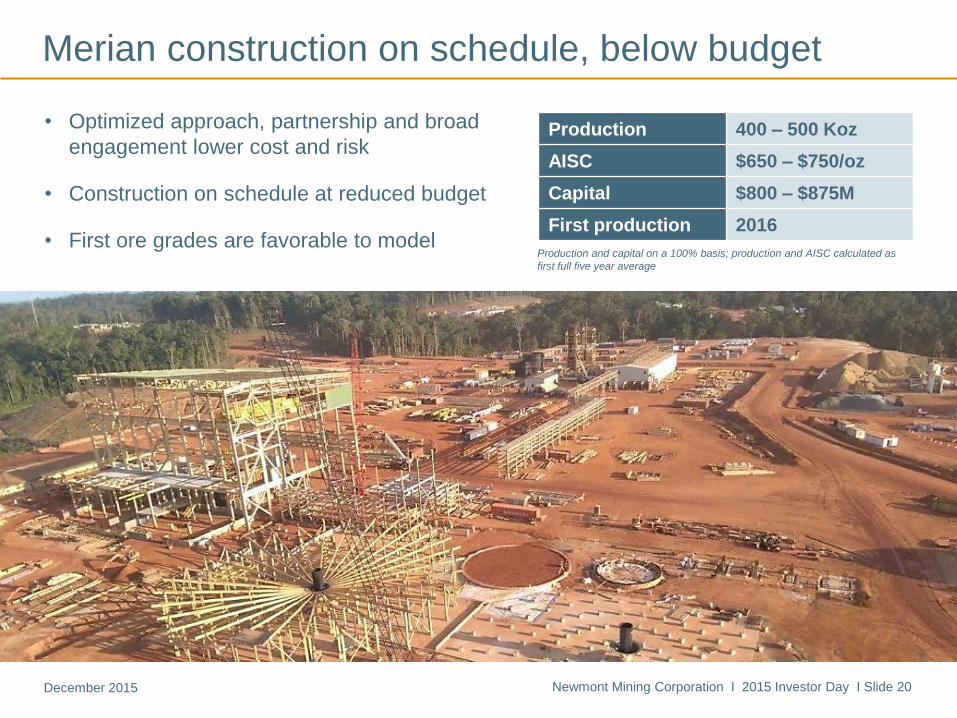
Merian construction on schedule, below budget
• Optimized approach, partnership and broad
engagement lower cost and risk
• Construction on schedule at reduced budget
• First ore grades are favorable to modelProduction and capital on a 100% basis; production and AISC calculated as
first full five year average
Production 400 – 500 Koz
AISC $650 – $750/oz
Capital $800 – $875M
First production 2016
Newmont Mining Corporation I 2015 Investor Day I Slide 20December 2015

Johan Ferreira Regional Senior Vice President, Africa

Newmont Mining Corporation I 2015 Investor Day I Slide 64December 2015
Prospective underground district emerging in Africa
• Full Potential and mine plan improvements offset higher costs
• Advancing profitable expansion projects at Ahafo to counter lower grades, harder ore
• Maintaining leading performance at Akyem
Gold production and AISC trends and outlook
$784$647
$0
$200
$400
$600
$800
$1,000
$1,200
$1,400
0
100
200
300
400
500
600
700
800
900
1000
2013 2014 2015E 2016E 2017E 2018E
Gold production (Moz) Gold production outlook (Moz) AISC ($/oz)
$850 – 900$740 – 790
$900 – 1,000
699
$950 – 1,050
914
760 – 820 700 – 800650 – 750
750 – 810
Newmont Mining Corporation I 2015 Investor Day I Slide 22December 2015

Newmont Mining Corporation I 2015 Investor Day I Slide 65December 2015
Offsetting lower grades at Ahafo
• Mine plan improvements more than offset
higher energy, labor and other costs
• Optimizing expansion options to
accelerate profitable production
• Integrated approach to developing a
regional underground strategy
7 percentLower AISC per ounce since 2012 despite
a 30 percent drop in grade
Newmont Mining Corporation I 2015 Investor Day I Slide 23December 2015

Newmont Mining Corporation I 2015 Investor Day I Slide 66December 2015
Ahafo Mill Expansion lays foundation for growth
• Offsets impact of harder ore and lower grades
• Leverages existing infrastructure
• Synergies with Subika Underground project
Production 100 – 125 Koz
Capital $140 – $160M
Decision H2 2016
First production 2018
Production is first full five year average
Newmont Mining Corporation I 2015 Investor Day I Slide 24December 2015
Newmont Mining Corporation I 2015 Investor Day I Slide 67December 2015
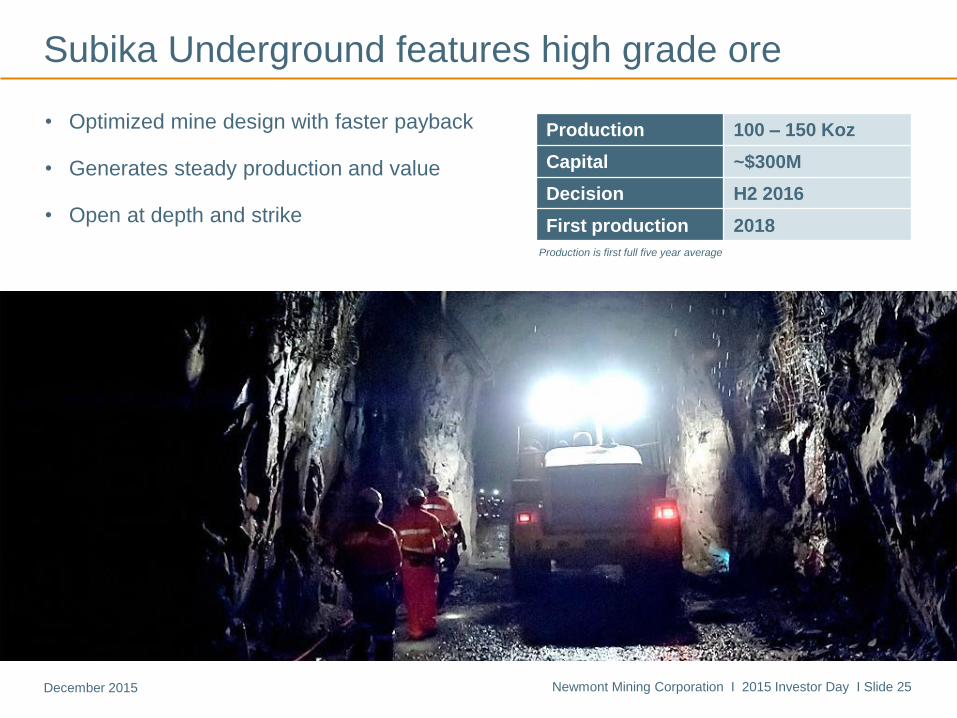
Subika Underground features high grade ore
• Optimized mine design with faster payback
• Generates steady production and value
• Open at depth and strike
Production 100 – 150 Koz
Capital ~$300M
Decision H2 2016
First production 2018
Production is first full five year average
Newmont Mining Corporation I 2015 Investor Day I Slide 25December 2015

Newmont Mining Corporation I 2015 Investor Day I Slide 68December 2015
Akyem maintaining momentum after strong start up
• Delivered on time and under budget,
transferring best practices from Ahafo
• Completed strong first year; one of
lowest cost operations in portfolio
• Achieved one full year of Zero Harm in
October
400
600
800
1000
1200
Au
g-1
3
No
v-1
3
Fe
b-1
4
Ma
y-1
4
Au
g-1
4
No
v-1
4
Fe
b-1
5
Ma
y-1
5
Au
g-1
5
Actual Design
Akyem throughput rate (tonnes per hour)
Newmont Mining Corporation I 2015 Investor Day I Slide 26December 2015

Tom PalmerRegional Senior Vice President, Asia Pacific

Newmont Mining Corporation I 2015 Investor Day I Slide 70December 2015
$1,217
$995
$0
$200
$400
$600
$800
$1,000
$1,200
$1,400
$1,600
0
500
1000
1500
2000
2500
2013 2014 2015E 2016E 2017E 2018E
Gold Production Actual (Moz) Gold Production Outlook (Moz) AISC ($/oz)
$760 - 820$740 - 790 $700 - 800
1.71.8
$850 - 950
Asia Pacific generating value and free cash flow
• Improved performance at Kalgoorlie with streamlined management
• Batu Hijau operating at full capacity and optimizing Phase 7
• Tanami expansion and ongoing improvements offset mine sequencing at Boddington
Gold production* and AISC trends and outlook
1.7 – 1.91.8 – 2.0
1.4 – 1.7
1.9 – 2.0
*Attributable; excludes Regis (19.45%)
Newmont Mining Corporation I 2015 Investor Day I Slide 28December 2015

Newmont Mining Corporation I 2015 Investor Day I Slide 71December 2015
• Option maximizes IRR, cash flow and value
• Expansion improves costs and mine life
• Platform for growth – potential to double
Reserves & Resources at comparable grades
Tanami Expansion adds profitable ounces, mine life
Cripple Creek & Victor
Production To 425 – 475 Koz
AISC ~$50/oz lower
Capital $100 – $120M
First production 2017
Production and AISC calculated as first full five year average for Tanami,
including the expansion
Newmont Mining Corporation I 2015 Investor Day I Slide 29December 2015

Newmont Mining Corporation I 2015 Investor Day I Slide 72December 2015
Boddington reaching its full potential
• Improved mill utilization and recovery
through Full Potential
• Extending mine life through optimized
South Pit layback
• Ongoing focus on productivity and cost
improvement
$15 millionAnnual improvements achieved by
reducing plant shut-down hours by 50%
Newmont Mining Corporation I 2015 Investor Day I Slide 30December 2015

Newmont Mining Corporation I 2015 Investor Day I Slide 73December 2015
Kalgoorlie performance improving steadily
• Streamlined management structure
improves efficiency and accountability
• Ultra-Fine Grind mill eliminates SO2 and
Hg emissions from roasters
• Morrison cutback adds mine life within
existing operating footprint
A$10 millionInitial supply chain savings identified
under new management agreement
Newmont Mining Corporation I 2015 Investor Day I Slide 31December 2015

Newmont Mining Corporation I 2015 Investor Day I Slide 74December 2015
Batu Hijau continuing to deliver value
• Phase 6 mining continues through 2017
• Optimized Phase 7; strong returns but
considerable investment
• Working to secure Contract of Work
amendment; export permit received
Phase 6
Original Phase 7
Optimized Phase 7
Newmont Mining Corporation I 2015 Investor Day I Slide 32December 2015
Questions?
Agenda
Business outlook
12:00pm – 1:30pm
Technical outlook
1:30pm – 2:30pm
Operational outlook
2:30pm – 5:00pm
Welcome and safety share
• Gary Goldberg
Newmont outlook
• Gary Goldberg
Market outlook
• Randy Engel
Financial outlook
• Laurie Brlas
Q&A
Technical outlook
• Scott Lawson
Break
Technical fundamentals
poster session
• Marcelo Godoy
• John Kinneberg
• Dave McLaren
• Mike Wundenberg
Operational outlook
• Chris Robison
• Tom Kerr
• Trent Tempel
• Johan Ferreira
• Tom Palmer
Q&A
Exploration outlook
• Grigore Simon
Closing remarks and Q&A
• Gary Goldberg
Newmont Mining Corporation I 2015 Investor Day I Slide 1December 2015

Exploration overviewGrigore Simon
Senior Vice President, Exploration

Newmont Mining Corporation I 2015 Investor Day I Slide 78December 2015
• Exploration is a key driver to value creation
• Proven track record of delivery
• Delivery of high value ounce additions and retain exposure to new discoveries
Exploration is a core competency and value driver
Newmont Mining Corporation I 2015 Investor Day I Slide 3December 2015

Newmont Mining Corporation I 2015 Investor Day I Slide 79December 2015
Focused on high grade, near mine options
Newmont Mining Corporation I 2015 Investor Day I Slide 4December 2015

Newmont Mining Corporation I 2015 Investor Day I Slide 80December 2015
North America remains highly prospective
Newmont Mining Corporation I 2015 Investor Day I Slide 5December 2015

Newmont Mining Corporation I 2015 Investor Day I Slide 81December 2015
Long Canyon – halfway toward acquisition premise
Upside Potential
• 75% of Inventory converted to R&R
• Mineralization over 4.5km strike length is open
Highlights
• Reserves and Resource additions in 2016
• East zone discovery (up to 25.6m @ 14.7 g/t Au) identified by Deep Sensing Geochemistry (DSG)
Reserves and Resource (R&R) base
• Reserves: 1.2 Moz (16.7Mt @ 2.3 g/t Au)
• Resource: 2.2 Moz (22.8Mt @ 3.1 g/t Au)
*For all graphics and mineralization representations on slides 6 - 16, please refer to endnote 8
Newmont Mining Corporation I 2015 Investor Day I Slide 6December 2015

Newmont Mining Corporation I 2015 Investor Day I Slide 82December 2015
Highlights
• Reserves and Resource additions in 2015
• Exodus Footwall discovery (up to 51m @ 12.5 g/t Au); continuity between Exodus and NW Exodus
Reserves and Resource (R&R) base
• Reserves: 0.1 Moz (0.7Mt @ 6.1 g/t Au)
• Resource: 0.7 Moz (2.5Mt @ 9.2 g/t Au)
Upside Potential
• 50% of Inventory converted to R&R
• Half of +4.0km target drill tested
NW Exodus – growing into major high grade deposit
Newmont Mining Corporation I 2015 Investor Day I Slide 7December 2015

Newmont Mining Corporation I 2015 Investor Day I Slide 83December 2015
Highlights
• Resource additions in 2015
• New mineralized trends (up to 62m @ 11.2 g/t Au) identified by Deep Sensing Geochemistry (DSG)
Reserves and Resource (R&R) base
• Reserves: 0.2 Moz (0.9Mt @ 8.3 g/t Au)
• Resource: 0.1 Moz (0.4Mt @ 8.5 g/t Au)
Upside Potential
• 23% of Inventory converted to R&R
• +3.0km mineralized corridor is open
Rita K-Pete Bajo – potential multimillion ounce camp
Newmont Mining Corporation I 2015 Investor Day I Slide 8December 2015
Newmont Mining Corporation I 2015 Investor Day I Slide 84December 2015
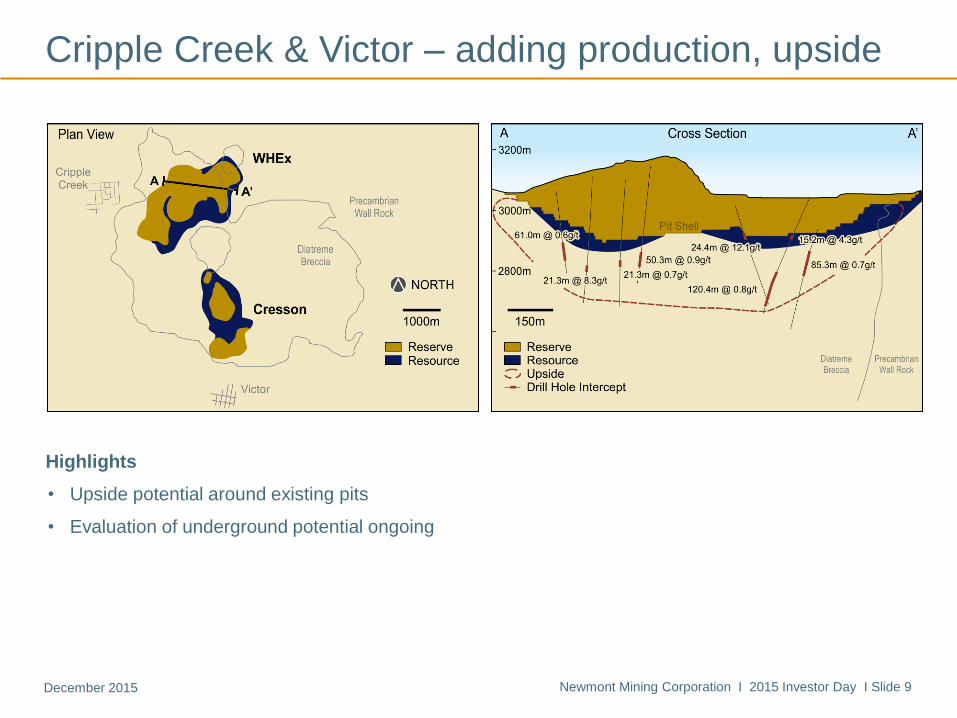
Cripple Creek & Victor – adding production, upside
Highlights
• Upside potential around existing pits
• Evaluation of underground potential ongoing
Newmont Mining Corporation I 2015 Investor Day I Slide 9December 2015

Newmont Mining Corporation I 2015 Investor Day I Slide 85December 2015
Continuously growing base in South America
Newmont Mining Corporation I 2015 Investor Day I Slide 10December 2015

Newmont Mining Corporation I 2015 Investor Day I Slide 86December 2015
Merian – further oxide and high grade UG potential
Reserves and Resource (R&R) base 100%
• Reserves: 4.8 Moz (127Mt @ 1.2 g/t Au)
• Resource: 1.9 Moz (61Mt @ 1.0 g/t Au)
Upside Potential
• 75% of Inventory converted to R&R
• Extensions, high grade UG, brownfields saprolite
Highlights
• Reserves and Resource additions in 2015
• UG potential at Merian II: 18m @ 8.3 g/t Au; 11m @ 8.7 g/t Au; 15m @ 5.9 g/t Au
Newmont Mining Corporation I 2015 Investor Day I Slide 11December 2015

Newmont Mining Corporation I 2015 Investor Day I Slide 87December 2015
Prospective underground resource in Africa
Newmont Mining Corporation I 2015 Investor Day I Slide 12December 2015
Newmont Mining Corporation I 2015 Investor Day I Slide 88December 2015
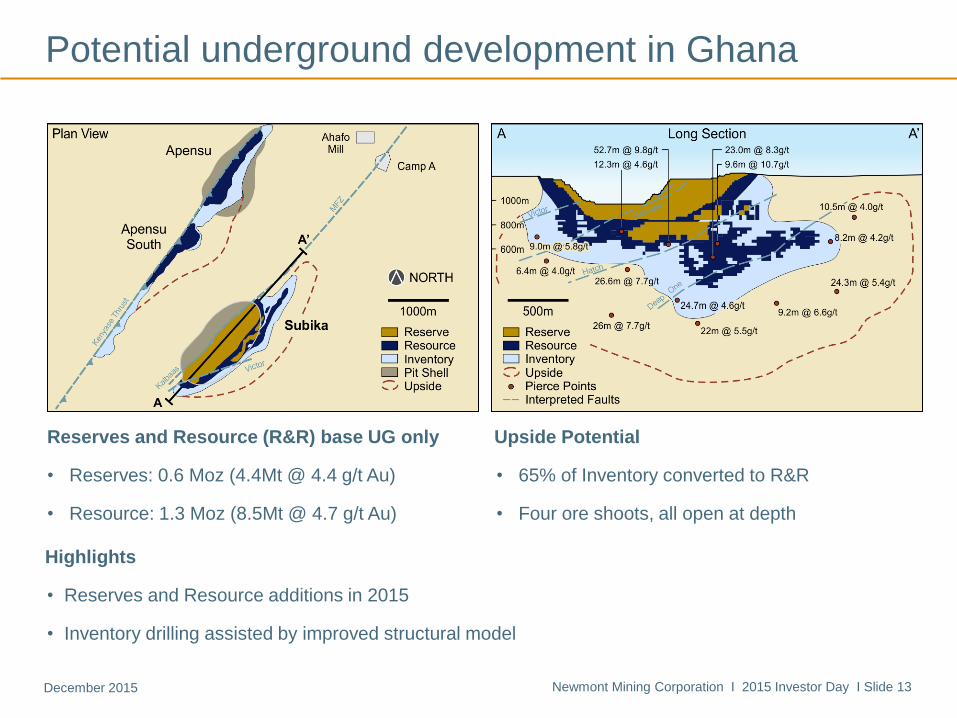
Potential underground development in Ghana
Reserves and Resource (R&R) base UG only
• Reserves: 0.6 Moz (4.4Mt @ 4.4 g/t Au)
• Resource: 1.3 Moz (8.5Mt @ 4.7 g/t Au)
Upside Potential
• 65% of Inventory converted to R&R
• Four ore shoots, all open at depth
Highlights
• Reserves and Resource additions in 2015
• Inventory drilling assisted by improved structural model
Newmont Mining Corporation I 2015 Investor Day I Slide 13December 2015

Newmont Mining Corporation I 2015 Investor Day I Slide 89December 2015
Promising results in Asia Pacific
Newmont Mining Corporation I 2015 Investor Day I Slide 14December 2015

Newmont Mining Corporation I 2015 Investor Day I Slide 90December 2015
Highlights
• Reserves and Resource additions in 2015
• New Liberator and Federation Discoveries (up to 16m @ 29.4 g/t Au and 6m @ 52 g/t Au)
• Auron (up to 52m @ 9.5 g/t Au); West Auron (up to 22m @ 18.8 g/t Au); Soolin (up to 20m @ 8.6 g/t Au)
Tanami UG – 10Moz growth through new discoveries
Reserves and Resource (R&R) base
• Reserves: 3.3 Moz (17.7Mt @ 5.8 g/t Au)
• Resource: 2.3 Moz (12.3Mt @ 5.9 g/t Au)
Upside Potential
• 66% of Inventory converted to R&R
• Extensions and repeating structures
Newmont Mining Corporation I 2015 Investor Day I Slide 15December 2015

Newmont Mining Corporation I 2015 Investor Day I Slide 91December 2015
Proprietary technologies drive competitive advantage
Deep Sensing Geochemistry (DSG)
• New proprietary technology
• Depth of investigation +500m
3D Distributed Acquisition System (NEWDAS)
• 3D data acquisition system
• Depth of investigation ~1,000m
Technology-driven undercover exploration success
• DSG: Long Canyon E (22m @ 16.5 g/t Au at 350m depth); Fence (62m @ 11.2 g/t Au at 400m depth)
• 3D-IP: Ahafo N (18m @ 7 g/t at 330m depth)
Newmont Mining Corporation I 2015 Investor Day I Slide 16December 2015

Gary GoldbergPresident and Chief Executive Officer

Where are we today? Where are we heading?
Safety Industry leading performance Zero injuries and illnesses
Sustainability Industry leading performance Improved country risk profile
Costs AISC down 27% since 2012 Ongoing savings to offset inflation
Portfolio ~$1.7B in non-core asset sales Superior value and risk profile
Production Steady production High value vs high cost ounces
Free Cash Flow Positive for 6 quarters running Self-fund projects and dividends
Returns Maximize risk-adjusted returns Maintain first quartile TSR
Balance sheet Net debt down 35% since 2013 Superior financial flexibility
Building on a solid foundation
Newmont Mining Corporation I 2015 Investor Day I Slide 18December 2015

Questions?
Appendix A: Site fact sheets

Newmont Mining Corporation I 2015 Investor Day I Slide 96December 2015 Newmont Mining Corporation I 2015 Investor Day I Slide 2December 2015
Carlin site details
Ownership: 100%
Location: West of Elko on the Carlin Trend
Operations: Four open pits and four underground mines
Process: High grade refractory ore processed through a roaster
(Mill 6); high grade oxide and transitional ore processed through
conventional milling, flotation and cyanide leaching at Mill 5, with
concentrates further treated at Mill 6 and Twin Creek’s Sage mill;
low grade material of suitable cyanide solubility treated by heap
leach
Products: Gold
2014 Reserves:
17.0 Moz Gold
2014 Resources:
3.9 Moz Gold
Key statistics9 2013 2014 2015 Outlook 2016 Outlook
Gold production (Koz) 1,025 907 850 – 910 1,040 – 1,100
Gold CAS ($/oz) $755 $878 $840 – $900 $750 – $800
Gold AISC ($/oz) $968 $1,072 $1,090 – $1,170 $925 – $975
Capex ($M) $238 $251 $250 – $270 $175 – $195

Newmont Mining Corporation I 2015 Investor Day I Slide 97December 2015 Newmont Mining Corporation I 2015 Investor Day I Slide 3December 2015
Twin Creeks site details
Ownership: 100% Twin Creeks; 25% TRJV
Located: Located 35 miles northeast of Winnemucca
Operations: Open pit and Turquoise Ridge underground mine
Process: High grade refractory ore processed through the Sage
autoclaves; high grade oxide ore processed through conventional
milling and cyanide leaching at the Juniper mill; low grade
material of suitable cyanide solubility treated on heap leach pads
Products: Gold
2014 Reserves:
6.0 Moz Gold
2014 Resources:
3.7 Moz Gold
Key statistics 2013 2014 2015 Outlook 2016 Outlook
Gold production (Koz) 509 389 410 – 440 370 – 400
Gold CAS ($/oz) $527 $517 $530 – $570 $575 – $625
Gold AISC ($/oz) $668 $820 $700 – $750 $700 – $750
Capex ($M) $68 $112 $50 – $60 $30 – $40
Newmont Mining Corporation I 2015 Investor Day I Slide 98December 2015 Newmont Mining Corporation I 2015 Investor Day I Slide 4December 2015
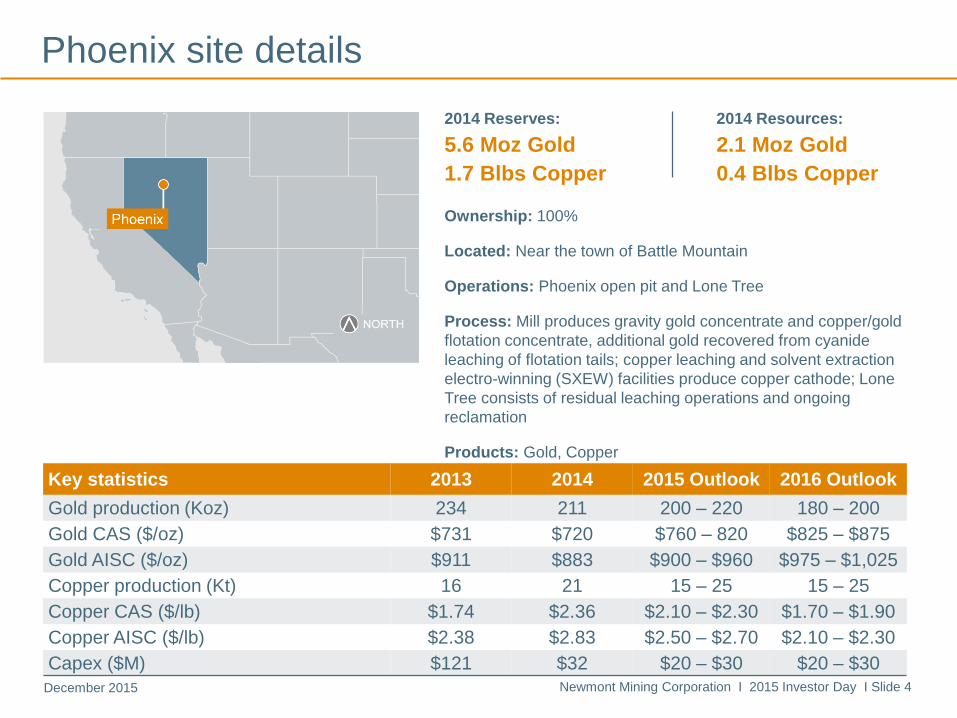
Phoenix site details
Ownership: 100%
Located: Near the town of Battle Mountain
Operations: Phoenix open pit and Lone Tree
Process: Mill produces gravity gold concentrate and copper/gold
flotation concentrate, additional gold recovered from cyanide
leaching of flotation tails; copper leaching and solvent extraction
electro-winning (SXEW) facilities produce copper cathode; Lone
Tree consists of residual leaching operations and ongoing
reclamation
Products: Gold, Copper
2014 Reserves:
5.6 Moz Gold
1.7 Blbs Copper
2014 Resources:
2.1 Moz Gold
0.4 Blbs Copper
Key statistics 2013 2014 2015 Outlook 2016 Outlook
Gold production (Koz) 234 211 200 – 220 180 – 200
Gold CAS ($/oz) $731 $720 $760 – 820 $825 – $875
Gold AISC ($/oz) $911 $883 $900 – $960 $975 – $1,025
Copper production (Kt) 16 21 15 – 25 15 – 25
Copper CAS ($/lb) $1.74 $2.36 $2.10 – $2.30 $1.70 – $1.90
Copper AISC ($/lb) $2.38 $2.83 $2.50 – $2.70 $2.10 – $2.30
Capex ($M) $121 $32 $20 – $30 $20 – $30

Newmont Mining Corporation I 2015 Investor Day I Slide 99December 2015 Newmont Mining Corporation I 2015 Investor Day I Slide 5December 2015
CC&V site details
Ownership: 100%
Located: Near the towns of Cripple Creek and Victor
Operations: 4 open pits
Process: Historically a valley leach facility; new 2Mtpa mill and
second valley leach being commissioned
Products: Gold
2014 Reserves:
n/a
2014 Resources:
n/a
Key statistics 2015 Outlook 2016 Outlook
Gold production (Koz) 80 – 100 350 – 400
Gold CAS ($/oz) $560 – $600 $525 – $575
Gold AISC ($/oz) $720 – $760 $650 – $700
Capex ($M) $50 – $60 $120 – $130
Newmont Mining Corporation I 2015 Investor Day I Slide 100December 2015 Newmont Mining Corporation I 2015 Investor Day I Slide 6December 2015
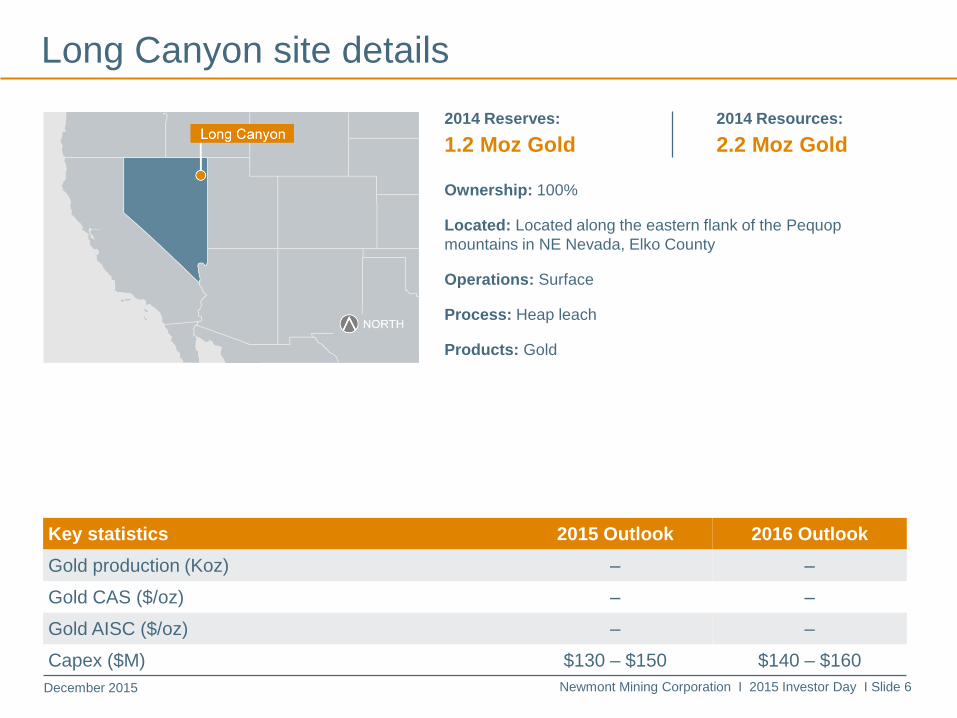
Long Canyon site details
Ownership: 100%
Located: Located along the eastern flank of the Pequop
mountains in NE Nevada, Elko County
Operations: Surface
Process: Heap leach
Products: Gold
2014 Reserves:
1.2 Moz Gold
2014 Resources:
2.2 Moz Gold
Key statistics 2015 Outlook 2016 Outlook
Gold production (Koz) – –
Gold CAS ($/oz) – –
Gold AISC ($/oz) – –
Capex ($M) $130 – $150 $140 – $160

Newmont Mining Corporation I 2015 Investor Day I Slide 101December 2015 Newmont Mining Corporation I 2015 Investor Day I Slide 7December 2015
Yanacocha site details
Ownership: 51.35%
Location: 375 miles north of Lima in Cajamarca region
Operations: 7 open pit mines
Process: Four leach pads, three processing facilities and one mill
Products: Gold
2014 Reserves:
2.5 Moz Gold
2014 Resources:
3.4 Moz Gold
Key statistics 2013 2014 2015 Outlook 2016 Outlook
Attributable gold production (Koz) 523 498 450 – 490 310 – 350
Gold CAS ($/oz) $671 $687 $550 – $590 $820 – $870
Gold AISC ($/oz) $1,004 $943 $870 – $930 $1,100 – $1,170
Capex ($M) $178 $83 $90 – $110 $70 – $90

Newmont Mining Corporation I 2015 Investor Day I Slide 102December 2015 Newmont Mining Corporation I 2015 Investor Day I Slide 8December 2015
Merian site details
Ownership: 75%
Location: 66 kilometers south of Moengo, Suriname
Operations: Surface
Process: conventional mill and standard carbon-in-leach circuit
for processing ore
Products: Gold
2014 Reserves:
3.6 Moz Gold
2014 Resources:
1.4 Moz Gold
Key statistics 2015 Outlook 2016 Outlook
Attributable gold production (Koz) – 90 – 100
Gold CAS ($/oz) – $430 – $460
Gold AISC ($/oz) – $650 – $700
Capex ($M) $400 – $420 $260 – $300

Newmont Mining Corporation I 2015 Investor Day I Slide 103December 2015 Newmont Mining Corporation I 2015 Investor Day I Slide 9December 2015
Ahafo site details
Ownership: 100%
Location: 180 miles northwest of Accra
Operations: Four open pits; underground mine under study
Process: Conventional mill and standard carbon-in-leach circuit
for processing ore
Products: Gold
Key statistics 2013 2014 2015 Outlook 2016 Outlook
Gold production (Koz) 570 442 300 – 330 330 – 360
Gold CAS ($/oz) $542 $552 $610 – $650 $775 – $825
Gold AISC ($/oz) $855 $849 $910 – $980 $1,020 – $1,100
Capex ($M) $170 $104 $80 – $100 $60 – $80
2014 Reserves:
9.9 Moz Gold
2014 Resources:
5.5 Moz Gold

Newmont Mining Corporation I 2015 Investor Day I Slide 104December 2015 Newmont Mining Corporation I 2015 Investor Day I Slide 10December 2015
Akyem site details
Ownership: 100%
Location: 80 miles northwest of Accra
Operations: One open pit mine
Process: Conventional mill and standard carbon-in-leach circuit
for processing ore
Products: Gold
Key statistics 2013 2014 2015 Outlook 2016 Outlook
Gold production (Koz) 129 472 450 – 480 430 – 460
Gold CAS ($/oz) $248 $364 $440 – $470 $560 – $600
Gold AISC ($/oz) $333 $423 $590 – $630 $700 – $750
Capex ($M) $240 $26 $45 – $55 $40 – $50
2014 Reserves:
6.7 Moz Gold
2014 Resources:
0.2 Moz Gold

Newmont Mining Corporation I 2015 Investor Day I Slide 105December 2015 Newmont Mining Corporation I 2015 Investor Day I Slide 11December 2015
Tanami site details
Ownership: 100%
Location: 342 miles northwest of Alice Springs in the Northern
Territory
Operations: One underground mine
Process: A crushing and grinding facility that feeds a gravity
recovery circuit which recovers approximately half of the gold,
the remainder is recovered through a conventional carbon-in-
leach circuit
Products: Gold
Key statistics 2013 2014 2015 Outlook 2016 Outlook
Gold production (Koz) 323 345 410 – 450 400 – 475
Gold CAS ($/oz) $832 $727 $530 – $570 $550 – $600
Gold AISC ($/oz) $1,163 $1,038 $750 – $800 $800 – $850
Capex ($M) $93 $90 $100 – $110 $150 – $160
2014 Reserves:
3.3 Moz Gold
2014 Resources:
2.3 Moz Gold

Newmont Mining Corporation I 2015 Investor Day I Slide 106December 2015 Newmont Mining Corporation I 2015 Investor Day I Slide 12December 2015
Boddington site details
Ownership: 100%
Location: 81 miles southeast of Perth
Operations: Two open pits
Process: Crushed ore is fed into a milling and flotation circuit to
produce copper and gold concentrate. Flotation tails are then
leached to recover approximately 25 percent of the gold
produced, while the remaining 75 percent remains in the
concentrate which is shipped to offshore smelters.
Products: Gold, Copper
Key statistics 2013 2014 2015 Outlook 2016 Outlook
Gold production (Koz) 704 696 730 – 780 725 – 775
Gold CAS ($/oz) $1,083 $849 $675 – $725 $690 – $730
Gold AISC ($/oz) $1,222 $972 $780 – $830 $800 – $850
Copper production (Kt) 30 31 25 – 35 25 – 35
Copper CAS ($/lb) $2.75 $2.38 $1.70 – $1.90 $1.90 – $2.10
Copper AISC ($/lb) $3.35 $3.09 $2.10 – $2.30 $2.30 – $2.50
Capex ($M) $113 $87 $55 – $65 $60 – $70
2014 Reserves:
12.2 Moz Gold
1.4 Blbs Copper
2014 Resources:
2.4 Moz Gold
0.3 Blbs Copper

Newmont Mining Corporation I 2015 Investor Day I Slide 107December 2015 Newmont Mining Corporation I 2015 Investor Day I Slide 13December 2015
Kalgoorlie site details
Ownership: 50%
Location: 373 miles east of Perth
Operations: Fimiston pit (commonly referred to as the Super Pit)
and Mt. Charlotte underground mine
Process: Two SAG and associated ball mills, as well as a gravity
and flotation circuit where the majority of gold reports to a pyrite
concentrate, concentrate is fed into an ultra-fine grind mill with
gold then recovered by conventional carbon-in-leach circuit
Products: Gold
Key statistics 2013 2014 2015 Outlook 2016 Outlook
Attributable gold production (Koz) 332 329 310 – 340 350 – 400
Gold CAS ($/oz) $1,040 $868 $810 – $870 $650 – $700
Gold AISC ($/oz) $1,131 $1,009 $930 – $1,000 $725 – $775
Capex ($M) $19 $33 $20 – $30 $10 – $20
2014 Reserves:
3.5 Moz Gold
2014 Resources:
1.2 Moz Gold

Newmont Mining Corporation I 2015 Investor Day I Slide 108December 2015 Newmont Mining Corporation I 2015 Investor Day I Slide 14December 2015
Batu Hijau site details
Ownership: 48.5%
Location: 950 miles from Jakarta on the island of Sumbawa
Operation: Open pit porphyry copper/gold deposit
Process: Crushed ore is fed through a flotation circuit to produce
a copper/gold concentrate which is piped to a filtration plant
before being shipped to both domestic and offshore smelters
Products: Gold, Copper
Key statistics 2013 2014 2015 Outlook 2016 Outlook
Attributable gold production (Koz) 23 37 310 – 340 250 – 275
Gold CAS ($/oz) $2,332 $1,123 $410 – $440 $500 – $550
Gold AISC ($/oz) $2,848 $1,458 $550 – $580 $650 – $700
Attributable copper production (Kt) 35 34 100 – 120 80 – 100
Copper CAS ($/lb) $5.17 $3.24 $1.00 – $1.20 $1.00 – $1.20
Copper AISC ($/lb) $6.34 $4.14 $1.40 – $1.60 $1.40 – $1.60
Capex ($M) $105 $59 $80 – $90 $50 – $60
2014 Reserves:
3.3 Moz Gold
3.2 Blbs Copper
2014 Resources:
1.3 Moz Gold
1.1 Blbs Copper

Appendix B: Executive biographies
Newmont Mining Corporation I 2015 Investor Day I Slide 110December 2015
Management team biographies
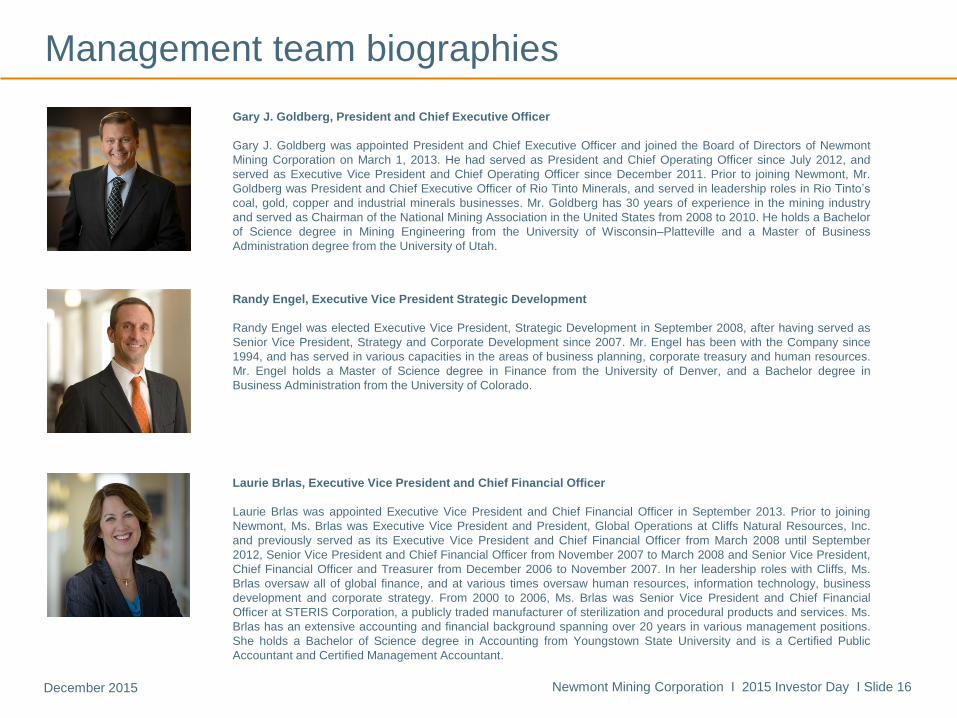
Gary J. Goldberg, President and Chief Executive Officer
Gary J. Goldberg was appointed President and Chief Executive Officer and joined the Board of Directors of Newmont
Mining Corporation on March 1, 2013. He had served as President and Chief Operating Officer since July 2012, and
served as Executive Vice President and Chief Operating Officer since December 2011. Prior to joining Newmont, Mr.
Goldberg was President and Chief Executive Officer of Rio Tinto Minerals, and served in leadership roles in Rio Tinto’s
coal, gold, copper and industrial minerals businesses. Mr. Goldberg has 30 years of experience in the mining industry
and served as Chairman of the National Mining Association in the United States from 2008 to 2010. He holds a Bachelor
of Science degree in Mining Engineering from the University of Wisconsin–Platteville and a Master of Business
Administration degree from the University of Utah.
Laurie Brlas, Executive Vice President and Chief Financial Officer
Laurie Brlas was appointed Executive Vice President and Chief Financial Officer in September 2013. Prior to joining
Newmont, Ms. Brlas was Executive Vice President and President, Global Operations at Cliffs Natural Resources, Inc.
and previously served as its Executive Vice President and Chief Financial Officer from March 2008 until September
2012, Senior Vice President and Chief Financial Officer from November 2007 to March 2008 and Senior Vice President,
Chief Financial Officer and Treasurer from December 2006 to November 2007. In her leadership roles with Cliffs, Ms.
Brlas oversaw all of global finance, and at various times oversaw human resources, information technology, business
development and corporate strategy. From 2000 to 2006, Ms. Brlas was Senior Vice President and Chief Financial
Officer at STERIS Corporation, a publicly traded manufacturer of sterilization and procedural products and services. Ms.
Brlas has an extensive accounting and financial background spanning over 20 years in various management positions.
She holds a Bachelor of Science degree in Accounting from Youngstown State University and is a Certified Public
Accountant and Certified Management Accountant.
Randy Engel, Executive Vice President Strategic Development
Randy Engel was elected Executive Vice President, Strategic Development in September 2008, after having served as
Senior Vice President, Strategy and Corporate Development since 2007. Mr. Engel has been with the Company since
1994, and has served in various capacities in the areas of business planning, corporate treasury and human resources.
Mr. Engel holds a Master of Science degree in Finance from the University of Denver, and a Bachelor degree in
Business Administration from the University of Colorado.
Newmont Mining Corporation I 2015 Investor Day I Slide 16December 2015

Newmont Mining Corporation I 2015 Investor Day I Slide 111December 2015
Management team biographies
Grigore Simon, Senior Vice President, Exploration
Grigore Simon was elected Senior Vice President, Exploration in February 2012, after having served as Vice President,
Exploration since April 2009. Previously, he served as General Manager, Generative Exploration from 2007 to 2009, and
as Chief Geoscientist of the Global Exploration Solutions group from 2004 to 2007. Prior to joining Newmont, Mr. Simon
had exploration management positions with Shell International in Angola and Saudi Arabia since 1998. He also worked
as an exploration geologist for several mining firms and as Assistant Professor of Economic Geology at the University of
Bucharest. He holds an Engineering degree in Geology and Geophysics from the University of Bucharest, Romania; a
Master’s degree and Ph.D. in Geology from the University of Michigan; and Master of Business Administration degrees
from the University of Rochester and the University of Nyenrode, Netherlands.
Scott P. Lawson, Executive Vice President, Technical Services
Scott P. Lawson was elected Executive Vice President, Technical Services in March 2015 having previously served as
Senior Vice President, Technical Services since December 2012. Prior to joining Newmont, Mr. Lawson served as
Senior Vice President, Engineering Services at Peabody Energy, responsible for global engineering and technical
services support. Mr. Lawson spent 22 years with international miner Rio Tinto including executive roles and as Vice
President, Engineering and Technical Services for Kennecott Utah Copper. He has also served on the Utah Air Quality
Board and the Utah Safety Council Board. Mr. Lawson holds a Bachelor of Science degree in Civil Engineering from the
University of Utah and a Master of Business Administration degree from the University of Phoenix in Salt Lake City. He
is also a member of the University of Utah Department of Civil & Environmental Engineering Industrial Advisory Board.
Chris Robison , Executive Vice President and Chief Operating Officer
Chris Robison was elected Executive Vice President and Chief Operating Officer in March 2015 having previously
served as Executive Vice President, Operations and Projects since May 2013. Prior to joining Newmont, Mr. Robison
served as Chief Operating Officer for Rio Tinto Minerals, where he managed a global portfolio of mines and processing
and shipping facilities, and delivered significant improvements to the organization’s profitability as well as its health and
safety, environmental and quality performance. With more than 32 years of experience in the copper, gold, molybdenum,
borates and talc mining sectors, Mr. Robison has delivered step-change improvements in safety, productivity and work
practices, organizational effectiveness and developing people. He earned a Bachelor of Science degree in Metallurgical
Engineering from the University of Nevada–Reno, Mackay School of Mines. He is a member of the Society of
Metallurgical Engineers and has served on the Board of Directors of the Utah Mining Association. He currently serves on
the University of Nevada, Mackay School of Mines Advisory Board.
Newmont Mining Corporation I 2015 Investor Day I Slide 17December 2015

Newmont Mining Corporation I 2015 Investor Day I Slide 112December 2015
Management team biographies
Stephen P. Gottesfeld, Executive Vice President and General Counsel
Stephen P. Gottesfeld serves as Executive Vice President and General Counsel after having been elected Executive
Vice President, General Counsel and Corporate Secretary in February 2013. He previously served as Senior Vice
President, General Counsel and Corporate Secretary since February 2012 and Vice President and General Counsel
since 2010. Mr. Gottesfeld was the Vice President of Communications and Public Affairs from 2006 to 2010. He served
as Newmont’s Associate General Counsel from 2004 to 2006, responsible for Newmont’s Latin American, African and
Central Asian legal offices. From 2002 to 2004, Mr. Gottesfeld was Newmont’s Associate General Counsel and General
Manager of Newmont Peru S.R.L., spending three years of his career with Newmont working in Lima, Peru. Prior to
joining Newmont in 1997 as Senior Counsel, Mr. Gottesfeld was an Associate at Holland & Hart LLP. He earned a law
degree and a Master’s degree in International Affairs from the University of Denver in 1993 and received a Bachelor of
Arts degree in Economics from The Colorado College in 1989.
Elaine Dorward-King, Executive Vice President, Sustainability and External Relations
Dr. Elaine Dorward-King was elected Executive Vice President, Sustainability and External Relations in March 2013.
Prior to joining Newmont, Dr. Dorward-King served as Managing Director of Richards Bay Minerals in South Africa from
December 2010 through February 2013. Dr. Dorward-King previously served as the Global Head of Health, Safety and
Environment at Rio Tinto from 2002 through 2010 and also held leadership positions with Rio Tinto’s copper and borates
businesses. Prior to that, she worked for Ebasco Environmental and for Monsanto Company as a chemist, research
specialist and product manager. Dr. Dorward-King brings 25 years of leadership experience in creating and
implementing sustainable development, safety, health and environmental strategy and programs in the mining, chemical
and engineering consulting sectors. She holds a Bachelor of Science magna cum laude from Maryville College and a
Ph.D. in Analytical Chemistry from Colorado State University.
Newmont Mining Corporation I 2015 Investor Day I Slide 18December 2015

Newmont Mining Corporation I 2015 Investor Day I Slide 113December 2015
Management team biographies
Susan Keefe , Vice President, Strategic Relations
Susan Keefe was elected Vice President, Strategic Relations in March 2013. Prior to joining Newmont in October 2012,
Ms. Keefe served with Rio Tinto for 19 years, most recently as General Manager, Communications and External
Relations for Rio Tinto’s Diamonds and Minerals product group, and prior to that as Vice President, Communications at
Rio Tinto Minerals. Before joining Rio Tinto, Ms. Keefe was Managing Director of a leading international communications
agency. Ms. Keefe has more than 25 years of experience creating and executing communications, stakeholder
engagement and brand and reputation management strategies. She holds a Bachelor’s degree in Human Biology from
Stanford University.
Bill MacGowan, Executive Vice President, Human Resources
Bill MacGowan serves as Executive Vice President, Human Resources after having been elected Executive Vice
President, Human Resources and Communications in 2010. Prior to joining Newmont, Mr. MacGowan served as Chief
Human Resources Officer and Executive Vice President, People and Places, for Sun Microsystems, where he oversaw
a staff of 750 and an annual operating budget of $600 million. In addition, Mr. MacGowan was responsible for Sun’s $1.2
billion real estate portfolio, encompassing five campuses and 12.5 million square feet.
With more than 30 years of human resources experience, Mr. MacGowan has a history of aligning people strategies with
business results and creating a diverse, engaging and collaborative culture. In 2007, he received the Diversity Best
Practices Legacy Award for lifetime achievements on behalf of women, minorities and people of color in the workplace.
Mr. MacGowan earned his Bachelor of Arts degree in Political Science from Claremont McKenna College.
Newmont Mining Corporation I 2015 Investor Day I Slide 19December 2015
Newmont Mining Corporation I 2015 Investor Day I Slide 114December 2015
Regional Senior Vice Presidents
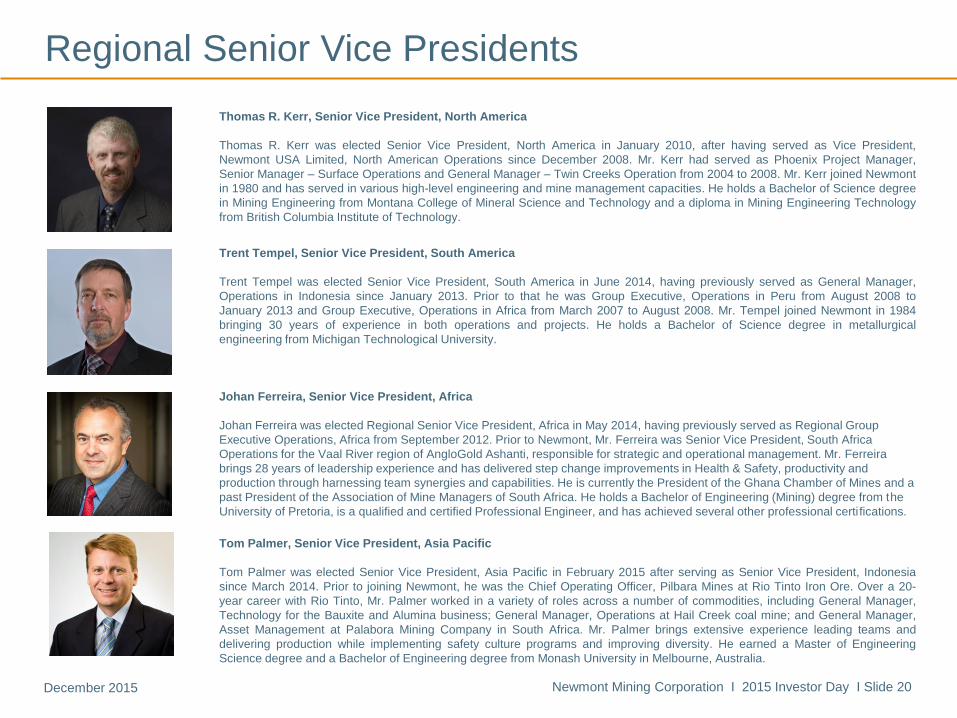
Johan Ferreira, Senior Vice President, Africa
Johan Ferreira was elected Regional Senior Vice President, Africa in May 2014, having previously served as Regional Group
Executive Operations, Africa from September 2012. Prior to Newmont, Mr. Ferreira was Senior Vice President, South Africa
Operations for the Vaal River region of AngloGold Ashanti, responsible for strategic and operational management. Mr. Ferreira
brings 28 years of leadership experience and has delivered step change improvements in Health & Safety, productivity and
production through harnessing team synergies and capabilities. He is currently the President of the Ghana Chamber of Mines and a
past President of the Association of Mine Managers of South Africa. He holds a Bachelor of Engineering (Mining) degree from the
University of Pretoria, is a qualified and certified Professional Engineer, and has achieved several other professional certi fications.
Thomas R. Kerr, Senior Vice President, North America
Thomas R. Kerr was elected Senior Vice President, North America in January 2010, after having served as Vice President,
Newmont USA Limited, North American Operations since December 2008. Mr. Kerr had served as Phoenix Project Manager,
Senior Manager – Surface Operations and General Manager – Twin Creeks Operation from 2004 to 2008. Mr. Kerr joined Newmont
in 1980 and has served in various high-level engineering and mine management capacities. He holds a Bachelor of Science degree
in Mining Engineering from Montana College of Mineral Science and Technology and a diploma in Mining Engineering Technology
from British Columbia Institute of Technology.
Tom Palmer, Senior Vice President, Asia Pacific
Tom Palmer was elected Senior Vice President, Asia Pacific in February 2015 after serving as Senior Vice President, Indonesia
since March 2014. Prior to joining Newmont, he was the Chief Operating Officer, Pilbara Mines at Rio Tinto Iron Ore. Over a 20-
year career with Rio Tinto, Mr. Palmer worked in a variety of roles across a number of commodities, including General Manager,
Technology for the Bauxite and Alumina business; General Manager, Operations at Hail Creek coal mine; and General Manager,
Asset Management at Palabora Mining Company in South Africa. Mr. Palmer brings extensive experience leading teams and
delivering production while implementing safety culture programs and improving diversity. He earned a Master of Engineering
Science degree and a Bachelor of Engineering degree from Monash University in Melbourne, Australia.
Trent Tempel, Senior Vice President, South America
Trent Tempel was elected Senior Vice President, South America in June 2014, having previously served as General Manager,
Operations in Indonesia since January 2013. Prior to that he was Group Executive, Operations in Peru from August 2008 to
January 2013 and Group Executive, Operations in Africa from March 2007 to August 2008. Mr. Tempel joined Newmont in 1984
bringing 30 years of experience in both operations and projects. He holds a Bachelor of Science degree in metallurgical
engineering from Michigan Technological University.
Newmont Mining Corporation I 2015 Investor Day I Slide 20December 2015

Newmont Mining Corporation I 2015 Investor Day I Slide 115December 2015
Technical Services biographies
Marcelo Godoy, Group Executive, Resource Modeling
With over 17 years of experience, Marcelo holds a PHD in Strategic Mine Planning from the WH Bryan Mining Geology
Research Centre in Australia. As the regional leader of Ore Evaluation Services at Golder Associates, he previously led the
provision of Resource and Reserve Estimation for the mining industry in South America. He served on their board and
managed a series of mining feasibility studies for clients such as BHPB. Codelco, and Antofagasta Minerals. Marcelo and
his team lead the development of resource models and ore control strategies that maximize ore body value and
consistently deliver predictable outcomes to the business across the Newmont value chain.
John Kinneberg, Group Executive, Mine Engineering
John Kinneberg has over 30 years of international mining experience, including expertise in prefeasibility, mine engineering
and mine operations. The goal of Mine Engineering is to enhance Newmont’s business value by providing industry-leading
people, processes and systems for mine engineering, geotechnical and hydrological support for underground and open pit
operations. John and his team also support studies and projects to ensure safe, realistic and achievable production plans.
In addition, they will focus on the discovery and delivery of new technology solutions and innovation in open pit and
underground mining systems.
Dave McLaren, Group Executive, Processing
Dave has over 30 years experience in metallurgy, process development and operations, including 25 years with Newmont.
He has extensive experience in copper and gold processing, including oxide, sulfide, and refractory with 14 years
experience in plant metallurgy and process development. Dave and his team support and enhance Newmont’s business
value by providing industry-leading process development, operations support, metallurgical, analytical, water treatment,
and mineralogical technology and services to aid in decision making, increased profitability and business growth in a
manner consistent with Newmont's core values.
Mike Wundenberg, Group Executive, Asset Management and Business Improvement
Mike has over 20 years’ experience in mining and has held various management positions both within the company and as
a supporting contractor. He has been associated with Newmont since 1998 working at Batu Hijau, Yanacocha and APAC.
Mike worked for BHP Billiton on the Olympic Dam Expansion project for two years and held the position of Manager,
Mining prior to rejoining Newmont. Mike’s team provides global Asset Management support as well as providing program
management for Full Potential, and support for Global Operations Metrics.
Newmont Mining Corporation I 2015 Investor Day I Slide 21December 2015
Newmont Mining Corporation I 2015 Investor Day I Slide 116December 2015
Board of Directors biographies
Vincent A. Calarco
Vincent A. Calarco is the former Chairman, President and Chief Executive Officer of Crompton Corporation, a specialty chemical
company. He is a current director and chairman of the Audit Committee of Consolidated Edison and a former director of CPG
International Inc. and Asarco Corporation. Mr. Calarco has served as Newmont’s independent Chairman of the Board from 2008 to
the present.
Greg Boyce
Mr. Boyce brings extensive operations and global mining experience to Newmont’s Board. Mr. Boyce currently serves as
Executive Chairman of Peabody Energy. He joined Peabody in 2003 as Chief Operating Officer, and assumed responsibility for
the company as Chief Executive Officer from 2006-2015. His previous leadership roles also include Chief Executive Officer,
Energy for Rio Tinto; President and Chief Executive Officer of Kennecott Energy Company; and President of Kennecott Minerals
Company. Mr. Boyce holds a Bachelor of Science degree in mining engineering from the University of Arizona and an Advanced
Management Program degree from Harvard University’s Graduate School of Business. Mr. Boyce serves as the Chairman of the
Coal Industry Advisory Board of the International Energy Agency and is a former Chairman of the National Mining Association. He
serves on the Board of Directors of the U.S.-China Business Council, and is a member of The Business Council, Business
Roundtable and the National Coal Council. Mr. Boyce is a member of the Boards of Directors of Marathon Oil Corporation and of
Monsanto Company.
Noreen Doyle
Noreen Doyle was the First Vice President of the European Bank for Reconstruction and Development from 2001 to 2005. Ms.
Doyle also serves as the Vice Chair and Lead Independent Director of the Board of Credit Suisse Group and has previously been
a Board member of QinetiQ plc and Rexam PLC. She is a member of advisory panels for Macquarie European Infrastructure Fund
and Macquarie Russia and CIS Infrastructure Fund and has served as the Chair of the Budapest Bank Supervisory Board. Ms.
Doyle serves as Newmont’s independent Vice Chair of the Board of Directors and the Chair of Newmont’s Audit Committee.
Newmont Mining Corporation I 2015 Investor Day I Slide 22December 2015

Newmont Mining Corporation I 2015 Investor Day I Slide 117December 2015
Board of Directors biographies
Bruce R. Brook
Bruce R. Brook served as Chief Financial Officer of WMC Resources Limited from 2002 to 2005, and has held key executive
roles including Deputy CFO of ANZ Banking Group Limited, Group Chief Accountant of Pacific Dunlop Limited, and General
Manager, Group Accounting positions at CRA Limited and Pasminco Limited. Mr. Brook formerly served as a Director and
Chairman of the Audit Committees of Lihir Gold Limited, Consolidated Minerals Limited and Energy Developments Limited.
He currently serves as a Director for Boart Longyear Limited, Programmed Group (as Chairman) and CSL Limited. In
addition, Mr. Brook retired in 2012 after six years of services as a member of the Financial Reporting Council in Australia and
in 2013 was appointed to the Director Advisory Panel of the Australian Securities Investments Commission.
J. Kofi Bucknor
J. Kofi Bucknor currently serves on the boards of ARM (Nigeria) and Saham Assurances Limited (formerly CNIA Assurances)
(Morocco). Mr. Bucknor is the former Chairman of Ghana’s Investment Advisory Committee, which advises on the
management of part of the country’s oil revenues. Mr. Bucknor formerly served as a Director of Chirano Gold Mines, Ashanti
Goldfields Corporation, National Investment Bank (Ghana) and Ecobank Transnational Corporation. He was a member of the
International Advisory Board of Normandy Mining Corporation (Australia). Mr. Bucknor is also a former Chairman of the
Ghana Stock Exchange.
Joseph A. Carrabba
Joseph A. Carrabba is the retired Chairman, President and Chief Executive Officer of Cliffs Natural Resources (formerly
Cleveland-Cliffs Inc.). Prior to joining Cleveland-Cliffs in 2005, Mr. Carrabba held various senior operating positions with Rio Tinto
PLC, including President and Chief Operating Officer of Diavik Diamond Mines. Mr. Carrabba is a Director of KeyCorp, Aecon,
TimkenSteel and NioCorp Developments Ltd. (a TSX:V listed company).
Newmont Mining Corporation I 2015 Investor Day I Slide 23December 2015

Newmont Mining Corporation I 2015 Investor Day I Slide 118December 2015
Board of Directors biographies
Julio Quintana
Mr. Quintana’s extensive operations and exploration experience includes several senior executive roles with multinational
drilling and exploration companies. He formerly served as President and Chief Executive Officer of Tesco Corporation,
which supplies oilfield drilling technology, services and equipment, and prior to that served as Tesco’s Chief Operating
Officer. Mr. Quintana’s other leadership positions include various executive roles for Schlumberger Technology
Corporation, including Vice President of Integrated Project Management, Vice President of Exploitation and Vice President
of Marketing. Mr. Quintana began his career at Unocal Corporation, a global petroleum exploration company, where he
spent nearly 20 years working in various engineering and leadership roles. He holds a Bachelor of Science degree in
mechanical engineering from the University of Southern California, Los Angeles. Mr. Quintana currently serves on the
Board of SM Energy and previously was a member of the Board of Tesco.
Jane Nelson
Jane Nelson is the founding Director of the Harvard Kennedy School’s Corporate Social Responsibility Initiative. Ms.
Nelson is also a nonresident senior fellow at the Brookings Institution and a Senior Associate of Cambridge University’s
Programme for Sustainability Leadership. She serves on ExxonMobil’s External Citizenship Advisory Panel and on the
Independent Advisory Panel, International Council on Mining and Metals Resource Endowment initiative. Ms. Nelson is a
former external adviser to World Bank Group on social impacts in mining, oil and gas sector. Ms. Nelson also worked for
the Business Council for Sustainable Development in Africa, for FUNDES in Latin America and as a Vice President at
Citibank working in Asia, Europe and the Middle East.
Veronica Hagen
Veronica Hagen is the former President and Chief Executive Officer of Polymer Group, Inc. Ms. Hagen was President and
CEO of Sappi Fine Paper North America from 2004 to 2007. Prior to working for Sappi, she served in various executive roles
with Alcoa and with Alumax before its acquisition by Alcoa. She currently serves on the Board of Directors for Southern
Company as Lead Director and is a former director of Jacuzzi Brands, Inc.
Newmont Mining Corporation I 2015 Investor Day I Slide 24December 2015

Appendix C: Outlook and Endnotes

Newmont Mining Corporation I 2015 Investor Day I Slide 120December 2015
aOutlook projections used in this presentation (“Outlook”)
are considered “forward-looking statements” and represent
management’s good faith estimates or expectations of
future production results as of the date hereof. Outlook is
based upon certain assumptions, including, but not limited
to, metal prices, oil prices, certain exchange rates and other
assumptions. For example, Outlook assumes $1,100/oz Au,
$2.50/lb Cu, $0.75 USD/AUD exchange rate and $65/barrel
WTI. AISC and CAS cost estimates do not include inflation.
Production, AISC and capital estimates exclude projects
that have not yet been approved (NW Exodus, Twin
Underground, Batu Phase 7, Ahafo Mill Expansion and
Subika Underground). The potential impact on inventory
valuation as a result of lower prices, input costs, and project
decisions are not included as part of this Outlook. Such
assumptions may prove to be incorrect and actual results
may differ materially from those anticipated. Consequently,
Outlook cannot be guaranteed. As such, investors are
cautioned not to place undue reliance upon Outlook and
forward-looking statements as there can be no assurance
that the plans, assumptions or expectations upon which
they are placed will occur. bNon-GAAP measure. All-in sustaining costs as used in the
Company’s Outlook is a non-GAAP metric defined as the
sum of cost applicable to sales (including all direct and
indirect costs related to current gold production incurred to
execute on the current mine plan), remediation costs
(including operating accretion and amortization of asset
retirement costs), G&A, exploration expense, advanced
projects and R&D, treatment and refining costs, other
expense, net of one-time adjustments and sustaining
capital.cIncludes Lone Tree operations.dIncludes TRJV operations. eConsolidated production for Yanacocha is presented on a
total production basis for the mine site; attributable
production represents a 51.35% interest.fBoth consolidated and attributable production are shown on
a pro-rata basis with a 50% ownership for Kalgoorlie.gProduction outlook does not include equity production from
stakes in TMAC (29.4%), La Zanja (46.94%) and Regis
(19.45%).hConsolidated production for Batu Hijau is presented on a
total production basis for the mine site; whereas attributable
production represents a 48.5% ownership interest in 2016
outlook. Outlook for Batu Hijau remains subject to various
factors, including, without limitation, renegotiation of the
CoW, issuance of future export approvals, negotiations with
the labor union, future in-country smelting availability and
regulations relating to export quotas, and certain other
factors.
2016 Outlooka
Consolidated Attributable Consolidated
Consolidated All-in Sustaining
Consolidated Total Capital
Production Production CAS Costsb Expenditures
(Koz, Kt) (Koz, Kt) ($/oz, $/lb) ($/oz, $/lb) ($M)
North America Carlin 1,040 – 1,100 1,040 – 1,100 $750 – $800 $925 – $975 $175 – $195 Phoenix
c 180 – 200 180 – 200 $825 – $875 $975 – $1,025 $20 – $30
Twin Creeksd 370 – 400 370 – 400 $575 – $625 $700 – $750 $30 – $40
CC&V 350 – 400 350 – 400 $525 – $575 $650 – $700 $120 – $130 Long Canyon $140 – $160 Other North America $5 – $15 Total 1,940 – 2,100 1,940 – 2,100 $675 – $725 $850 – $925 $490 – $570 South America Yanacocha
e 630 – 660 310 – 350 $820 – $870 $1,100 – $1,170 $70 – $90
Merian 120 – 140 90 – 100 $430 – $460 $650 – $700 $260 – $300 Total 750 – 800 400 – 450 $760 – $810 $1,050 – $1,150 $330 – $380 Asia Pacific Boddington 725 – 775 725 – 775 $690 – $730 $800 – $850 $60 – $70 Tanami 400 – 475 400 – 475 $550 – $600 $800 – $850 $150 – $160 Kalgoorlie
f 350 – 400 350 – 400 $650 – $700 $725 – $775 $10 – $20
Other Asia Pacific $5 – $15 Batu Hijau 525 – 575 250 – 275 $500 – $550 $650 – $700 $50 – $60 Total 2,000 – 2,225 1,725 – 1,925 $600 – $650 $760 – $820 $275 – $325 Africa Ahafo 330 – 360 330 – 360 $775 – $825 $1,020 – $1,100 $60 – $80 Akyem 430 – 460 430 – 460 $560 – $600 $700 – $750 $40 – $50 Total 760 – 820 760 – 820 $650 – $700 $850 – $900 $100 – $130
Corporate/Other $10 – $15 Total Gold
g 5,450 – 5,945 4,825 – 5,295 $650 – $700 $900 – $960 $1,205 – $1,420
Phoenix 15 – 25 15 – 25 $1.70 – $1.90 $2.10 – $2.30 Boddington 25 – 35 25 – 35 $1.90 – $2.10 $2.30 – $2.50 Batu Hijau
h 170 – 190 80 – 100 $1.00 – $1.20 $1.40 – $1.60
Total Copper 210 – 250 120 – 160 $1.20 – $1.40 $1.50 – $1.70
Newmont Mining Corporation I 2015 Investor Day I Slide 1December 2015 Newmont Mining Corporation I 2015 Investor Day I Slide 26December 2015

Newmont Mining Corporation I 2015 Investor Day I Slide 121December 2015
Three Months Ended Nine Months Ended
September 30, September 30,
2015 2014 2015 2014
Net income (loss) attributable to Newmont stockholders $ 219 $ 213 $ 474 $ 493
Net income (loss) attributable to noncontrolling interests 66 (138) 188 (225)
Loss (income) from discontinued operations (17) (3) (34) 16
Equity loss (income) of affiliates 18 — 34 (2)
Income and mining tax expense (benefit) 151 (47) 496 (22)
Depreciation and amortization 331 318 896 922
Interest expense, net 81 89 248 276
EBITDA $ 849 $ 432 $ 2,302 $ 1,458
Adjustments:
Impairments and loss provisions $ 32 $ 8 $ 108 $ 22
Restructuring and other 12 19 26 32
Acquisitions costs 7 — 15 —
Gain on deconsolidation of TMAC (76) — (76) —
Loss (gain) on asset and investment sales (66) (41) (109) (93)
Abnormal production costs at Batu Hijau — 37 — 53
Adjusted EBITDA $ 758 $ 455 $ 2,266 $ 1,472
EBITDA and Adjusted EBITDA
Management uses Earnings before interest, taxes and depreciation and amortization (EBITDA) and EBITDA adjusted for
non-core or certain items that have a disproportionate impact on our results for a particular period (Adjusted EBITDA) as
non-GAAP measures to evaluate the Company’s operating performance. EBITDA and Adjusted EBITDA do not represent,
and should not be considered an alternative to, net earnings (loss), operating earnings (loss), or cash flow from operations
as those terms are defined by GAAP, and does not necessarily indicate whether cash flows will be sufficient to fund cash
needs. Although Adjusted EBITDA and similar measures are frequently used as measures of operations and the ability to
meet debt service requirements by other companies, our calculation of Adjusted EBITDA is not necessarily comparable to
such other similarly titled captions of other companies. The Company believes that Adjusted EBITDA provides useful
information to investors and others in understanding and evaluating our operating results in the same manner as our
management and board of directors. Management’s determination of the components of Adjusted EBITDA are evaluated
periodically and based, in part, on a review of non-GAAP financial measures used by mining industry analysts. Net income
(loss) attributable to Newmont stockholders is reconciled to EBITDA and Adjusted EBITDA as follows:
Newmont Mining Corporation I 2015 Investor Day I Slide 27December 2015

Newmont Mining Corporation I 2015 Investor Day I Slide 122December 2015
Free Cash Flow
Free Cash Flow is cash generated from Net cash provided from continuing operations less Additions to property, plant and
mine development as presented on the Statement of Cash Flows. To supplement our statements of cash flows presented
on a GAAP basis, we use non-GAAP measures of cash flows to analyze cash flows generated from our operations. We
believe Free Cash Flow is also useful as one of the bases for comparing our performance with our competitors. The
presentation of non-GAAP Free Cash Flow is not meant to be considered in isolation or as an alternative to net income as
an indicator of our performance, or as an alternative to cash flows from operating activities as a measure of liquidity. Net
cash provided from continuing operations is reconciled to Free Cash Flow as follows:
Three Months Ended Nine Months Ended
September 30, September 30,
2015 2014 2015 2014
Net cash provided by continuing operations $ 813 $ 328 $ 1,882 $ 889
Less: Additions to property, plant and mine development (335) (277) (941) (766)
Free Cash Flow $ 478 $ 51 $ 941 $ 123
Newmont Mining Corporation I 2015 Investor Day I Slide 28December 2015
Newmont Mining Corporation I 2015 Investor Day I Slide 123December 2015
Newmont has worked to develop a metric that expands on GAAP measures such as cost of goods sold and non-GAAP measures, such as costs applicable to sales per ounce, to provide visibility into the
economics of our mining operations related to expenditures, operating performance and the ability to generate cash flow from operations.
Current GAAP-measures used in the mining industry, such as cost of goods sold, do not capture all of the expenditures incurred to discover, develop, and sustain gold production. Therefore, we believe that all-in
sustaining costs is a non-GAAP measure that provides additional information to management, investors, and analysts that aid in the understanding of the economics of our operations and performance compared
to other producers and in the investor’s visibility by better defining the total costs associated with production.
All-in sustaining cost (AISC) amounts are intended to provide additional information only and do not have any standardized meaning prescribed by GAAP and should not be considered in isolation or as a
substitute for measures of performance prepared in accordance with GAAP. The measures are not necessarily indicative of operating profit or cash flow from operations as determined under GAAP. Other
companies may calculate these measures differently as a result of differences in the underlying accounting principles, policies applied and in accounting frameworks such as in International Financial Reporting
Standards (IFRS), or by reflecting the benefit from selling non-gold metals as a reduction to AISC. Differences may also arise related to definitional differences of sustaining versus development capital activities
based upon each company’s internal policies.
The following disclosure provides information regarding the adjustments made in determining the all-in sustaining costs measure:
Cost Applicable to Sales - Includes all direct and indirect costs related to current gold production incurred to execute the current mine plan. Costs Applicable to Sales (CAS) includes by-product credits from
certain metals obtained during the process of extracting and processing the primary ore-body. CAS is accounted for on an accrual basis and excludes Amortization and Reclamation and remediation, which is
consistent with our presentation of CAS on the Statement of Consolidated Income. In determining AISC, only the CAS associated with producing and selling an ounce of gold is included in the measure.
Therefore, the amount of gold CAS included in AISC is derived from the CAS presented in the Company’s Statement of Consolidated Income less the amount of CAS attributable to the production of copper at our
Phoenix, Boddington and Batu Hijau mines. The copper CAS at those mine sites is disclosed in Note 3 – Segments that accompanies the Consolidated Financial Statements. The allocation of CAS between gold
and copper at the Phoenix, Boddington and Batu Hijau mines is based upon the relative sales percentage of copper and gold sold during the period.
Remediation Costs - Includes accretion expense related to asset retirement obligations (ARO) and the amortization of the related Asset Retirement Cost (ARC) for the Company’s operating properties recorded as
an ARC asset. Accretion related to ARO and the amortization of the ARC assets for reclamation and remediation do not reflect annual cash outflows but are calculated in accordance with GAAP. The accretion
and amortization reflect the periodic costs of reclamation and remediation associated with current gold production and are therefore included in the measure. The allocation of these costs to gold and copper is
determined using the same allocation used in the allocation of CAS between gold and copper at the Phoenix, Boddington and Batu Hijau mines.
Advanced Projects and Exploration - Includes incurred expenses related to projects that are designed to increase or enhance current gold production and gold exploration. We note that as current resources are
depleted, exploration and advance projects are necessary for us to replace the depleting reserves or enhance the recovery and processing of the current reserves. As this relates to sustaining our gold production,
and is considered a continuing cost of a mining company, these costs are included in the AISC measure. These costs are derived from the Advanced projects, research and development and Exploration amounts
presented in the Company’s Statement of Consolidated Income less the amount attributable to the production of copper at our Phoenix, Boddington and Batu Hijau mines. The allocation of these costs to gold and
copper is determined using the same allocation used in the allocation of CAS between gold and copper at the Batu Hijau, Boddington and Phoenix mines.
General and Administrative - Includes cost related to administrative tasks not directly related to current gold production, but rather related to support our corporate structure and fulfilling our obligations to operate
as a public company. Including these expenses in the AISC metric provides visibility of the impact that general and administrative activities have on current operations and profitability on a per ounce basis.
Other Expense, net - Includes costs related to regional administration and community development to support current gold production. We exclude certain exceptional or unusual expenses from Other expense,
net, such as restructuring, as these are not indicative to sustaining our current gold operations. Furthermore, this adjustment to Other expense, net is also consistent with the nature of the adjustments made to
Net income (loss) as disclosed in the Company’s non-GAAP financial measure Adjusted net income (loss). The allocation of these costs to gold and copper is determined using the same allocation used in the
allocation of CAS between gold and copper at the Phoenix, Boddington and Batu Hijau mines.
Treatment and Refining Costs - Includes costs paid to smelters for treatment and refining of our concentrates to produce the salable metal. These costs are presented net as a reduction of Sales.
Sustaining Capital - We determined sustaining capital as those capital expenditures that are necessary to maintain current gold production and execute the current mine plan. Capital expenditures to develop new
operations, or related to projects at existing operations where these projects will enhance gold production or reserves, are considered development. We determined the breakout of sustaining and development
capital costs based on a systematic review of our project portfolio in light of the nature of each project. Sustaining capital costs are relevant to the AISC metric as these are needed to maintain the Company’s
current gold operations and provide improved transparency related to our ability to finance these expenditures from current operations. The allocation of these costs to gold and copper is determined using the
same allocation used in the allocation of CAS between gold and copper at the Batu Hijau, Boddington and Phoenix mines.
All-in sustaining costs
Newmont Mining Corporation I 2015 Investor Day I Slide 29December 2015

Newmont Mining Corporation I 2015 Investor Day I Slide 124December 2015
All-in sustaining costs
Year Ended December 31, 2014
Costs Applicable to Sales
(1)
(2)(3)
Remediation Costs
(4)
Advanced Projects
and Exploration
General and Administrative
Other Expense,
Net (5)
Treatment and
Refining Costs
Sustaining Capital
(6)
All-In Sustaining
Costs
Ounces (000)/
Pounds (millions)
Sold
All-In Sustaining Costs per
oz/lb
GOLD Carlin $ 795 $ 4 $ 22 $ - $ 8 $ - $ 141 $ 970 905 $ 1,072
Phoenix 160 3 4 - 3 9 17 196 222 883
Twin Creeks 207 2 5 - 3 - 111 328 400 820
La Herradura 89 2 12 - - - 21 124 119 1,042
Other North America - - 25 - 6 - 9 40 - -
North America 1,251 11 68 - 20 9 299 1,658 1,646 1,007
Yanacocha 663 101 32 - 35 - 80 911 966 943
Other South America - - 41 - 2 - - 43 - -
South America 663 101 73 - 37 - 80 954 966 988
Boddington 585 11 - - 2 4 69 671 690 972
Tanami 251 4 10 - 2 - 91 358 345 1,038
Jundee 85 5 1 - 2 - 15 108 140 771
Waihi 76 3 7 - 2 - 2 90 131 687
Kalgoorlie 284 4 5 - 1 4 32 330 327 1,009
Other Australia/New Zealand - - 5 3 21 - 6 35 - -
Australia/New Zealand 1,281 27 28 3 30 8 215 1,592 1,633 975
Batu Hijau 81 3 - - 4 9 8 105 72 1,458
Other Indonesia - - - - - - - - - -
Indonesia 81 3 - - 4 9 8 105 72 1,458
Ahafo 249 8 27 - 6 - 92 382 450 849
Akyem 172 3 - - 8 - 17 200 473 423
Other Africa - - 8 - 7 - - 15 - -
Africa 421 11 35 - 21 - 109 597 923 647
Corporate and Other - - 116 182 31 - 17 346 - -
Total Gold $ 3,697 $ 153 $ 320 $ 185 $ 143 $ 26 $ 728 $ 5,252 5,240 $ 1,002
COPPER
Phoenix $ 108 $ 1 $ 2 $ - $ 1 $ 5 $ 13 $ 130 46 $ 2.83
Boddington 158 2 - - 1 25 18 204 66 3.09
Batu Hijau 494 15 3 1 20 45 51 629 152 4.14
Total Copper $ 760 $ 18 $ 5 $ 1 $ 22 $ 75 $ 82 $ 963 264 $ 3.65
Consolidated $ 4,457 $ 171 $ 325 $ 186 $ 165 $ 101 $ 810 $ 6,215
(1) Excludes Depreciation and
amortization and Reclamation and
remediation. (2) Includes by-product credits of $85. (3) Includes stockpile and leach pad
inventory adjustment of $127 at Carlin,
$13 at Phoenix, $15 at Twin Creeks, $75
at Yanacocha, $69 at Boddington, and
$191 at Batu Hijau.(4) Remediation costs include operating
accretion of $71 and amortization of
asset retirement costs of $100. (5) Other expense, net is adjusted for
restructuring costs of $40. (6) Excludes $300 of development capital
expenditures, capitalized interest, and the
increase in accrued capital. The following
are major development projects; Turf
Vent Shaft, Merian, Correnso and Conga
for 2014.
Newmont Mining Corporation I 2015 Investor Day I Slide 30December 2015

Newmont Mining Corporation I 2015 Investor Day I Slide 125December 2015
All-in sustaining costs
Year Ended December 31, 2013
Costs Applicable to Sales
(1)
(2)(3)
Remediation Costs
(4)
Advanced Projects
and Exploration
General and Administrative
Other Expense,
Net (5)
Treatment and
Refining Costs
Sustaining Capital
(6)
All-In Sustaining
Costs
Ounces (000)/
Pounds (millions)
Sold
All-In Sustaining Costs per
oz/lb
GOLD
Carlin $ 767 $ 5 $ 34 $ - $ 7 $ 14 $ 154 $ 981 1,013 $ 968
Phoenix 164 3 7 - 2 9 20 205 225 911
Twin Creeks 273 6 7 - 4 - 56 346 518 668
La Herradura 177 - 42 - - - 74 293 183 1,601
Other North America - - 42 - 4 - 23 69 - -
North America 1,381 14 132 - 17 23 327 1,894 1,939 977
Yanacocha 684 90 41 - 63 - 148 1,026 1,022 1,004
Other South America - - 34 - 4 - - 38 - -
South America 684 90 75 - 67 - 148 1,064 1,022 1,041
Boddington 805 6 1 - 2 4 90 908 743 1,222
Tanami 270 3 11 - 3 - 91 378 325 1,163
Jundee 206 13 7 - 1 - 45 272 279 975
Waihi 103 3 5 - 2 - 7 120 111 1,081
Kalgoorlie 342 7 3 - 1 - 19 372 329 1,131
Other Australia/New Zealand - - 13 - 34 - 4 51 - -
Australia/New Zealand 1,726 32 40 - 43 4 256 2,101 1,787 1,176
Batu Hijau 107 2 2 - 3 5 12 131 46 2,848
Other Indonesia - - - - (2 ) - - (2 ) - -
Indonesia 107 2 2 - 1 5 12 129 46 2,804
Ahafo 307 3 51 - 14 - 109 484 566 855
Akyem 32 - 8 - 3 - - 43 129 333
Other Africa - - 8 - 10 - - 18 - -
Africa 339 3 67 - 27 - 109 545 695 784
Corporate and Other - - 137 203 25 - 12 377 - -
Total Gold $ 4,237 $ 141 $ 453 $ 203 $ 180 $ 32 $ 864 $ 6,110 5,489 $ 1,113
COPPER
Phoenix $ 52 $ 1 $ 3 $ - $ 1 $ 5 $ 7 $ 69 29 $ 2.38
Boddington 195 1 - - 1 19 22 238 71 3.35
Batu Hijau 815 9 13 - 24 47 93 1,001 158 6.34
Total Copper $ 1,062 $ 11 $ 16 $ - $ 26 $ 71 $ 122 $ 1,308 258 $ 5.07
Consolidated $ 5,299 $ 152 $ 469 $ 203 $ 206 $ 103 $ 986 $ 7,418
(1) Excludes Depreciation and
amortization and Reclamation and
remediation.(2) Includes by-product credits of $111. (3) Includes stockpile and leach pad
inventory adjustments of $69 at Carlin, $1
at Twin Creeks, $24 at La Herradura,
$107 at Yanacocha, $184 at Boddington,
$1 at Tanami, $4 at Waihi, $45 at
Kalgoorlie, and $523 at Batu Hijau.(4) Remediation costs include operating
accretion of $61 and amortization of
asset retirement costs of $91. (5) Other expense, net is adjusted for
restructuring of $67 and TMAC
transaction costs of $45, offset by $18 for
Boddington Contingent Consideration. (6) Excludes $914 of development capital
expenditures, capitalized interest, and the
increase in accrued capital. The following
are major development projects; Phoenix
Copper Leach, Turf Vent Shaft,
Yanacocha Bio Leach, Conga, Merian,
Ahafo Mill Expansion, and Akyem for
2013.
Newmont Mining Corporation I 2015 Investor Day I Slide 31December 2015

Newmont Mining Corporation I 2015 Investor Day I Slide 126December 2015
All-in sustaining costs
(1) Excludes Depreciation and
amortization and Reclamation and
remediation.(2) Includes by-product credits of $146.(3) Includes stockpile and leach pad
inventory adjustments of $6 at
Yanacocha, $5 at Tanami, and $17 at
Waihi.(4) Remediation costs include operating
accretion of $55 and amortization of
asset retirement costs of $40. (5) Other expense, net is adjusted for
restructuring of $58, Hope Bay care and
maintenance of $144, and Boddington
Contingent Consideration of $12. (6) Excludes $1,521 of development
capital expenditures, capitalized interest,
and the increase in accrued capital. The
following are major development projects;
Emigrant, Phoenix Copper Leach, Turf
Vent Shaft, Yanacocha Bio Leach,
Conga, Tanami Shaft, Ahafo Mill
Expansion, and Akyem for 2012.
Year Ended December 31, 2012
Costs Applicable to Sales
(1)
(2)(3)
Remediation
Costs (4)
Advanced Projects
and
Exploration
General and
Administrative
Other Expense,
Net (5)
Treatment and
Refining
Costs
Sustaining
Capital (6)
All-In Sustaining
Costs
Ounces (000)/
Pounds (millions)
Sold
All-In Sustaining Costs per
oz/lb
GOLD
Carlin $ 767 $ 4 $ 47 $ - $ 6 $ 14 $ 229 $ 1,067 978 $ 1,091
Phoenix 111 3 14 - 1 8 57 194 188 1,032
Twin Creeks 256 3 30 - - - 117 406 553 734
La Herradura 132 - 41 - - - 71 244 212 1,151
Other North America - - 40 - 11 - 66 117 - -
North America 1,266 10 172 - 18 22 540 2,028 1,931 1,050
Yanacocha 669 34 59 - 70 - 479 1,311 1,325 989
Other South America - - 72 - 4 - 10 86 - -
South America 669 34 131 - 74 - 489 1,397 1,325 1,054
Boddington 623 6 6 - 3 7 112 757 711 1,065
Tanami 250 2 28 - 3 - 130 413 180 2,294
Jundee 172 10 20 - 1 - 58 261 322 811
Waihi 97 4 12 - 3 - 4 120 62 1,935
Kalgoorlie 277 8 5 - 1 - 20 311 341 912
Other Australia/New Zealand - - 19 - 39 - 19 77 - -
Australia/New Zealand 1,419 30 90 - 50 7 343 1,939 1,616 1,200
Batu Hijau 71 2 5 - 8 7 23 116 67 1,731
Other Indonesia - - - - (3 ) - - (3 ) - -
Indonesia 71 2 5 - 5 7 23 113 67 1,687
Ahafo 314 4 53 - 24 - 85 480 527 911
Akyem - - 19 - 1 - - 20 - -
Other Africa - - 10 - 1 - - 11 - -
Africa 314 4 82 - 26 - 85 511 527 970
Corporate and Other - - 188 212 18 - 25 443 - -
Total Gold $ 3,739 $ 80 $ 668 $ 212 $ 191 $ 36 $ 1,505 $ 6,431 5,466 $ 1,177
COPPER
Phoenix $ 60 $ 2 $ 7 $ - $ 1 $ 5 $ 31 $ 106 28 $ 3.79
Boddington 150 1 2 - 1 17 27 198 66 3.00
Batu Hijau 385 12 27 - 42 45 126 637 163 3.91
Total Copper $ 595 $ 15 $ 36 $ - $ 44 $ 67 $ 184 $ 941 257 $ 3.66
Consolidated $ 4,334 $ 95 $ 704 $ 212 $ 235 $ 103 $ 1,689 $ 7,372
Newmont Mining Corporation I 2015 Investor Day I Slide 32December 2015

Newmont Mining Corporation I 2015 Investor Day I Slide 127December 2015
Investors are encouraged to read the information contained in this presentation in conjunction with the following notes, the Cautionary Statement on slide 2 and the factors described under the “Risk
Factors” section of the Company’s Form 10-Q, filed with the SEC on July 23, 2015, and disclosure in the Company’s recent SEC filings.
1. EBITDA is a non-GAAP financial measure calculated as Earnings before interest, taxes and depreciation and amortization. The EBITDA figures used in this presentation were calculated by
Capital IQ. For management’s EBITDA calculations and reconciliation to the nearest GAAP metric, please see slide 27 in the Appendix for more information.
2. Historical AISC or All-in sustaining cost is a non-GAAP metric. See slides 29 to 32 in the Appendix for more information and a reconciliation to the nearest GAAP metric. All-in sustaining cost
(“AISC”) as used in the Company’s Outlook is a non-GAAP metric defined as the sum of cost applicable to sales (including all direct and indirect costs related to current gold production incurred
to execute on the current mine plan), remediation costs (including operating accretion and amortization of asset retirement costs), G&A, exploration expense, advanced projects and R&D,
treatment and refining costs, other expense, net of one-time adjustments and sustaining capital. See also note 3 below.
3. Outlook projections used in this presentation (“Outlook”) are considered “forward-looking statements” and represent management’s good faith estimates or expectations of future production
results as of the date hereof. Outlook is based upon certain assumptions, including, but not limited to, metal prices, oil prices, certain exchange rates and other assumptions. For example,
Outlook assumes $1,100/oz Au, $2.50/lb Cu, $0.75 USD/AUD exchange rate and $65/barrel WTI. AISC and CAS cost estimates do not include inflation. Production, AISC and capital estimates
exclude projects that have not yet been approved (NW Exodus, Twin Underground, Batu Phase 7, Ahafo Mill Expansion and Subika Underground). The potential impact on inventory valuation
as a result of lower prices, input costs, and project decisions are not included as part of this Outlook. Long term ranges (2018 – 2020) for production, AISC and capital provided in this
presentation represent 3-year averages. Scheduled debt prepayments exclude capital leases. Such assumptions may prove to be incorrect and actual results may differ materially from those
anticipated. Consequently, Outlook cannot be guaranteed. As such, investors are cautioned not to place undue reliance upon Outlook and forward-looking statements as there can be no
assurance that the plans, assumptions or expectations upon which they are placed will occur.
4. Free cash flow is a non-GAAP financial measure. The free cash flow figures used on slide 18 of the Business Outlook section of this presentation were calculated by Capital IQ. For
management’s free cash flow calculations and reconciliation to the nearest GAAP metric, please see slide 28 in the Appendix for more information.
5. Estimated debt payment opportunities over the period, which remain subject to change depending on certain variables and the needs of the business. See also endnote 3.
6. Weighted average cost of capital (WACC) is the average rate the Company expects to pay to its equity and debt security holders, and is calculated using long term expected returns, interest
rates and stock betas. The cost of capital includes country specific risk premiums based on an internal proprietary model.
7. Full potential savings used in this presentation, unless otherwise noted, represent cumulative incremental value realized as a result of Full Potential projects implemented from 2012 through Q3
2015. Figures compare actual baseline to actual normalized cash flows.
8. U.S. investors are reminded that reserves were prepared in compliance with Industry Guide 7 published by the U.S. SEC. Whereas, the term resource, measured resource, indicated resources
and inferred resources are not SEC recognized terms. Newmont has determined that such resources would be substantively the same as those prepared using the Guidelines established by
the Society of Mining, Metallurgy and Exploration and defined as Mineral Resource. Estimates of resources are subject to further exploration and development, are subject to additional risks,
and no assurance can be given that they will eventually convert to future reserves. Inferred resources, in particular, have a great amount of uncertainty as to their existence and their economic
and legal feasibility. Investors are cautioned not to assume that any part or all of the inferred resource exists, or is economically or legally mineable. Estimates of resources are subject to further
exploration and development, are subject to additional risks, and no assurance can be given that they will eventually convert to future reserves. Inventory and potential upside referenced in
certain graphics used herein have a greater amount of uncertainty. Investors are reminded that even if significant mineralization is discovered and converted to reserves, during the time
necessary to ultimately move such mineralization to production the economic and legal feasibility of production may change. Investors are reminded that drill hole results are not necessarily
indicative of future drilling results, reserve declaration or production. As such, investors are cautioned against relying upon those estimates. For more information regarding the Company’s
reserves, see the Company’s Annual Report filed with the SEC on February 19, 2015 for the Proven and Probable Reserve tables prepared in compliance with the SEC’s Industry Guide 7,
which is available at www.sec.gov or on the Company’s website at http://www.newmont.com/investor-relations/financial-reports/annual-reports/default.aspx. Investors are further reminded that
the tables presented in the Annual Report and the reserve and resource estimates used in this presentation are estimates as of December 31, 2014 and are presented on an attributable basis
reflecting the Company’s ownership interest at such time.
9. Key statistics included on slides 2-14 in the Appendix represent attributable gold production, consolidated unit CAS and AISC, and consolidated total capital expenditures.
Endnotes
Newmont Mining Corporation I 2015 Investor Day I Slide 33December 2015