investor day 2018 - s1.q4cdn.coms1.q4cdn.com/793210788/files/doc_news/2018/8/sqm-vertical_15.pdf ·...
TRANSCRIPT

www.sqm.com2018 1
I N V E S T O RD AY2 0 1 8
N Y S E
S e p t e m b e r 5

www.sqm.com2018 2
CUSTOMARY NOTE
REGARDING FORWARD-LOOKING
STATEMENTS
Statements in this presentation concerning the
Company’s business outlook, future economic
performance, anticipated profitability, revenues,
expenses, or other financial items, anticipated cost
synergies and product or service line growth,
together with other statements that are not
historical facts, are “forward-looking statements” as
that term is defined under the U.S. Private
Securities Litigation Reform Act of 1995.
Any forward-looking statements are estimates,
reflecting the best judgment of SQM management
based on currently available information and
involve a number of risks, uncertainties and other
factors that are outside SQM´s control could cause
actual results to differ materially from those stated
in such statements.
Risks, uncertainties, and factors that could affect
the accuracy of such forward-looking statements
are identified in SQM´s public filing made with the
U.S. Securities and Exchange Commission,
specifically SQM´s most recent annual report on
Form 20-F. All forward-looking statements are
based on information available to SQM on the date
hereof and SQM assumes no obligation to update
such statements whether as a result of new
information, future developments or otherwise,
except as required by law.

www.sqm.com2018 3
Patricio de SolminihacCEO
INVESTOR
DAY
PROGRAM
01.
Ricardo Ramos CFO02.
Gerardo Illanes VP Finance & IR03.
Q&A04.
Presentation is available on our website www.sqm.com

www.sqm.com2018 4
PATRICIO DE SOLMINIHAC
CEO

www.sqm.com2018 5
Commercial exploitation of the caliche ore deposits in northern Chile began
1830
Maria Elena begins operations using the
Guggenheim Method
1926
OUR
HISTORY
SQM is incorporated
1968
Listing of ADR Program on New
York Stock Exchange
SQM begins developing the Salar de Atacama
1993
1997
2005
Lean methodology adoption begins company-wide
2014
Joint venture with Kidman resources to develop the Mt. Holland Lithium Project in Australia
2017
New agreement with CORFO; announcement of lithium capacity expansion in Chile from 48k MT/year to
180k MT/year over next few years
2018
Celebrating 25 years
listed on the NYSE
Celebrating its 50th
anniversary
Lithium hydroxide
production begins
1951
SQM constructs crystalized nitrates plant in Coya Sur
Lithium carbonate production begins
1996
SQM begins iodine production
in Nueva Victoria
Production of potassium nitrate begins
1986

www.sqm.com2018 6
CORPORATE STRATEGY
Be a global company with people committed to excellence, dedicated to
the extraction of minerals and selectively integrated in the production and
sale of products for the industries essential for human development
Ensure availability of key
resources required to
support current goals for medium
and long-term business growth
Consolidate a culture of lean operations
(M1 excellence) throughout the
organization, including operations,
sales and supportareas
Significantlyincrease nitrate sales for all its
applications, and ensure
consistency withthe iodine sales
strategy
Successfullydevelop and
implement alllithium expansionprojects, acquire
more assets tocomplement ourcurrent portfolio
Strengthen the organizational structure to support the development of the strategic
plan, focusing on the development of critical capabilities and the application of the
corporate values of excellence, integrity and safety
Develop and actively manage a robust risk control and mitigation process,
while fousing on sustainable operations and the environment
Improve our stakeholder management to establish links with the community, and
communicate to Chile and the world our contribution to industries essential for human
development
Maximize the margins of each
business line through
appropriate pricing strategy

www.sqm.com2018 7
• Water soluble fertilizer market growing at ~10% per
year
• SQM volume growth outpacing the market in 2018,
over 10%, 2019 will see continued increase
• Expanding nitrates production from 1 to 1.5 million
MT/year. Currently at 1.3 million MT/year
• Two new NPK plants: Italy and Mexico
SPECIALTY PLANT
NUTRITION
Potassium Nitrate
(KNO3)• Currently 16
WSNPK plants; further market development
• New production plants
• Continued cost improvement for all products
• Add value to KNO3
As a result of Lean M1 Operations, in May 2018
the port of Tocopilla shipped 250,000 MT, setting a new shipping record
In 2017, SQM and the Ayllu Wine Program worked
with farmers and the Indigenous Association to
produce over 7,500 bottles of wine in the
Salar de Atacama
2017 Recap
SUSTAINABILITY & INNOVATION
LTM CONTRIBUTION TO:
20%34%
G R O S S P R O F I T R E V E N U E S

www.sqm.com2018 8
POTASSIUM
CHLORIDE
Approximately 15% of our employees are
women, more than double the average in the Chilean mining industry
SUSTAINABILITY & INNOVATION
95.8% of the energy required for our
operations is solar
• Low-cost raw material for our growing potassium
nitrate business
• Market growing, expected to reach ~63-64 million
MT
• 2018 sales volumes estimated to be less than 1
million MT, lower in 2019 as result of increased
lithium and potassium nitrate production
• Approximately 1/3 of SQM sales to Brazil in 2018
MOP• Kore Potash project
• Continued cost improvements for all products
2017 Recap MOP(KCL)
LTM CONTRIBUTION TO:
7%14%
G R O S S P R O F I T R E V E N U E S

www.sqm.com2018 9
IODINE &
DERIVATIVES
Best safety record over the last 12 months
New uses for iodine help keep demand growing consistently
SUSTAINABILITY & INNOVATION
• Market demand will grow close to 3% in 2018
• Sales volumes up, expected to surpass 13k MT
in 2018
• Expansion project from 11-14k MT/year was
completed
• More SQM iodine projects in pipeline;
preparing to meet future market demand
IODINE• More than 35%
market share; >12k MT sales volumes in 2017
• New capacity expansion
• Look for new projects in iodine derivatives
2017 Recap MOPIodine
(I2)
LTM CONTRIBUTION TO:
10% 12%
G R O S S P R O F I T R E V E N U E S

www.sqm.com2018 10
INDUSTRIAL
CHEMICALS
Over 61,000 hours of training completed in 2018.
Important geographical growth related to the use of solar salts: Spain, USA, South Africa,
Morocco, Israel, Chile, UAE, Saudi Arabia and others.
SUSTAINABILITY & INNOVATION
• Market growth coming from solar salts for CSP
(concentrated solar power) projects
• Goal for 2020 volumes to reach 200,000 MT
• 2017 sales volumes expected 100,000MT
2017 RecapMOP
Solar Salts
(KNO3, NaNO3)
LTM CONTRIBUTION TO:
6% 6%
G R O S S P R O F I T R E V E N U E S

www.sqm.com2018 11
• Market growth in 2018 expected to surpass 20%
• Sales volumes in 2018 will surpass 50k MT
• First stage of lithium carbonate expansion in Chile
completed on time and on budget (~US$75 million)
• 70k to 120k MT in 2019 (US$200
million)
• 120k to 180k MT in 2021 (US$250
million)
• Lithium hydroxide expansion in Chile from 6k to
13.5k to be completed this year.
LITHIUM &
DERIVATIVES
Will be able to almost quadruple lithium
production without extracting more brine from
the Salar de Atacama
Continued development of large-scalelithium projects in Chile and abroad
SUSTAINABILITY & INNOVATION
• Exar project
• JV with Kidman Resources (Mt. Holland, Australia)
• Look for new lithium projects outside Chile
• Leadership position in the market
2017 RecapMOP
Li2CO3
LiOHLTM CONTRIBUTION TO:
58%
30%
G R O S S P R O F I T R E V E N U E S

www.sqm.com2018 12
• Agreement reached with CORFO to maintain the lease through 2030
• Total production quota: 2.2 million MT of LCE
• New rent scheme became effective April 10, 2018
• Major investments and expansions in Chile
CORFO & CONTRACT
NEGOTIATIONS
IN THE FUTURE
0%
5%
10%
15%
20%
25%
30%
35%
40%
45%
2 3 4 5 6 7 8 9 10 11 12 13 14 15 16 17 18 19 20
Fee,
% o
f p
rice
Li2CO3 Price, US$/kg
CORFO RENTAL FEE (LITHIUM CARBONATE)
Rental Fee, contract % of price Rental Fee, weighted average %

www.sqm.com2018 13
• Annual contribution of US$11-19 million for R&D efforts
• Annual contribution of US$10-15 million for neighboring communities ofthe Salar de Atacama
• Annual contribution of 1.7% of SQM Salar’s sales per year for regionaldevelopment
CONTRIBUTIONS TO THE
DEVELOPMENT AND
COMMUNITIES

www.sqm.com2018 14
• Mt. Holland, 50/50 JV with Kidman Resources
• Estimated to contain 189 million tons of 1.50% Li2O or 7.03 million tons of LCE(according to JORC Code* standards)
• One of the world’s most significant hard rock lithium deposits. Expected to be atthe low end of the global hard rock cost curve
• Exclusive option to lease a premier site in Kwinana, Western Australia to build arefinery and produce battery-grade refined lithium
• Production focus on lithium hydroxide
• Capacity: 45k MT of LiOH/year
• Estimated commission date: 2020 - spodumene concentrate, 2021 - LiOH
• Current status: advancing on feasibility studies for mine, concentrator andrefinery
LITHIUM EXPANSION
IN AUSTRALIA
*The Australasian Code for Reporting of Exploration Results, Mineral Resources and Ore Reserves (‘the JORC Code’)

www.sqm.com2018 15
On track to capture opportunities in SPN, lithium, iodine and industrial chemicals business lines
CONCLUSION
01.
02.
03.
Lithium is, and will continue to be, our main business line
We will continue to make decisions to maximize SQM value in the long-term

www.sqm.com2018 16
RICARDO RAMOSCFO

www.sqm.com2018 17
GROSS
PROFIT
EVOLUTION
-
200
400
600
800
1,000
1,200
2007 2008 2009 2010 2011 2012 2013 2014 2015 2016 2017
Fertilizers (SPN+KCL) Iodine Lithium Industrial Chemicals
2010-2014: Iodine boomMarket growth 2-4%
2016- : Lithium boomMarket growth 15-20%
2007-2013: Fertilizer boomMarket growth 1-2%

www.sqm.com2018 18
Demand growth has been led by energy storage related to electronic devices
and power tools. Further growth will be related to electric vehicles.
Source: SQM Estimates
A CLOSER LOOK
AT THE
LITHIUM MARKET
LITHIUM CHEMICALS DEMAND COMPARISON
0
50
100
150
200
250
2010 2011 2012 2013 2014 2015 2016 2017
KM
T-L
CE
Lithium Demand Evolution 2010-2017
Other applications Energy Storage (kMT-LCE)
2010 Total Demand: 98k 2017 Total Demand: 212k
www.sqm.com2018 19
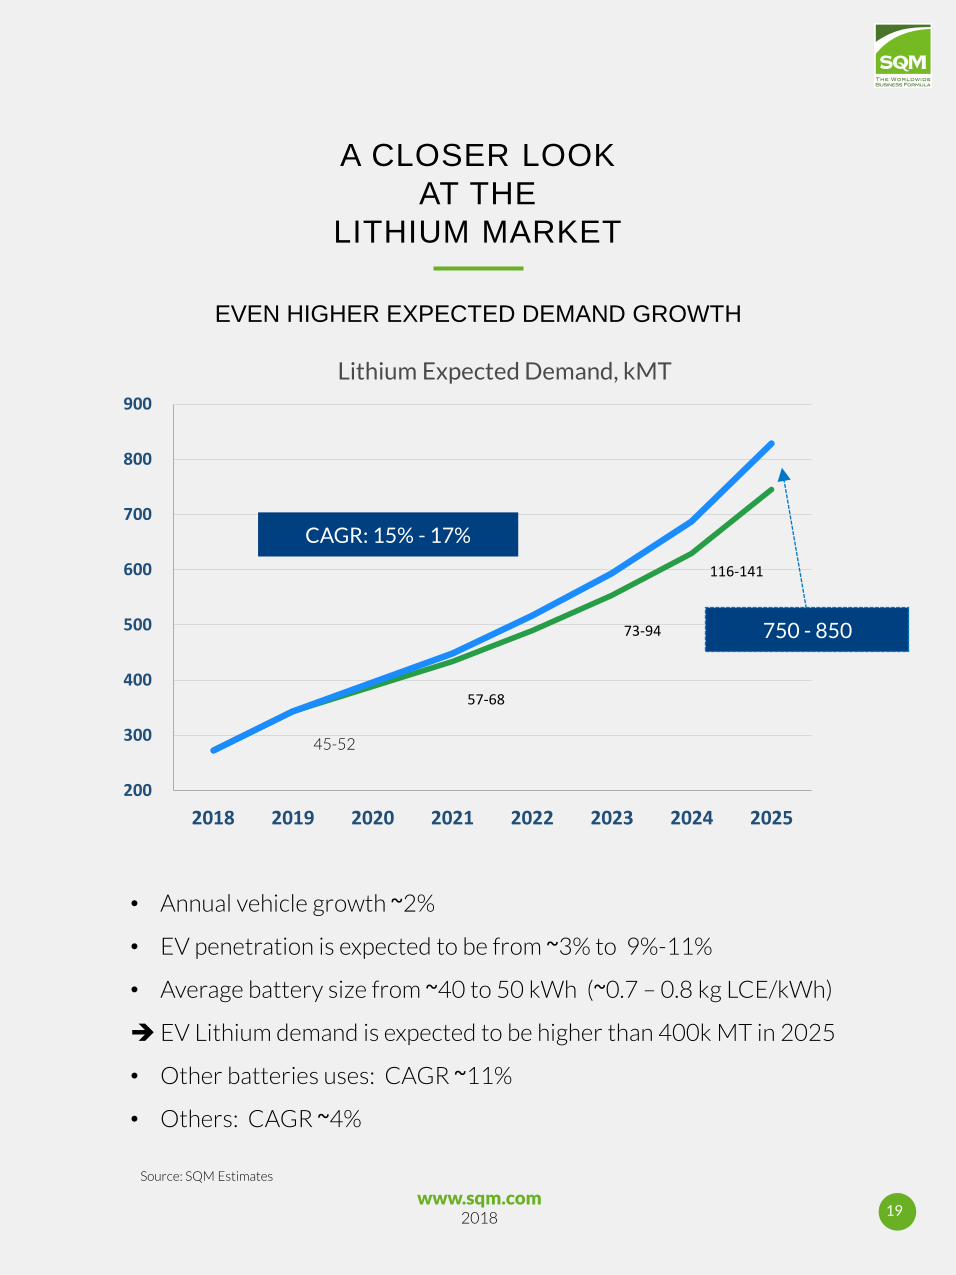
• Annual vehicle growth ~2%
• EV penetration is expected to be from ~3% to 9%-11%
• Average battery size from ~40 to 50 kWh (~0.7 – 0.8 kg LCE/kWh)
EV Lithium demand is expected to be higher than 400k MT in 2025
• Other batteries uses: CAGR ~11%
• Others: CAGR ~4%
Source: SQM Estimates
A CLOSER LOOK
AT THE
LITHIUM MARKET
EVEN HIGHER EXPECTED DEMAND GROWTH
200
300
400
500
600
700
800
900
2018 2019 2020 2021 2022 2023 2024 2025
57-68
73-94
116-141
Lithium Expected Demand, kMT
750 - 850
CAGR: 15% - 17%
45-52

www.sqm.com2018 20
A CLOSER LOOK
AT THE
LITHIUM MARKET*
Demand is growing, and new capacity is needed.
SQM´s Strategy:
• Chile: capacity increase
(48k 70k 120k 180k MT)
• Australia: 45k MT
Be prepared for higher demand growthrates
• The best quality (physical and chemical), looking at the long-term requirements
• Focus on technological development, costreduction and environmentalsustainability
• Value-added relationships with ourcustomers
• Potential M&A activities
*Source: SQM Estimates

www.sqm.com2018 21
KEY ASSUMPTIONS:
• Other Players: Wodgina, Pilbara, other minerals and other brines
From 155 to 385k MT CAGR ~14%
• Big Players: SQM, Albemarle & Tianqi (Salar de Atacama & Talison)
CAGR: ~11% (~8% in 2019/2020, ~3% in 2021/2022, ~15% in 2023/2024, ~25% in 2025)
GLOBAL LITHIUM SUPPLY
EVOLUTION
-
100
200
300
400
500
600
700
800
900
2018 2019 2020 2021 2022 2023 2024 2025
Expected Supply, kMT
Other Producers Big Players
310
385
*Source: SQM Estimates
150
155

www.sqm.com2018 22
• 2024-2025, market will need new projects or the big players will have toincrease their market share
• Systematically, new projects have been delayed longer than expected andrelated production has been less than projected
• High quality battery grade lithium is very difficult to obtain during the earlyproduction years. Quality restrictions in the future are expected to be greaterthan today
• In the past we have underestimated the demand. Small variations in thepenetration of the EVs can have significant effect on lithium demand
GLOBAL LITHIUM
SUPPLY & DEMAND
EVOLUTION
*Source: SQM Estimates
200
300
400
500
600
700
800
2018 2019 2020 2021 2022 2023 2024 2025
Supply & Demand, kMT
Supply Demand at CAGR 15% Demand at CAGR 17%
www.sqm.com2018 23
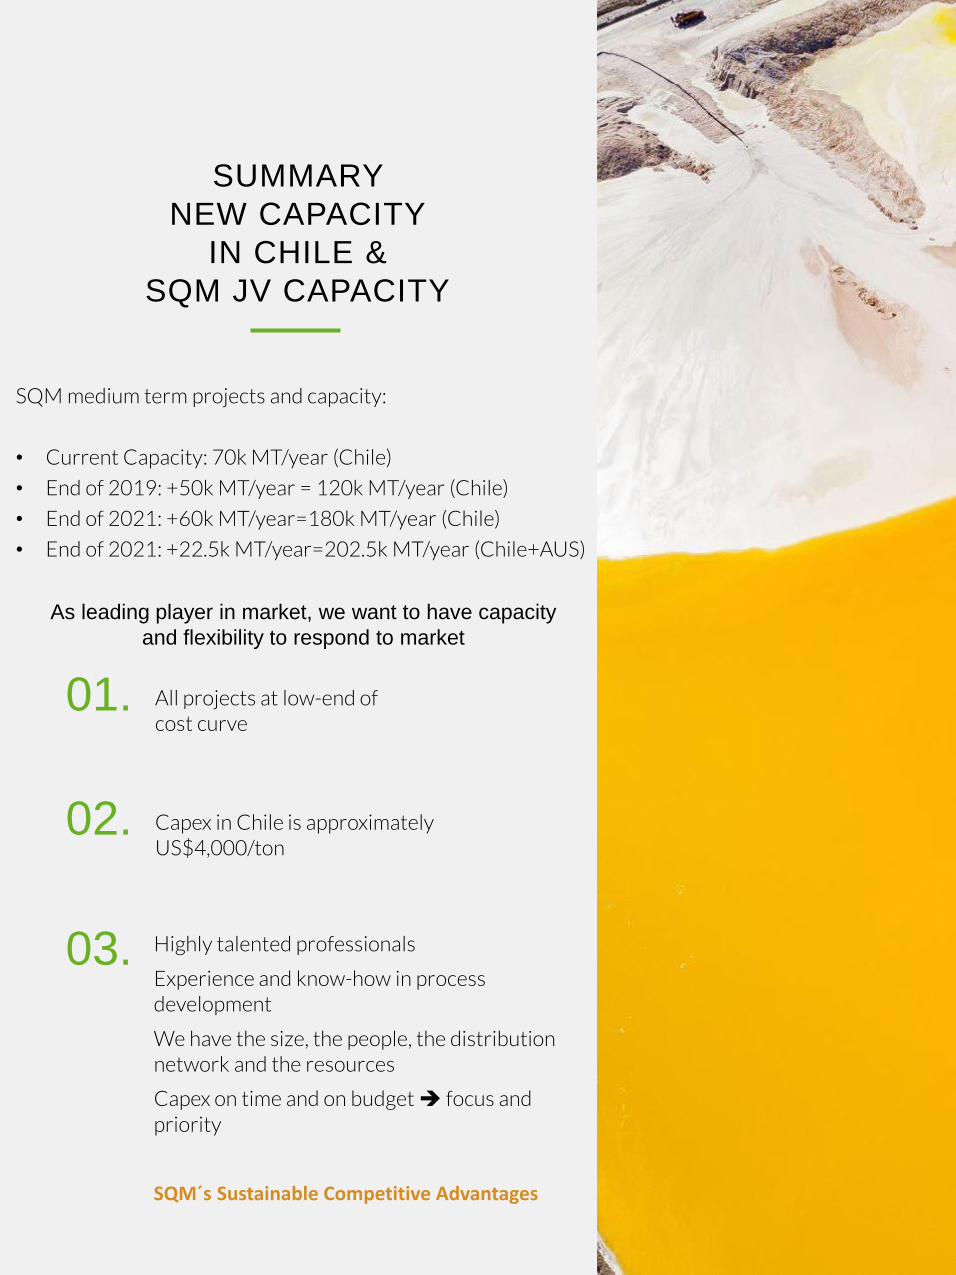
SUMMARY
NEW CAPACITY
IN CHILE &
SQM JV CAPACITY
All projects at low-end of cost curve
01.
02. Capex in Chile is approximately US$4,000/ton
As leading player in market, we want to have capacity
and flexibility to respond to market
SQM medium term projects and capacity:
• Current Capacity: 70k MT/year (Chile)
• End of 2019: +50k MT/year = 120k MT/year (Chile)
• End of 2021: +60k MT/year=180k MT/year (Chile)
• End of 2021: +22.5k MT/year=202.5k MT/year (Chile+AUS)
Highly talented professionals
Experience and know-how in process development
We have the size, the people, the distribution network and the resources
Capex on time and on budget focus and priority
SQM´s Sustainable Competitive Advantages
03.

www.sqm.com2018 24
GERARDO ILLANESVP FINANCE & IR

www.sqm.com2018 25
REVIEW OF RESULTS
SPN Iodine Lithium I.Chem. Potassium
PRICE
QUANTITY
Prices increased in all business lines in the 2Q2018 compared to the same period of 2017.
Significantly increased lithium prices outweighed the impact of lower sales volumes in the 1H2018.
US
$ M
illio
n
180
1213
159 (5) 1
224
100
150
200
250
300
350
Gross Profit Contribution 2Q2018/2Q2017
Revenue Contribution 2Q2018/2Q2017
505
3722
3331
8 3
639
400
500
600
700
800
US
$ M
illio
n

www.sqm.com2018 26
STRONG FINANCIAL POSITION
2.4 2.4
2.4 2.1
1.0
2.0
3.0
4.0
Jun 17 Dec 17 Mar 18 Jun 18
Accounts Receivables(Months of Sales)
8.3 7.8 8.0 7.4
4.0
8.0
12.0
16.0
Jun 17 Dec 17 Mar 18 Jun 18
Inventory(Months of Sales)
4.2
3.3 3.2 3.6
2.0
3.0
4.0
5.0
6.0
Jun 17 Dec 17 Mar 18 Jun 18
Liquidity(Current Assets/Current Liabilities)
6.1 4.5
7.3 6.2
0.0
2.0
4.0
6.0
8.0
10.0
Jun 17 Dec 17 Mar 18 Jun 18
Cash / Short-Term Financial Debt
0.4 0.2 0.1
0.4
0.0
0.5
1.0
1.5
2.0
Jun 17 Dec 17 Mar 18 Jun 18
Net Financial Debt/ EBITDA
0.8 0.9 0.9
1.0
0.5
1.0
1.5
2.0
Jun 17 Dec 17 Mar 18 Jun 18
Leverage

www.sqm.com2018 27
Historical Maintenance CAPEX: ~US$100
million
2016-2018: Lithium Hydroxide Expansion to
13.5k MT: ~US$30 million
2017-2018: Potassium Nitrate Expansion to
1.5m MT: ~US$50 million
2017-2021: Lithium Carbonate Expansion to
180k MT: ~US$525 million
2017-2018: Iodine capacity expansion to 14k
MT: ~US$30 million
2018 CAPEX in Chile: ~US$360 million
CAPEX

www.sqm.com2018 28
CONTACT
INFORMATION
Gerardo Illanes
VP OF FINANCE
Kelly O’Brien
HEAD OF INVESTOR RELATIONS
Irina Axenova
INVESTOR RELATIONS