investment trends in post-school education and training … doc library/final version of the... ·...
TRANSCRIPT

InvestmentTrendsinPost-schoolEducation
andTraininginSouthAfrica

InvestmentTrendsinPost-schoolEducationandTraininginSouthAfrica
2
2
DepartmentofHigherEducationandTraining
123FrancisBaardStreet
Pretoria
SouthAfrica
PrivateBagX174
Pretoria
0001
Tel.:0800872222
www.dhet.gov.za
©DepartmentofHigherEducationandTraining
This publication may be used in part or as a whole, provided that the Department of Higher
EducationandTrainingisacknowledgedasthesourceofinformation.
TheDepartmentofHigherEducationandTrainingcannotbeheldliableforanycosts,lossordamage
thatmay arise as a result of anymisuse,misunderstanding ormisinterpretation of the statistical
contentofthepublication.
This report is available on the Department of Higher Education and Training’s website:
www.dhet.gov.za
Enquiries:
Tel.:0123125465/5582/6044
Fax:0123126355
Email: [email protected], [email protected], [email protected] and
Dateofpublication:21October2016

InvestmentTrendsinPost-schoolEducationandTraininginSouthAfrica
3
3
FOREWORDIt is my pleasure to present to you the first report on Investment
Trends in Post-School Education and Training in South Africa. The
Department of Higher Education and Training aims to improve the
supplyofskills inordertomeettheskillsneedsofthelabourmarket.
The adequate financing of the post-school education and training
system,which comprises four sub-sectors, namely, Higher Education,
Technical and Vocational Education and Training, Community
Education and Training and the Skills Levy System, has become
paramount in the country’s attempt to meet the skills needs and
developmentofthecountry,redresshistoricalimbalancesandcreating
theknowledge-centredandinnovativesocietyarticulatedintheNationalDevelopmentPlan.
The post-school education and training system in South Africa is funded largely by government,
whichmakes fundingoneof themostpowerful instruments thegovernmenthasat itsdisposal to
steer the system. The post-school education and training system receives government funding
through twomain sources, namely, voted funds and a portion of skills development levies. The
report looks at some of the challenges and successes in managing funding for the post-school
education and training system, especially in the post-2008 period. It outlines the policy and
legislative imperativesofthesystem,highlightingthechallengesfacedbythesystempertainingto
financing,alongwiththeapproachestakentomanagethesechallenges.Ananalysisofthehistorical
and current funding and expenditurewithin the system is provided in order to assess the strides
madeinrelationtoaccess,equityandredressasthepillarsofchange.Thereportalsoincludesthe
policyimplementationachievementsbytheDepartmentofHigherEducationandTraining.
The Department will strive to improve the accuracy of this report and be more responsive to
stakeholder’s needs. Your feedback, including suggestions for improvement, can be emailed to:
MrGFQonde
Director-General:DepartmentofHigherEducationandTraining
Pretoria,SouthAfrica

InvestmentTrendsinPost-schoolEducationandTraininginSouthAfrica
4
4
ACKNOWLEDGEMENTSThe Department of Higher Education and Training wishes to thank Mr Russell Wildeman(Independent Consultant) for providing support in the initial conceptualisation of this publicationandforhisgenerouscontributionsinthefinalreviewofthepublication.

InvestmentTrendsinPost-schoolEducationandTraininginSouthAfrica
5
5
TableofContents
ExecutiveSummary 10
1.Introduction 17
2.UNDERSTANDINGTHEPSETSYSTEM:POLICY,CHALLENGESANDIMPLEMENTATION 18
2.1ImplementationChallengesinthePSETsystem 20
2.2ResponsebyDHET:theAppointmentofMinisterialReviewCommitteesandTaskTeams 21
3.UNDERSTANDINGTHEFINANCINGOFTHEPSETSYSTEM:PRIORITISATIONANDCONSTRAINTS,2010/11TO2017/18 24
3.1BackgroundtotheFinancingofthePSETsystem 24
3.2FinancingofthreePSETsub-sectors:universities,TVETcollegesandCETcolleges 30
3.3FinancingoftheSkillsAgendainthePSETsystem 37
4.MANAGINGTHETRANSFORMATIONOFTHEPOST-SCHOOLEDUCATIONANDTRAININGSYSTEM:OUTPUTSANDPROCESSES 41
4.1OutputandImplementationSuccesses-TransformingthePSETsystem 41
4.2DHETProcessesthatAdvancetheClaimsofthePSETsystem 53
5.THEWAYFORWARD:CONTINUEDANDSUSTAINEDINVESTMENTINTHEPSETSYSTEM 56
6.REFERENCES 58

InvestmentTrendsinPost-schoolEducationandTraininginSouthAfrica
6
6
L ist of Tables and Textbox
Table1:AbbreviatedTermsofReferencefortheMinisterialReviewCommittees 21Table2:ProgressintheimplementationofrecommendationsmadebytheMinisterialReviewCommitteesonNSFASandUniversityFunding 22Textbox1:ResultsfromtheFETTurnaroundStrategy 24Table3:RealannualaveragegrowthrateofexpenditureonPSET,2010/11to2018/19 25Table4:Realgrowthinconsolidatedgovernmentexpenditureforaselectnumberoffunctions,2015/16to2018/19 30Table5:ProjectedTVETCollegeSectorBudgetShortfall,2015/16to2018/19 35 Table6:GrowthinconsolidatedprovincialexpenditureonCommunityEducationandTrainingbytype,2010/11to2014/15 37Table7:ThedistributionoftheSkillsDevelopmentLevyfortheperiod2011/12to2015/16 38Table8:NumberofstudentsfundedthroughNSFprojectbyyear,2011/12to2014/15 40Table9:NSFASallocationsbyracein2000,2010and2014 42Table10:NSFASshortfall2013and2014 44Table11:Participationratesatpublicuniversitiesbyraceandgenderin2003,2008,2010and2013 47Table12:EnrolmentratiosinScience,EngineeringandTechnologybyraceandgenderin2003and2013 47Table13:Improving(cumulative)nationalunder-graduatethroughputratesinpublicuniversitiesin2000,2003,2006and2009 49Table14:CertificationratesinTVETCollegesbyqualificationtypein2013/14and2014/15 50Table15:StrategicsynchronisedplanningcalendarofTVETCollegesandtheDHET 54

InvestmentTrendsinPost-schoolEducationandTraininginSouthAfrica
7
7
ListofFigures
Figure1:TherealannualrateofgrowthinexpenditureonPSETandnon-interestexpenditure(excludingdebtcosts),2010/11to2018/19 28Figure2:PSETasapercentageoftheGrossDomesticProduct(GDP)andnationalnon-interestexpenditure,2010/11to2018/19 29Figure3:Totalincomeandexpenditureonpublicuniversities,2009to2014 30Figure4:Mainsourcesofincomeforpublicuniversities,2009to2013 31Figure5:Studentheadcountenrolmentinuniversities,2000to2013 32Figure6:NominalandrealgrowthinpercapitaFull-TimeEquivalent(FTE)studentexpenditureatpublicuniversities,2000to2013 32Figure7:NominalandrealpercapitaFTEspendingontheuniversityunconditionalblockgrant,2004/05to2014/15 33Figure8:RealannualrateofgrowthofprogrammeallocationsintheTVETCollegesector,2010/11to2018/19 34Figure9:RealpercapitaFTEinTVETColleges,2010/11to2018/19 35Figure10:ThecontributionofspendingonstaffanddirecttransfersontheprogrammefundingbudgetofTVETColleges,2015/16to2018/19 36Figure11:TheskillstrainingsysteminSouthAfrica:avisualdemonstration 38Figure12:BreakdownoftotalSETAexpenditurebycategoryofexpenditure,2014 39Figure13:SETALevyIncomeandExpenditurefortheperiod2011to2014 40Figure14:RealpercapitaspendingontheNSFASinpublicuniversitiesinSouthAfrica,1991to2014 41Figure15:NominalandrealpercapitaspendingontheNSFASinpublicTVETColleges,2010to2013 42Figure16:NSFASallocationbygenderin2000,2010and2014 43Figure17:DistributionofNSFASbytypeofinstitution,2009/10to2016/17 43Figure18:Nominalgrowthintheblockgrantsubsidyofhistoricallydisadvantageduniversities,2004/05to2014/15 45Figure19:HistoricallyDisadvantagedInstitutions’shareoftheinfrastructuregrantallocations,2012/13to2014/15 46Figure20:Graduates-atdifferentqualificationlevels-asapercentageoftotalheadcountenrolmentatpublicuniversities,2007to2013 48Figure21:Thepercentageofnationalunder-graduatesafter5yearsofstudyinto3-and4-yearprogrammesatpublicuniversitiesbyraceandgender,2000and2009cohorts 49

InvestmentTrendsinPost-schoolEducationandTraininginSouthAfrica
8
8
Figure22:Thetotalnumberofdoctoralgraduates,2003to2014 50Figure23:Thetotalnumberofdoctoralgraduatesbygender,2003to2014 51Figure24:Numberofdoctoralgraduatesbyrace,2003to2014 52Figure25:Thetotalpublicationoutputunitsperpermanentacademicstaffmemberatpublicuniversities,2004to2013 52

InvestmentTrendsinPost-schoolEducationandTraininginSouthAfrica
9
9
ABBREVIATIONSAPP AnnualPerformancePlanCET CommunityEducationandTrainingDHET DepartmentofHigherEducationandTrainingEMIS EducationManagementInformationSystemENE EstimatesofNationalExpenditureFET FurtherEducationandTrainingTVETMIS TechnicalandVocationalEducationandTrainingManagementInformation SystemFTE Full-TimeEquivalentGER GrossEnrolmentRatioHDIHistoricallyDisadvantagedInstitutionHE HigherEducationHEI HigherEducationInstitutionHEMIS HigherEducationManagementInformationSystemM&EMonitoringandEvaluationMIS ManagementInformationSystemMTEFMediumTermExpenditureFrameworkNCV NationalCertificate(Vocational)NDP NationalDevelopmentPlanNPC NationalPlanningCommissionNRF NationalResearchFoundationNSDS NationalSkillsDevelopmentStrategyNSF NationalSkillsFundNSFAS NationalStudentFinancialAidSchemeNT NationalTreasuryOECD OrganisationforEconomicCo-operationandDevelopmentPFMA PublicFinanceManagementActPICPublicInvestmentCorporationRSA RepublicofSouthAfricaSARS SouthAfricanRevenueServicesSET Science,EngineeringandTechnologyStatsSA StatisticsSouthAfricaSSA Sub-SaharanAfricaTVET TechnicalandVocationalEducationandTrainingUNESCO UnitedNationsEducational,ScientificandCulturalOrganizationWP WhitePaper

InvestmentTrendsinPost-schoolEducationandTraininginSouthAfrica
10
10
EXECUTIVESUMMARYTheadequatefinancingofthepost-schooleducationandtrainingsystem,whichcomprisesfoursub-sectors, namely Higher Education, Technical and Vocational Education and Training, CommunityEducationandTrainingandtheSkillsLevySystem,hasbecomeparamountinthecountry’sattemptto redress historical imbalances and creating the knowledge-centred and innovative societyarticulatedintheNationalDevelopmentPlan(NDP).However,thereareanumberofmacrochallengesthatinterferewithanunambiguousaffirmationofthecentralityofthePost-schoolEducationandTraining(PSET)systeminSouthAfrica,namely
• A low economic growth environment and its attendant negative impact on the nationalfiscus;
• In the context of a smaller funding base, competing priorities at the national and sub-nationallevelsofgovernment;and
• Persistent concerns that additional investment in the PSET system is undermined byinefficiencies,pooroverallmanagement,andqualitydeficits.
Inbuildinganinvestmentargumentfortheexpansionofopportunitiesinthepost-schooleducationandtrainingenvironment, itmustbeacknowledgedthateducation institutions inthePSETsystemhavebeenunderseverepressuretodelivereventhoughtheydidnotalwayshavetheresourcebaseto dynamically execute their primarymandates. While the Department of Higher Education andTraining (DHET)continues toplaya leading role in improving the fundingofPSET institutions, it isequally important tocarefullydocumentandanalyse theoutputand implementationsuccessesofPSET institutions in order to engender a greater appreciation of the contribution of this sector inhelpingtoaddressproblemsofpoverty,unemploymentandinequality.Thispublicationaimstocreateabaselinefortheexplorationandassessmentof investment inthePSETsystemregardingaccess,equityandredressby:
• Exploringthecurrentbudgetarypatternsandtrends;• Indicating the strides that this democratic dispensationhasmade in termsof dealing
withthehistoricalimbalances;and• Making the case for the improved financing of the PSET system as a vital cog in the
government’ssocialandeconomicpolicies.
Thepolicyandoutcomegoalsof thePSETsystemaresetout in theNDPandtheWhitePaper forPost-school Education and Training (DHET, 2013). The main message contained in these officialdocuments is that the PSET system must be expanded rapidly in order to meet the country’semergingsocialandeconomicneeds.SomeoftheoutcomegoalssetoutintheNDPtobeachievedby2030include:
• Increasingparticipationratesto25percent inthecollegesectorandtomorethan30percentintheuniversitysector;
• Increasinggraduation rates inTVET colleges to75per cent,while in theuniversity sector,achieveacomparablerateofmorethan25percent;
• Intheuniversitysector,increasedoctoralgraduates,whileraisingthequalificationlevelsofuniversityteachingpersonnelsuchthat75percentofsuchstaffholdaPHD;
• Substantiallyincreasetheparticipationratesforfemaleandblackstudents;• Increasingworkplacetrainingopportunitiesforalloccupationalrelatedqualifications;• Increasing opportunities for workplace-based learning (WBL) through apprenticeships,
learnershipsandinternships,etc.;and• Increasing the participation rate and throughput rate in the Community Education and
Training(CET)sector.

InvestmentTrendsinPost-schoolEducationandTraininginSouthAfrica
11
11
While these expansion goals were uncontroversial under the assumption of a steadily growingeconomy, thepost-2009slowdown in theeconomyhasbroughtallocationandefficiency issues tothe centreof budget debates in the country. Insteadof a consistent and steadyexpansionof theentirePSETsystem,thereductioningovernmentresourcesandanuncertainpolicyenvironmenthasforcedtoughandunpopulardecisions.KeychallengesinthePSETsystemOverviewThe PSET system has to deal with a number of challenges that emanate from the externalenvironment (allocationdecisions), factors internal to theway institutions operate (efficiency andimplementation challenges) and broader policy shifts that took place in government (for examplethe functionshiftofTVETCollegesandAdultEducationandTraining (AET)centres to thenationalsphereofgovernment).Inaddition,theWhitePaperforPSETrequiresacoherencewithwhichthegovernmentconceptualisesandimplementsPSETpolicyandhencethedemandstogetthisrightareconsiderableandrequireawholeseriesofeventsandprocessestosupporttheimplementationofthePSETpolicyframework.ImplementationchallengesTheuniversity sector faces the following key challenges, namely relatively lowgraduation/successrates;arealdeclineinStatefundingfortheuniversitysector,includinginadequatecontributionsbythe National Student Financial Aid Scheme (NSFAS); pressure to transform the sector throughtransformedlanguagepoliciesandatransformedcurricula;afluidpolicyenvironmentthatissubjecttoregularpolicychanges;andattemptsatbuildingthenextgenerationofacademics.Otherchallengesintheuniversitysectorthatrequireurgentinterventionareequityattheindividualand institutional levels, fine-tuning the funding framework to avoidperverse incentives , boostingthe quality of foundational programmes, and the development of comprehensiveMonitoring andEvaluation(M&E)systemsforthesectorasawhole.In reflecting on the challenges facing the TVET college sector, the White Paper for PSET drawsattention todeficits inprogrammequality, theprofessional capabilityof staff, theneed tobuildastronger Management Information System (MIS), weak partnerships between TVET colleges andindustry,restoringlinksbetweenthecollegesandthelabourmarketbymakingprogrammeofferingsmoreresponsive,andimprovingtheplacementofcollegegraduatesinjobs.External commentators have also raised issues about the poor throughput and graduation rates,poorgovernanceandmanagementofcolleges,variable financialmanagementskillsandconfusionaroundthebrandingandplaceofTVETcollegesinthepost-schooleducationsystem.Intermsoftheskillssystem,thesectoraleducationandtrainingauthorities(SETAs)areexpectedtofacilitatethedeliveryofsector-specificskillsinterventionsthathelpachievethegoalsoftheNationalSkills Development Strategy III (NSDS) and develop the skills needed by employers. There arecurrently21SETAs.CurrentproblemswiththeSETAsinclude:
• Poorgovernance;• Inadequatehumanresources;• Pooradministrationandfinancialmanagement;• Nopropermonitoringandevaluationsystem;

InvestmentTrendsinPost-schoolEducationandTraininginSouthAfrica
12
12
• Noaccuraterecordsofthenumberofpeoplewhohavebenefitedfromthesystemandwhattheimpacthasbeen;and
• Limitedornolinkageswiththepost-schoolsector.ThebiggestchallengewithregardstotheCommunityEducationandTrainingsectoristodevelopafirmunderstandingofimplementationmodalitiesandtogarnerthenecessaryfundingtosupportagradualimplementationprocess.Theexpansionofthissectoriscriticallydependentonthelessonslearned during the piloting of the nine community education training centres as well as clarityregardingtheoverallfinancingofthePSETsystem.GeneralfinancingchallengesTheBudgetReview2013(NationalTreasury,2013) indicatedthat if theeconomyweretogrowbymore than 5 per cent annually, government revenue could be expected to double in the next 20years.ThiswouldmakemajorpolicyinitiativessuchastheNationalHealthInsurance(NHI)andthesubstantialexpansionofvocationaleducationaffordable.However,thesamereportcautionedthatif economic growth stayed on its past trajectory of around 3.5 per cent annually, then significantadjustmentstotherevenuebase(increaseintaxes)and/ordecreasesinotherareasofspendingwillbe required to sustainablymeet the health and post-school education commitments. The BudgetReviewindicatedthata‘nopolicychange’scenarioinpost-schooleducationassumesasteadyrateof growth in enrolments, whereas a ‘policy change’ scenario assumes that the government hasbegunimplementingtherapidlyincreasing(enrolment)growthprovisionsintheWhitePaperforthePSETsystem.Thefactthattheeconomyhasnotmanagedtoperformattheassumedbaselinegrowthrateof3.5per cent has massive implications for how PSET will be funded and how this situation impactsdifferentpartsofthePSETsystem.FundingforthePSETsystemthatisappropriatedfromthebudgetoftheDepartmentofHigherEducationandTraining(DHET)isprojectedtogrowinrealtermsby3percentonaverageoverthepresentMTEF,whileastrongpositiverealgrowthrateof5percentonaveragehasbeensustainedsince2010/11. IftheexpandeddefinitionofPSET(inclusiveoffundingfrom the National Skills Fund and SETAs) is considered, then expenditure on this function isprojected to grow by 4 per cent on average in real terms over the present Medium TermExpenditureFramework(MTEF).While it isnotpossible to judge theadequacyof theexpenditure investments in theabsenceofaconsiderationofservicedeliveryburdens(studentenrolmentsandoutputtargets),attheaggregatelevel at least, there is a genuinely positive intent in spending additional resources on theprovisioningofPSET.Forexample,ifonecomparesthegrowthinspendingonPSETtothegrowthinspendingonnon-interestexpenditure ingeneral, thena largepositiveadjustmenthasbeenmadeforPSET in thepresent financial year (roughly10per cent in real terms), although thisadvantagefadesovertheremainderoftheMTEF.Thereasonforthelowerrateofgrowthovertheremainderof the MTEF relates to the imperative to spend resources effectively and efficiently as well asongoing uncertainty about external events that may challenge the assumptions of the presentbudget.Over theperiod2010/11 to theendof thepresentMTEF (2018/19), national PSETexpenditure issteady at around1per cent of theGrossDomestic Product (GDP),while its shareof non-interestexpenditure has grown steadily from 3.2 per cent in 2010/11 to slightlymore than 4 per cent in2018/19. Comparatively, thePSET/GDP ratio is fairly lowwhencompared to theOrganisation forEconomic Co-operation and Development (OECD) country average, which spent collectivelyapproximately 1.6 per cent of their GDP on the PSET system. Expenditure on concurrent socialservices functions (inclusive of sub-national own spending),which include functions such as basiceducation, social development and the PSET system, is projected to grow positively in real terms
InvestmentTrendsinPost-schoolEducationandTraininginSouthAfrica
13
13
over the present medium-term. The growth in these consolidated functions, including the PSETsystem,outstripsthegrowthinconsolidatednon-interestexpenditureoverthesameperiod.Thisisfurtherproof,thatatanaggregatelevel,thepost-schoolingsectorisenjoyingsomeformoffundingprioritisation, in spite of the negative overall spending environment. However, the real rates ofgrowthforexpenditureonthePSETsystemaremoderate,reflectinginpart,themuchslowerrateofgrowthonPSETspendingforthetwoouteryearsofthepresentMTEF.
FinancingchallengesspecifictotheuniversitysectorExpenditureontransfersandearmarkedfundstotheuniversitysectorisprojectedtogrowby4percent on average over the present MTEF. Over the longer period, namely 2010/11 to 2018/19,expenditureontheuniversityprogrammeisprojectedtogrowby5peronaverageinrealterms.The university sector has experienced increasing enrolment trends, which imply higher servicedelivery burdens in the context of a difficult spending environment. Between 2000 and 2013,headcountenrolmentsgrewfromslightlymorethanhalfamillionstudentsin2000tojustunderamillionstudentsin2013,whichrepresentsa76percentincreaseinheadcountenrolments.Overthisentireperiod,enrolmentgrowthaveraged4.5percentyearly.Facinggrowingstudentenrolmentsandanadverseinflationaryenvironment,overalluniversitysectorspendinghasnotkeptpacewiththerisingcostsandconsequently,universitieshadtoperformthesame(andmore)functionswithsubstantially less.While it has been shown earlier that there is a positive spending intent in thesector, external factors (such as the rate of inflation) and a strong growth in enrolment numberswouldhavechallengedsuchgains.The real decline in per capita spending is driven strongly by the decline in the value of theunconditionalblockgrantifexpressedinpercapitaterms.Relativetowhattheblockgrantwasabletobuyin2004/05,itissoberingtorealisethatitsvaluein2014/15wassubstantiallylessthanwhatcouldbeboughtwiththegrantin2004/05.Universitieshaverespondedbyrelyingmoreheavilyonstudentfeesandthisformofincomehasrisensteadilyoverthelastfewyears.By2013,studentfeesrepresentedone-thirdof the total incomeofpublicuniversities.WhenthePresidentannouncedano-fee increase in2015fortheacademicyear2016,theonlyotherviablewayofdealingwiththisshortfallinfundingforuniversitiesweredirectgovernmenttransferstouniversities.FinancingchallengesspecifictotheTVETcollegesectorExpenditureontheTVETcollegesisprojectedtodeclineby1percentinrealtermsonaverageoverthepresentMTEF,whileoverthelongerperiod(2010/11to2018/19),thisprogrammeisprojectedtogrowinrealtermsby5percentonaverage.Thepositivegrowthoverthislongerperiodreflectsthe initial large positive allocations that were made to finance TVET Colleges (especially studentfinancialaid)followingtheannouncementthatcollegeswillbecomeanationalfunction.Conversely,the decline in funding over the presentMTEF is largely due to the additional expenditure spacecreatedintheuniversitybudgetsinthepresentfinancialyear.Inotherwords,additionalresourcesinthebudgetoftheDHEThavebeendivertedtopublicuniversities,thusleavingTVETCollegeswithspending resources levels similar to what they had received under the control of the provincialeducationdepartmentspriorto2015/16.The impact of the decline in funding for TVET Colleges can be observedmost pertinently in thedeclineinthepercapitaspendingperFull-TimeEquivalent(FTE)student.Forexample,therealpercapitaFTEin2016/17isalmosttwotimeslowerthanthecorrespondingpercapitaspendingin2010,thusreinforcingtheviewofthesteadydecline inprogrammefundingforTVETcolleges.Whatthisimplies are further pressure on operational budgets that are already strained (expenses on

InvestmentTrendsinPost-schoolEducationandTraininginSouthAfrica
14
14
examinationunits, additional resources for curriculum reforms, lecturer development and generalunder-staffing).TheNDPstipulatesthattheTVETcollegesectorshouldenrol2.5millionstudentsby2030.Basedonthe current enrolment of approximately 710 000 students, it is envisaged that the system shouldexpand by at least 7.1 per cent annually until 2029/30 to reach this target. However, due to thefundingsqueeze,itisprojectedthattheTVETCollegesector,inpursuanceoftheNDPgoals,islikelyto experience a cumulative budget shortfall close to R54 billion over the present MTEF. Thiscalculation isbasedpartlyon theassumption that theno-fee increaseof theuniversity sectorwillcarryoverintotheTVETCollegesector;thattheestablishmentofnewandfunctionalTVETsitesgoaheadasplanned;and,NationalStudentFinancialAidScheme(NSFAS)fundingcontinuestomakeacontributiontomeetingfinancinginthesector.Respondingtothechallenges:governmentandpublicinstitutions’responsesOverviewThe department, mindful of the resources and implementation challenges, have developed arationalandevidence-basedapproachtothemanagementofthechallenges.Thisincludesworkondevising a new national plan for the PSET system as a whole, consolidating the emerging HigherEducation and Training Information System (HETIS), andworking co-operativelywith theNationalTreasury in quantifying the overall resources claims of the PSET system. Joint management withpublic institutionsof importantnationalgoalssuchasparticipation,quality,andequityhasfurtherimprovedtheoverallstandingofthePSETsystem.Governmentanditsevidence-basedresponsetochallengesinthePSETsystemThe department, as a national policy-making department, has to respond to multiple policy andfinancing challenges. Furthermore, such responses take place in a compromised overall spendingenvironment and in a context of rising student demands for affordable and accessible education.Thefollowingaresomeofthekeyresponses:
• ThedevelopmentofanewnationalplanforthePSETsystem-WiththeestablishmentofanewDepartmentofHigherEducationandTrainingandfollowingthepublicationoftheWPforthePSETsystem, ithasbecomenecessarytodevelopanewnationalplanforthePSETsystemasawhole.Thismaysoundself-evident,buttheplanningandoperationsnecessarytobringtheWPonthePSETsystemtofruitionarefarmorecomplicatedthanimplementingasinglenationalhighereducationplan.Animportantpartofthisworkistodeveloprevisedtargets for each of the main sub-sectors in recognition of the changed economicenvironment and the resulting realisation that the pace atwhich the systemexpandswillhavetobemoderated.Furthermore,theplanwillgivesomeindicationofthecapacityofthePSET system-in itspresent guise- to implement theWhitePaper for thePSET system.Theplanwill serveasa referencepoint toguide futureprojectionsof total costsand the timerequiredtofully implementprovisions intheWhitePaperforPSET.Thisprocess isalreadyunderwayand thedepartment isworkingcloselywith theNationalTreasury in fine-tuningthisvitalplan.
• PlanningprocesseswithPSETinstitutionsthatbringpredictabilityandstabilityinfunding-
Educationinstitutions,inordertofunctionwithoutanyinterruption,mustbefundedinsuchawaythatbringscertaintyandpredictabilityinthefundingasfarasthecontributionfromthe government is concerned. Planning for universities and TVET colleges is informed byprojected student numbers, an agreed calendar that contains critical dates, and a built-inflexibilitymechanismthatallowstheDHETandinstitutionstoreviewrecentdevelopments.

InvestmentTrendsinPost-schoolEducationandTraininginSouthAfrica
15
15
• Careful and considered responses to Ministerial Review Committees-Recommendations
areresearched,modelledandimplementedinanexpeditiousmanner.Thislendscredibilityto theworkof theReviewCommitteesandassures futureMinisterialCommitteesorTaskTeamsthattheirworkwillbetakenseriouslyandislikelytohaveasubstantialimpactonthepolicyissueathand.Inthispublication,directevidenceoftheprogressthathasbeenmadein implementingrecommendationsfromMinisterialReviewCommitteesandTaskTeamsisprovided.
• Cross-government co-operation in determining the financial quantum involved indelivering and expanding post-school education and training-The National Treasury hasbegunaprocessofcostingtheimplementationoftheWhitePaper.However,becauseofthecentralityoftherevisednationalplanforthepost-schooleducationandtrainingsystem,thedepartmentandtheNationalTreasuryareworkingtogethersoastoensurethatthecostingexercise has an appropriate referencepoint. This includes the possibility of allowing thedepartment to adjust input parameters so as to represent actual costs of educationprovisioning in the PSET system. This process will also ensure that both sides have anunderstandingoftherelativecostdrivers,constraintsandchallengesinimplementingsuchanimportantinitiative.
• Strengtheningthecapacityofthesystemtomonitoritsoutcomesandoutputs-Duetothe
increasingoutputandoutcome-orientationof successivepost-apartheidgovernments, it iscriticaltocollectquality input,outputandoutcomerelateddatathatindicatetheprogressgovernment is making in undoing apartheid legacies and creating a new culture ofexcellence. Evidenceof theevolving capacityof the systemare the various cohort studiesthathavebeendonetostudythroughputrates(atbothunder-graduateandpost-graduatelevels)andthedegreeofstudentattritioninthesystem.
JointmanagementofnationaloutcomeskeytothesuccessofthePSETsystem
• BroadenedaccessofpoorstudentstoPSETo The NSFAS allocations to universities have grownmassively from a base of 7,240
deservingstudentsin1991to186,150studentsin2014.Similarly,atTVETcolleges,NSFASbursarieshavebeenawardedto62,000studentsin2010,whilein2013,thattallyhasincreasedtoalmost221,000students.
o African and Coloured students are major beneficiaries of such funding, andimportantly,theNSFASallocationsappeartokeeptrackofinflation,thuspreservingthepurchasingbenefitsofthisvitalfundingsource.
o Female students constituted close to 60 per cent of thosewho received financialawardsin2014.
• Equityandredressandinstitutionalandindividuallevelso The department has addressed the large infrastructure backlogs of historically
disadvantaged institutions (HDIs) by introducing a HDI grant in 2015/16 that willdeliveralmostR2billionoverafive-yearperiod.Actualimplementationofthegrantcommencedin2016/17.
o TheparticipationratesofAfricanstudents increasedfrom11.1percent in2003toalmost 17 per cent in 2013 (an increase of about 6 per cent), whereas thecorrespondingrateofincreaseforColouredstudentswas3.4percentoverthesameperiod. African female students have increased their participation rates from12.2percentin2003to19.5percentin2013.
o In 2003, African students constituted 55 per cent of all science, engineering andtechnology enrolments, while White students made up 30 per cent of theseenrolments. In 2013, African student enrolments constituted 67 per cent of all

InvestmentTrendsinPost-schoolEducationandTraininginSouthAfrica
16
16
enrolments,whileallothergroups’enrolmentratesshrunkrelativetothegrowthinAfricanstudentenrolments. Thesubstantial rise in theenrolment ratesofAfricanstudentsinSETfieldsisnoteworthyandmustbecelebrated.
• Improvementofqualityoutcomesinthesystemo During the period 2007 to 2013, the national under-graduate rate increased at a
fasteraverageratethantheenrolmentrate(5.3percentversus4.2percent),whichgivessomeindicationoftheimprovedefficiencyinthesystem.
o Generally,withtheexceptionofWhitefemalestudents,thecohortperformanceofthosewho started their studies in 2009 obtained higher graduation success ratesthan their counterpartswho started their studies in 2000. For the 2009 cohort, amuchlargerpercentageofAfricafemalestudentsgraduatedwithinfiveyears(43.6percentvs.30.4percentin2000),whilethecorrespondingsuccessrateforIndianfemalesisabout50percentvs.42.1percentin2000.
o While it will be difficult to attribute the growing graduation success rate to onefactoronly,thecontributionofdedicatedgrantstoimprovethequalityofteachingas well as better preparing students for the rigours of university studies (thefoundation grant) could be considered as important variables in this successequation.
o Between2003and2013,thetotalnumberofsuccessfuldoctoralgraduateshasbeendoubled, even though the performance is still below the set benchmark.Furthermore,Africandoctoral graduates have increased substantially and in 2014,thelargestnumberofdoctoralgraduateswereAfrican.
o Between2003and2013,thetotalpublicationoutputunitsperpermanentmembershas doubled, even though the aggregate number hides important differences inresearchoutputamonghighereducationinstitutions.
Thewayforward:continuedandsustainedinvestmentinthePSETsystemWhatthisreporthasestablishedisthefollowing
• Theconstrainedeconomicgrowthenvironmentandtheconsequentimpactonthenationalfiscushasforcedpolicy-makerstobemuchmorespecificaboutthepoliciesthatwillenjoyfundingprioritisationandhowsuchpoliciesoughttobefunded;
• The budgetary evidence presented in this report suggests that there is a positive intentnationallytofundtheexpansionofthepost-schooleducationandtrainingsystem,butthatsuch gains are challenged by an adverse inflationary environment and rapidly risingdemand, which is stimulated internally by the policy imperatives of theWhite Paper forPost-schoolEducationandTraining;
• The two largest post-schooling sectors, namely the universities and public TVET Colleges,areunderseverepressuretopreserveanyspendinggainsandhavebeensubjectedtorealdeclines in their per FTE student funding. The situationwith regards to TVET Colleges issomewhatworse,becauseof theneedtoaccommodate important increases touniversityfundingaswellasthecapacitychallengesthataccompaniedthenationalfunctionshift;
• Funding models for Community Colleges in the CET sector are in the process of beingfinalised and it is clear from the brief review in this report that a substantial injection offundingisneededtoimplementsomeofthepolicyproposals;and
• Thereissomeuncertaintyaboutthecontributionofskillsdevelopmentfundingtoassisttherapid expansionof post-schooling education and trainingopportunities and that clarity inthisregardwillassistplannersinallfacetsofthePSETsystem.

InvestmentTrendsinPost-schoolEducationandTraininginSouthAfrica
17
17
In spite of these challenges, there are a number of ameliorative factors that have contributed toinstitutionsinthePSETsystemshowingresilienceinthefaceofanadverseandshrinkingspendingenvironment.Theseinclude:
• Signs of improved effectiveness in the university system due to a combination of goodmanagement on the part of universities andprogressive State funding policies, leading tokeytransformationtargetsbeingmetorgoodprogressedregistered;
• Thedepartmenthas formalised internal processes aimedatbuilding theevidencebase toinfluencethePSETsysteminaprogressiveanddesirablemanner;and
• Continued focus on redressing the funding and administrative burdens of historicallydisadvantagedinstitutionssoastodynamicallybringthemtotheproductionandinnovationmix.
Unlesstheeconomystartstogrow,educationandfinancialplannersaregoingtofacestarkchoices:temporarily halt the expansion of the system and focus on improving the quality of the system(inputs,outputsandprocesses)orchoosewhichofthePSETsystemswillbeallowedtogrowinspiteofthefinancialchallenges.Theformeroptiondoesnotimplyarealreductioninthefundingintentofthegovernment,but itdoessuggest that therateofgrowth inexpenditures is likely tobesloweddowninordertocomplywithbroaderaggregatefiscalmanagement.Giventherelativeefficiencyoftheuniversitysector,itismorethanlikelythatadditionalincreases,atleastintheshortterm,willbedirectedatthissector.TheunfortunateconsequenceofthisapproachisthatothercomponentsofthePSETsystemwillfallbehindintermsoftheexpansiongoalsoftheWhitePaperforPost-schoolEducationandTraining.However, in the case of the TVET College sector for example, the department has activelyencouragedadifferentiatedcollegesectoranditisnotunreasonabletodemandthatprioritysectorsare continued to be funded well, thus preserving some of the national goals during this time. Ifapproached in that manner, student enrolment can still be increased in some areas and keptconstant inotherareassoas tomanage theexpansioncommensuratewith the reducedspendingenvironment.However,much depends on how the present student demands for free higher education and forzero increases in the fee levelswillbemanaged.Thisuncertainty is reflected in themedium-termallocationforthePSETsystemandtheneedtoresolvethismatterhasnowbecomeurgent.
1.INTRODUCTIONSouthAfrica’sNationalDevelopmentPlan(hereafterreferredtoastheNDP),whichemanatesfromtheworkoftheNationalPlanningCommission(NPC),statesthatthecountry’shumancapitalmakesadirectcontributiontoeconomicgrowth.Failure to resolveemploymentandqualityofeducationchallenges is likely to result in economic decline, falling living standards, rising competition forresourcesandsocialtension(NPC,2011).Theadequatefinancingofthepost-schooleducationandtraining system, which comprises four sub-sectors, namely Higher Education, Technical andVocationalEducation,CommunityEducationandtheSkillsLevySystem,hasbecomeparamount inthe country’s attempt to redress historical imbalances and creating the knowledge-centred andinnovativesocietyarticulatedintheNDP.However,thereareanumberofmacrochallengesthatinterferewithanunambiguousaffirmationofthecentralityofthePost-schoolEducationandTraining(PSET)systeminSouthAfrica,namely:
• A challenging economic growth environment and its attendant negative impact on thenationalfiscus;
InvestmentTrendsinPost-schoolEducationandTraininginSouthAfrica
18
18
• In the context of a smaller funding base, competing priorities at the national and sub-nationallevelsofgovernment;and
• Persistent concerns that additional investment in the PSET system is undone byinefficiencies,pooroverallmanagement,andqualitydeficits.
Inbuildinganinvestmentargumentfortheexpansionofopportunitiesinthepost-schooleducationand training environment, it is imperative to acknowledge that education institutions in the PSETsystem have been under severe pressure to deliver even though they did not always have theresourcebasetodynamicallyexecutetheirprimarymandates.WhilethedepartmentcontinuestoplayaleadingroleinimprovingthefundingofPSETinstitutions, it isequallyimportanttocarefullydocument and analyse the output and implementation successes of PSET institutions in order toengender a greater appreciation of the contribution that these institutions bring in the country’squesttoaddressproblemsofpoverty,unemploymentandinequality.ThispublicationaimstocreateabaselinefortheexplorationandassessmentofinvestmentinthePSETsystemregardingaccess,equityandredressby:
• Exploringthecurrentbudgetarypatternsandtrends;• Indicatingthestridesthatthisdemocraticdispensationhasmadeintermsofdealing
withthehistoricalimbalances;and• MakingthecasefortheimprovedfinancingofthePSETsystemasavitalcoginthe
government’ssocialandeconomicpolicies.The report is limited to the funding made available to the higher education institutions, TVETcolleges,CET collegesand the skillsdevelopment leviesmadeavailable toSETAs to facilitate skillsdevelopment.Thedatausedinthisreporthavebeendrawnfromanumberofsources,whichincludeinternaldatasources (The Higher Education Management Information System); National Treasury publicationsthat deal with budget and performance data (Budget Reviews and Estimates of NationalExpenditure);externalreports,generatedbyDHETofficialsandpresentedinpublic(Parliamentandacademicconferences);keyeconomicdatafromStatisticsSouthAfricapublications(ConsumerPriceInflation, national income etc.); and data from external multilateral agencies (World Bank andUNESCOdatabases).The report is structured in the following manner. Section 2 examines the policy and legislativeimpetusforthePSETsystemandprovidesasynopsisoftheimplementationchallengesthatfacethissystem.Section3analysesthefinancingofthePSETsystemagainstthebackgroundofthecountry’soverallpublicfinancestoconveyaprecisesenseofthefundingfortunesofthePSETsysteminthepost-2008period.Section4examinespolicyandimplementationsuccessesachievedduringthelastdecade and interrogates the careful and logicalway inwhich the DHET has intervened to securefinancial and implementationgains for thePSET system. Section5 closes this report andprovidespointersforthecontinuedfinancingofthePSETsystem.
2.UNDERSTANDINGTHEPSETSYSTEM:POLICY,CHALLENGESAND IMPLEMENTATIONIn South Africa, the post-school education and training system is made up of all education andtraining provision for those who have completed school, those who did not complete theirschooling, and those who never attended school. The funding available for the post-schooleducation and training system is provided through the fiscus and the levy grant system. Thedepartmentismandatedtoprovideoversightoverthefundingthatflowstothevariouscategoriesofpost-schooleducationandtraininginstitutions,whicharethefollowing:

InvestmentTrendsinPost-schoolEducationandTraininginSouthAfrica
19
19
• 26PublicUniversities(ofwhich11areregardedastraditionaluniversities,6asUniversitiesofTechnologyand9asComprehensiveUniversities)1. In2013,twonewpublicuniversities,SolPlaatjieUniversityintheNorthernCapeProvince,andtheUniversityofMpumalangainMpumalangaProvincewereestablishedascomprehensiveuniversitiesandhavefunctionedas fully-fledged universities in 2014. In addition a third comprehensive university, SefakoMakgatho Health Sciences University, incorporating the former Medunsa campus of theUniversityofLimpopo,hasbeenestablished in2014,opening itsdoors in2015.Datafromthethreenewlyestablisheduniversitieswillbeincludedinsubsequentreports;
• 50PublicTechnicalVocationalEducationandTraining(TVET)colleges(previouslyreferredtoasFurtherEducationandTrainingcolleges)with258campuses;and
• 9 Community Education and Training (CET) collegeswith approximately 3000 CommunityLearningCentres(previouslyreferredtoasPublicAdultLearningCentres).
Thedepartmentisalsoresponsibleforinstitutionsthatsupporttheeducationandtrainingprocesssuch as the Sector Education and Training Authorities (SETAs) and theNational Skills Fund (NSF),whichmeansthatthedepartmentisresponsibleforensuringthatfundsgeneratedthroughtheskillsdevelopmentlevyareutilisedappropriatelyandoptimallytodevelopskillsneededfortheeconomy.Thepolicyandoutcomegoalsof thePSETsystemaresetout in theNDPandtheWhitePaper forPost-school Education and Training (DHET, 2013). The NDP, published in 2011, has set ambitiousoutcomegoals for thepost-schooleducationandtrainingsystem,while theWhitePaper forPost-schoolEducationandTraining,inaffirmingthesegoals,alsoaddressestheunityofthePSETsystem,urges meaningful partnerships among institutions, and commits the system to effectivedifferentiationinboththeTVETcollegeanduniversitysectors.Differentiationreferstothelevelandtypeof educationprogrammesofferedand is intimately linked to improving theoverall efficiencyandaffordabilityofeducationprovisioninginthePSETsystem.ThemainmessagecontainedintheseofficialdocumentsisthatthePSETsystemmustbeexpandedrapidlyinordertomeetthecountry’semergingsocialandeconomicneeds.Someoftheseoutcomegoalstobeachievedby2030include:
• Increasingparticipationratesto25percent inthecollegesectorandtomorethan30percentintheuniversitysector;2
• Increasinggraduation rates inTVET colleges to75per cent,while in theuniversity sector,achieveacomparablerateofmorethan25percent;
• Intheuniversitysector,increasedoctoralgraduates3,whileraisingthequalificationlevelsofuniversityteachingpersonnelsuchthat75percentofsuchstaffholdaPHD;
• Substantiallyincreasetheparticipationratesforfemaleandblackstudents;• Increasingworkplacetrainingopportunitiesforalloccupationalrelatedqualifications;• Increasing various skills development opportunities such as apprenticeships, workplace-
basedtraining,etc.;and• Increasing the participation rate and throughput rate in the Community Education and
Training(CET)sector.
Inordertoaccommodatethehoped-forchanges,substantialadditionalfinancingoughttobemadeavailable to the PSET system. The PSET system receives government funding through two main
1Traditionaluniversitiesofferformativeandprofessionalprogrammesatboththeunder-graduateandpost-graduate levels, universities of technology focus on a narrower range of career and vocational-orientateddiplomasanddegrees,whilecomprehensiveuniversitiesofferacombinationofbothtypesofqualifications.2Thisrequiresagrowth inenrolmentofmorethan60percent foruniversitiesandalmost300percent forTVETcolleges.3In2013,thehighereducationsystemproducedlessthan2,300doctoralgraduates,whereastheNDPtargetrequiresmorethan5,000doctoralgraduateseveryyear.

InvestmentTrendsinPost-schoolEducationandTraininginSouthAfrica
20
20
sources, namely voted funds appropriatedmainly on thebudget of thedepartment and the skillsdevelopmentlevies.PublicHigherEducationInstitutions(HEIs)areallocatedfundsfromthebudgetof the department through an unconditional block grant allocation, based on enrolment planssubmittedbyindividualinstitutionstotheDepartmentandearmarkedgrants,whichisallocatedonthe basis of the strategic priorities of the sector and accessed by individual universities throughsubmittedproposals.Ontheotherhand,publicTVETcollegesandpublicCETcolleges,whichweregoverned,managedandadministeredbyProvincialEducationDepartments (PEDs) in2013/14,areallocated voted funds by PEDson thebasis of national fundingnorms and standards. SinceApril2015, a national function shift took place and TVET Colleges are nowunder the direct policy andfundingmandateoftheDHET.4Skills development levies collected from employers by government in terms of the SkillsDevelopmentAct(RSA,1998)andtheSkillsLeviesAct(RSA,1998)arealsopartofthePSETsystem.These levies are submitted by companies to the South African Revenue Services (SARS). SARSchannelstheleviestotheSectorEducationandTrainingAuthorities(SETAs)andtheNationalSkillsFund(NSF)todevelopskillsneededfortheeconomyandgeneraldevelopment.2.1ImplementationChallengesinthePSETsystemTheNDPandtheWhitePaperforPSETdefinethreeareaswhereuniversitiesarerequiredtoexcel,namely educating and providing high-level skills, producing new knowledge, and providingopportunities for social mobility and strengthening social justice and democracy. Universities arerequired, therefore, to remain at the cutting edge of new knowledge, while at the same timeparticipate actively in redressing the historical imbalances of the past. The Universities of SouthAfrica(2014)reportliststhefollowingkeychallengesintheuniversitysector,namelyrelativelylowgraduation/success rates; a real decline in State funding for the university sector, includinginadequate contributions by the National Student Financial Aid Scheme (NSFAS); a fluid policyenvironmentthatissubjecttoregularpolicychanges;andattemptsatbuildingthenextgenerationofacademics.Otherchallengesintheuniversitysectorthatrequireurgentinterventionareequityattheindividualand institutional levels, fine-tuningthefundingframeworktoavoidperverse incentives (Steynandde Villiers, 2005), boosting the quality of foundational programmes, and the development ofcomprehensiveM&Esystemsforthesectorasawhole(MinisterialCommitteefortheReviewoftheFundingofUniversities,2013).In reflecting on the challenges facing the TVET college sector, the White Paper for PSET drawsattention todeficits inprogrammequality, theprofessional capabilityof staff, theneed tobuildastrongerManagementInformationSystem,weakpartnershipsbetweenTVETcollegesandindustry,the need to restore the links between the colleges and the labourmarket bymaking programmeofferingsmoreresponsive,andimprovingtheplacementofcollegegraduatesinjobs.External commentators have also raised issues about the poor throughput and graduation rates,poorgovernanceandmanagementofcolleges,variable financialmanagementskillsandconfusionaround the branding and place of TVET colleges in the post-school education system (FFC, 2014;Gewer,2010;HRDC,2014;Papieretal,2012;RasoolandMahembe,2014).Themishmashofchallengesdescribedabovearedifficulttocategorisebecauseitisnotalwaysclearwhether implementation challenges can be reduced to funding inadequacies or a combination of4 The legislation that details the function shift for technical and vocational education from the provincialeducationdepartmentstotheDHETistheCommunityEducationandTrainingCollegesAct,2013(ActNo.1of2013). The legislative responsibility for the adult education and training sectorwas transferred through theHigherEducationandTrainingAmendmentLawsAct(ActNo.25of2010).

InvestmentTrendsinPost-schoolEducationandTraininginSouthAfrica
21
21
fundingandadministrativechallenges.However,itisclearthatinordertofindrelieftosomeofthechallenges,additionalfinancingforkeyelementsofthePSETsystemisnecessary.ItisalsoimportanttobearinmindthatfinancingincreasestouniversitiesandTVETcollegesarenotonthesamescaleand that a comparatively small change to the financing of universities will have more seriousimplementation andoutput repercussions than similar levels of increases to funding for the TVETcollegesector.2.2 Response by DHET: The Appointment of Ministerial Review Committees and TaskTeamsThedepartmenthasrespondedtimeouslytotheimplementationchallenges inthePSETsystembyestablishing reviewcommittees that looked into variousaspectsof financing in theuniversity andcollegesectorsaswellasaMinisterialTaskTeam,whichexaminedthefutureshapeofCommunityEducationandTraininginstitutions.Table1providesasynopsisoftheTermsofReference(TOR)fortwooftheuniversityreviewcommittees.Table1:AbbreviatedTermsofReferencefortheMinisterialReviewCommitteesappointedbytheDHETMinisterial Committee on National StudentFinancialAidScheme(NSFAS,2009)
Ministerial Committee on Review of theFundingofUniversities(2013)
Assessing strengths and weaknesses of thecurrentscheme
Analysethecurrentfundingframework
Perform a needs analysis of studentswhowillreceivefinancialaidintheshort-,medium-,andlong-term
Determineifthefundingframeworkiseffectivein achieving goals, especially transformation-orientedsteeringgoals
Investigating the feasibilityof student financialaid being linked to priority field of study andlevelsofacademicperformance
Recommend changes to the fundingframework,ifany
Undertake a review of the means test andprovideguidelinestodeterminethecriteriafortheeligibilityofstudents
Perform an in-depth analysis of the human,physicalandfinancialresourcesavailabletotheuniversitysector
Recommend changes to the policy, regulationandoperationalframeworkofNSFAS
Some of the key findings from the Ministerial Committee that reviewed the functioning andoperationsofNSFASaresetoutbelow:
• Although NSFAS broadened access of poor students to university and college education,unequal institutionalallocations (atuniversities)andthe insertionofacostofstudy factordisproportionatelydisadvantagesneedystudentsathistoricallydisadvantagedinstitutions;
• Becauseof the inadequacyof financialaid to students, thesestudentsoftendropoutandperform poorly, thus leaving them with personal debt and without the requisitequalifications,thusperpetuatingthecyclethatstudentfinancialaidwassupposedtobreak;
• In order to accommodate the ‘missing middle’, the committee recommended that theeligibilitythresholdofR122000perannumberevisedupwardsandthatthesocio-economicclassofthestudentreplaceraceasaproxyforfinancialneed;
• FurthertotherecommendationaboveisaproposalthatstudentswhofallabovetheNSFASthresholdandbelowR300000shouldbegrantedincomecontingentloansandthatfundingshouldbesourcedfromthePublicInvestmentCorporation(PIC);and
• Thatfullsubsidisationofpoorstudentstakesplaceandthattheremainingneedystudentshaveaccesstoincome-contingentloans.

InvestmentTrendsinPost-schoolEducationandTraininginSouthAfrica
22
22
The Ministerial Review Committee that examined university funding produced a number ofrecommendationsandthefollowingrecommendationswereofinterest:
• The Ministerial Committee on the Review of University Funding recommended that thefunding framework be retained (with block and earmarked grants) but that some of theallocationmethodsbechanged;
• The Committee recommended the introduction of a grant for historically disadvantagedinstitutions(HDIs)inrecognitionofthedevelopmentchallengesintheseinstitutions;
• The Committee also recommended more careful corrective actions in instances whereenrolmentdeviationstakeplace;
• A shift in the funding of research with greater emphasis on the quality of the researchoutput;
• Newmodelsforextendedorfoundationalprogrammes;and• Thephasing-outofthemulti-campusgrant.
Both Ministerial Committees came to the conclusion that in order to implement some of therecommendations,substantialpositiveshiftsinfundingforthehighereducationsectorarerequired.Furthermore,althoughthefundingrecommendationsaredirectandstrong,thereisanacceptancethat fundingchangescannothappenovernightandthataprogressiverealisationmodelshouldbeusedtophase-inthekeyrecommendations.Thisrequiresarationalunderlyingimplementationplanthat would guide the actions of the DHET and other stakeholders. An important part of thisimplementationplanisthedevelopmentofacomprehensiveM&Esystemthatwoulddelivertimelyandrelevant‘intelligence’toDHETtoguideitsallocationdecisions.Table2providesprogressontheimplementation of the key recommendations that were made by the two Ministerial ReviewCommittees.Table 2: Progress in the implementation of recommendations made by the Ministerial ReviewCommitteesonNSFASandUniversityFundingMinisterialReviewCommitteeonNSFAS Ministerial Review Committee on University
FundingNSFAS suspended illegal debt recovery andinstituted new processes aligned to theNationalCreditAct
Reference Group appointed as well as TechnicalTask Team to model impact of all therecommendations
SubstantialadditionalresourceswerefoundforNSFASanddistributedtouniversitiesandTVETColleges
Adoption and implementation of a grant forHistoricallyDisadvantagedInstitutions(HDIs)
Student-centred financingmodel adopted in aselectnumberofuniversitiesandTVETcolleges
Adoption and implementation of acceptablevariation in enrolment targets to minimisefinancialriskstotheState
Progressive financing of poor students viaconversionofloansintobursaries(between40per cent and 100 per cent conversion ratedependingonyearofstudyandtimeframeforcompletingstudies)
Adoption of a revised Foundation provisioningfundinggrid
Successfullaunchofthecentralisedapplicationsystem in 5 universities and 6 TVET Collegesduringphase1
The multi-campus grant was terminated in2015/16
NSFAShasputintoplacearangeofpoliciestoimprove functioning and operation (forexample, risk management and loan recoveryplans,performancemanagementsystemetc.)
AdraftPolicyandRevisedFundingFrameworkhasbeen approved in March 2016 but has not yetbeenpublishedforcomment.Theseproposalsaregoing through a process of consultation withCabinet.
NSFAS has put into place highly effective

InvestmentTrendsinPost-schoolEducationandTraininginSouthAfrica
23
23
reporting mechanisms between institutionsand NSFAS to counter under-utilisation offundsSources DHET, 2015: Briefing by Reference Group and Technical Team on University Funding toPortfolioCommitteeonHigherEducationandTrainingandMinisterialReviewofNSFAS,2010The outcomes of the two ministerial reviews provide strong evidence of the ability of DHET torespond appropriately to financing and implementation challenges. Poorer students are betterserved by the expeditious implementation of the recommendations and institutions in the PSETsystem are likely to benefit greatly from attempts to deliver a stable and consistent fundingframeworkforthesector.Inthecontextoflimitedresourcesandtheneedtojustifylargeadditionalexpenditures,thecarefulpilotingofnewmodels(forexamplestudent-centredfinancingmodel)willultimately improvetheoverallefficiencywithwhichstudentsand institutionsareassistedtocarryoutthecorebusinessofPSETinstitutions.
In 2014, the Minister of Higher Education established aMinisterial Committee to Review theFundingFrameworksforFurtherEducationandTrainingCollegesandAdultLearningCentres.Thepurpose(mandate)ofthecommitteeincludesthefollowing:
• Proceedwith the review process of the current funding framework for Further Educationand Training (FET) Colleges, to assess its relevance and effectiveness in enabling TVETCollegestoplayakeyroleinproducingaskilledandcapableworkforceforthecountry;
• AligntheNationalNormsandStandardsforFundingAdultLearningCentrestotheproposednew institutional type for Post-school Education and Training (PSET) i.e. CommunityEducationandTrainingColleges(CETColleges).
TheReviewCommitteecommenceditsworkingactivitiesinMarch2015andisstillintheprocessofcollectingmuch-neededdataandundertakingwide-rangingconsultations.
With regards to the implementation challenges in the TVET college sector, theMinister ofHigherEducationandTraining,DrBladeNzimande,hadalsoinstitutedaTurnaroundStrategyfortheTVETsector. The strategy is based on six principles and address governance, performance andaccountabilityissues.Thesixprinciplesare
1. Managing change, with reference to the function shift of TVET colleges from a provincialresponsibilitytobeinganationalresponsibility;
2. Differentiate TVET colleges as individual institutions, which explicitly recognise the differenthistoriesandfactorsimpingingontheperformanceofthesecolleges;
3. ChangeperceptionsofTVETcollegessothattheybecomeadesirablebrand;4. Focus on student performance and success in line with the mission to make colleges more
attractiveandimprovetheefficiencywithwhichscarcegovernmentresourcesarespent;5. Astrategy-ledapproach,whichrequiresactiveco-ordinationfromtheDHET;and6. Focus on performance accountability-this is achieved through the development of Council
Chartersandenablingperformancecontractswiththeprinciplesoftheseinstitutions.
Textbox 1 provides information on some of the immediate successes of the FET TurnaroundStrategy.

InvestmentTrendsinPost-schoolEducationandTraininginSouthAfrica
24
24
Textbox1:ResultsfromtheFETTurnaroundStrategy
Whiletheturnaroundstrategyisclearlybearingfruit,muchmoreneedstobedonetosafeguardthefinancialfutureoftheTVETCollegesector.Asthenextsectionshows,TVETcolleges,apartfromtheinitial spurt in funding in2009,havenothad favourable financing, thusputting at risk theoverallexpansiongoalsofthePSETsystem.IntheCommunityeducationandtrainingsector,ontheauthorityoftheDirector-GeneralinDHET,aMinisterial Task Team was appointed in 2011 to ‘investigate and recommend an alternative andmoreeffectiveinstitutionalformforaddressingtheeducationandtrainingneedsofadultsandout-of-schoolyouth.’5Someofthemorespecifictermsofreferenceincludedthefollowing:
• ConceptualiseaworkableinstitutionalmodelforCommunityEducationandTrainingCentres(CETC)thatisdistinctandunique;
• MakerecommendationsonrelevantprogrammeofferingsbyCETCs;and• InvestigateandproposeappropriatefundingmodalitiesforCETCs.
The focushere is on twoof the recommendations thatweremadeby theMinisterial Task Team,namelytheproposaltosetupCETCsandtheneedforadepartmentaltaskteamtoconsidertheroll-out and implementation of the key recommendations in the final report of the Task Team. NineCETCswereestablished(oneineachprovince)andpresentlyserveasmanagementandgovernancehubs for the previous adult learning centres. These nine CETCs are also used as pilot sites andrelevantlearningwillbeusedtoexpandCETCstoeacheducationaldistrict.TheestablishmentofthenineCETCswasfollowedbytheintroductionofaNationalPolicyonCommunityCollegesinJuly2015in termsof theContinuing EducationandTrainingAct, 2006 (ActNo. 16of 2006). The fundingofCETCswillbedoneinaccordancewithapre-determinedfundingnormsandstandardsframeworkaspersection23oftheContinuingEducationandTrainingAct,2006.6The secondkey recommendationmadeby theMinisterial TaskTeam required theDGofDHET toestablisha task teamtoconsider the roll-outand implementationof thekey recommendations inthetaskteam’sreport.Thisteamisinplaceandisintheprocessofcompletingitswork.TheworkofthisteamiscomplementedbytheworkofanothertaskteamthatisconsideringvariouspoliciesandfundingmodalitiesoftheCommunityEducationandTrainingsectorinitsentirety.Theworkofbothtaskteamswill informthenewnationalplan for thePSETsystem,whichwillbecomethedefactooperationalplanfortheWhitePaperforPSET.
5TakendirectlyfromaninternalDHETdocument:TermsofReference-MinisterialTaskTeamtoConceptualisetheDevelopmentandImplementationofCommunityEducationandTrainingCentres(CECT)6Section23oftheContinuingEducationandTrainingAct,2006(ActNo.16of2006)simplyreads‘SubjecttotheConstitutionand thisAct, theMinistermust, after consultationwith theMinisterof Finance,determineminimumnormsandstandardsforthefundingofpubliccolleges.’
1. SubstantialadditionalfundingfromtheNationalSkillsFund(NSF)tothetuneofR2.5
billiontosupportcapacitydevelopmentofTVET.
2. FurtherfundingworthR2.5billionfortherefurbishmentandconstructionofnewTVET
campuses.
3. Asignificantuptickinheadcountenrolmentfrom427435in2011to657690in2012.
4. To improve financialmanagement, the appointment of 40 chartered accountants as
InterimChiefFinancialOfficers.
5. Afour-foldincreaseinNSFASfundingtostudentsatTVETColleges.

InvestmentTrendsinPost-schoolEducationandTraininginSouthAfrica
25
25
3. UNDERSTANDING THE FINANCING OF THE PSET SYSTEM:PRIORITISATIONANDCONSTRAINTS,2010/11TO2017/183.1BackgroundtotheFinancingofthePSETsystemInthe2013BudgetReview,theNationalTreasurypresentedsummaryresultsofitslong-termfiscalreport, which projected expenditure over a 15-25 year horizon based on assumptions aboutpopulationandeconomicgrowthaswellaschangesinthepolicyagendaofthecountry.TheBudgetReview indicatedthat if theeconomywere togrowbymore than5percentannuallygovernment revenue could be expected to double in the next 20 years. This would make majorpolicyinitiativessuchastheNationalHealthInsurance(NHI)andtherapidexpansionofvocationaleducationaffordable. However, the samereport cautioned that ifeconomicgrowthstayedon itspast trajectory of around3.5 per cent annually, then significant adjustments to the revenuebase(increase in taxes) and/or decreases in other areas of spending will be required to sustainablymeeting the health and post-school education commitments.7 In this report, a ‘no policy change’scenarioinpost-schooleducationassumesasteadyrateofgrowthinenrolments,whereasa‘policychange’scenarioassumesthattheStatehasbegunimplementingtherapidlyincreasing(enrolment)growthprovisionsintheWhitePaperforthePSETsystem.
Giventhefactthattheeconomyhasnotevenperformedattheassumedbaselinegrowthrateof3.5percent,howhavethesedevelopmentsaffectedexpenditureonthePSETsystem?Table3providesinformation on the real average annual growth rate8 of the PSET budget between 2010/11 and2018/19.
7 Post school education commitmentsweremodelled as (number of university students) (average cost peruniversitystudent)+(numberofvocationalstudents)(averagecostpervocationalstudent)-(directcharges)+other expenditures. The information is sourced from a presentation by Micheal Sachs from the NationalTreasuryinJune2014.8Inflation-adjustedspendingestimateswerederivedusingthehistoricalConsumerPriceInflation(CPI)seriespublishedbyStatisticsSouthAfricaandthefiscal-yearinflationprojectionsinBudgetReview2016.

Table3:RealannualaveragegrowthrateofexpenditureonPSET,2010/11to2018/19(2015/16=100)
Rmillion 2010/11 2011/12 2012/13 2013/14 2014/15 2015/16 2016/17 2017/18 2018/19
Realann.av.2015/16to2018/19(%)
Realann.av.2010/11to2018/19(%)
Administration 114 223 229 267 234 366 374 399 427 -.9 15.1Planning,PolicyandStrategy 26 42 47 48 46 58 72 76 82 5.8 10.6UniversityEducation 19,538 23,428 26,250 28,304 30,484 32,892 39,532 41,944 44,320 4.2 4.8TVET 3,943 6,210 5,228 5,879 6,305 6,843 6,917 7,414 7,866 -1.4 4.5SkillsDevelopment 131 122 119 123 132 207 225 245 261 1.6 4.2CommunityEducationandTraining 1,648 1,777 1,853 1,564 2,070 2,237 2,380 8.8 -Subtotal 23,752 30,025 33,521 36,398 39,054 41,930 49,188 52,316 55,335 3.4 5.2Sectoreducationandtrainingauthorities 6,704 8,021 9,356 9,674 11,071 12,641 14,112 15,750 17,646 5.2 6.7NationalSkillsFund 1,675 2,004 2,339 2,416 2,768 3,159 3,527 3,937 4,411 5.2 6.7Subtotal 8,379 10,025 11,695 12,090 13,839 15,800 17,640 19,687 22,057 5.2 6.7
Totalexpenditureestimates 32,132 40,050 45,216 48,488 52,893 57,730 66,828 72,003 77,392 3.8 5.6Source:EstimatesofNationalExpenditure(hereafter,ENE)2014,2015and2016Note:ThenumbersinthetablereflectnominalbudgetnumbersastheyappearinthevariousNationalTreasurydocuments.Inflationistakenintoaccountinthepercentagechangescalculatedinthetwofinalcolumns.Thisisapplicabletoallsimilartablesinthispublication.
26
InvestmentTrendsinPostschoolEducationandTraininginSouthAfrica

Thisallocationrepresentsresourcesthatareappropriatedonthebudgetofthenationaldepartmentofhighereducationandtraining.Itexcludesprovincialownspendingandotherspendingthattakesplace through other national departments or sub-national levels of government. Funding for thePSET system that is appropriated from thebudgetof thedepartment is projected to grow in realtermsby3percentonaverageoverthepresentMTEF,whileastrongpositiverealgrowthrateof5per cent on average has been sustained since 2010/11. Expenditure on transfers and earmarkedfundstotheuniversitysectorisprojectedtogrowby4percentonaverageoverthepresentMTEF,whileexpenditureon theTVETcolleges isprojected todecline in real termsby1percent, largelydue to theadditional expenditure space created in theuniversitybudgets in thepresent financialyear. Over theeight-yearperiod representedabove,national spendingonTVETcollegesgrewonaverageby4per cent, reflecting inpart, the initial large transfers (injection into student financialaid)thathappenedintheperiodafter2010/11.If theexpandeddefinitionofPSET(inclusiveoffundingfromtheNationalSkillsFundandSETAs) isconsidered,thenexpenditureonthisfunctionisprojectedtogrowby4percentonaverageinrealtermsover thepresentMTEF. While it isnotpossible to judge theadequacyof theexpenditureinvestmentsintheabsenceofaconsiderationofservicedeliveryburdens(studentenrolmentsandoutputtargets),attheaggregatelevelatleast,thereisongoingpositiveintentinspendingadditionalresourcesontheprovisioningofpost-schooleducationandtraining.
27
InvestmentTrendsinPostschoolEducationandTraininginSouthAfrica

InvestmentTrendsinPost-schoolEducationandTraininginSouthAfrica
28
28
To get a better sense of the overall prioritisation of the PSET system funded through nationalallocations, Figure 1 provides information about the real rate of growth in the national PSETexpenditureandnationalnon-interestexpenditure.Figure 1: The real annual rate of growth in expenditure on PSET and non-interest expenditure(excludingdebtcosts)9,2010/11to2018/19(2015/16=100)
Source:ENE2016andBudgetReview2016Figure1indicatesthatBudget2016makesastrongpositiveadjustmentforexpenditureonPSETinthe first yearof thenewMTEF (10per cent real growth), but thereafter, national expenditureonPSET (by thedepartment) isprojected togrowatamuchslower ratecompared to thegrowthonnon-interestexpenditure.However,evennationalnon-interestexpenditureisprojectedtogrowatarelativelylowrealrate,thusimplyingthatoncetheadditionalresourceshavebeenmadeavailableto the PSET system, greater effort should be made in improving the efficiency of these initialadditional allocations. The pattern depicted in the figure above reflects, in part, the uncertaintyaboutwhetherno-feeincreaseswillalsoberequiredintheouteryearsofthepresentMTEF.OverthepresentMTEF,thereisaclearindicationthatadditionalmoniesaredestinedforthePSETsystem,butsuchincreasesarenotsustainedovertheensuingMTEF.EarlierinvestmentsinthePSETsystemareirregularanditwouldappear(atleastforthisperiodrepresentedinFigure1above)thatthefundinginthepost-schoolingeducationandtrainingsystemischaracterisedbystrongtransfersatthebaseofafundingperiodandsubsequentlyfollowedbyprolongedperiodsofslowornorealgrowth.Figure 2 provides information on the share of (national) PSET expenditure of the country’s GrossDomestic Product (GDP) andnational non-interest expenditure. This continues theprobe into thelevelsoffundingprioritisationthatthePSETsystemcommands.
9Non-interestexpenditureonthemainbudgetexcludesprovisionfordebtrepayment,butdoes includetheunallocatedcontingencyreservefor2016/17to2018/19.
4,22,2 2,0 1,8
4,3
-1,8
1,3 0,9
19,7
5,8
2,61,6 1,9
10,0
0,1 -0,1
-5,0
0,0
5,0
10,0
15,0
20,0
25,0
2011/12 2012/13 2013/14 2014/15 2015/16 2016/17 2017/18 2018/19
Realann
ualchange(%
)
Non-interestexpenditure PSET

InvestmentTrendsinPost-schoolEducationandTraininginSouthAfrica
29
29
Figure 2: PSET as a percentage of the Gross Domestic Product (GDP) and national non-interestexpenditure,2010/11to2018/19
Source:ENE2016andBudgetReview2016Figure2 shows thatover theperiod2010/11 to theendof thepresentMTEF (2018/19), nationalPSETexpenditureissteadyataround1percentofGDP,whileitsshareofnon-interestexpenditurehas grown steadily from 3.2 per cent in 2010/11 to slightly more than 4 per cent in 2018/19.Comparatively,thePSET/GDPratioisfairlylowwhencomparedtodevelopedOECDcountries,whichspentcollectivelyapproximately1.6percentoftheirGDPonthePSETsystem.Howwell doesoverall spendingonPSET (including spendingdonebyprovincial governments andother entities) compare to key other government functions? Table 4 provides information on therealgrowthinconsolidatedgovernmentexpenditureoverthepresentMTEF.
0,9% 1,0% 1,0% 1,0% 1,0% 1,0% 1,1% 1,1% 1,1%
3,2%
3,7% 3,8% 3,8% 3,8% 3,7%
4,2% 4,2% 4,1%
0,0%
0,5%
1,0%
1,5%
2,0%
2,5%
3,0%
3,5%
4,0%
4,5%
2010/11 2011/12 2012/13 2013/14 2014/15 2015/16 2016/17 2017/18 2018/19
Alloca`o
nsonPSETasa
5ofG
DPand
non
-interestexpen
diture(%
)
PSETasa%ofGDP PSETasa%ofnon-interestexpenditure

InvestmentTrendsinPost-schoolEducationandTraininginSouthAfrica
30
30
Table4:Realgrowthinconsolidatedgovernmentexpenditure10foraselectnumberoffunctions,2015/16to2018/19(2015/16=100)
Rmillion 2015/16 2016/17 2017/18 2018/19
Realchangebetween2015/16and2016/17(%)
RealaverageannualchangeoverMTEF(%)
Basiceducation 213,676 228,803 245,414 264,969 0.45 1.13Health 159,377 168,393 183,629 198,556 -0.88 1.30PSET 64,158 68,715 74,715 80,493 0.47 1.53Socialprotection 154,353 167,479 180,634 194,945 1.79 1.75Non-interestexpenditure 1,251,815 1,309,571 1,400,135 1,501,671 -1.86 0.03Source:BudgetReview2016Table 4 shows that in the present financial year (2016/17), expenditure on PSET, together withexpenditureonsocialprotectionandbasiceducation, isprojected togrowpositively in real termsandoutstrippingprovisions forconsolidatednon-interestexpenditure.This is furtherproof thatatanaggregatelevel,thepost-schoolingsectorisenjoyingsomeformoffundingprioritisation,inspiteofthenegativeoverallspendingenvironment.However,therealratesofgrowthforexpenditureonthePSETsystemaremoderate,reflectinginpart,themuchslowerrateofgrowthonPSETspendingforthetwoouteryearsofthepresentMTEF.3.2FinancingofthreePSETsub-sectors:universities,TVETandCETcollegesFigure3providesinformationaboutaggregatelevelsofspendingandincomeatpublicuniversitiesinSouthAfricabetween2009and2014.Figure3:Totalincomeandexpenditureonpublicuniversities,2009to2014(Rbillion)
Sources:CentreforHigherEducationTransformation(CHET),2016andDHET,2015
10 Consolidated government expenditure includes spending by the national departments, sub-nationalspending(inclusiveofnationaltransfersandsub-nationalownresources),whichexplainsthelargerbudgetedamountsforpostschooleducationandtrainingcomparedtowhatisappropriatedonthevoteoftheDHET.
36,740,9
44,4
49,952,6
57,0
33,237,1
40,2
45,849,2
52,8
0,0
10,0
20,0
30,0
40,0
50,0
60,0
2009 2010 2011 2012 2013 2014
Rand
sinbillion
s
Income Expenditure

InvestmentTrendsinPost-schoolEducationandTraininginSouthAfrica
31
31
MostnotablefromFigure3aboveisthatuniversities,onaverage,experiencedsurplusesforalltheyears represented in the graph above. For the period represented above, aggregate universityincome grewby 9.2 per cent on average,while aggregate university expenditure grewby 9.8 percentoverthesameperiod.Whileitisinstructive(andsurprising)toobserveasituationoffinancingsurplusesforuniversities,overthelastfewyears,expenditurepressuresaregrowingandwillmaketheprovisionofqualityandaffordableeducationdifficult.Figure4providesinformationonthevarioussourcesofincomeforpublicuniversitiesfortheperiod2009to2013.Figure4:Mainsourcesofincomeforpublicuniversities,2009to2013(%)
Source:CentreforHigherEducationTransformation(CHET),2016Figure 4 demonstrates a trend of rising student fees as a percentage of university incomewith aconcomitant reduction in the contribution of government to the financing of universities. Thepositive surpluses observed in the previous graph could be attributed, in part, to a rising pool ofstudent fees.Aggregateprivate incomeseesasteadydeclineover thesameperiod.However, theaggregate picture, would likely differ among institutions, because public universities havedifferentialcapacitiestoleverageadditionalprivateincome.Whileapurefinancialanalysis isuseful intermsofunderstandingpolicyandexpenditure intent,amore meaningful picture of the adequacy of the funding to the sector can only be achieved byexaminingfinancinginthecontextofservicedeliveryburdens.Figure5examinesenrolmenttrendsintheuniversitysectorovertheperiod2000to2013.
39%41% 42%
40% 40%
29% 30% 31% 31%33%
31% 30%27%
29%27%
0%
5%
10%
15%
20%
25%
30%
35%
40%
45%
2009 2010 2011 2012 2013
Sourceso
fincom
e(%
)
Government Studentfees Privateincome
InvestmentTrendsinPost-schoolEducationandTraininginSouthAfrica
32
32
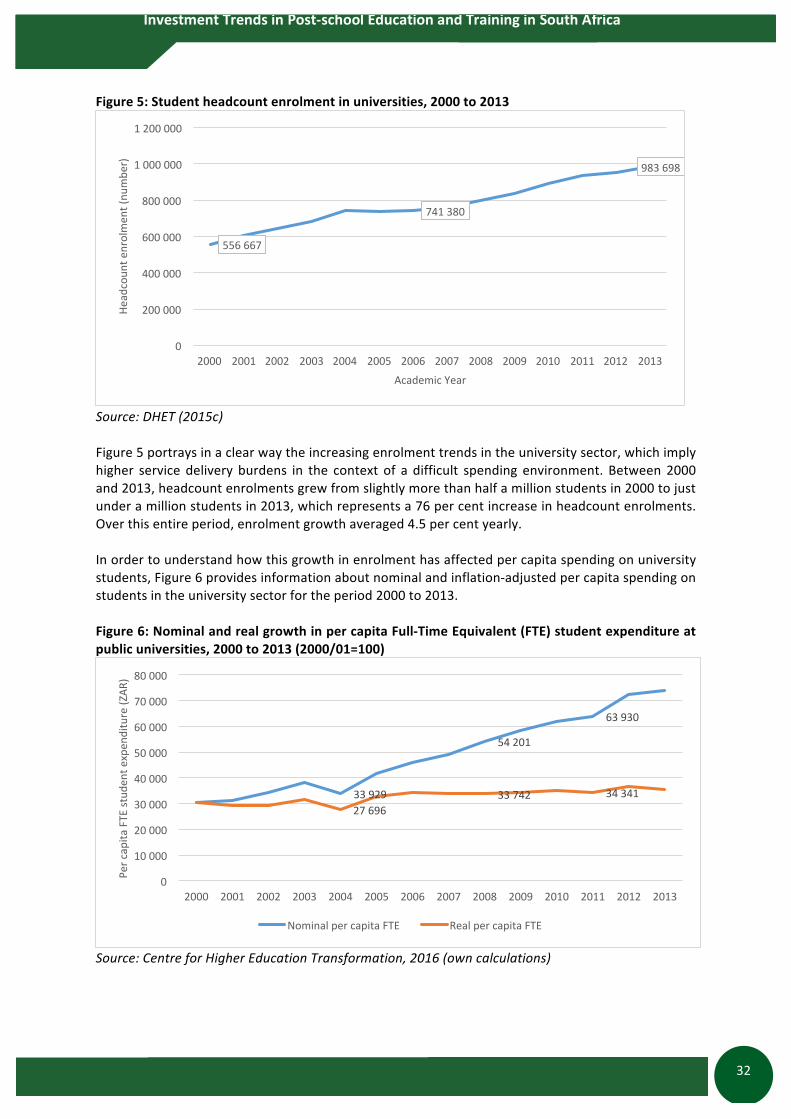
Figure5:Studentheadcountenrolmentinuniversities,2000to2013
Source:DHET(2015c)Figure5portraysinaclearwaytheincreasingenrolmenttrendsintheuniversitysector,whichimplyhigher service delivery burdens in the context of a difficult spending environment. Between 2000and2013,headcountenrolmentsgrewfromslightlymorethanhalfamillionstudentsin2000tojustunderamillionstudentsin2013,whichrepresentsa76percentincreaseinheadcountenrolments.Overthisentireperiod,enrolmentgrowthaveraged4.5percentyearly.Inordertounderstandhowthisgrowthinenrolmenthasaffectedpercapitaspendingonuniversitystudents,Figure6providesinformationaboutnominalandinflation-adjustedpercapitaspendingonstudentsintheuniversitysectorfortheperiod2000to2013.Figure6:NominalandrealgrowthinpercapitaFull-TimeEquivalent(FTE)studentexpenditureatpublicuniversities,2000to2013(2000/01=100)
Source:CentreforHigherEducationTransformation,2016(owncalculations)
556667
741380
983698
0
200000
400000
600000
800000
1000000
1200000
2000 2001 2002 2003 2004 2005 2006 2007 2008 2009 2010 2011 2012 2013
Headcoun
tenrolmen
t(nu
mbe
r)
AcademicYear
33929
54201
63930
2769633742 34341
0
10000
20000
30000
40000
50000
60000
70000
80000
2000 2001 2002 2003 2004 2005 2006 2007 2008 2009 2010 2011 2012 2013
Percapita
FTEstud
ente
xpen
diture(ZAR
)
NominalpercapitaFTE RealpercapitaFTE

InvestmentTrendsinPost-schoolEducationandTraininginSouthAfrica
33
33
A funnelpattern inthegraphabove indicatesrising inflationanddemonstrates inavisualmannerhow inflation is eroding the purchasing power of budgetary allocations. This trend is particularlyclearafter2004wherea rising inflationaryenvironmentwillhavecombinedwithgrowingstudentnumbers, thus delivering heavy spending and financing burdens on the university sector. Theincreasingdivergencebetweennominalandrealspendingmeansthatuniversitysectorspendinghasnot kept pacewith the rising costs and consequently, universities had to perform the same (andmore) functions with substantially less. While it has been shown earlier that there is a positivespendingintentinthesector,externalfactors(suchastherateofinflation)andastronggrowthinenrolmentnumberswouldhaveseriouslychallengedsuchgains.To give further context to these results, Figure 7 provides the nominal and inflation-adjusted percapita spendingonuniversity students,using the largestexpenditurecomponent (blockgrants)asthereferencecategory.Figure7:Nominal and real per capita FTE spendingon theuniversityunconditionalblock grant,2004/05to2014/15(2004/05=100)
Source:DHET(2015c)Therealdeclineinpercapitaspendingisdrivenstronglybythedeclineinvalueoftheunconditionalblockgrantexpressedhereinpercapitaterms.Relativetowhattheblockgrantwasabletobuyin2004/05,itissoberingtorealisethatitsvaluein2014/15islessthanwhatcouldbeboughtwiththegrantatthestartofthefinancingperiodinFigure7above.Thisisfurtherevidenceoftheimmensepressure that the university sector is under and how little fiscal space, if any, exists to achievenationalgoals.Figure8provides informationontherealannualgrowthratesonprogrammeexpenditure inTVETcollegesovertheperiod2010/11to2018/19.
16950
2000121450
24222
2747529252
18868 17874 16938 17487 16716
0
5000
10000
15000
20000
25000
30000
35000
2044/05 2005/06 2006/07 2007/08 2008/09 2009/10 2010/11 2011/12 2012/13 2013/14 2014/15
Percapita
FTE(ZAR
)
NominalpercapitaFTE RealpercapitaFTE

InvestmentTrendsinPost-schoolEducationandTraininginSouthAfrica
34
34
Figure8:RealannualrateofgrowthofprogrammeallocationsintheTVETCollegesector,2010/11to2018/19(2015/16=100)
Source:DHETInternalDatabaseforTVETColleges,2016TheperiodthatfollowedtheestablishmentoftheDHETwasparticularlygoodfortheTVETcollegesectorasrelatively largepositiverealannual increaseswereavailableforprogrammefunding.Theincreases in funding available through the National Student Aid Financial Scheme (NSFAS) havehelpedtoboosttheoverallresourcesavailabletothesector.Thisestablishedastrongnewbasetogive expression to the policy goal of increasing the size of this critical post-schooling sector.However, following these substantial investments,much of the actual and proposed expenditureafter2013canberegardedasmaintenanceexpenditure.Thisslow-downinexpenditurereflects,inpart,thefactthatthebudgetstransferredfromprovincialeducationdepartmentstotheDHET,hasnotbeenallowedtoexpandatappropriaterates.Combinedwithfurtherexpenditurepressuresontheuniversitysector,theoverallfinancingpictureforthissectorwillneedtoimprove.TheNDPstipulatesthattheTVETcollegesectorshouldenrol2.5millionstudentsby2030.Basedonthe current enrolment of approximately 710 000 students, it is envisaged that the system shouldexpandbyatleast7.1percentannuallyuntil2029/30toreachthistarget.TheDHEThascalculatedwhatisrequiredinordertosecurethislevelofinvestmentandconcludedthat thepresent levelof investment inTVETcollegeeducationwill lead to largebudget shortfalls,whichissustainedovertheentireMTEFperiod.Table5providesinformationabouttheprojectedbudgetshortfallsinTVETcollegebudgetsoverthepresentMTEF.
8,9
4,9
6,7
0,9 0,60,1
-0,4 -0,1
-2,0
0,0
2,0
4,0
6,0
8,0
10,0
2010/11 2011/12 2012/13 2013/14 2014/15 2015/16 2016/17 2017/18 2018/19
Realann
ualgrowthra
te(%
)
FinancialYears
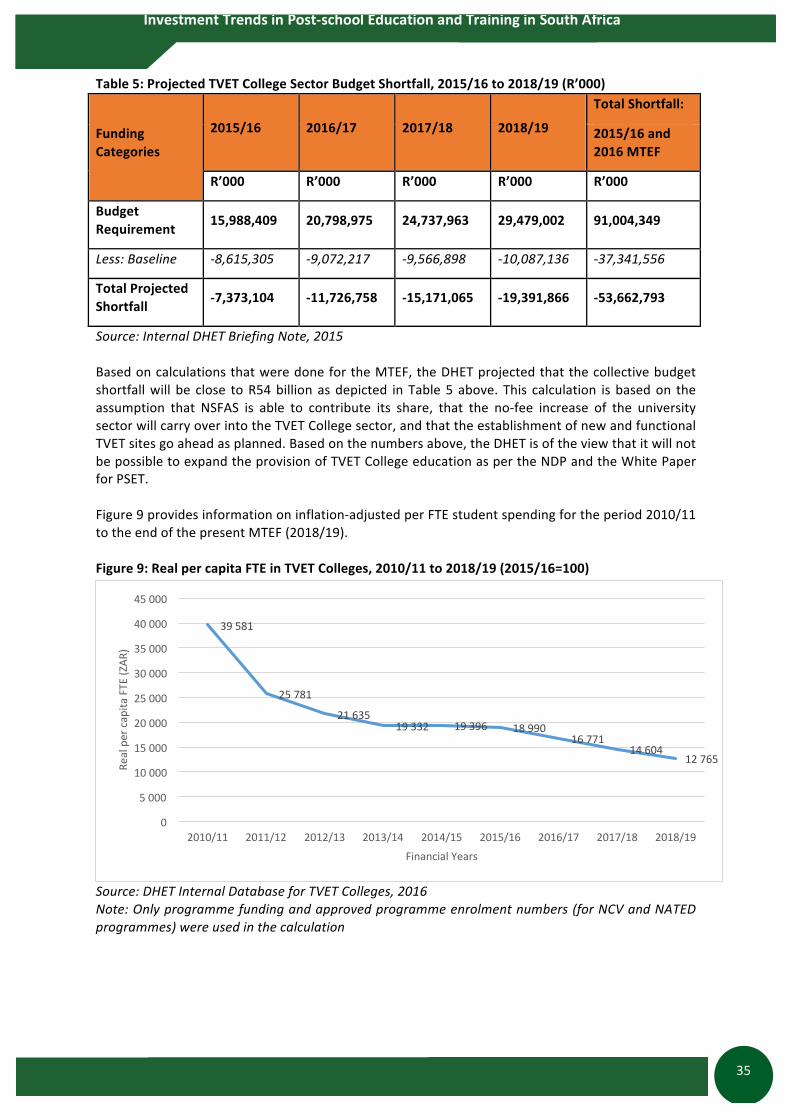
InvestmentTrendsinPost-schoolEducationandTraininginSouthAfrica
35
35
Table5:ProjectedTVETCollegeSectorBudgetShortfall,2015/16to2018/19(R’000)
Source:InternalDHETBriefingNote,2015BasedoncalculationsthatweredonefortheMTEF,theDHETprojectedthatthecollectivebudgetshortfallwill be close toR54billionasdepicted inTable5above. This calculation isbasedon theassumption that NSFAS is able to contribute its share, that the no-fee increase of the universitysectorwillcarryoverintotheTVETCollegesector,andthattheestablishmentofnewandfunctionalTVETsitesgoaheadasplanned.Basedonthenumbersabove,theDHETisoftheviewthatitwillnotbepossibletoexpandtheprovisionofTVETCollegeeducationaspertheNDPandtheWhitePaperforPSET.Figure9providesinformationoninflation-adjustedperFTEstudentspendingfortheperiod2010/11totheendofthepresentMTEF(2018/19).Figure9:RealpercapitaFTEinTVETColleges,2010/11to2018/19(2015/16=100)
Source:DHETInternalDatabaseforTVETColleges,2016Note:Onlyprogrammefundingandapprovedprogrammeenrolmentnumbers(forNCVandNATEDprogrammes)wereusedinthecalculation
FundingCategories
2015/16 2016/17 2017/18 2018/19
TotalShortfall:
2015/16and2016MTEF
R’000 R’000 R’000 R’000 R’000
BudgetRequirement 15,988,409 20,798,975 24,737,963 29,479,002 91,004,349
Less:Baseline -8,615,305 -9,072,217 -9,566,898 -10,087,136 -37,341,556
TotalProjectedShortfall -7,373,104 -11,726,758 -15,171,065 -19,391,866 -53,662,793
39581
25781
2163519332 19396 18990
1677114604
12765
0
5000
10000
15000
20000
25000
30000
35000
40000
45000
2010/11 2011/12 2012/13 2013/14 2014/15 2015/16 2016/17 2017/18 2018/19
Realpercapita
FTE(ZAR
)
FinancialYears

InvestmentTrendsinPost-schoolEducationandTraininginSouthAfrica
36
36
Figure9portraysaworryingpictureofthestateoffundingintheTVETcollegesector.Quiteclearly,in the immediate period after 2009 when the DHET came into being, there is incontrovertibleevidencethatthissectorenjoyedbothpolicyandspendingattention.However,thereisadecliningrealmonetarytrendbecauseofobviouseffortstoincreaseenrolmentatthecolleges,butwithoutaconcomitantmatchingincreaseinspending.Figure10provides informationabout therelativecontributionofcompensationofemployeesanddirect transfers toTVETCollegesasapercentageof total spendingonprogrammefunding for thepresentMTEF(2015/16to2018/19).Figure10:Thecontributionof spendingon staffanddirect transferson theprogramme fundingbudgetofTVETColleges,2015/16to2018/19(%)
Source:DHETInternalDatabaseforTVETColleges,2016Figure 10 shows that the compensation of employees consumes roughly 80 per cent of allprogrammefundinginthepresentMTEF,whilespendingontransfersisprojectedtoconsumelessthanone-fifthofprogrammefundingoverthesameperiod.IntermsofspendingbytheDHET,thereisnospaceforadditionalinvestmentsoncapitalandinfrastructurespending.Inaperiodofplannedexpansion,thiswillputthebrakesonTVETCollegeeducationstayingrelevantbecausesuchalargepartofeffectiveTVETCollegeeducationisrelatedtotheexistenceofequipmentandinfrastructurecriticalforlearning.While theuniversity sector is undoubtedly in a slightlybetterplace thanTVET colleges, allocationdeficitsremainaproblemacrossthesetwoPSETsectors.Thecostofexpandingthissectorisprovingmuchhigherthanwhatthepresentspendinghorizonspermit.Furthermore,thefactthatthefiscalpicturetodayisworsethantheleastoptimisticTreasuryscenarioprojectedthreeyearsagorequiresaseriousre-thinkaboutthegoalsandimplementationstrategyofthepost-schoolingsector.Table 6 provides information on the growth in the expenditure on CET colleges for the period2010/11to2014/15.ThisrepresentstheperiodpriortoCETcollegesbecominganationalfunctionin2015.
80,0% 80,3% 80,3% 80,3%
18,4% 19,4% 19,4% 19,4%
0,0%
10,0%
20,0%
30,0%
40,0%
50,0%
60,0%
70,0%
80,0%
90,0%
2015/16 2016/17 2017/18 2018/19
Compe
nsa`
onand
transfersa
s%of
programmefund
ing
Compensa`onofemployees Transfers

InvestmentTrendsinPost-schoolEducationandTraininginSouthAfrica
37
37
Table 6: Growth in consolidated provincial expenditure on Community Education and Trainingcollegesbytype,2010/11to2014/15(2010/11=100)
R'000 2010/11 2011/12 2012/13 2013/14 2014/15
Realaveragechangeover4-year
period(%)Currentpayments 1,193,664 1,382,237 1,519,550 1,527,401 1,575,884 1.6Compensationofemployees 968,342 1,234,910 1,443,627 1,432,442 1,472,237 5.7Goodsandservices 225,243 147,305 75,785 94,815 103,493 -16.9Interestandrentonland 79 22 138 144 154 105.1Transferandsubsidies 27,818 29,738 48,334 50,758 52,987 13.3Non-profitinstitutions 27,187 29,492 46,456 50,329 52,547 13.3Households 631 246 1,878 429 440 119.7Paymentsforcapitalassets 1,197 1,229 1,170 6,080 6,148 93.6Machineryandequipment 1,197 1,229 1,170 6,060 6,148 93.3Softwareandotherintangibleassets - - - 20 - -Total 1,222,679 1,413,204 1,569,054 1,584,239 1,635,019 2.0Source:EstimatesofNationalExpenditure,2014Duringthefour-yearperiodrepresentedinTable6above,expenditureonadultbasiceducationandtraininggrewby2percentonaverage inrealterms.Consolidatedprovincialexpenditureonadultbasic education and training grew from R1.2 billion in 2010/11 to approximately R1.6 billion in2014/15.Expenditureoncompensationofprovincialemployeesconsumedthelargestshareofthebudget and grew on average by almost 6 per cent in real terms over the four-year period. Inabsolute terms, in spite of the small positive growth, adult education and training budgets aredwarfedbycorrespondingspendingonpublicschools,TVETcollegesandtheuniversitysector.3.3FinancingoftheSkillsAgendainthePSETsystemInordertomeetthechallengesofworkplacetraining,thegovernmenthasdevelopedanelaboratesetofpoliciestodealwiththecountry’semergingandgrowingskillsshortages.Whilethisisavasttopic, inthispublication,theskillssectorand itsassociatedpolicies isapproachedpurelyfromthepointofviewofhowitassistsintheexpansion,developmentandachievementofkeyPSETgoals.The Skills Branch receives skills levy funding from the South African Revenue Service (SARS) andtransferittotheSectorEducationandTrainingAuthorities(SETAs)onmonthlybasis.ThelevyissplitintoAdministrationfee(10percent),MandatoryGrant(20percent),DiscretionaryGrant(49.5percent)andQualityCouncilforTradesandOccupations(QCTO)0.5percentfunding.ThelevyisusedtofundtrainingasidentifiedintheSETASectorSkillsPlan(SSP).Figure11presentsavisualpictureofhowtheskillsagendaandregimehavebeeninstitutionalisedintheSouthAfricancontext.

InvestmentTrendsinPost-schoolEducationandTraininginSouthAfrica
38
38
Figure11:TheskillstrainingsysteminSouthAfrica:avisualdemonstration
Source:DHETSkillsDirectorate(personalcommunication),2016Note:Theamountsrepresentedinthegraphaboveareusedfordemonstrativepurposes.Asisclearfromfigure11above,theexpansionofeducationandtraininginthePSETsystemcanbeassistedthroughaccessingfundsfromtheNationalSkillsFund(accordingtocriticalprioritiesofthecountry)andthetwenty-oneSectorEducationandTrainingAuthorities(SETAS).Translating the schemeabove into numbers from the realworld produced the distributionof theskillsdevelopmentlevyfortheperiod2011/12to2015/16asrepresentedinTable7below.Table7:ThedistributionoftheSkillsDevelopmentLevyfortheperiod2011/12to2015/16
FinancialYear
TotalamountdisbursedbytheSkills
DevelopmentLevy
(Rmillion)
Amounttransferred
totheNationalSkillsFund(Rmillion)
AmountdisbursedtoSETAS(Rmillion)
SETAAdmin.Costs
(Rmillion)
SETAMandatory
GrantAllocation(Rmillion)
SETADiscretionary
GrantAllocation(Rmillion)
PortionofSETAAdmin
coststransferredtoQCTO(Rmillion)
2011/12 10,106 2,020 8,086 1,010 5,053 2,021 -2012/13 11,419 2,283 9,135 1,141 5,709 2,283 -2013/14 12,566 2,511 10,054 1,319 2,513 6,221 152014/15 14,036 2,818 11,218 1,472 2,804 6,941 282015/16 15,225 3,044 12,180 1,598 3,045 7,536 40Total 63,353 12,677 50,675 6,543 19,127 25,005 83Source:DHETSkillsDirectorate,2016

InvestmentTrendsinPost-schoolEducationandTraininginSouthAfrica
39
39
Table7 shows that in the2014/15 financial year, theallocation toSETASamounted tomore thanR11.2billion,whilein2015/16,allocationsreachedR12.2billion.Collectively,between2011/12and2015/16, SETASwere allocated almost R51billion,while theNational Skills Fund garnered almostR13billionover thesameperiod.Toput theseallocations inperspective: in2014/15,spendingontheCETcollegesbudgetwasapproximatelyR1.6billion,whileallocationstotheNSFstoodatslightlymore than R2.8 billion. These resources are vital in the new post-school education and trainingsystemandfuturepublicationswillattempttosketchclearer linksbetweentheskillsdevelopmentregime and requirements in sectors of the PSET system (universities, TVET colleges, communityeducationandtrainingetc.).Whileallocationsareimportantinbudgetanalysisexercises,itisjustasimportanttoexamineactualspendingtogetabettersenseoftheoverallcredibilityofbudgetsinthissector.Figure12providesinformationon thebreakdownofactualexpenditureon theSETAS for2014 in termsof the threeimportantcategories,namelymandatorygrants,administrationandthediscretionarygrant.Figure12:BreakdownoftotalSETAexpenditurebycategoryofexpenditure,2014
Source:DHETAnnualFinancialStatementsforthefinancialyearsending2013and2014Table12showsthatthebulkofspendingwasdoneonthediscretionarygrants(almost62percent),while the mandatory grant consumed 25 per cent of the available resources. The remainingspendingwasusedfortheadministrationofthevariousSETAS(approximately13percent).Figure13providesinformationonconsolidatedSETAincomeandexpenditurefortheperiod2011to2014.
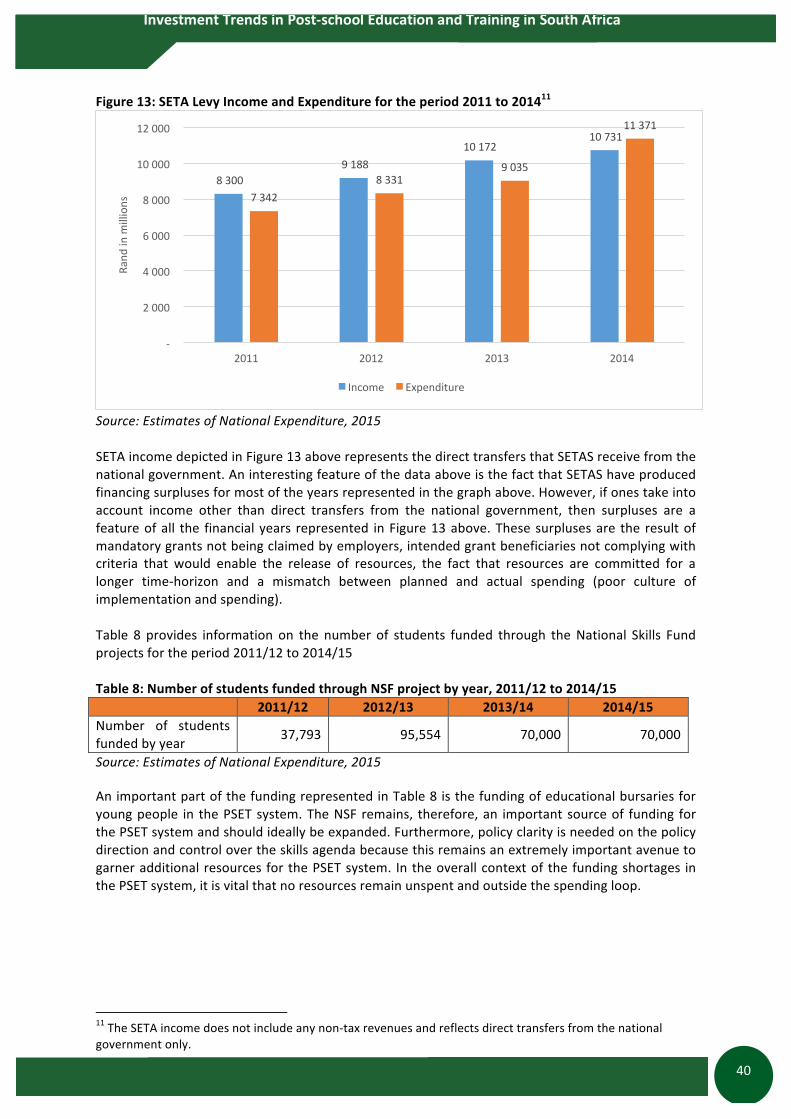
InvestmentTrendsinPost-schoolEducationandTraininginSouthAfrica
40
40
Figure13:SETALevyIncomeandExpenditurefortheperiod2011to201411
Source:EstimatesofNationalExpenditure,2015SETAincomedepictedinFigure13aboverepresentsthedirecttransfersthatSETASreceivefromthenationalgovernment.AninterestingfeatureofthedataaboveisthefactthatSETAShaveproducedfinancingsurplusesformostoftheyearsrepresentedinthegraphabove.However,ifonestakeintoaccount income other than direct transfers from the national government, then surpluses are afeatureofall the financialyears represented inFigure13above.Thesesurplusesare the resultofmandatorygrantsnotbeingclaimedbyemployers,intendedgrantbeneficiariesnotcomplyingwithcriteria that would enable the release of resources, the fact that resources are committed for alonger time-horizon and a mismatch between planned and actual spending (poor culture ofimplementationandspending).Table 8 provides information on the number of students funded through theNational Skills Fundprojectsfortheperiod2011/12to2014/15Table8:NumberofstudentsfundedthroughNSFprojectbyyear,2011/12to2014/15 2011/12 2012/13 2013/14 2014/15Number of studentsfundedbyyear 37,793 95,554 70,000 70,000
Source:EstimatesofNationalExpenditure,2015AnimportantpartofthefundingrepresentedinTable8isthefundingofeducationalbursariesforyoungpeople in thePSETsystem.TheNSF remains, therefore,an importantsourceof funding forthePSETsystemandshouldideallybeexpanded.Furthermore,policyclarityisneededonthepolicydirectionandcontrolovertheskillsagendabecausethisremainsanextremelyimportantavenuetogarneradditionalresourcesforthePSETsystem. Intheoverallcontextof thefundingshortages inthePSETsystem,itisvitalthatnoresourcesremainunspentandoutsidethespendingloop.11TheSETAincomedoesnotincludeanynon-taxrevenuesandreflectsdirecttransfersfromthenationalgovernmentonly.
83009188
1017210731
73428331
9035
11371
-
2000
4000
6000
8000
10000
12000
2011 2012 2013 2014
Rand
inm
illions
Income Expenditure

InvestmentTrendsinPost-schoolEducationandTraininginSouthAfrica
41
41
4. MANAGING THE TRANSFORMATION OF THE POST-SCHOOL
EDUCATIONANDTRAININGSYSTEM:OUTPUTSANDPROCESSESAlthoughreservationsabouttheadequacyofthefundingallocationsforthePSETsystemhaveraisedinthisreport,itremainsimportant,nonetheless,tocelebrateimplementationandoutputsuccessesthat occurred in spite of the challenges in the broader spending environment. These output andimplementationsuccessesweremadepossiblebythehardworkofstudentsanduniversitystaff,theeffective management and governance of the PSET system, and the capable policy and supportfunctionperformedbytheDHET.In addition to documenting the output and implementation gains, it is also necessary to betterunderstandhow internalDHETprocesses enable thedepartment toput forward adefensible andpersuasiveargumentfortheadvancementofthePSETsystem.4.1OutputandImplementationSuccesses-TransformingthePSETsystemBroadeningaccessofpoorstudentsthroughfundingfromtheNationalStudentFinancialAidScheme(NSFAS)Figure14provides informationonthepercapita (student)spendingofNSFASallocations inpublicuniversitiesbetween1991and2014.Figure 14: Real per capita spendingon theNSFAS in public universities in SouthAfrica, 1991 to201412(2000=100)
Source:DHET(2015c)Note: Thenumberof students coveredgrew from7,240 in1991 to83,251 in2000,while in2014,186,150studentsbenefitedfromtheNSFASallocation.The most noticeable aspect depicted in Figure 14 above is that the inflation-adjusted level ofspendingin2014isalmostthreetimesashighasthecomparablebasein1991.Thisistestamenttothe largecash injection into theNSFASallocation inspiteof therapidly risingstudentdemandforadditionalfinancing.Since2000,theNSFASpercapitaallocationgrewby9percentinrealtermsonaverage,whileduringthechallengingpost-2008period,theallocationgrewbymorethan6percent12 The inflationcalculations involve theuseof calendaryear inflation (theaverageof January toDecember)insteadofthefiscal-yearinflationestimatesusedinmostoftheothergraphsinthisreport.
6202
8937
12614
16930
0
2000
4000
6000
8000
10000
12000
14000
16000
18000
20000
Realpercapita
spen
ding,ZAR
AcademicYears
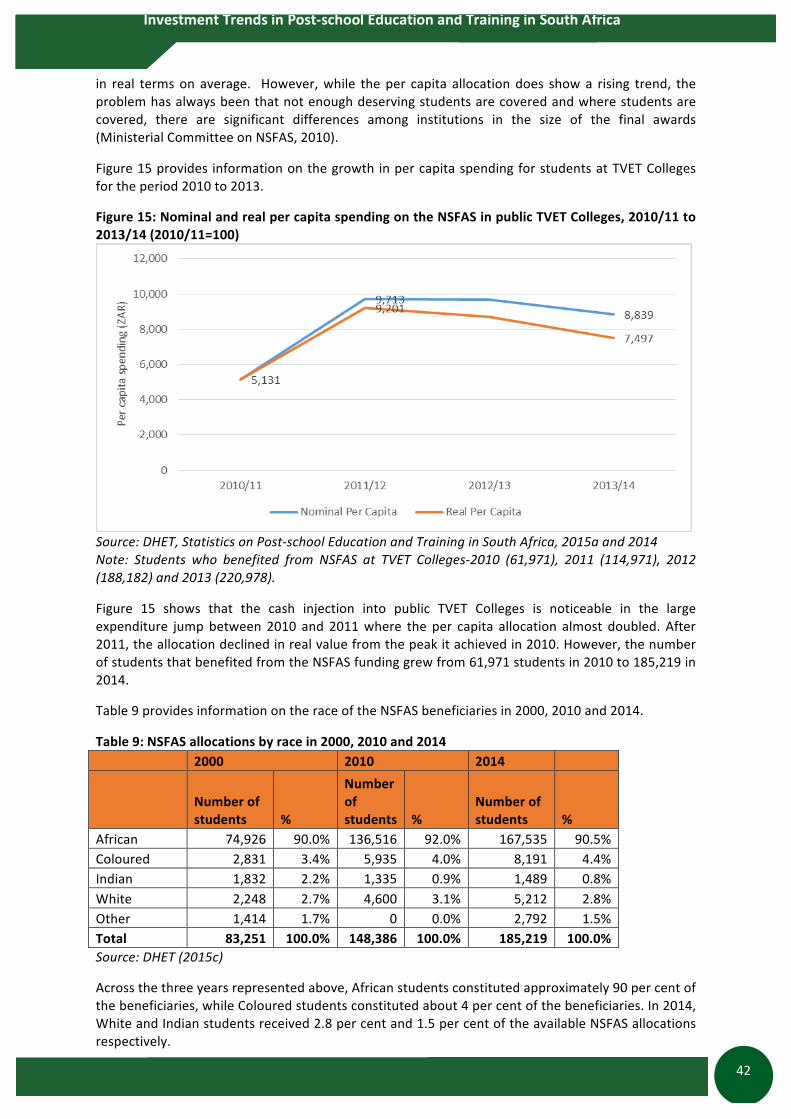
InvestmentTrendsinPost-schoolEducationandTraininginSouthAfrica
42
42
in real termson average. However,while theper capita allocationdoes showa rising trend, theproblemhasalwaysbeenthatnotenoughdeservingstudentsarecoveredandwherestudentsarecovered, there are significant differences among institutions in the size of the final awards(MinisterialCommitteeonNSFAS,2010).
Figure15provides informationonthegrowthinpercapitaspendingforstudentsatTVETCollegesfortheperiod2010to2013.Figure15:NominalandrealpercapitaspendingontheNSFASinpublicTVETColleges,2010/11to2013/14(2010/11=100)
Source:DHET,StatisticsonPost-schoolEducationandTraininginSouthAfrica,2015aand2014Note: Students who benefited from NSFAS at TVET Colleges-2010 (61,971), 2011 (114,971), 2012(188,182)and2013(220,978).
Figure 15 shows that the cash injection into public TVET Colleges is noticeable in the largeexpenditure jumpbetween 2010 and 2011where the per capita allocation almost doubled. After2011,theallocationdeclinedinrealvaluefromthepeakitachievedin2010.However,thenumberofstudentsthatbenefitedfromtheNSFASfundinggrewfrom61,971studentsin2010to185,219in2014.Table9providesinformationontheraceoftheNSFASbeneficiariesin2000,2010and2014.
Table9:NSFASallocationsbyracein2000,2010and2014 2000 2010 2014
Numberofstudents %
Numberofstudents %
Numberofstudents %
African 74,926 90.0% 136,516 92.0% 167,535 90.5%Coloured 2,831 3.4% 5,935 4.0% 8,191 4.4%Indian 1,832 2.2% 1,335 0.9% 1,489 0.8%White 2,248 2.7% 4,600 3.1% 5,212 2.8%Other 1,414 1.7% 0 0.0% 2,792 1.5%Total 83,251 100.0% 148,386 100.0% 185,219 100.0%Source:DHET(2015c)Acrossthethreeyearsrepresentedabove,Africanstudentsconstitutedapproximately90percentofthebeneficiaries,whileColouredstudentsconstitutedabout4percentofthebeneficiaries.In2014,WhiteandIndianstudentsreceived2.8percentand1.5percentoftheavailableNSFASallocationsrespectively.

InvestmentTrendsinPost-schoolEducationandTraininginSouthAfrica
43
43
Figure16usesthesamereferenceyearsandnowprovidestheNSFASallocationbygender.Figure16:NSFASallocationbygenderin2000,2010and2014
Source:DHET(2015c)Female students have received the largest part of the NSFAS allocation across the three yearsrepresentedinFigure16.Malestudents’shareoftheNSFASallocationdeclinedfrom44percentin2000to41percentin2010and2014.Figure17disaggregatestheNSFASallocationbythetypeofPSET institutionforthefinancialyears2009/10to2016/17.Figure17:DistributionofNSFASbytypeofinstitution,2009/10to2016/17
Source:EstimatesofNationalExpenditure,2014In2014/15,65percentoftheNSFASfundingwasawardedtopublicuniversities,while35percentwasawardedtoTVETcolleges.ThedifferenceinthepercentagedistributionoftheNSFASallocationbetweenthesetwoPSETinstitutionssince2011/12reflectsasignificantimprovementcomparedto2009/10,whenpublicuniversities consumed the lion shareof theallocation (82.5per centversus17.5percent).AnimportantpointtonoteisthatwhilethepercentageofNSFASfundingallocatedtopublicHEIsishigherthanthatforpublicTVETcolleges,theactualnumberofNSFASbeneficiaries
InvestmentTrendsinPost-schoolEducationandTraininginSouthAfrica
44
44
washigherinTVETcollegesthanpublicHEIsduetoinherentdifferencesintheexpenditurelevelsofthemaincostdriversofthesetwotypesofinstitutions(DHETStatsPublication,2013).While there ismuch to celebrate about themanner inwhich theNSFAS allocation has expandedhigher education and TVET college education to those who would otherwise not enjoy thesebenefits,substantialchallengesremain.Table10providesinformationaboutthenumberofstudentswhohadappliedforNSFASfundingbutwerenotgrantedanystudentfinancialaidin2013and2014.Table10:NSFASshortfall2013and2014 2014 2013
NumberofapplicantswhoappliedforNSFASfunding 289,105 339,665
NumberofsuccessfulNSFASapplicants 186,150 194,923
Numberofunfundedregisteredstudentswhocouldnotbeassisted 53,987 46,050
%thatcouldnotbesupported 18.70% 13.60%Source:DHET(2015c)Note:Theshortfallduring2013and2014reflectsdemandfromstudentsatpublichighereducationinstitutionsandstudentsatTVETCollegesIn2013,almost14percentofstudentswhohadappliedforNSFASfundingwereunsuccessful,whilethecorrespondingnumberin2014wasapproximately19percent.TheDHETiscurrentlyexploringanumber of options to broaden the student base of beneficiaries and investigating alternativefinancingoptions(DHET,2015c).

InvestmentTrendsinPost-schoolEducationandTraininginSouthAfrica
45
45
EquityandredressataninstitutionalandindividuallevelFigure 18 provides information about the nominal growth in the unconditional block grant ofhistoricallydisadvantageduniversitiesbetween2004/05and2014/15.Figure 18: Nominal growth in the block grant subsidy of historically disadvantaged universities,2004/05to2014/1513
Source:PresentationbyDHETUniversityBranchtothePortfolioCommitteeonHigherEducationontheHDIDevelopmentGrant2015/16,March2015Figure 18 indicates that relative to all universities, the block grant allocation of historicallydisadvantageduniversitiesincreasedatamorerapidrateovertheperiod2004/05to2014/15.Itisimportant to understand that this does not mean that the block grant allocations of theseinstitutionsarenecessarily largerthanotheruniversities.Thestronggrowth inallocationstotheseinstitutionsisintendedtocompensateforinheritedinfrastructurebacklogsandinrecognitionoftheadditional education burdens that these institutions have to tackle. The nominal increases rangefrom263percentatWalterSisuluUniversityto330percentattheUniversityofVenda.Figure19examinesthehistoricallydisadvantagedinstitutions’shareoftheinfrastructureallocationsovertheperiod2012/13to2014/15
13 These large nominal increases represent above-inflationary increases on the block grants. However, noservicedeliveryburdensareimpliedinthegraphabove,whichdoesnotwarrantaconclusionthatthefundinggainsapproximateanyadequacybenchmark.

InvestmentTrendsinPost-schoolEducationandTraininginSouthAfrica
46
46
Figure 19: Historically Disadvantaged Institutions’ share of the infrastructure grant allocations,2012/13to2014/15
Source:PresentationbytheDHETUniversityBranchtothePortfolioCommitteeonHigherEducationontheHDIDevelopmentGrant2015/16,March2015The DHET notes that while the HDIs represented in Figure 19 do not have the lion share of FTEenrolments (only about 15 per cent), in order to deal with inherited disadvantages, their jointallocationsweresetto42percentoftheinfrastructureallocation.ThisisaclearattemptbyDHETtorecognisepastinjusticesandtomakeamendsinthecontextoftightfinancialallocations.Further funding support for HDIs has been the introduction of the HDI Development Grant in2015/16, following one of the recommendations of the Ministerial Review Committee on theFundingofUniversities.TheHDIDevelopmentGrantaimstostrengthenadministrativeandfinancialsystemsattheseinstitutionsandtoimprovethequalityandsustainabilityofitsacademicstanding.Annuallythese institutionswill receiveanadditionalR410millionandoverthefive-yearperiodofthegrant,thecontributionofthisgrantwillbeslightlymorethanR2billion.Asthefundsin2015/16were used to fund the zero fee increase in 2016, the HDI Development Grant will take effect in2016/17forafive-yearperiod.Whileinstitutionalequityandredressmeasuresareimportant,studentsformerlyclassifiedasblackaredistributedacrossall institutionsand it is important tostudyaccessaccording to the raceandthegenderoftheindividualstudents.Table11providesinformationabouttheparticipationratesofstudentsbyraceandgenderin2003,2008,2010and2013.
6,3% 6,2%
3,8% 3,5%
5,1%
7,4%
3,1%
6,3%
1,8%
2,8%
1,2%
3,1%
1,9%
2,8%3,2%
1,9%
0,0%
1,0%
2,0%
3,0%
4,0%
5,0%
6,0%
7,0%
8,0%
FortHare Limpopo Mangosuthu SefakoMakgatho
Venda WalterSisulu WesternCape
Zululand
%sh
areofth
einfrastructuregrant
alloca`o
ns
%ofinfrastructuregrants,2012-2015 %ofactualteachinginputunits,2013

InvestmentTrendsinPost-schoolEducationandTraininginSouthAfrica
47
47
Table11:Participationratesatpublicuniversities14byraceandgender in2003,2008,2010and2013(%)Race Gender 2003 2008 2010 2013
African
Male 10.1 11.3 11.8 13.4Female 12.2 14.6 16.5 19.5Total 11.1 13 14.1 16.5
Coloured
Male 10.2 11.2 12.4 11.2Female 11.9 15.8 18.5 17.9Total 11.1 13.5 15.5 14.5
Indian
Male 45 37.9 37.4 39Female 52.8 51.8 54.2 59.2Total 48.9 44.7 45.6 48.9
White
Male 61.1 51.6 52.1 48.3Female 66 61.5 62.8 61.3Total 63.5 56.5 57.4 54.7
Total
Male 14.2 14.7 15 16Female 16.6 18.6 20.4 22.8Total 15.4 16.7 17.7 19.5
Source:AdaptedfromDHET(2015c)Table11showsthattheparticipationratesofAfricanstudentsincreasedfrom11percentin2003toapproximately17percentin2013.By2013,femaleAfricanstudentsachievedaparticipationrateof20percentcomparedtotheirmalecounterpartswhomanagedtoachieveonly13.4percent.Theparticipation ratesofColoured studentswere similar to theirAfrican counterparts in2003andby2013,itaveragesabout15percent.Colouredfemalestudentshaveconsistentlyhigherparticipationratesthantheirmalecounterpartsandby2013,thisratewasalmost18percentcomparedtothemuchlowerrateof11percentformaleColouredstudents.IndianandWhitestudentshavevastlysuperiorparticipationratesrangingfromcloseto50percentforIndianstudentsto55percentforWhite students in 2013. The trend of higher female participation rates also applies toWhite andIndian students and in these groups, female participation rates are put at around 60 per cent in2013.Both theNationalDevelopment Plan and theWhite Paper for PSET emphasise the importance ofexpanding enrolments in Science, Engineering andTechnology (SET) fields. Table 12 examines theenrolmentratiosinSETbyraceandgenderin2003and2013.Table12:EnrolmentratiosinScience,EngineeringandTechnologybyraceandgenderin2003and2013(%) 2003 2013 Gender Race Gender Race Male 55.1 African 55.3 Male 54.5 African 66.6 Female 44.9 Coloured 5.7 Female 45.5 Coloured 5.7 Indian 8.7 Indian 6 White 30.1 White 20.9 Source:AdaptedfromDHET(2015c)Note:ThetotalenrolmentsinSETin2003were193,864(outofatotalenrolmentof705,255)andin2013,SETenrolmentswere283,622(outofatotalenrolmentof983,698)
14Theparticipationrate/grossenrolmentratioiscalculatedbydividingtheactualnumberofstudentsenrolledinthehighereducationsystembythenumberof20-24yearoldsinthegeneralSouthAfricanpopulation.

InvestmentTrendsinPost-schoolEducationandTraininginSouthAfrica
48
48
Table12showsthatmalestudentsconstituted55percentofallSETenrolmentsin2003and2013.In2003,Africanstudentsconstituted55percentofallenrolments,whileWhitestudentsmadeup30percentsoftheseenrolments.In2013,Africanstudentenrolmentsconstituted67percentofallenrolments,whileallothergroups’enrolmentratiosshrunkrelativetothegrowthinAfricanstudentenrolments. The substantial rise in the enrolment ratios of African students in SET fields isnoteworthyandmustbe celebrated.A concertedeffortmustbemade to improve theenrolmentratiosofColouredstudents.OutputandimplementationsuccessesFigure20examinesgraduatesasapercentageoftotalheadcountenrolmentfortheperiod2007to2013.Figure20:Graduatesatdifferentqualificationlevelsasapercentageoftotalheadcountenrolmentatpublicuniversities,2007to2013
Source:HigherEducationManagementInformation(HEMIS,2016)Figure 20 shows that graduates at the under-graduate, Master’s and Doctorate levels constitutebetween12and21percentoftotalheadcountenrolmentatanygiventimeduringtheperiod2007to2013. There is very little variationwithinaqualificationbandandpercentages typically changeonly by one percentage point over this period. For students who pursued post-graduate studiesother thanMaster’s andDoctoratedegrees, thepercentagesaremuchhigherdue to thebroadervarietyof courses in thisband, and, typically, such coursesare shorter induration than theotherqualificationsrepresentedinthegraphabove.Graduatesinthiscategoryconstitutebetween36percentand44percentoftotalheadcountenrolment.Figure21belowexamines the throughput ratesamongstudentswhopursued3and4-yearundergraduateprogrammesthatcommencedin2000and2009respectively.Thegraphuses5yearsafterthecommencementoftheunder-graduateprogrammesasabenchmarkforcompletionandsimplyestimateswhatpercentageoftheoriginalcohortcompletedwithinthistime-period.

InvestmentTrendsinPost-schoolEducationandTraininginSouthAfrica
49
49
Figure 21: The percentage of national under-graduates after 5 years of study into 3-and 4-yearprogrammesatpublicuniversitiesbyraceandgender,2000and2009cohorts
Source:DHET(2015c)Generally-with the exception of White female students-the cohort performance of those whostartedtheirstudiesin2009,achievedhigherthroughputratesthantheircounterpartsin2000.Forexample, for the 2000 cohort who pursued under-graduate programmes, only 30.4 per cent ofAfrican femalesaredeemed tohave successfully completedwithin the five-yearperiod,while thecorresponding rate for Indian female studentswas 42.1per cent during the sameperiod. For the2009cohort,amuch largerpercentageofAfricafemalestudentsgraduatedwithinfiveyears(43.6percent),whilethecorrespondingsuccessrateforIndianfemalesisabout50percent.Whileitwillbedifficulttoattributethegrowingthroughputsuccessratetoonefactoronly,thecontributionofdedicated grants to improve the quality of teaching as well as better preparing students for therigoursofuniversitystudies(thefoundationgrant)couldbeconsideredasimportantvariablesinthissuccessequation.Table13providesinformationonthenationalunder-graduatethroughputratesinpublicuniversitiesin2000,2003,2006and2009.Table13: Improving(cumulative)nationalunder-graduatethroughputrates inpublicuniversitiesin2000,2003,2006and2009(%) Number Graduates(%)Intakeyear Year1 Year3 Year4 Year52000 70994 18.8 35.1 44.22003 81303 18.3 34.3 42.92006 83518 20.6 41.9 53.52009 109869 17.5 40.4 53.5Source:AdaptedfromDHET(2015c)Table13depictsa rising trendof successful completionofunder-graduateprogrammes from44.2percentin2000to53.5percentin2009.Thismeansthatlessthanhalfofthosewhostartedtheirstudiesin2009managedtocompletewithinthebenchmarkperiodoffiveyears.Thereisclearlyanemergingsuccessstoryhere,butthere isalsoanacceptancethatmuchhigherthroughputsuccessratesareneededtojustifytheadditionalinvestmentmadeintothepublicuniversitysectorandthePSETsystemasawhole.
30,4%
23,5%
37,2%
27,3%
42,1%
33,8%
62,1%
46,9%43,6%
36,2%
43,0%
36,1%
50,3%
40,3%
52,0%
0,0%
10,0%
20,0%
30,0%
40,0%
50,0%
60,0%
70,0%
AfricanFemale
AfricanMale ColouredFemale
ColouredMale
IndianFemale
IndianMale WhiteFemale
WhiteMale%ofn
a`on
alund
er-gradu
atesbyraceand
gend
er
2000 2009

InvestmentTrendsinPost-schoolEducationandTraininginSouthAfrica
50
50
Table14providesoneindicatoroftherelativeoutputsuccessinTVETcolleges,namelycertificationratesduringthe2013/14and2014/15financialyears.Table14:CertificationratesinTVETCollegesbyqualificationtypein2013/14and2014/15(%)QualificationType 2013/14 QualificationType 2014/15GTEC 38.6%
NC(V):L2 32.8%
NC(V):L3 30.2% NC(V):L4 37.1% NC(V):L4 34%
N1-N3 54.4% N1-N3 59.5%N4-N6 45% N6 42.7%Source:DHETAnnualReport2014/15Note:Certificationratesaredefinedasthenumberofstudentswhohavecompletedaqualificationoverthetotalnumberofstudentswhosatforthatexamination.Generally,thecertificationratesinTVETcollegesarenothighandconcertedeffortsarerequiredtoimprovetheoverallsuccessrateofstudentsandinstitutions.However,therearesomesignsthatthesystemisbeginningto improve: forexample, intheN1-N3qualificationtype,thecertificationrateimprovedbyalmost6percentto60percentin2014/15.Whatthispublicationhasrevealedistheneed to put substantiallymore resources into the sector, whichwould provide for better qualitylecturing, dedicated student financial aid, and a learning (and physical) infrastructure that wouldmakethesequalificationsmeaningfulandcompetitiveinanopenlabourmarketsystem.TheNationalDevelopmentPlanregards innovationasan importantmeasureof thesuccessof thehigher education system and makes a strong case for a substantial increase in the number ofenrolled and graduated doctoral candidates. Figure 22 displays the total number of doctoralgraduatesbetween2003and2014.Figure22:Thetotalnumberofdoctoralgraduates,2003to2014
Source:DHET(2015c)

InvestmentTrendsinPost-schoolEducationandTraininginSouthAfrica
51
51
The National Development Plan states that South Africa should producemore than 100 doctoralgraduatespermillionofthepopulationcomparedtothecurrent28PhDgraduatespermillionperyear. Translated into annual targets, this means South Africa has to produce more than 5,000doctoral graduates per annum. If this is used as a benchmark to assess the performance of thesystem,thenthe2014numberof2,258doctoralgraduatesneedstobedoubledinthenext14yearstoreachthetargetof5,000doctoralgraduatesperannum.Thatwillbechallenging,butthedatadoindicatearisingnumberofdoctoralgraduatesovertheperiodrepresentedinthegraphabove.Figure23usesthesamedataanddisaggregatethenumberofdoctoralgraduatesbygenderfortheperiod2003to2014.Figure23:Thetotalnumberofdoctoralgraduatesbygender,2003to2014
Source:DHET(2015c)Across theentireperiod, thehighereducationsystemproducesa largerabsolutenumberofmaledoctoral graduates. This, in the context of an overall higher female population and larger highereducation enrolment rates, means that some effort is required in raising the number of femaledoctoralgraduates.Figure24usesthesameinformationanddisaggregatethisinformationbyrace(AfricansandWhites)fortheperiod2003to2014.

InvestmentTrendsinPost-schoolEducationandTraininginSouthAfrica
52
52
Figure24:Numberofdoctoralgraduatesbyrace,2003to2014
Source:DHET(2015c) In 2003, the number of doctoral graduates amongWhiteswasmore than double that of Africandoctoral graduates. However, by 2012, the number of doctoral graduates appears to haveconverged,andby2014,thetotalnumberofdoctoralgraduatesamongAfricanstudentsexceededthatofWhitedoctoralgraduates.Figure 25 provides information about the total publication output units per permanent academicstaffmembersduringtheperiod2004to2013.Figure 25: The total publication output units per permanent academic staff member at publicuniversities,2004to2013
Source:DHET(2015c)Figure25representstheoutputsofacademicresearchersatpublicuniversitiesasawholeandmayhide, therefore, important differences in the productivity of researchers at different academicinstitutions. However, the overall picture is that of research output that is gradually improving,whichreflectswellonattemptsatincreasingthevalueofknowledgeproductionandstrengtheningthelinkstothenationalinnovationsystem.

InvestmentTrendsinPost-schoolEducationandTraininginSouthAfrica
53
53
4.2DHETProcessesthatAdvancetheClaimsofthePSETsystemTheDHET,asanationalpolicy-makingdepartment,hastorespondtomultiplepolicyandfinancingchallenges. Furthermore, such responses as indicated earlier, often take place in a compromisedoverallspendingenvironmentandrisingstudentdemandsforaffordableandaccessibleeducation.There is also the additional constraint of operating within the country’sMTEF framework, whichrequiresthedevelopmentofevidence-basedoperationalplans,theestablishmentandactiveuseofreliable databases, and ongoing evidence of how the department intends to meet its legal andconstitutional mandates. In the face of these multiple challenges, the DHET can ill-afford to beunsystematicinitsapproachtoservicedeliveryanddeliveringonitslegalmandates.WhatisshownbelowistherationalandconsideredmannerinwhichtheDHETconsidersevidence,integrates this into the policy-making process, and in the process ensures the effectiveimplementationofnationalpolicies.DevelopmentofanewnationalplanforthePSETsystemWiththeestablishmentofanewDepartmentofHigherEducationandTrainingandthepublicationoftheWPforthePSETsystem,ithasbecomenecessarytodevelopanewnationalplanforthePSETsystemasawhole.Thismaysoundself-evident,buttheplanningandoperationsnecessarytobringtheWPforthePSETsystemtofruitionarefarmorecomplicatedthanimplementingasinglenationalhighereducationplan. ThenewnationalPSETplanwill serveasa referencepoint toguide futureprojectionsoftotalcostsandthetimerequiredtofullyimplementprovisionsintheWhitePaperforPSET.ThisprocessisalreadyunderwayandtheDHETisworkingcloselywiththeNationalTreasuryinfine-tuningthisvitalplan.InitialindicationsarethatthenewnationalplanforthePSETsystemwillbereleasedindraftforminMarch 2017 and will follow the normal DHET and government-wide consultative processes. Indeveloping the new national plan, the DHET is co-ordinating various work streams (for example,work on the TVET sector, community colleges as well as work on the university sector) that willultimatelyinformthenewnationalplan.Theworkstreamsarerequiredtoexamineemergingneedsandprojections ineachof themainsectors thatconstitute thePSETsystemandmake frameworkfinancingandpolicyproposalstobringthesystem’snationalgoalstofruition.An important part of this work is to develop revised targets for each of themain sub-sectors inrecognition of the changed economic environment and the resulting realisation that the pace atwhich the system expands will have to bemoderated. This is why the new national plan will becritical in further discussions between theDHET and theNational Treasury in reaching consensusabout the leveland speedofexpansionof thePSET system.Furthermore, theplanwill give someindicationofthecapacityofthePSETsystem-initspresentguise-toimplementtheWhitePaperforthePSETsystem.PlanningprocesseswithPSETinstitutionsthataffordpredictabilityandstabilityinfundingEducationinstitutions,inordertofunctionwithoutanyinterruption,mustbefundedinsuchawaythatbringscertaintyandpredictabilityinthefundingasfarasthecontributionfromthegovernmentisconcerned.ThisprincipleisapplicabletoschoolsinthebasiceducationphaseorindeedthePSETinstitutionsthatarecoveredinthispublication.Table15providesinformationonthesynchronisedstrategicplanningcycleoftheTVETcolleges.

InvestmentTrendsinPost-schoolEducationandTraininginSouthAfrica
54
54
Table15:StrategicsynchronisedplanningcalendarofTVETcollegesandtheDHETTimeofyear ActionEndMarch DHETmustreleasenationalenrolmenttargetsandpriorities
AprilCollegescommencetheirannualplanningprocessfornextthreecalendaryears
EndJuly DHETmustapproveannualfundingbase-ratesapplicablefornextcollegeyearEndAugust15 CollegesmustsubmitthenextthreeyearsplantoDHET
EndSeptemberFinalannualreportswithauditedfinancialstatementsforpreviousfinancialyear
EndOctober DHETsignsoffonnextthreeyearplans
EndNovemberScheduleofpaymentstocollegestobeconfirmedandcommunicatedtocolleges
Source:https://sip-skills.onlinecf.net/SKILLSforandthroughSIPs(accessedFebruary2016)TheplanningcycleaboveisfittedintoabudgetcalendarandsoitispossibletooverlaythedatesinTable13withotherrelevantbudgetdates,buttheprincipleisthesame:thedeeperonegoesintothecalendaryear,thefirmerindicationsareofwhatoverallfundingwillbecomeavailable.Also, inorder to give these exchanges some form of predictability, 3-year enrolment projections areprovided(again,similartothebudgetprojections)andtheDHETsetsasideaperiod(usuallymidwaythroughanMTEF)whereareviewofenrolmenttargets,prioritiesandfundingcanbere-negotiated.The latter allows flexibility in the planning calendar and recognises that important changesmighthave taken place since the last enrolment numbers and indicative budgets were negotiated andagreedon.Theplanningcycleforpublicuniversitiesissimilar(eventhoughitfollowsa5-yearplanninghorizon)andfollowsadiscretesetofsteps,whichinclude:
• Universitiesdeveloptheirenrolmentplansandinterprettherequirementsofnationalpolicyandpriorities;
• ThesedraftplansaresubmittedtotheDHETandanalyses;• Thereafter a seriesofmeetings areheldbetween theuniversity andofficialsofDHETand
DHETuses a framework to engage these discussions,which are derived fromgoals in theNationalDevelopmentPlan,theMinister’sownperformanceagreementwiththePresident,theMediumTermStrategicFramework(MTSF)etc.;
• Followingthesemeetings,theuniversitiessubmitrevisedplansbyAugust;and• The plans are finalisedwhen theMinister of Higher Education and Training publishes the
MinisterialStatementonStudentEnrolmentPlanningforUniversities.AsisthecasewithTVETColleges,therewillbeanopportunitytorevisethesetargets/plansmidwaythroughthe5-yearplanninghorizon.Cross-government co-operation in determining the financial quantum involved indeliveringandexpandingpost-schooleducationandtrainingThenational governmenthas committed itself-through theoutcomeorientated systempioneeredby the Presidency-to undertake a series of expenditure reviews of key sectors and to carefully
15 If onewere to overlay important budget calendar dates on the FET planning cycle, then the Division ofRevenue workshop in August of each year comes to mind (fine-tuning of macro-economic and fiscalframeworks)aswellasthehandingdownofapprovedspendinglettersinNovember/Decembereachyear.

InvestmentTrendsinPost-schoolEducationandTraininginSouthAfrica
55
55
estimate thecostof implementingmajorpolicies.16 Implementing theWhitePaper forPSET isnodifferentandtheNationalTreasuryhasbegunaprocessofcostingtheimplementationoftheWhitePaper.However,becauseofthecentralityoftherevisednationalplanforthepost-schooleducationandtrainingsystem,DHETandtheNationalTreasuryareworkingtogethersoastoensurethatthecosting exercise has an appropriate referencepoint. Thiswill also ensure that both sides have anunderstanding of the relative cost drivers, constraints and challenges in implementing such animportantinitiative.CarefullyconsideredprocessesinfinalisingtherecommendationsoftheMinisterialReviewCommitteesMinisterial review committees are an important mechanism in the national Minister of HigherEducation and Training’s executive arsenal and these reviews are critical for continuedimplementationsuccess.InresponsetotheReviewCommitteethatexaminedthefundingofpublicuniversities,theDHETestablished
• AnoverallReferenceGrouptoadvisetheMinisteronthefeasibilityandsequencingoftheimplementationoftherecommendations;and
• A technical task team that provided technicalmodelling advice about the various optionspresentedintheMinisterialReview(issuesaboutimpact).
Followingtheseinternalexercises,thenextstepintheprocesshasbeentotakekeyproposalstotheCabinet.Iftheseproposalsareapproved,theywouldbegazettedandthepublicwillbeaffordedanopportunitytosubmitcomments.In the case of theMinisterial Review Committee on NSFAS, the NSFAS Board are responsible foroverseeing the implementation of any recommendations. As reported earlier on, most of therecommendationshavebeenimplementedandstrongprogresshasbeenmadeinensuringthattheNSFAS, as an entity, is fit for the purpose of delivering world class services to students andinstitutionsinthePSETband.Strengthening of theM&E capacity of the DHET through an evolving Higher EducationManagementInformationSystem(HEMIS)Duetotheincreasingoutputandoutcome-orientationofsuccessivepost-apartheidgovernments,itis critical to collect quality input, output and outcome related data that indicate the progressgovernmentismakinginundoingapartheidlegaciesandcreatinganewcultureofexcellence.TheHigherEducationManagement InformationSystem(HEMIS)hasbeendesignedtoaddresstheconcernsandthereisampleevidencethatthesystemcapturesongoingimplementationchallengesandsuccessesandthisdataareusedinthegoalsettingandstrategicprocessesoftheDHET.Infact,two of theMinisterial Review Committees make explicit mention of the need to develop stronginternalDHETM&Ecapacity.Furtherevidenceoftheevolvingcapacityofthesystemarethevariouscohort studies that havebeendone to study throughput rates (at bothunder-graduate andpost-graduatelevels)andthedegreeofstudentattritioninthesystem.The HEMIS is critically dependent on the reliability and veracity of information supplied byinstitutions in the PSET system. In this regard, theMinisterial Statement on University Funding2015/16 states that verification processes have been instituted to ensure the correctness of thesubmitted data. In instances where enrolment data were inflated, the DHET will re-calculateinstitutionalallocations.
16 Although Section 35 of the Public Finance Management Act (PFMA, Act 1 of 1999) applies to nationaldepartmentsdevelopingpoliciesthatmayhavecostimplicationsforsub-nationalgovernmentandreferringtotheneedtoestimatethecostrequirements,thisprovisionofthePFMArequiresasimilarlevelofrigourfromnationaldepartmentsmakingpolicythatrequiresnational-levelimplementation.

InvestmentTrendsinPost-schoolEducationandTraininginSouthAfrica
56
56
5.THEWAYFORWARD:CONTINUEDANDSUSTAINEDINVESTMENTINTHEPSETSYSTEMThe investment argument advanced in this report is relatively straightforward, although thetenabilityof theargument is subject touncertainty,especially in termsofhowthepresenthighereducationprotestswillberesolved.Whatthisreporthasestablishedisthefollowing:
• Theconstrainedeconomicgrowthenvironmentandtheconsequentimpactonthenationalfiscushasforcedpolicy-makerstobemuchmorespecificaboutthepoliciesthatwillenjoyfundingprioritisationandhowsuchpoliciesoughttobefunded;
• The budgetary evidence to be presented in the report suggests that there is a genuinelypositiveintenttofundtheexpansionofthepost-schooleducationandtrainingsystem,butthat such gains are challenged by an adverse inflationary environment and rapidly risingdemand, which is stimulated internally by the policy imperatives of theWhite Paper forPost-schoolEducationandTraining;
• The two largest post-schooling sectors, namely the universities and public TVET Colleges,areunderseverepressuretopreserveanyspendinggainsandhavesufferedrealdeclinesinthemonetary value of their per FTE student funding. The situationwith regards to TVETCollegesissomewhatworse,becauseoftheneedtoaccommodateimportantincreasestouniversityfunding;
• Fundingmodels for Community Colleges in the adult education training sector are in theprocess of being finalised and it is clear from the brief review in this report that asubstantialinjectionoffundingisneededtoimplementsomeofthepolicyproposals;and
• Thereissomeuncertaintyaboutthecontributionofskillsdevelopmentfundinginassistingtheexpansionofpost-schoolingeducationandtrainingopportunities.
In spite of these challenges, there are a number of ameliorative factors that have contributed toinstitutionsinthePSETsystemshowingresilienceinthefaceofanadverseandshrinkingspendingenvironment.Theseinclude:
• Signs of improved effectiveness in the university system due to a combination of goodmanagement on the part of universities andprogressive State funding policies, leading tokeytransformationtargetsbeingmetorgoodprogressedregistered;
• TheDHEThasformalisedinternalprocessesaimedatbuildingtheevidencebasetoinfluencethePSETsysteminaprogressiveanddesirablemanner;and
• Continued focus on redressing the funding and administrative burdens of historicallydisadvantagedinstitutionssoastodynamicallybringthemtotheproductionandinnovationmix.
Unlesstheeconomystartstogrow,educationandfinancialplannersaregoingtofacestarkchoices:temporarily halt the expansion of the system and focus on improving the quality of the system(inputs,outputsandprocesses)orchoosewhichofthePSETsystemswillbeallowedtogrowinspiteofthefinancialchallenges.Theformeroptiondoesnotimplyarealreductioninthefundingintentofthegovernment,but itdoessuggest that therateofgrowth inexpenditures is likely tobesloweddowninordertocomplywithbroaderaggregatefiscalmanagement.Giventherelativeefficiencyof

InvestmentTrendsinPost-schoolEducationandTraininginSouthAfrica
57
57
theuniversitysector,itismorethanlikelythatadditionalincreases-atleastintheshortterm-willbedirectedatthissector.TheunfortunateconsequenceofthisapproachisthatothercriticalareasofthePSETsystemwillfallbehindintermsoftheexpansiongoalsoftheWhitePaperforPost-schoolEducationandTraining.However, in thecaseof theTVETCollegesector forexample, theDHEThasactivelyencouragedadifferentiated college sector and it is not unreasonable to demand that priority sectors arecontinued to be funded well, thus preserving some of the national goals during this time. Ifapproached in that manner, student enrolment can still be increased in some areas and keptconstant inotherareassoas tomanage theexpansioncommensuratewith the reducedspendingenvironment.However,much depends on how the present student demands for free higher education and forzero increases in the fee levelswillbemanaged.Thisuncertainty is reflected in themedium-termallocationsforthePSETsystemandthereremainsanurgentneed,therefore,toresolvethismatterspeedily.

InvestmentTrendsinPost-schoolEducationandTraininginSouthAfrica
58
58
6.REFERENCESCouncilforHigherEducationTransformation(CHET)IncomeandExpenditureofUniversities,2009to2013<http://chet.org.za/data/sahe-open-data>(accessedFebruary2016)DepartmentofEducation(2006)ContinuingEducationandTrainingAct,2006(ActNo.16of2006).CapeTown:GovernmentPrintersDepartment of Higher Education and Training (2010) Higher Education and Training AmendmentLawsAct,2010(ActNo.25of2010).CapeTown:GovernmentPrintersDepartment of Higher Education and Training (2010) Report of theMinisterial Committee on theReviewoftheNationalStudentFinancialAidScheme.Pretoria:GovernmentPrintersDepartment of Higher Education and Training (2012) Further Education and Training CollegesAmendmentAct,2013(ActNo.3of2012).CapeTown:GovernmentPrintersDepartment of Higher Education and Training (2013)Report of theMinisterial Committee for theReviewoftheFundingofUniversities.Pretoria:GovernmentPrintersDepartment of Higher Education and Training (2013)White Paper for Post-school Education andTraining:BuildinganExpanded,EffectiveandIntegratedPost-schoolSystem.Pretoria:GovernmentPrintersDepartmentofHigherEducationandTraining(2014)AnnualReport2014/15.Pretoria:GovernmentPrintersDepartmentofHigherEducationandTraining (2014)MinisterialCommittee toReviewtheFundingFrameworks for Further Education and Training Colleges andAdult Learning Centres.GovernmentNoticeNo.772,ParliamentoftheRepublicofSouthAfricaDepartment ofHigher Education and Training (2014)Ministerial Statement onUniversity Funding:2015/16and201617.Pretoria:DHETDepartmentofHigherEducationandTraining(2014)StatisticsonPost-schoolEducationandTraininginSouthAfrica:2012.Pretoria:GovernmentPrintersDepartment of Higher Education and Training (2015a) Statistics on Post-school Education andTraininginSouthAfrica:2013.Pretoria:GovernmentPrintersDepartmentofHigherEducationandTraining(2015b),AnnualFinancialStatementsforthefinancialyearsending2009,2010,2011,2012,2013and2014.Pretoria:GovernmentPrintersDepartmentofHigherEducationandTraining.(2015c).Arewemakingprogresswiththesystematicstructuraltransformationofresourcingaccess,success,staffingandresearchinginhighereducation:whatdothedatasay?Pretoria:DepartmentofHigherEducationandTraining

InvestmentTrendsinPost-schoolEducationandTraininginSouthAfrica
59
59
DepartmentofHigherEducationandTraining(2015)BriefingbytheReferenceGroupandTechnicalTeamontheDevelopmentoftheFundingFrameworkfollowingtheMinisterialReportonUniversityFunding.PortfolioCommitteeonHigherEducationandTraining,25February2015Department of Higher Education and Training (2015) Briefing on the HDI Development Grant2015/16.PresentationtothePortfolioCommitteeonHigherEducationandTraining,19March2015Department of Labour (1998) Skills Development Act, 1998 (Act No. 97 of 1998). Cape Town:GovernmentPrintersDepartmentofLabour(1998)SkillsDevelopmentLeviesAct,1998(ActNo.97of1998).CapeTown:GovernmentPrintersFinancial and Fiscal Commission (2014) Submission on the 2014 Fiscal Framework and RevenueProposals.Midrand:FFCGewer,A(2010)Improvingqualityandexpandingthefurthereducationandtrainingcollegesystemtomeettheneedforaninclusivegrowthpath.Johannesburg:DBSAHuman Resource Development Council of South Africa (2014) FET College Purpose in theDevelopmentalState:ImperativesforSouthAfrica.Pretoria:HRDCSANationalTreasury(2013)BudgetReview2013.Pretoria:GovernmentPrintersNationalTreasury(2014)EstimatesofNationalExpenditure.Pretoria:GovernmentPrintersNationalTreasury(2015)BudgetReview2015.Pretoria:GovernmentPrintersNationalTreasury(2015)EstimatesofNationalExpenditure.Pretoria:GovernmentPrintersNationalTreasury(2016)EstimatesofNationalExpenditure.Pretoria:GovernmentPrintersOECD(2014)EducationataGlance:OECDIndicators.OECDPublishing.<http://dx.doi.org/10.1787/eag-2014-en>(accessedMarch2016)Papier, J, Nordham, S, and Mcbride, T (2012) Contemporary Issues in Public FET Colleges. LMIPWorkingPaper17,UniversityoftheWesternCapeRasool, H and Mahembe, E (2014) Study on Programmes Identified and Prioritised by the FETCollegesTechnicalTaskTeamanditsWorkStreams.Pretoria,HRDCSARepublic of South Africa (1999) Public FinanceManagement Act, 1999 (No. 1 of 1999).Pretoria:GovernmentPrintersSachs,M(2014)SouthAfrica’sLong-TermFiscalChoices.Presentationdeliveredat theBERAnnualGautengConference,13June2014,JohannesburgStatisticsSouthAfrica(2015)CPIHeadline.<http://www.statssa.gov.za/publications/P0141/CPIHistory.pdf?>(accessedFebruary2016)Steyn,AGWanddeVilliers,AP(2005)PublicFundingofHigherEducationinSouthAfricabyMeansofFormulae.Pretoria:CouncilforHigherEducation(CHE)ThePresidency(2011)NationalDevelopmentPlan2030.Pretoria:GovernmentPrinters
InvestmentTrendsinPost-schoolEducationandTraininginSouthAfrica
60
60
UniversitiesSouthAfrica(2014)StrategicFramework,2015-2019.Pretoria:UNISA