investment strategies and market structure: an … · relationship between market structure—the...
TRANSCRIPT

Investment Strategies and Market Structure:An Empirical Analysis of Bank Branching Decisions
Andrew Cohen & Michael J. Mazzeo
Received: 12 December 2008 /Revised: 3 November 2009 /Accepted: 22 February 2010 /Published online: 18 March 2010# US Government 2010
Abstract This paper analyzes the relationship between the competitive environment facedby depository institutions and the decisions these institutions make regarding the size oftheir branch networks. Specifically, we consider branches as a sunk investment thatpotentially increases utility for consumers and examine how local competition and productdifferentiation affect firms’ decisions regarding whether to make such investments. Weaccount for endogenous market structure using an equilibrium structural model, whichcorrects for bias caused by correlation in the unobservables associated with market structureand branching activity. We estimate the model using data from 1,882 concentrated ruralmarkets. Our results demonstrate the importance of accounting for market structure andproduct differentiation, and are consistent with a potential entry-deterring effect of bankbranch investments.
Keywords Investments . Competition . Market structure . Banking industry
JEL classification L11 . L13 . G21 . G28
1 Introduction
Defying predictions from the late 1990s that advances in information technology mightrender bank branches obsolete, financial institutions have been aggressively extending theirlocal retail presence over the past several years. A variety of explanations for this “return to
J Financ Serv Res (2010) 38:1–21DOI 10.1007/s10693-010-0082-7
The views expressed in this paper are those of the authors and do not necessarily reflect the view of theBoard of Governors or its staff.
A. CohenFederal Reserve Board of Governors, Washington, DC, USA
M. J. Mazzeo (*)Kellogg School of Management, Northwestern University, Evanston, USAe-mail: [email protected]

retail” have been put forward; this paper explores the potential competitive effects of bankbranch expansion.1 Industry analysts report that investing in branch networks hasincreasingly been utilized as a strategy to steal market share from competitors, targetingconsumers who value more convenient access to branches. Industrial organization theorysuggests that firms may be able to use investments to deter entry or facilitate the exit ofcompetitors, in cases where investments increase willingness-to-pay and are largely sunk.Because investments in branches arguably have these characteristics, we investigate therelationship between market structure—the operating banks in a market—and the numberof branches operated by the market’s participants.
Geographic markets for retail banking are inherently local; our data contains a largecross-section of market observations. The dataset includes 1,882 non-MSA markets, and weanalyze the branching activity of 4,891 financial institutions that operate in these markets.We also distinguish among firms that operate in many markets (“multimarket banks”), justone market (“single-market banks”) and thrift institutions (“thrifts”).2 These distinctionsallow us to assess the competitive consequences of recent deregulation that has facilitatedthe spread of institutions across multiple markets, and the role of branch expansionstrategies in this competition.
Our empirical analysis exploits recent developments in the industrial organizationliterature to address the econometric endogeneity of market structure in the relationshipbetween branching and competition. As a consequence, the results demonstrate interestingand subtle connections among branching, competition and product differentiation. Mostsubstantially, where institutions (of any type) compete in markets where operating amultimarket bank is particularly attractive, their branch networks are larger. Correcting formarket structure endogeneity turns out to be crucial. It allows us to uncover a strongnegative correlation between unobservables associated with branching and multimarketbank presence—in markets that appear attractive for multimarket banks but into whichmultimarket banks have not entered, the institutions that do operate have more branchesthan would otherwise be expected. While this finding does not provide conclusive supportfor a deterrence effect of branching, it is one of the few empirical studies to provideempirically rigorous evidence consistent with entry deterrence.
The remainder of the paper is organized as follows. Section 2 provides background: firsta brief review of the industrial organization literature on investments and market structureand then a discussion of the rural bank branching application. We describe the estimationstrategy in Section 3 and the data we use for the study in Section 4. Section 5 presents theempirical results and Section 6 concludes.
2 Background
This paper uses data on branching activity in retail banking to empirically investigate therelationship between market structure and the investment strategies of competing firms.
1 See Clark et al. (2007) for a comprehensive survey of the “return to retail” including various explanationsfor, and implications of, this trend.2 The banks that we classify as “single-market” in our dataset would also qualify as “community banks”under almost all of the definitions that have been used in the community banking literature. Thrift institutionsrefer to savings banks and savings and loans. These institutions operate under different charters, statutoryrequirements and regulatory agencies than commercial banks. The categorization of banks as either single-market or multimarket corresponds quite closely to a potential alternative type-distinction based on bank size.Section 4 contains additional discussion on this point.
2 J Financ Serv Res (2010) 38:1–21

Assuming endogenous investments in branches, an individual firm would compare the costsassociated with opening additional branches with the additional revenue that could begenerated from the investment. This tradeoff could potentially be complicated depending onthe amount of market competition faced by firms. In particular, investments in branchnetworks could increase market concentration if entry is more difficult or exit more likelywhere operating firms have made such investments. While a substantial industrialorganization theory literature analyzes these issues, few empirical studies (in any industry)have been able to tackle it directly.3
In this paper, we explore the relationship between branch networks and competition in across-section of rural banking markets, distinguishing among single-market (or community)banks, thrift institutions, and multimarket banks. Certain features of this application makefor an especially useful setting to analyze potential interactions between investment andmarket structure. First, there is evidence to suggest that a bank’s investments in branchesare largely sunk. Specific construction requirements often make commercial space designedfor bank branches inappropriate for alternative retail uses.4 Analysts have suggested thatlarger branch networks may also serve an advertising function, as branches are thought torepresent the “face” of the bank to customers. Many authors (Judd 1985; Sutton 1991, etal.) have noted that the commitment associated with sunk investments makes them morecredible in influencing competition.
In addition, practitioners and analysts in the banking industry consider retail branches tobe a crucial determinant of a firm’s demand. Former Federal Reserve Governor Mark Olsonnoted that, “Branch offices and networks continue to be critical factors to customers as theychoose their financial services providers…Surveys conducted by the Federal Reserve Boardindicate that the single most-important factor influencing a customer’s choice of banks isthe location of the institution’s branches.”5 Of course, there are other product characteristicsthat are likely to be important to consumers. Some consumers may value more personalizedservice, accessibility of an institution’s executives, or longer hours of operation. In fact, wewill be able to investigate whether there are different branching strategies for different typesof financial institutions and if these strategies depend on the type of competitors a firmfaces.
The potential connection between branching and competition was not empiricallyrelevant until relatively recently, as regulation severely limited the potential entry andbranching strategies of financial institutions. As late as 1970, only a handful of U.S. statesallowed banks to have more than one branch, and several states restricted branchingactivity through the early 1990s. In addition, banks were typically not permitted to cross
3 Tirole’s (1988) textbook presents the relevant theory literature; empirical studies include Lieberman (1987),Vogt (1999), Ellison and Ellison (2000), Dafny (2005) and Hamilton and McManus (2005). Ishii (2008)analyzes the ATM deployment decision of operating financial institutions, but does not explore the margin ofoperating versus not operating. This margin will play an important role in our empirical work.4 Steve Reider (cited in Muto 2005), president of the market-research firm Bancography, states, “There’s nota lot of demand for retailers for a space where a good chunk of it is taken up by a cast-iron and concretevault.” Reider goes on to say that “some banks are reluctant to retrofit a former bank location to fit their owndesign criteria, which can be as expensive as building another bank from scratch.”5 Speech delivered to the Fortieth Annual Conference on Bank Structure and Competition in Chicago, IL onMay 6, 2004. The surveys to which Governor Olson refers are the 2001 Survey of Consumer Finances andthe 1998 Survey of Small Business Finances. Studies like Berger et al. (1997) support the role of branches inconsumer demand. They find about twice as many branches as would minimize costs, but suggest that havingextra branches may nonetheless be profit maximizing, “since additional offices provide convenience for thebank’s customers that may be recaptured by the bank on the revenue side.”
J Financ Serv Res (2010) 38:1–21 3

state lines until the late 1980s.6 In this context, there has been vigorous debate in industryand policy circles over whether smaller “single-market” banks and thrift institutionswould represent an important potential source of competition as multimarket banks arepermitted to expand their operations.7 While pointing out that branching is generallyrelated to better financial performance, the FDIC notes that “these relationships areespecially evident among community banks, which are less profitable on average thanlarger institutions.”8
Our study is close in spirit to Dick’s (2005) analysis of large (MSA) banking markets.She relates various measures of quality—including the density of a bank’s branchnetwork—to market size, and finds that quality tends to be greater in larger MSAs. Dick’sfindings suggest that banks use sunk investments in quality, e.g., branch networks, toraise the costs of potential entrants and thereby affect market concentration. Our findingsare complementary to Dick’s, as we analyze rural markets. Furthermore, because werestrict attention to these smaller markets, we are able to formally combine an analysis ofbranching activity with a model of endogenous market structure, and thereby provide amore explicit link between local branch network size and the actual competitiveness ofmarkets (controlling for market size).
3 Empirically analyzing branching and market structure
A goal of our paper is to understand the relationship between bank branching decisions andmarket structure. Other researchers (at least as far back as White 1976) have investigatedthis issue by running a straightforward regression of the form:
Bj;m ¼ Zj;mg þ h 8; N*
m
� �þ mj;m ð1Þ
where Bj,m is the number of branches that institution j has in market m, Zj,m is a vector ofcontrol variables that may vary by firm and/or market, the vector N
*
m is a measure of marketstructure in market m, and μj,m represents the unobservable factors that influence observedbranching decisions.
Estimating a regression equation such as (1) assumes that the observed market structure,N*
m, is exogenous. It is reasonable, however, to expect that unobservable factors that affectthe returns to operating additional branches within a market may also affect that banking
6 A series of papers has examined the consequences of regulatory changes on dynamic efficiency (Jayaratneand Strahan 1998), entry (Amel and Liang 1992), merger and acquisition activity (Berger et al. 2004) andentrepreneurship (Kerr and Nanda 2008).7 For example, Hannan and Prager (2004) find that the share of deposits held by multimarket banks isnegatively related to deposit rates offered by single-market banks. Cohen (2004) rejects the hypothesis thatbanks and thrifts operate in independent product markets. Berger et al. (2007) focus on how efficiencyimprovements affected the competition between single-market and multimarket banks.8 The FDIC report goes on to say that “these results suggest that maintaining a branch network may be oneway in which smaller institutions can close the profitability gap with their larger rivals.” This notion mayhave deep roots in historical bank performance, as Carlson and Mitchener (2007) study of branching andDepression-era bank performance suggests. See also Hirtle (2005), which focuses on the returns to theoverall branch network of banks (across multiple local geographic markets), for more evidence on thepressure (particularly on multimarket banks) to increase their branching activity.
4 J Financ Serv Res (2010) 38:1–21
market’s overall concentration, or market structure. That is, we would expect there to besome correlation between μj,m and N
*
m. Without addressing such correlation, estimates ofthe g and f parameters would be biased.
To address this endogeneity problem, we employ a two-step estimation procedure thathas been adapted to industrial organization applications by Mazzeo (2002a), Watson (2009)and Manuszak and Moul (2008).9 The first step is a model that predicts observed marketstructure, N
*
m. As highlighted in the previous sections, our analysis will distinguish betweendifferent types of institutions: multimarket banks, single-market banks and thrifts.Therefore, our market structure measure N
*
m will incorporate the number and institutiontype of all the operating firms in the market. We will explicitly model the determination ofN*
m, and then use the parameter estimates from this model to calculate a series of correctionterms that are proportional to the correlation between μj,m and N
*
m. Once computed, weinsert these correction terms into (1) to offset any correlation between μj,m and N
*
m andthereby obtain unbiased estimates of g and f.10
The market structure model follows the approach of the empirical entry literaturedeveloped by Bresnahan and Reiss (1991) and Berry (1992). Specifically, as in Cohenand Mazzeo (2007), market structure is represented by an ordered triple (M, S, T)that represents the number of multimarket banks (M), single-market banks (S), andthrifts (T) that are operating. Within each institution type, firms are assumed to behomogeneous and make decisions on whether to operate based on a latent payoff functionof the form:
pI ;m ¼ XI ;mbI þ g qI ;N*
m
� �þ "I ;m ð2Þ
There is a separate payoff function for each institution type, I, consisting of marketcharacteristics, XI,m; the effect of competitors captured by N
*
m; and unobserved factors foreach type, εI,m. It is the potential correlation between the εI,m’s and μj,m that is the sourceof the endogeneity bias in Eq. 1. Note that the parameters βI and θI are permitted to varyby type—for example, the effects of multimarket competitors may be different for thrifts,single-market banks and other multimarket banks.
Translating the latent payoff functions into observed market outcomes requiresspecifying an equilibrium decision process for market participants. We assume aStackelberg game in which the (homogeneous) firms of each type make irrevocabledecisions about whether to operate in sequence. As they make these decisions, the firmsanticipate that potential competitors will subsequently make entry decisions once the earliermovers have committed to their choice. This characterization yields a Nash equilibrium inwhich: (1) all operating firms have positive payoffs (Panel A, below); (2) no firm of (anytype) would have positive payoffs if it were to enter (Panel B, below); and, (3) payoffs arehigher for each firm in the current configuration than for a hypothetical firm of either othertype in an alternative configuration that differed by that one firm’s institution type (Panel C,
9 These IO applications mirror the approach commonly employed in labor econometrics—see Heckman andMaCurdy (1986) for a discussion and several empirical applications.10 The idea is the same as the Heckman “two-step” estimator.
J Financ Serv Res (2010) 38:1–21 5

below). As such, an observed market structure N* ¼ M; S; Tð Þ implies the following set of
12 inequality restrictions on Eq. 2 will hold:
Panel A
pM ¼ XMbM þ g qM ;N* ¼ M ; S; Tð Þ
� �þ "M > 0
pS ¼ XSbS þ g qS ;N* ¼ M ; S; Tð Þ
� �þ "S > 0
pT ¼ XTbT þ g qT ;N* ¼ M ; S; Tð Þ
� �þ "T > 0
Panel B
pM ¼ XMbM þ g qM ;N* ¼ M þ 1; S; Tð Þ
� �þ "M < 0
pS ¼ XSbS þ g qS ;N* ¼ M ; S þ 1; Tð Þ
� �þ "S < 0
pT ¼ XTbT þ g qT ;N* ¼ M ; S; T þ 1ð Þ
� �þ "T < 0
Panel C
pM ¼ XMbM þ g qM ;N* ¼ M ; S; Tð Þ
� �þ "M > pS ¼ XSbS þ g qS ;N
* ¼ M � 1; S þ 1;Tð Þ� �
þ "S
pM ¼ XMbM þ g qM ;N* ¼ M ; S; Tð Þ
� �þ "M > pT ¼ XTbT þ g qT ;N
* ¼ M � 1; S; T þ 1ð Þ� �
þ "T
pS ¼ XSbS þ g qS ;N* ¼ M ; S; Tð Þ
� �þ "S > pM ¼ XMbM þ g qM ;N
* ¼ M þ 1; S � 1; Tð Þ� �
þ "M
pS ¼ XSbS þ g qS ;N* ¼ M ; S; Tð Þ
� �þ "S > pT ¼ XTbT þ g qT ;N
* ¼ M ; S � 1; T þ 1ð Þ� �
þ "T
pT ¼ XTbT þ g qT ;N* ¼ M ; S; Tð Þ
� �þ "T > pM ¼ XMbM þ g qM ;N
* ¼ M þ 1; S; T � 1ð Þ� �
þ "M
pT ¼ XTbT þ g qT ;N* ¼ M ; S; Tð Þ
� �þ "T > pS ¼ XSbS þ g qS ;N
* ¼ M ; S þ 1; T � 1ð Þ� �
þ "S
Under the assumption that an additional market participant always decreases payoffs andthat the decrease is larger if the market participant is of the same product type, a uniqueequilibrium exists.11 Therefore, 12 inequalities corresponding to a particular ordered triplemarket structure outcome (M, S, T) are satisfied for every possible realization of (εM, εS, εT)based on the data for the market in question and values for the payoff function parameters.A predicted probability for each of the possible outcomes is calculated by integrating f (εM,
εS, εT), which we specify as independent standard trivariate normal, over the regions of the{εM, εS, εT} corresponding to that outcome. Maximum likelihood selects the payoff
11 Mazzeo (2002b) contains proofs of existence and uniqueness of the equilibrium, as well as a discussion ofthe structural derivation of the underlying payoff functions.
6 J Financ Serv Res (2010) 38:1–21
function parameters that maximize the probability of the observed market configurationsacross the dataset. The likelihood function is:
L ¼YMm¼1
Prob M ; S; Tð ÞOmh i
ð3Þ
where M ; S; Tð ÞOm is the observed configuration of firms in market m.Having estimated the payoff function parameters, we can turn to the calculation of the
terms we will use to correct Eq. 1. Consider, for example, a market where N* ¼ 1; 1; 1ð Þ. In
this case, we can specify the troublesome correlation as follows:
E mj;m
�� "M ; "S ; "Tð Þm : N*
m ¼ 1; 1; 1ð Þh i
¼ rME "M jN*
m ¼ 1; 1; 1ð Þh i
þ rSE "S jN*
m ¼ 1; 1; 1ð Þh i
þ rTE "T jN*
m ¼ 1; 1; 1ð Þh i
ð4Þ
Using the estimated parameters from (3), we can back out estimates of the three expectationterms in Eq. 4. These are then inserted as data (for each market) into (1):
Bj;m ¼ Zmg þ h 8 ;N*
m
� �þ rM E "M jN
*
m ¼ 1; 1; 1ð Þh i
þ rS E "S jN*
m ¼ 1; 1; 1ð Þh i
þ rT E "T jN*
m ¼ 1; 1; 1ð Þh i
þ z j;m
ð5Þ
and the ρI become additional parameters to be estimated. This procedure ensures that ζj,m inEq. 5 now has mean zero. As a result, the regression isolates the relationship betweenbranching and competition from unobserved factors that may influence both the underlyingattractiveness of operating for the firms and common unobservables in the returns tobranching. In addition, we will recover estimates of the ρI’s which will have an economicinterpretation as discussed in Section 5.
The logic behind our parameter identification is illustrated in Fig. 1 (simplified byabstracting from institution types). To start, the g parameter is determined by comparingmarkets represented by points A and B, for which N and " are the same, but Z varies.Points C and D are used to identify the f and ρ parameters. Assuming that the diagonal linein the figure represents the true g, the value of " at point C will determine the estimate of ρ.The benefit of the correction procedure is that with the influence of r " accounted for in theregression, the estimate for f can appropriately come from the difference between points Dand E. Figure 2 shows how bias results in the uncorrected regression—here g is biasedupward and f is determined by the vertical distance between C and D.12 While this exampleshows f being biased downward without the correction, this is not generically the case. Thedirection of the bias depends on the sign of ρ, which is an empirical question for eachapplication.
12 To simplify the exposition, we omit point B from Figure 2. This slightly changes the magnitude, but notthe direction of the bias, in the ϕ and γ coefficients.
12 To simplify the exposition, we omit point B from Figure 2. This slightly changes the magnitude, but notthe direction of the bias, in the f and g coefficients.
J Financ Serv Res (2010) 38:1–21 7

Employing a structural approach for addressing market structure endogeneity isparticularly useful in cases where the potential correlation is between competitiveoutcomes and market structure. More traditional instrumental variable methods arehampered by the difficulty of finding appropriate instruments in this context (seeManuszak and Moul (2008) for a detailed discussion of this point and the pitfalls ofincorporating ad hoc exclusion restrictions). While the resulting econometric identifica-tion relies on functional form, our particular application differs from more traditionalselection models in which some may argue that the underlying distributional assumptionsare arbitrary. In our context, a well-specified game that determines the equilibriumconfiguration of firms introduces a fundamental non-linearity into the market structureequation (through the 12 threshold inequalities introduced above). The behavioralassumptions underlying the game combine the discrete decisions of potential firms andthe strategic interaction among them to yield the threshold conditions associated with aparticular configuration of operating institutions. Thus, the market structure equation is
Z
B
1 2
-
3
NZB
0,1: NA
0,1: NB
1,1: NC
0,2: ND
E
Fig. 1 Graphical representationof parameter interpretation: cor-rected version
Z
B
1 2 3
-
NZB
0,1: NA
1,1: NC
0,2: ND
Fig. 2 Graphical representationof parameter interpretation:uncorrected version
8 J Financ Serv Res (2010) 38:1–21

inherently non-linear—no comparable linear market structure model could be constructedin this case.13
While establishing a link between entry behavior and branching decisions in acompetitive environment, the proposed framework contains some important caveats thatshould be noted. Our analysis assumes that the market structure of operating institutions(and their branches) is an equilibrium during each observation period. This abstracts fromthe reality that market structure equilibria are arrived at through dynamic processes wheresunk costs are present and path dependence likely contributes to outcomes. Unfortunately,dynamic structural models in industrial organization impose Markov Perfection in theirequilibrium assumptions to permit estimation—ruling out the type of historical consid-erations that would be most interesting to study.14 Similarly, models that accommodatemore possible discrete options for competitors may allow branching to be an explicit part ofthe optimization (which it almost certainly is in reality), but these models do not alsoanalyze entry behavior.15 Since our goal is to address potential correlation betweenbranching and market presence, making this compromise and not directly estimatingbranching behavior seems appropriate. As the econometric techniques available inempirical industrial organization become more sophisticated, incorporating more of thesereal world concerns into an empirical analysis will become more possible.
4 Data
We use data on institutions and their branch networks from 1,882 non-MSA labor marketareas (LMAs) as of June 30, 2004. To represent individual observations, geographicmarkets must be defined in such a way that (1) all the firms in the geographic area competewith each other and (2) consumers do not typically use firms outside their own geographicarea. To accomplish (1), we focus on less populated geographic markets, which are unlikelyto contain distinct submarkets. We therefore eliminated all urbanized areas (MSAs) andrural areas with relatively high population (LMAs with over 115,000 residents). The Bureauof Labor Statistics defines LMAs as integrated economic areas, combining contiguouscounties into a single LMA if at least 15 percent of the workers from one county commutefor work to the other. Using LMAs (as opposed to counties) gives us more confidence thattwo neighboring markets are indeed competitively distinct.16
To construct the dependent variable for each step of the model—the number ofinstitutions of each of the three types within each LMA, and the number of branchesbelonging to each of those institutions—we use data from several sources. The FDIC
13 That is, under our behavioral assumptions a system of linear equations would not be capable of identifyingthe underlying structural parameters of the payoff function that determines the equilibrium configuration offirms. As such, X and Z are the same for the two steps in our analysis. While not required for identification,the market structure model may contain instruments that are not included in the second-stage regression. Thefollowing section provides additional details about our empirical specification.14 See, for example, Bajari et al. (2007), Aguirregabiria and Mira (2007) and the references these papers cite.15 Thus, while Ishii’s (2008) paper on ATM network competition would seem to be a direct analog, her paperanalyzes competition in ATM deployment among the existing banks in the market only. The relationshipbetween the number of ATMs and the number of existing banks cannot be addressed in this type of model.See also Pakes et al (2007).16 In addition, these markets have far fewer competitors than do MSAs, making the endogenous marketstructure model more tractable. Importantly, many of the mergers that raise competitive concerns withregulators do so because of their effect on the market structure of these smaller markets.
J Financ Serv Res (2010) 38:1–21 9

Summary of Deposits contains location information on all banks and their branches. Weclassified each bank and branch within its LMA market: to be classified as a single-marketbank, an institution must have a bank charter and receive at least 80 percent of its depositsfrom branches in that market; otherwise, the bank was classified as a multimarket bank.17
Analogous information about operating thrifts was obtained from the Office of ThriftSupervision’s Branch Office Survey. Table 1 shows the distribution of firm configurationsamong the LMA markets in our dataset. Each panel of the table represents a particularnumber of thrifts in the market, with the rows and columns of each panel referring to single-market banks and multimarket banks, respectively. The numbers in the table represent thenumber of markets in which the operating firms follow the given configurations—forexample, there are 64 markets that include one multimarket bank, one single-market bankand zero thrifts.18 Table 2 summarizes the branching data for the institution/marketcombinations in the dataset. Note that in approximately 55 percent of the cases a firmoperates only one branch (this includes all the active firms in approximately 19 percent ofour markets). About ten percent of the firms have more than three branches in a particularmarket. Differences in branching across different market configurations will be exploited inthe empirical analysis.19
The control variables are summarized in Table 3. These variables represent marketcharacteristics that may contribute to the attractiveness of operation for financial institutionsas well as exogenous factors that may influence the decision of banks to open additionalbranches in a particular LMA. These variables include: (1) population; (2) the number ofnon-farm establishments; (3) the number of farms; (4) per capita income; (5) a dummyvariable for LMAs in the five states that still had some restrictions on branching activity asof 2004;20 and (6) a dummy variable indicating whether the LMA borders an MSA. Thesources for these variables are the Census Bureau, the Agricultural Census, and the Bureau
17 This definition is consistent with previous papers that distinguish “single-market” banks. Note that a bankwith 90 percent of its deposits in market A and 10 percent in market B would, according to this definition, beclassified as a single-market bank in market A and a multimarket bank in market B. This reflects the viewthat the decision to operate in market B would be significantly more affected by the role of the branch in B inthe bank’s overall network, as opposed to in market A, where the presence of any branches in market Bwould be less important.18 In our estimation of the endogenous market structure model we have collapsed the distribution ofmarkets from above for each of the three categories—that is, all markets with three or more thrifts aretreated as if they have at least three, all markets with four or more single-market banks are treated as ifthey have at least four, and all markets with six or more multimarket banks are treated as if they have atleast six. This reduces the complexity of the estimation without appreciably influencing the results; seeCohen and Mazzeo (2007).19 Distinguishing between single-market and multimarket bank types has a tradition in the literature (seeCohen and Mazzeo (2007) and the references therein); we choose to employ this distinction because it is veryclearly reflects an endogenous decision made by banks. However, categorizing banks by an outcome variablesuch as size does have some conceptual appeal, as theories of differentiation in lending and funding behavioroften relate to bank size. In addition, large banks may be more likely to have brand recognition (see Bergerand Dick 2007 as well as DeYoung and Ors 2009) that can affect entry and competition. In our empiricalsetting there is considerable overlap between the single-market/multimarket and small/big institutiondistinction, reinforcing our results. Some supporting tables are provided in Appendix A.20 See A Profile of state-chartered banking (2004/2005) published by the Conference of State BankSupervisors. Such restrictions included limiting the number of branches a bank is permitted to operate withina county as well as within a certain distance from its, or a rival’s, main office—depending on countypopulation.
10 J Financ Serv Res (2010) 38:1–21

of Economic Analysis.21 Note that we maintain the assumption that these factors are notinfluenced themselves by bank entry and branching activity.22
5 Results
This section presents and discusses the estimated parameters that measure the relationshipbetween competition and branching activity in our sample of rural banking markets. We
Table 1 Market configurations
Multimarket banks
0 1 2 3 4 5 6+ Total Thrifts=0
Single-market banks 0 14 86 116 106 92 58 86 558
1 19 64 92 66 62 38 48 389
2 12 31 30 27 33 20 24 177
3 7 5 11 23 7 8 14 75
4+ 2 5 13 13 9 7 27 76
Total 54 191 262 235 203 131 199 1,275
Multimarket banks
0 1 2 3 4 5 6+ Total Thrifts=1
Single-market banks 0 0 6 14 32 26 25 51 154
1 3 12 16 18 20 12 46 127
2 4 4 9 11 13 12 28 81
3 0 2 9 4 7 11 13 46
4+ 1 3 1 7 9 16 16 53
Total 8 27 49 72 75 76 154 461
Multimarket banks
0 1 2 3 4 5 6+ Total Thrifts=2
Single-market banks 0 0 1 1 6 3 6 19 36
1 2 0 2 5 9 4 13 35
2 1 0 1 2 3 1 6 14
3 0 2 1 1 2 2 5 13
4+ 0 0 1 1 1 3 11 17
Total 3 3 6 15 18 16 54 115
Multimarket
0 1 2 3 4 5 6+ Total Thrifts=3+
Single-market banks 0 0 0 0 1 1 0 4 6
1 0 0 0 0 0 0 4 4
2 0 0 2 1 0 0 2 5
3 0 0 0 0 1 1 6 8
4+ 0 0 1 0 1 0 6 8
Total 0 0 3 2 3 1 22 31
21 The continuous explanatory variables (population, establishments, farms and per capita income) are scaledto facilitate estimation in the results that follow. The value for each variable will equal that market’sobservation divided by the sample mean for that variable across the 1,882 markets in the dataset.22 Though this assumption might not be completely innocuous in this context—see, for example, Black andStrahan (2002).
J Financ Serv Res (2010) 38:1–21 11

begin with a brief overview of the results from the market structure model. Then, weproceed to the branching regressions, whose parameter estimates demonstrate the morenuanced competitive effects on branching. These results highlight the importance ofaddressing market structure endogeneity in the analysis of branching and distinguishing thecompetitive effects of the defined institution types.
5.1 Market structure model
We begin with a brief review of the results from the market structure model, whichestimates the latent payoff function parameters in Eq. 2. Note that we specify separateeffects for each type of depository institution in each market (multimarket banks, single-market banks and thrifts), since our likelihood is based on the observed triples (M,S,T) ofextant firms across the markets in our dataset. The g qI ;N
*
m
� �term from Eq. 2 includes
individual competitive effect dummy variables whose parameters represent the incrementaleffects of additional competitors; Table 4 lists the effects estimated. Critically, separateparameters are estimated for the effect of each of the three types of competitors onmultimarket banks, single-market banks and thrifts.
Table 4 displays the competitive effects in the top panel and the control variables below.These estimates indicate the relative effect on the returns to operating each type of financialinstitution under different market conditions and with various sets of competitors. For thecompetitive effects, the key result is the large difference between the impact of same-typeand different-type institutions. For example, the effect of the first multimarket competitoron multimarket banks (−1.111) is more than three times the effect of the first single market
Table 2 Distribution of branches per market, by type
# of branches Type
Multimarket banks Single-market banks Thrifts All
1 53% 55% 68% 55%
2 25% 25% 21% 25%
3 11% 11% 7% 11%
4 5% 5% 2% 5%
5 3% 2% 1% 2%
6+ 3% 2% 1% 2%
Table 3 Summary statistics for explanatory variables
Mean Med Std Dev Min Max
Population 24,315 17,119 21,892 51 114,424
Establishments 567 389 556 1 5,305
Farms 683 565 526 1 8,249
Per capita income (in 000s) 24,599 24,102 4,796 11,362 89,471
State branching restriction dummy 0.19 0 0.39 0 1.00
Border market dummy 0.56 1.00 0.50 0 1.00
N=1,882 markets
12 J Financ Serv Res (2010) 38:1–21

competitor, while the effect of the first thrift is negligible (−0.020).23 The incrementaleffects of additional competing firms are smaller than for the first competitor; for example,the effect of the second multimarket competitor on multimarkets is roughly four-fifths theeffect of the first (−1.111 vs. −0.895).
The control-variable parameters indicate the demographic conditions under which anoperating institution of each type will be more or less attractive. For example, the numberof establishments has a positive and significant impact on all three types, but the relativemagnitude of the coefficients reveals that multimarket banks benefit from local commercialactivity the most. Multimarket banks are also most affected, positively, by proximity tourbanized areas. Single-market banks (but not thrifts) tend to operate more in markets withsubstantial agricultural activity. Branching restrictions have a significant adverse effect onmultimarkets (larger than the effect of having a second single-market bank competitor), buta significant positive effect on single-market banks. This suggests that the option tobranch is a particularly important consideration for multimarket banks, which we willrevisit in our discussion of branching strategies of the different types of institutions. Finally,combining the control variables and the relative value of the three sets of intercept terms
Table 4 Parameter estimates from endogenous market structure model. (Asymptotic t statistics inparentheses)
Multimarket bankpayoffs
Single-market bankpayoffs
Thrift payoffs
Coef. t-stat Coef. t-stat Coef. t-stat
First MM competitor −1.111 (−16.65) −0.278 (−1.59) −0.050 (−0.27)Second MM competitor −0.895 (−21.16) – – – –
Additional MM competitors −0.747 (−39.72) −0.098 (−3.04) −2.E-08 (−0.00)First SM competitor −0.304 (−3.64) −0.916 (−29.07) −0.003 (−0.03)Second SM competitor – – −0.624 (−19.48) – –
Additional SM competitors −0.126 (−3.30) −0.504 (−14.27) −1.E-09 (−0.00)First thrift competitor −0.020 (−0.31) −2.E-06 (−0.00) −1.178 (−24.65)Second thrift competitor – – – – −0.920 (−11.58)Additional thrift competitors −3.E-01 (−3.32) −5.E-08 (−0.00) – –
Population (000s) 0.009 (2.79) −0.009 (−2.79) 0.005 (1.71)
Establishments (000s) 2.2355 (17.27) 0.543 (4.17) 0.617 (5.77)
Farms (000s) 0.971 (14.84) 1.120 (18.71) 0.264 (3.55)
Per capita income ($000s) 0.017 (3.40) 0.032 (5.39) 0.031 (4.21)
Border market dummy 0.097 (1.77) −0.130 (−2.37) −0.022 (−0.34)State branching restriction dummy −0.492 (−6.98) 0.204 (2.60) −0.010 (−0.11)Intercept 0.765 (5.31) −0.718 (−3.16) −1.841 (−7.34)
Population, establishments, farms and percapita income are expressed as percentages of sample mean
MM multimarket bank, SM single-market bank
N=1,882
Log Likelihood = −6,749.8
23 The comparisons are similar for the payoffs of single-market banks (–0.916 vs. −0.278 and 0) and thrifts(−1.178 vs. −0.050 and −0.003).
J Financ Serv Res (2010) 38:1–21 13

indicates that, all else equal, multimarket banks would earn the highest baseline payoffsCM ¼ 2:94 vs: CS ¼ 1:01 vs: CT ¼ �:45ð Þ.24
5.2 Branching regressions
Most importantly, the estimates presented in Table 4 allow us to calculate the correspondingerror-term predictions for each market that are used to estimate Eq. 5. Table 5 displays theresults from the second step branching regressions, run separately for institutions of each ofthe three types in the three vertical panels of the Table. In each panel, an observation is aninstitution (of that type)/LMA combination, and the dependent variable is the number ofbranches the institution operates in that LMA. We have implemented an ordered-probitspecification for estimating these equations; this treats the branching variable as a discretechoice and can more easily capture potential differences between institutions with a singlebranch (a prerequisite for operating in the market) and those with more than one branch.25
The likelihood for each observation represents the probability that the error term (assumedto be normal) lies in the region that is consistent with the observed number of branches forthat bank/market, given the parameters. We have reported the marginal effect of eachregressor on the expected number of branches per firm/market evaluated at the samplemean for the respective type26; the expected number of branches is the sum over the totalnumber of branches of the probability of an institution having a particular number ofbranches multiplied by that number of branches. There are two columns of results in eachpanel, a base case corresponding to Eq. 1 in which no endogeneity corrections are madeand a version in which the estimated error terms from the market structure model areincluded as regressors, as in Eq. 5.
The estimated marginal effects representing the impact of competitors on the expectednumber of branches are listed in the top three rows of Table 5. We have specified thecompetitive effects to be linear by product type; therefore, we have nine (pairs) of estimatedparameters corresponding to the effect of additional competitors of each type on the numberof branches operated by multimarket banks, single-market banks and thrifts, respectively.27
The top row of Table 5, describing the impact of multimarket competitors, is of particularinterest. Critically, the endogeneity correction matters here substantially—the estimates aregenerally negative and significant in the unadjusted results, but positive and significant inthe right-hand column of each pair which reflects the adjustment for potential endogeneity.In particular, the adjusted results suggest that the presence of an additional multimarketbank increases the expected number of branches for a given multimarket bank, single-market bank, or thrift by about .16, .10, and .16, respectively. On the other hand, theunadjusted results suggest that an additional multimarket competitor reduces the expectednumber of branches for a given multi- or single-market bank by about .05 and .04,
24 These numbers reflect payoffs assuming that each type of firm is a monopolist operating in a market thatborders an MSA, has branching restrictions, and where the other control variables are at the sample mean.Positive payoffs correspond to a prediction of entry (operation) in a market; thrifts appear as the effects of theexplanatory variables become more strongly positive (to offset the negative baseline payoffs).25 The results are qualitatively similar if we treat the dependent variable as linear or employ a Tobitspecification. We note that the estimates on the market presence unobservables should be interpreted as afunction of the correlation between market presence and the branching unobservables rather than the actualcorrelation.26 The marginal effect associated with the dummies for markets bordering MSAs and the presence ofbranching restrictions correspond to a change in the dummy variable from zero to one.27 We report the linear specification of the competitive effects for clarity. An alternative specification withincremental competitive effects (as in the market structure model) produced similar results.
14 J Financ Serv Res (2010) 38:1–21

Tab
le5
Estim
ated
marginaleffectsfrom
orderedprobitmodel.E
ffecto
nnumberof
branches
perfirm
/marketfor
changesin
explanatoryvariables,evaluatedatsamplemeanfor
each
type.(A
symptotic
tstatisticsin
parentheses)
Multim
arketbank
branches
Single-marketbank
branches
Thriftbranches
Unadjusted
Adjusted
Unadjusted
Adjusted
Unadjusted
Adjusted
Coef.
t-stat
Coef.
t-stat
Coef.
t-stat
Coef.
t-stat
Coef.
t-stat
Coef.
t-stat
MM
competitors
−0.048
(−3.79
)0.159
(5.85)
−0.035
(−2.03)
0.096
(2.11)
0.055
(2.48)
0.16
1(3.57)
SM
competitors
−0.100
(−8.57
)−0
.084
(−1.14)
−0.151
(−6.85)
−0.136
(−2.14
)−0
.042
(−1.93)
0.05
8(0.48)
Thriftcompetitors
−0.042
(−2.02
)−0
.165
(−1.35)
−0.055
(−1.53)
−0.316
(−1.52
)−0
.051
(−1.32)
−2.788
(−3.20)
MM
marketpresence
unob
servable
−0.337
(−8.74)
−0.198
(−3.20
)−0
.145
(−2.44)
SM
marketpresence
unobservable
0.009
(0.11)
−0.017
(−0.17
)−0
.112
(−0.76)
Thriftmarketpresence
unobservable
0.112
(1.13)
0.231
(1.41)
2.776
(3.17)
Pop
ulation(000s)
0.016
(9.09)
0.011
(6.29)
0.01
3(3.67)
0.011
(3.10)
0.009
(3.27)
0.02
1(4.07)
Establishm
ents(000s)
0.123
(1.69)
0.053
(0.61)
0.128
(0.88)
0.149
(0.82)
−0.038
(−0.38)
1.36
6(2.81)
Farms(000s)
0.065
(2.08)
−0.085
(−0.89)
−0.008
(−0.21)
−0.100
(−1.27
)−0
.015
(−0.26)
0.46
2(1.89)
Per
capita
income($00
0s)
−0.002
(−0.37
)−0
.006
(−1.31)
−0.003
(−0.51)
−0.003
(−0.43
)−0
.006
(−0.81)
0.06
8(2.61)
BorderMarketDum
my
−0.040
(−1.26
)−0
.082
(−2.56)
−0.017
(−0.33)
−0.058
(−1.11)
−0.151
(−2.46)
−0.196
(−3.11)
State
Branching
Restrictio
nDum
my
0.029
(0.65)
0.142
(2.95)
−0.029
(−0.47)
0.035
(0.50)
−0.156
(−2.11)
−0.146
(−1.90)
PsuedoR-squ
ared
0.0502
0.0577
0.04
470.0500
0.0599
0.06
89
Observatio
ns7,371
2,32
979
3
Observatio
nswith
1branch
3,923
1,06
054
2
Pop
ulation,
establishm
ents,farm
sandpercapita
incomeareexpressedas
percentagesof
samplemean
MM
multim
arketbank
SMsing
le-m
arketbank
J Financ Serv Res (2010) 38:1–21 15

respectively (there is a .06 expected increase per thrift competitor). While statisticallysignificant, we also note that these effects as estimated would be of minimal economicsignificance, particularly given the relatively low number of institutions in our samplemarkets.
Correspondingly, the estimated coefficients on the terms representing the correlationsbetween the branching and the multimarket payoff function errors are negative andsignificantly different from zero (in the next set of rows in the table). It appears thatthere is a strong enough negative correlation between the unobservables associated withmultimarket bank presence and with branching to significantly bias the uncorrectedresults. Competition from single-market banks and thrifts, however, is associated withfewer branches per firm. Note that these results contrast with the market structuremodel estimates, in which the important distinction was between undifferentiated anddifferentiated competitors (though the presence of thrifts does not have a statisticallysignificant effect on the branching decisions of single-market banks, and vice versa).Here, the particular product type of the competitor is the key distinguishing factor inthe effect of competitors on branching—multimarket competition induces a differentstrategic response (from all types) as compared with single-market bank and thriftcompetitors.
We interpret the adjusted regressions to strongly suggest that the market conditions thatare conducive to operating multimarket banks induce institutions (of all types) to expandtheir branch networks. In contrast this competitive response is not optimal where single-market banks or thrifts are more likely to operate. Just as competition with operatingmultimarket banks induces additional branching, incumbent firms may also be able todiscourage potential multimarket bank entrants from joining particular local markets byincreasing the size of their own branch networks. We cannot infer this behavior directly, butour results are nonetheless consistent with a scenario in which incumbent firms thatanticipate further entry by multimarket banks (in markets with characteristics that wouldmake operating multimarket banks particularly attractive) add additional branches, andmultimarket banks correspondingly choose not to enter.28 In that case, we would observethe incumbent firms offering more branches than expected and markets containing fewermultimarket banks than expected, which is consistent with the estimated negativecorrelation between the branching unobservable and the multimarket bank presenceunobservable.
A simple regression of branches on market structure would indicate that institutionsoperate more branches in more concentrated markets (i.e., negative parameter estimates), tothe extent that markets in which additional branching and a lack of multimarket banks areprevalent. The uncorrected results would therefore obscure the fact that while multimarketbanks’ underlying behavior is to compete in branches, this behavior induces other types todo so as well. Once we account for endogenous market structure, this is revealed. Thoughour methodology cannot allow us to distinguish it from other possible explanations, thecorrelation it reveals is consistent with the interpretation that the competitive implicationsare strong enough to permit an institution to use branching investments to pre-empt the
28 This may reflect the differentiated strategies of these types of institutions—single-market banks and thriftsfocus on providing more personalized service, while multimarket banks have broader branch networks bynature. By expanding their branch networks, incumbent single-market banks may be effectively co-opting thefavored strategy of multimarket banks where conditions for their entry appear attractive.
16 J Financ Serv Res (2010) 38:1–21
entry of multimarket banks.29 Crucially, these branching strategies appear to dependcritically on the identity of (potential) competitors—only the multimarket banks areassociated with more branching activity by operating institutions.30
The remainder of Table 5 presents the estimated control variable parameters regardingthe baseline propensity of financial institutions to establish additional branches in a market.While the estimated effects of the control variables generally have the expected signs, themagnitudes are reasonably small. Population is the only control variable that is statisticallysignificant across the three types, with the adjusted regression parameter values indicatingthat a 10,000 person increase in market population is associated with a little more than atenth of an additional branch per operating multimarket and single-market bank.Interestingly, higher income residents do not correlate with more branching activity, eventhough income predicts entry of each type of firm. The branching restriction dummyestimate is unexpectedly positive for multimarket banks, but the increase in the coefficientin the adjusted regression (and the results from the market structure model) may indicatethat entry of multimarket banks is being deterred by these regulatory rules.
Taken together, the results from Table 5 suggest important strategic interactions betweenbranching investments, competition and product differentiation. The comparison between thefirst and second columns in each pair of results demonstrates the importance of accounting formarket structure endogeneity in this context. Advice from industry analysts and regulatoryagencies based on the correlation between branches and profitability that fails to consider thepotential effects of branching on market structure may result in ineffective investments bycommunity banks and thrifts (i.e., in markets where multimarket banks already operate). Inparticular, the profound difference between multimarket bank competition and other financialinstitutions is highlighted by these results. Policy makers may be interested in this market-levelconsequence of multimarket bank competition. Along with the efficiency benefits other studieshave documented, our results suggest that when multimarket banks are present, consumers areprovided with more branch locations than would be expected in a similar economicenvironment or if the market consisted of only single-market banks and thrifts. Given theimpact of the market structure endogeneity correction, the mere threat of entry by multimarketfirms may be sufficient to induce this response.
6 Conclusion
This paper adds to the relatively small empirical literature that explores the connectionbetween the investment strategies of firms and the amount of competition they face, byexamining the decision of financial institutions regarding the extent of their local branchingnetworks. We acknowledge the importance of product heterogeneity in this industry bydistinguishing between multimarket banks, single-market banks and thrift competitors inthe analysis. By doing so, we uncover interesting insights about investment strategies in thepresence of heterogeneous competitors. While competition from traditional single-marketbanks and thrifts is associated with smaller branching networks, all types of institutionstend to have more branches when they face (or could potentially face) multimarket banks as
29 To be clear, while we can address market structure endogeneity, our methodology cannot allow us todistinguish the preemption hypothesis from others that could potentially explain the estimated correlation.We intend to pursue this in future work.30 Of course, competition from single-market banks and thrifts may induce additional investments as well—just along different dimensions. Unfortunately, there is no data (such as access to bank executives orfamiliarity of bank employees with regular customers) that would enable us to address this possibility.
J Financ Serv Res (2010) 38:1–21 17

their competitors. These insights are lost if the analyst (1) ignores product differentiationamong these three types of firms and (2) fails to account for the endogeneity ofcompetitors’ presence when analyzing branching decisions. The empirical results alsoprovide a powerful demonstration for why (2) is particularly important in an applicationlike this where market structure could affect investment and vice versa—failing to accountfor the endogeneity of market structure would have obscured the key result relatingmultimarket bank competition and branch network expansion. This sort of analysis will becrucial as empirical industrial organization researchers continue to explore applications inwhich investment strategies and market structure are interrelated.
The empirical analysis undertaken in this paper makes inferences based on differencesamong a cross-section of banking markets, all of which are observed at a single moment intime. While this identification strategy is informative, it does not fully incorporate thedynamic process in which markets become more concentrated over time as firms enter andexit the market and make investments in additional branches. An important extension to thisanalysis would incorporate data on the timing of firm entry, as well as the opening ofadditional branches within markets where institutions are already operating. Such anextension could potentially verify that incumbents use branching to pre-empt the entry ofmultimarket banks, as suggested by our results. Finally, it is important to note that while wehave demonstrated correlations between investment in branches and market competition,the effects on consumer welfare are ambiguous. Consumers may face lower or higherdeposit and loan rates depending on competition, which will trade off against the effects ofdifferent type of institutions having more (or fewer) branches.
Acknowledgments We thank Dean Amel, Leemore Dafny, Shane Greenstein, Tim Hannan, Robin Prager,and participants at the 2005 Econometric Society World Congress, the 2004 IOS conference, the SouthernEconomics Association conference, and seminars at Arizona, Indiana, Harvard/MIT, Toronto, Stanford,Columbia, Dartmouth (Tuck), the Department of Justice, the Federal Reserve Bank of Kansas City and theFederal Reserve Board for helpful comments. All errors are the responsibility of the authors.
Appendix A
As discussed in Section 4 of the paper, our assignment of banks into multimarket or single-market categories reflects (1) differences between banks in these two categories thatpotentially affect costs and consumer demand differently and (2) the fact that the number ofmarkets in which it operates is an explicit endogenous decision made by banks. In terms ofthe first criterion, our definitions may be approximating a related phenomenon—it may notbe that consumers care about the number of markets in which a bank is operating, but thatthe distinction between multimarket and single-market bank proxies for bank size.Classifying banks based on their size does have conceptual appeal, as theories ofdifferentiating in lending and funding behavior often relate to bank size. In addition, largebanks may be more likely to have brand recognition (see Berger and Dick 2007; DeYoungand Ors 2009) that can affect entry and competition. Unfortunately, categorizing based onbank size is problematic for a number of reasons—in particular, because size is an outcomevariable rather than an endogenous choice made by firms. Furthermore, it is difficult toestablish an appropriate size cut-off to separate banks into discrete categories based on size(which is required, given our econometric framework). Nevertheless, we feel moreconfident in employing a multimarket vs. single-market categorization since we are able todocument considerable overlap between this categorization and one based on sizeoutcomes. By any measure, single-market banks in our dataset are considerably smaller
18 J Financ Serv Res (2010) 38:1–21

than multimarket banks. The tables below provide evidence of the extensive similaritybetween the two definitions in our dataset.
Table 6 presents a summary of the distribution of assets and deposits across the banks inthe dataset. While there are clearly some smaller multimarket banks, the multimarket banksare substantially larger—as measured by either assets or by deposits—on average andacross the distribution.
For another look, Table 7 below divides banks (at the Bank Holding Company and at theBank levels) into discrete asset categories. While there are some deviations, there would bebroad consistency if (for example) a cutoff of $100 million in assets were used todistinguish “small” and “big” banks—76% on banks would be classified into the samecategory at the Bank Holding Company level and 72% at the bank level.
Table 6 Size distributions by defined institution types
Single-market banks Multimarket banks
Assets
Mean 68,306 2,070,397
Standard deviation 62,543 21,200,000
10th percentile 17,849 49,574
25th percentile 28,969 83,248
Median 50,702 155,750
75th percentile 84,764 342,959
90th percentile 136,938 867,084
Deposits
Mean 56,258 188,569
Standard deviation 50,510 844,100
10th percentile 14,985 19,284
25th percentile 24,513 41,193
Median 41,944 81,907
75th percentile 70,726 156,669
90th percentile 113,701 301,851
Table 7 Count of institutions by asset-size category
Asset size category Bank holding company level Bank level
Multimarket banks Single-market banks Multimarket banks Single-market banks
<100 million 608 1,505 722 1,879
100–250 million 713 313 759 412
250–500 million 377 28 375 39
500–750 million 134 2 128 6
750 million–1 billion 66 0 57 0
1–1.5 billion 58 0 20 0
1.5–2 billion 26 0 25 0
Over 2 billion 132 0 120 0
0
Total 2,112 1,848 2,236 2,336
J Financ Serv Res (2010) 38:1–21 19
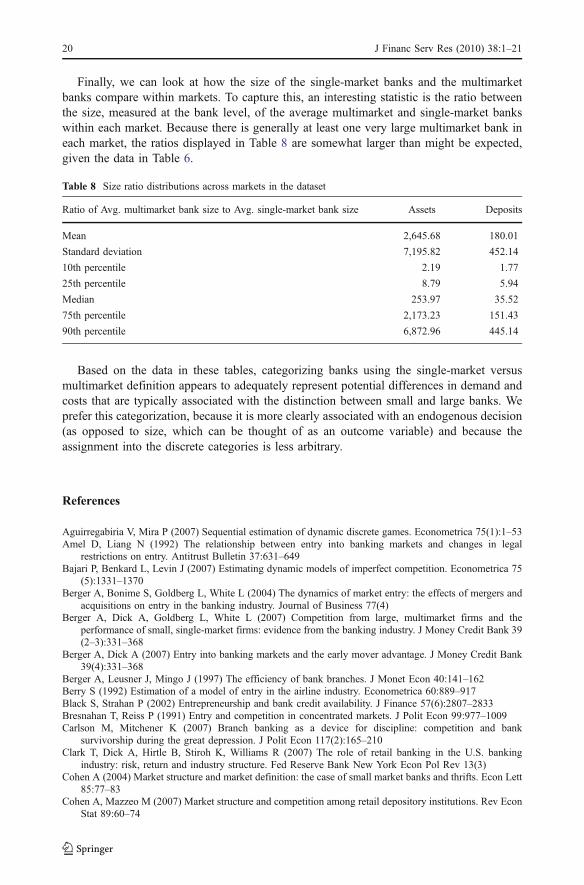
Finally, we can look at how the size of the single-market banks and the multimarketbanks compare within markets. To capture this, an interesting statistic is the ratio betweenthe size, measured at the bank level, of the average multimarket and single-market bankswithin each market. Because there is generally at least one very large multimarket bank ineach market, the ratios displayed in Table 8 are somewhat larger than might be expected,given the data in Table 6.
Based on the data in these tables, categorizing banks using the single-market versusmultimarket definition appears to adequately represent potential differences in demand andcosts that are typically associated with the distinction between small and large banks. Weprefer this categorization, because it is more clearly associated with an endogenous decision(as opposed to size, which can be thought of as an outcome variable) and because theassignment into the discrete categories is less arbitrary.
References
Aguirregabiria V, Mira P (2007) Sequential estimation of dynamic discrete games. Econometrica 75(1):1–53Amel D, Liang N (1992) The relationship between entry into banking markets and changes in legal
restrictions on entry. Antitrust Bulletin 37:631–649Bajari P, Benkard L, Levin J (2007) Estimating dynamic models of imperfect competition. Econometrica 75
(5):1331–1370Berger A, Bonime S, Goldberg L, White L (2004) The dynamics of market entry: the effects of mergers and
acquisitions on entry in the banking industry. Journal of Business 77(4)Berger A, Dick A, Goldberg L, White L (2007) Competition from large, multimarket firms and the
performance of small, single-market firms: evidence from the banking industry. J Money Credit Bank 39(2–3):331–368
Berger A, Dick A (2007) Entry into banking markets and the early mover advantage. J Money Credit Bank39(4):331–368
Berger A, Leusner J, Mingo J (1997) The efficiency of bank branches. J Monet Econ 40:141–162Berry S (1992) Estimation of a model of entry in the airline industry. Econometrica 60:889–917Black S, Strahan P (2002) Entrepreneurship and bank credit availability. J Finance 57(6):2807–2833Bresnahan T, Reiss P (1991) Entry and competition in concentrated markets. J Polit Econ 99:977–1009Carlson M, Mitchener K (2007) Branch banking as a device for discipline: competition and bank
survivorship during the great depression. J Polit Econ 117(2):165–210Clark T, Dick A, Hirtle B, Stiroh K, Williams R (2007) The role of retail banking in the U.S. banking
industry: risk, return and industry structure. Fed Reserve Bank New York Econ Pol Rev 13(3)Cohen A (2004) Market structure and market definition: the case of small market banks and thrifts. Econ Lett
85:77–83Cohen A, Mazzeo M (2007) Market structure and competition among retail depository institutions. Rev Econ
Stat 89:60–74
Table 8 Size ratio distributions across markets in the dataset
Ratio of Avg. multimarket bank size to Avg. single-market bank size Assets Deposits
Mean 2,645.68 180.01
Standard deviation 7,195.82 452.14
10th percentile 2.19 1.77
25th percentile 8.79 5.94
Median 253.97 35.52
75th percentile 2,173.23 151.43
90th percentile 6,872.96 445.14
20 J Financ Serv Res (2010) 38:1–21

Dafny L (2005) Games hospitals play: entry deterrence in hospital procedure markets. J Econ ManageStrategy 14:513–542
Dick A (2005) Market size, service quality and competition in banking. J Money Credit Bank 39(1):49–81DeYoung R, Ors E (2009) Informational, competitive, and strategic advertising: evidence from U.S. thrift
institutions. Mimeo. University of KansasEllison G, Ellison SF (2000) Strategic entry deterrence and the behavior of pharmaceutical incumbents prior
to patent expiration. Mimeo, Massachusetts Institute of TechnologyHannan T, Prager R (2004) The competitive implications of multimarket bank branching. J Bank Financ
28:1889–1914Hamilton B, McManus BH (2005) Technology diffusion and market structure: evidence from infertility
treatment markets. Washington University, MimeoHeckman J, MaCurdy T (1986) Labor econometrics. In: Griliches Z, Intrilligator M (eds) Handbook of
econometrics. Elsevier, New YorkHirtle B (2005) The impact of network size on bank branch performance. Federal Reserve Bank of New York
Staff Report #211Ishii J (2008) Interconnection pricing, compatibility, and investment in network industries: ATM networks in
the banking industry. Stanford University, MimeoJayaratne J, Strahan P (1998) Entry restrictions, industry evolution and dynamic efficiency: evidence from
commercial banking. J Law Econ 41:239–273Judd KL (1985) Credible spatial preemption. Rand J Econ 16:153–166Kerr W, Nanda R (2008) Banking deregulation, financing constraints and entrepreneurship. Harvard
Business School Working Paper 07–033Lieberman M (1987) Post entry investment and market structure in the chemical processing industry. Rand J
Econ 18:533–549Manuszak M, Moul C (2008) Prices and endogenous market structure in office supply stores. J Ind Econ 56
(1):94–112Mazzeo M (2002a) Competitive outcomes in product differentiated oligopoly. Rev Econ Stat 84:716–728Mazzeo M (2002b) Product choice and oligopoly market structure. Rand J Econ 33:221–242Muto S (2005) A retailer’s lament: influx of bank branches. Wall Street J Feb. 23: B1Pakes A, Porter J, Ho K, Ishii J (2007) Moment inequalities and their application. Harvard University,
MimeoSutton J (1991) Sunk costs and market structure. MIT Press, Cambridge, MATirole J (1988) The theory of industrial organization. MIT Press, Cambridge, MAVogt WB (1999) Detecting strategic behavior in technology adoption: the example of magnetic resonance
imaging. Heinz School, Carnegie Mellon University, MimeoWatson R (2009) Product variety and competition in the retail market for eyeglasses. J Ind Econ 57(2):217–
251White L (1976) Price regulation and quality rivalry in a profit-maximizing model: the case of bank
branching. J Money Credit Bank 8:97–106
J Financ Serv Res (2010) 38:1–21 21